Attached files
| file | filename |
|---|---|
| 8-K - FORM 8-K - Apollo Residential Mortgage, Inc. | d433999d8k.htm |
| EX-99.1 - EARNINGS RELEASE - Apollo Residential Mortgage, Inc. | d433999dex991.htm |
 November 7, 2012
Information is as of September 30, 2012 except as otherwise noted.
It should not be assumed that investments made in the future will
be profitable or will equal the performance of investments in this document.
Exhibit 99.2
Supplemental
Financial
Information
Presentation
Q3
2012 |
 2
Apollo Residential Mortgage, Inc.
2012 Third Quarter Earnings Call
November 7, 2012
Michael A. Commaroto
Chief Executive Officer
Stuart Rothstein
Chief Financial Officer
Keith Rosenbloom
Agency Portfolio Manager
Paul Mangione
Non-Agency Portfolio Manager
Teresa Covello
Controller of the Manager
Hilary Ginsberg
Investor Relations Manager
APOLLO RESIDENTIAL MORTGAGE, INC. (“AMTG”)
|
 3
APOLLO RESIDENTIAL MORTGAGE, INC. (“AMTG”)
Forward Looking Statements
We make forward-looking statements in this presentation and other
filings we make with the SEC within the meaning of Section 27A of
the Securities Act of 1933, as amended, and Section 21E of the
Securities Exchange Act of 1934, as amended, and such statements
are intended to be covered by the safe harbor provided by the same.
Forward-looking statements are subject to substantial risks and
uncertainties, many of which are difficult to predict and are generally
beyond our control. These forward-looking statements include
information about possible or assumed future results of our business,
financial condition, liquidity, results of operations, plans and
objectives, including information about our ability to generate
attractive returns while attempting to mitigate risk. When used in this
release, the words "believe," "expect,"
"anticipate," "estimate," "plan," "continue," "intend," "should," "may" or similar expressions,
are intended to identify forward-looking statements. Statements
regarding the following subjects, among others, may be forward-
looking: the return on equity; the yield on investments; the ability to
borrow to finance assets; and risks associated with investing in
real estate assets, including changes in business conditions and the
general economy. The forward-looking statements are based on our beliefs,
assumptions and expectations of our future performance, taking into account
all information currently available to us. Forward-looking
statements are not predictions of future events. These beliefs, assumptions
and expectations can change as a result of many possible events or
factors, not all of which are known to us. Some of these factors are
described in the Company's Annual Report on Form 10-K for the year
ended December 31, 2011 and other filings with the Securities
and Exchange Commission. If a change occurs, our business, financial
condition, liquidity and results of operations may vary
materially from those expressed in our forward-looking statements.
Any forward-looking statement speaks only as of the date on
which it is made. New risks and uncertainties arise over time, and it
is not possible for us to predict those events or how they may
affect us. Except as required by law, we are not obligated to, and do
not intend to, update or revise any forward-looking statements,
whether as a result of new information, future events or
otherwise. This presentation may contain statistics and other data that in some
cases has been obtained from or compiled from information made
available by third-party service providers.
|
 4
APOLLO RESIDENTIAL MORTGAGE, INC. (“AMTG”)
Discussion Topics
1. AMTG Q3 Results
2. Supplemental Financials |
 5
APOLLO RESIDENTIAL MORTGAGE, INC. (“AMTG”)
Third Quarter Highlights
Reported
Operating
Earnings
of
$16.3
million,
or
$0.67
per
common
share
for
the
third
quarter
of
2012
(1)
Reported book value per common share of $21.46, an increase of 9.2%
over book value per common share of $19.65 at June 30,
2012 Declared a dividend of $0.85 per common share for
stockholders of record as of September 28, 2012 –
15.3% annualized dividend yield based on AMTG’s closing price of
$22.19 on November 5, 2012 $4.23 billion residential mortgage
backed securities (“RMBS”) portfolio at September 30, 2012 consisted of
Agency RMBS with an estimated fair value of $3.67 billion and
non-Agency RMBS with an estimated fair value of $561
million –
2.8%
blended
net
interest
spread
and
18.4%
levered
asset
yield
at
September
30,
2012
(2)
Agency RMBS pass-through securities experienced prepayments at an
average one month constant prepayment rate (“CPR”) of
5.0% over the quarter ended September 30, 2012; Including Agency Interest Only Securities (“Agency
IOs”) and Agency Inverse Interest Only Securities (“Agency
IIOs”), the Agency RMBS portfolio experienced prepayments
at an average one month CPR of 5.2% Realized
net
gains
of
$13.9
million,
or
$0.57
per
share
from
the
sale
of
$674.3
million
of
RMBS
Completed a follow-on offering of 6.9 million 8.00% Series A
Cumulative Redeemable Perpetual Preferred Shares, raising net
proceeds of approximately $166.6 million (1)
Operating Earnings and Operating Earnings per common share are
non-GAAP financial measures. Operating Earnings and Operating Earnings per common share presented exclude, as applicable: (i) realized and unrealized gains and losses recognized through
earnings; (ii) non-cash equity compensation; (iii) one time events
pursuant to changes in GAAP; and (iv) certain other non-cash charges. Please see slide 18 for a reconciliation of Operating Earnings and Operating Earnings per common share to GAAP net
income and GAAP net income per common share.
(2) Levered Asset Yield calculated as Net Interest Spread multiplied by
the Company’s leverage (debt/equity) multiple, plus the weighted average unlevered yield on RMBS. |
 6
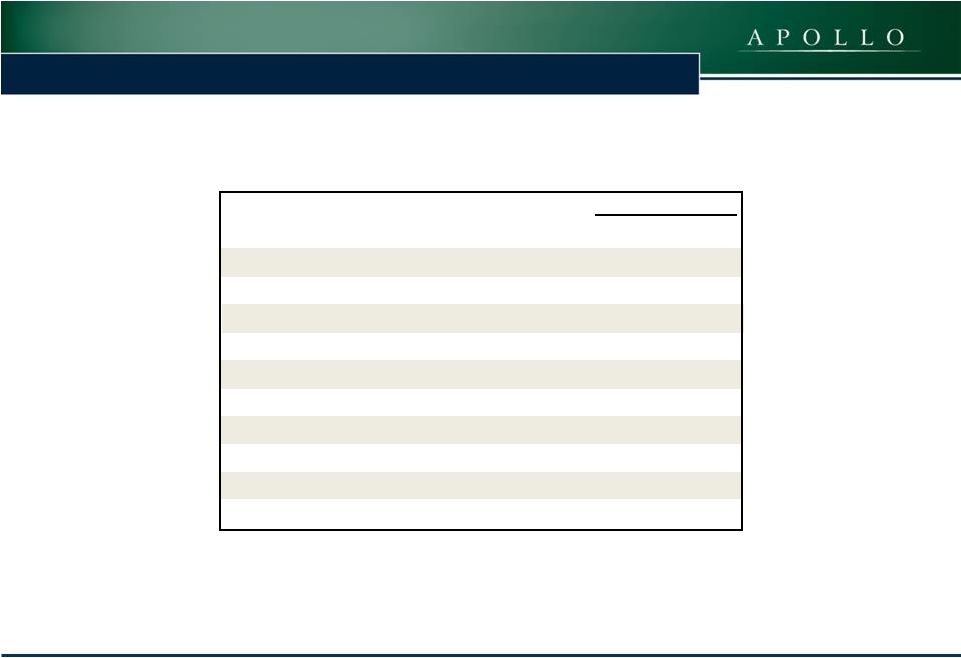
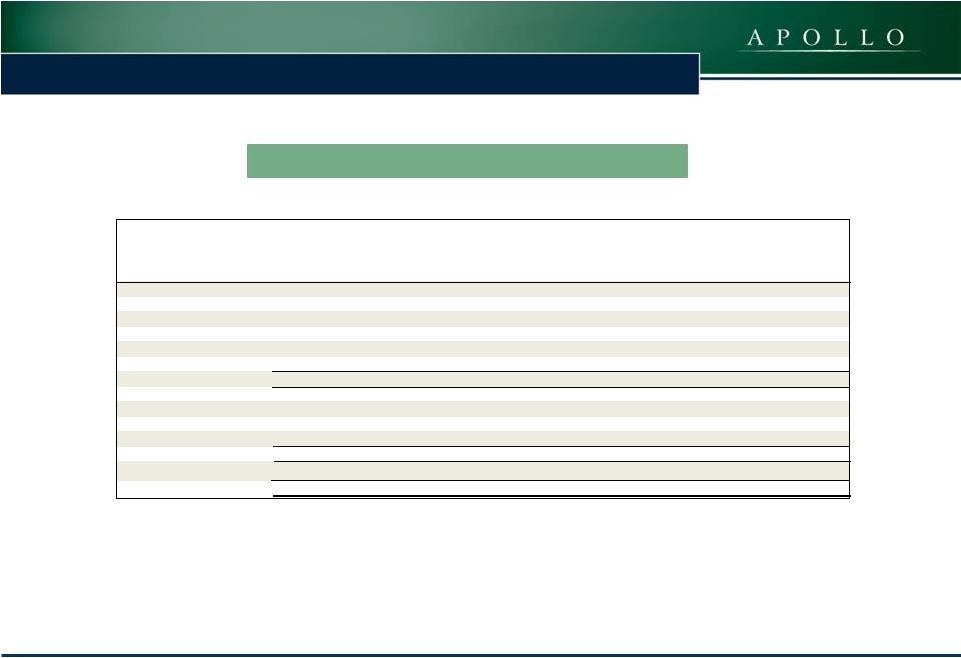
APOLLO RESIDENTIAL MORTGAGE, INC. (“AMTG”)
Financial Summary
($ amounts in thousands except per share data)
Q3 2012
Interest Income
$26,438
Interest Expense
(4,289)
Net Interest Income
$22,149
Operating Earnings
(1)
$16,307
Weighted Average Fully Diluted Shares Outstanding
24,214
Operating Earnings per Common Share
(1)
$0.67
Leverage (Debt / Equity)
5.4x
Annualized Return on Average Assets
(2)
2.1%
Annualized Return on Average Equity
(2)
13.0%
(2)
Operating Earnings and Operating Earnings per share are non-GAAP
financial measures. Operating Earnings and Operating Earnings per share presented exclude, as applicable: (i) realized and unrealized gains and losses recognized
through earnings; (ii) non-cash equity compensation; (iii) one time
events pursuant to changes in GAAP; and (iv) certain other non-cash charges. Please see slide 18 for a reconciliation of Operating Earnings and Operating Earnings per
share to GAAP net income and GAAP net income per share.
Return on Assets is calculated as annualized Operating Earnings for the
quarter as a percentage of average assets. Return on Equity is calculated as annualized Operating Earnings for the quarter as a percentage of average equity.
(1) |
 7
APOLLO RESIDENTIAL MORTGAGE, INC. (“AMTG”)
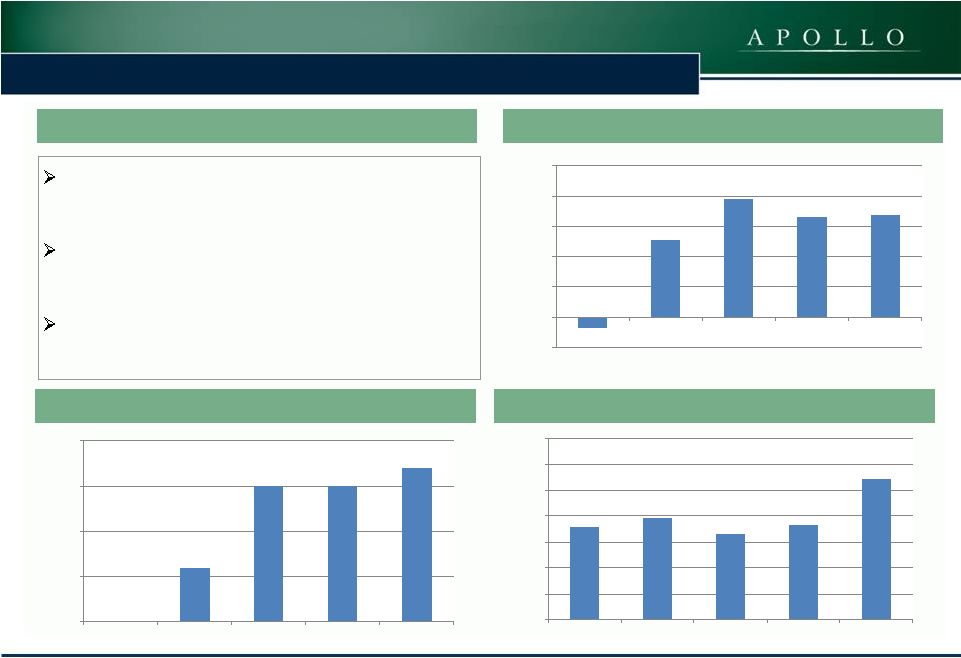
Financial Summary
Operating Earnings per Common Share
(1)
Book Value per Common Share
Dividend per Common Share
(1)
Operating Earnings and Operating Earnings per common share are
non-GAAP financial measures. Operating Earnings and Operating Earnings per common share presented exclude, as applicable: (i) realized and unrealized gains and losses recognized
through earnings; (ii) non-cash equity compensation; (iii) one time
events pursuant to changes in GAAP; and (iv) certain other non-cash charges. Please see slide 18 for a reconciliation of Operating Earnings and Operating Earnings per common share to
GAAP net income and GAAP net income per common share.
(2)
Pro-forma book value per common share at March 31, 2012 including
the impact of the April 20, 2012 equity offering. Book value per common share at March 31, 2012 was $21.09.
Financial Highlights
1.5%
increase
in
Operating
Earnings
(1)
per
common
share on a sequential quarter basis
9.2% increase in book value per common share on a
sequential quarter basis
13.3% increase in dividend per common share on a
sequential quarter basis
$0.30
$0.75
$0.75
$0.85
$0.00
$0.25
$0.50
$0.75
$1.00
Q3 2011
Q4 2011
Q1 2012
Q2 2012
Q3 2012
($0.07)
$0.51
$0.78
$0.66
$0.67
($0.20)
$0.00
$0.20
$0.40
$0.60
$0.80
$1.00
Q3 2011
Q4 2011
Q1 2012
Q2 2012
Q32012
$19.58
$19.92
$19.31
$19.65
$21.46
$16.00
$17.00
$18.00
$19.00
$20.00
$21.00
$22.00
$23.00
Q3 2011
Q4 2011
Q1 2012
Q2 2012
Q3 2012
(2) |
 8
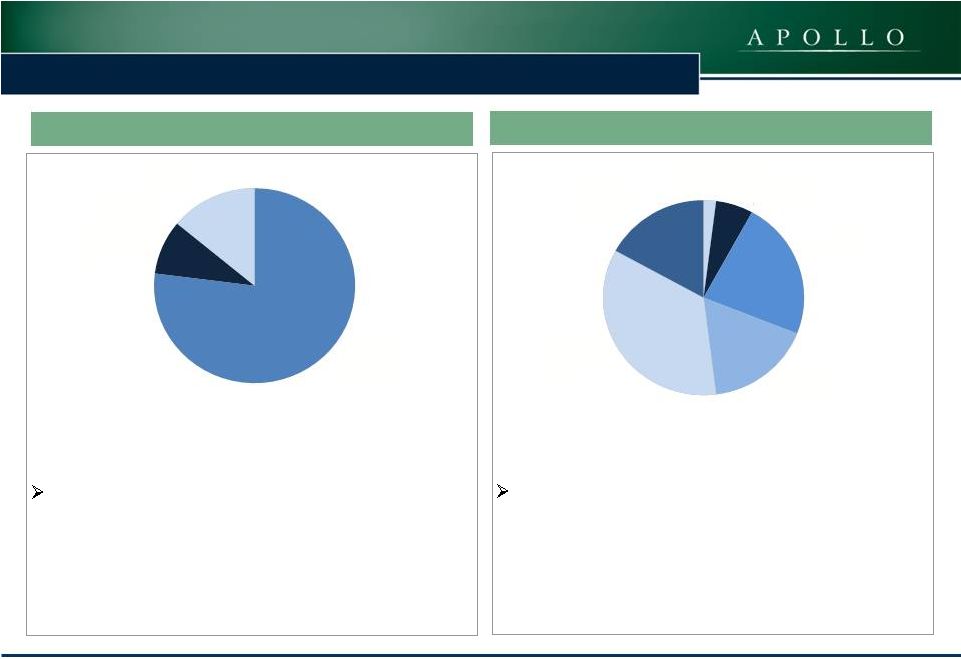
APOLLO RESIDENTIAL MORTGAGE, INC. (“AMTG”)
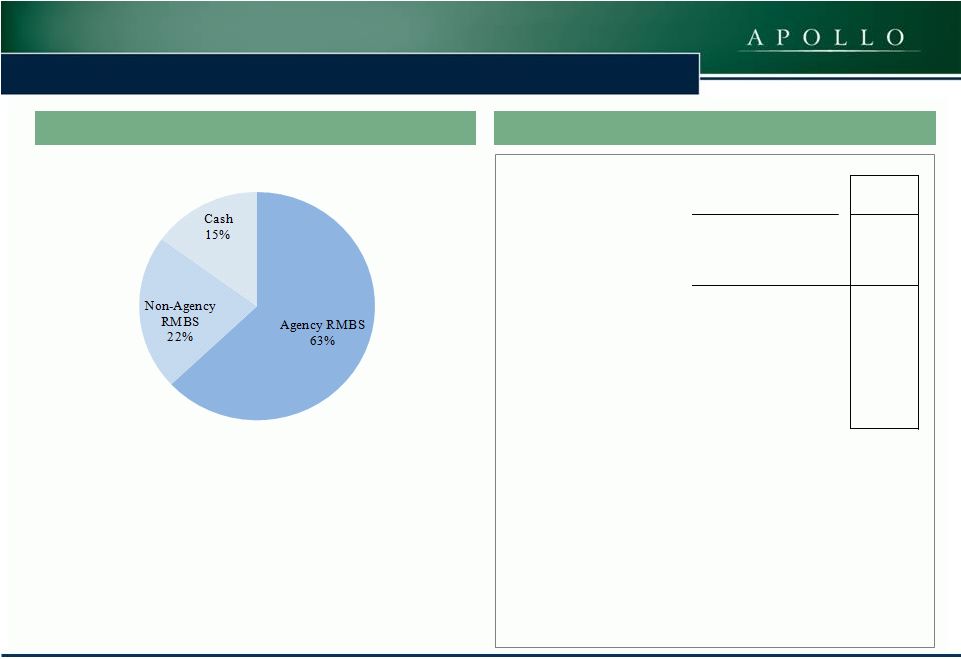
Portfolio Summary and Net Interest Spread
Allocation of Portfolio Equity at 9/30/2012
(1)
Net Interest Spread at 9/30/2012
(1)
Percentages reflect amount of equity allocated to Agency and
non-Agency RMBS, net of associated assets and liabilities (the fair value on Swaps are allocated to Agency RMBS). Cash and other net, represents cash and other assets and liabilities not
specifically allocable to Agency or non-Agency RMBS.
(2)
Debt/Equity ratios are adjusted for cash held to meet margin calls. Cash
and certain liabilities are allocated to portfolio asset class based on proportional breakdown of equity allocated to Agency and non-Agency RMBS portfolios.
(3)
Levered Asset Yield calculated as Net Interest Spread multiplied
by the Company’s leverage (debt/equity) multiple, plus the
weighted average unlevered yield on RMBS. Agency
Non-
Agency
Blended
Asset Yield
2.7%
7.9%
3.4%
Interest Expense
0.4%
2.0%
0.6%
Net Interest Spread
2.3%
5.9%
2.8%
Debt / Equity
(2)
6.5x
2.2x
5.4x
Levered Asset Yield
(3)
17.6%
20.8%
18.4% |
 9
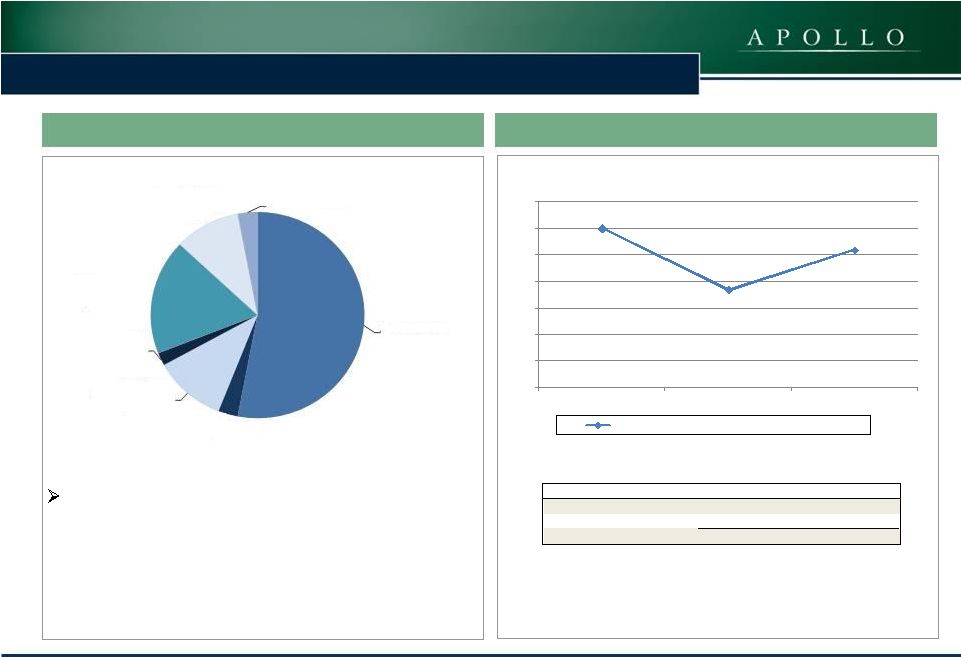
Agency Portfolio
Agency portfolio continues to focus on securities
with prepayment mitigation attributes such as low
loan balance and those that have already accessed
the Home Affordable Refinance Program (“HARP”).
Q3 2012 Agency Portfolio
Constant Prepayment Rates
(1)
Other includes HARP/MHA 15 Year Pass-Throughs, Interest Only
Securities and Inverse Interest Only Securities. 6.0%
3.7%
5.2%
0.0%
1.0%
2.0%
3.0%
4.0%
5.0%
6.0%
7.0%
Q1 2012
Q2 2012
Q3 2012
Total Agency Portfolio average one month CPR
(1)
Loan Balance 30
Year Pass-Throughs
53%
Other
3%
Loan Balance 15
Year Pass-Throughs
11%
New Production 20
Year Pass-Throughs
2%
HARP / MHA /
High LTV 30 Year
Pass-Throughs
18%
Low Credit 30 Year
Pass-Throughs
10%
New Production 30
Year Pass-Throughs
3%
APOLLO RESIDENTIAL MORTGAGE, INC. (“AMTG”)
($ in thousands)
Estimated Fair Value
Q3 2012 CPR
Agency Fixed Rate
3,621,669
$
5.0
%
Agency IOs and Agency IIOs
51,755
14.9
Total
3,673,424
$
5.2
% |
 10
APOLLO RESIDENTIAL MORTGAGE, INC. (“AMTG”)
Agency Securities as of September 30, 2012
Agency Portfolio Composition Summary
(1)
Includes unsettled purchases with an aggregate cost of $131,680 and
estimated fair value of $133,494 at September 30, 2012. (2)
Amortized cost is reduced by unrealized losses that are classified as
other-than-temporary impairments. The Company recognized other-than-temporary impairments on $553 and $3,308 for the three and nine months ended September 30, 2012
respectively.
(3)
Weighted average yield at the date presented incorporates estimates for
future prepayment assumptions on all RMBS and loss assumptions on non-Agency RMBS.
(4)
Agency IOs and Agency IIOs have no principal balance and bear interest
on a notional balance. The notional balance is used solely to determine interest distributions on interest-only class of securities.
($ in thousands)
Principal Balance
Unamortized
Premium
(Discount)
Amortized Cost
(1)(2)
Estimated Fair
Value
(1)
Net Weighted
Average
Coupon
Weighted
Average
Yield
(3)
Agency RMBS:
30 Year Mortgages
Coupon Rate
3.5%
1,159,596
$
75,686
$
1,235,282
$
1,247,005
$
3.5
%
2.6
%
4.0%
1,361,212
110,496
1,471,708
1,492,310
4.0
2.7
4.5% and 5.0%
281,553
18,361
299,914
312,434
4.5
3.3
Total 30 Year Mortgages
2,802,361
204,543
3,006,904
3,051,749
3.8
2.7
15-20 Year Mortgages
Coupon Rate
3.0%
183,585
8,339
191,924
195,665
3.0
2.0
3.5%
346,865
21,033
367,898
374,255
3.5
2.3
Total 15-20 Year Mortgages
530,450
29,372
559,822
569,920
3.3
2.2
Agency IOs and IIOs
(4)
-
-
52,200
51,755
5.7
12.0
Total Agency RMBS
3,332,811
$
233,915
$
3,618,926
$
3,673,424
$
3.9
%
2.7
% |
 11
Non-Agency portfolio continues to focus on seasoned,
sub-prime assets with significant credit enhancement.
In addition, this quarter a portion of the non-Agency
portfolio
was
rotated
into
both
Alt-A
and
pay-option
adjustable rate mortgages.
Q3 2012 Non-Agency Portfolio
The vintage of the non-Agency Portfolio is evenly
distributed between RMBS originated during 1999
through 2005 and RMBS originated during 2006
through 2007.
Q3 2012 Non-Agency Portfolio Vintage
Subprime
77%
Pay-
option
ARM
9%
Alt-
14%
A
1999
2002
2%
2003
6%
2004
23%
2005
2006
2007
-
17%
35%
17%
Non-Agency Portfolio
APOLLO RESIDENTIAL MORTGAGE, INC. (“AMTG”)
|
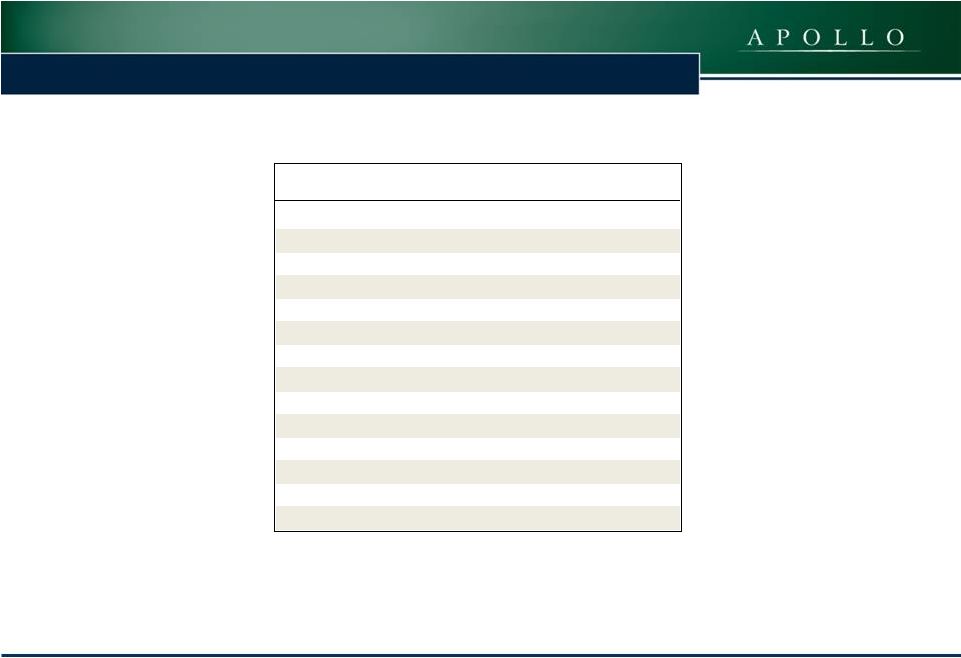 12
(1) Credit enhancement is expressed as a percentage of all
outstanding mortgage loan collateral. The Company's RMBS may incur losses if credit enhancement is reduced to zero.
(2) Information is based on loans for individual groups owned by
the Company. Amounts presented reflect the weighted average monthly performance for the three months ended September 30, 2012.
09/30/12
Holdings
Portfolio Characteristics
Carrying Value ($ in thousands)
$561,054
Amortized Cost to Par Value
66%
Net Weighted Average Coupon
1.19%
Collateral Attributes
Weighted Average Loan Age (months)
86.0
Weighted Average Original Loan-to-Value
79.3%
Weighted Average Original FICO Credit Score
642
Current Performance
60+ Day Delinquencies
36.7%
Average Credit Enhancement
(1)
27.5%
3 Month CPR
(2)
3.4%
Non-Agency Securities as of September 30, 2012
APOLLO RESIDENTIAL MORTGAGE, INC. (“AMTG”)
|
 13
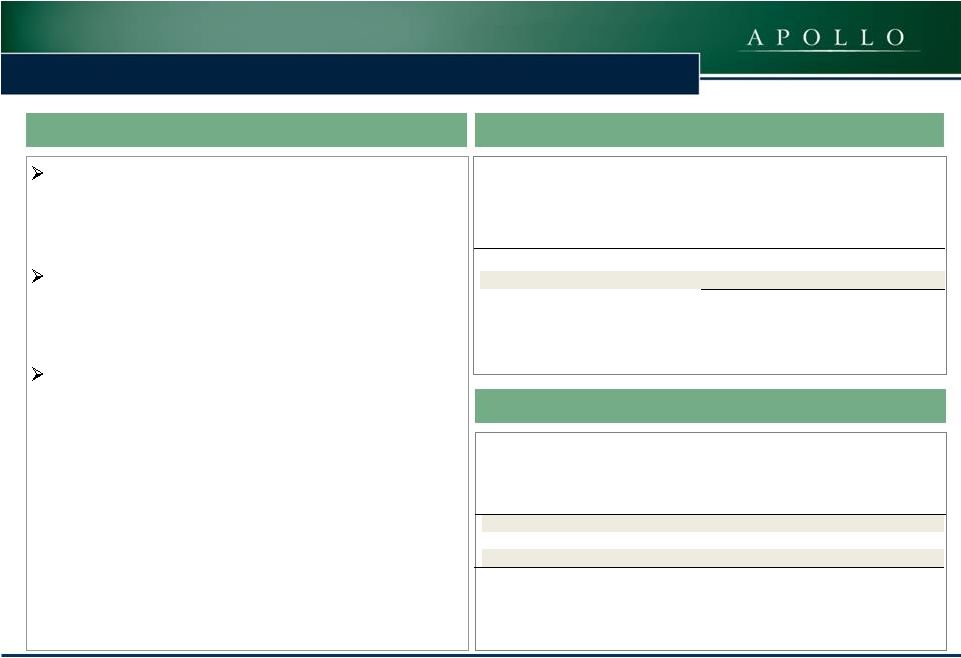
APOLLO RESIDENTIAL MORTGAGE, INC. (“AMTG”)
Financing Overview
Agency portfolio financed with repurchase agreement
borrowings employing leverage of approximately 6 to
10 times
Non-Agency portfolio financed with repurchase
agreement borrowings employing leverage of
approximately 1 to 3 times
Interest rate risk associated with Agency RMBS
borrowings mitigated primarily with 5-year interest
rate swaps
Financing / Hedging Summary
Financing
Interest Rate Swaps
Collateral ($ in thousands)
Repurchase
Agreement
Borrowing
Weighted
Average
Borrowing Rate
Weighted
Average
Remaining
Maturity
(days)
Agency RMBS
$3,314,990
0.4%
51
Non-Agency RMBS
394,694
2.0%
86
Total
$3,709,684
0.6%
55
Term to Maturity ($ in thousands)
Notional
Amount
Average Fixed
Pay Rate
Average
Maturity
(Years)
Greater than 1 year and less than 3 years
-
$
-%
-
Greater than 3 years and less than 5 years
1,245,000
1.1
4.7
Greater than 5 years
255,000
1.9
9.9
Total
1,500,000
$
1.2%
5.6 |
 14
Counterparty Summary
(1)
Represents the amount of cash and/or securities pledged as collateral to
each counterparty less the aggregate of repurchase agreement borrowings and unrealized loss on Swaps for each counterparty, net of collateral pledged.
(2)
Includes foreign based counterparties as well as U.S. domiciled
subsidiaries of such counterparties, as such transactions are generally entered into with a U.S. domiciled subsidiary of such counterparties.
($ in thousands)
Number of
Counterparties
Repurchase
Agreement
Borrowings
Swaps at Fair
Value
Exposure
(1)
Exposure as
Percentage of
Total Assets
North America
United States
8
1,870,166
$
(18,997)
$
161,938
$
3.5
%
Canada
(2)
1
115,946
-
52,729
1.1
Total North America
9
1,986,112
(18,997)
214,667
4.6
Europe
(2)
Germany
1
275,554
$
-
$
20,799
$
0.5
%
Switzerland
2
368,165
-
29,565
0.6
United Kingdom
2
513,678
(7,367)
34,083
0.7
Total Europe
5
1,157,397
(7,367)
84,447
1.8
Asia
(2)
Japan
2
566,175
$
(1,074)
$
35,169
$
0.8
%
Total Asia
2
566,175
(1,074)
35,169
0.8
Total Counterparty Exposure
16
3,709,684
$
(27,438)
$
334,283
$
7.2
%
APOLLO RESIDENTIAL MORTGAGE, INC. (“AMTG”)
|
 15
1. AMTG Q3 Results
2. Supplemental Financials
Discussion Topics
APOLLO RESIDENTIAL MORTGAGE, INC. (“AMTG”)
|
 16
APOLLO RESIDENTIAL MORTGAGE, INC. (“AMTG”)
Income Statement
July 27, 2011
(commencement of
Three months ended
Nine months ended
operations) through
(in thousands—except share and per share data)
September 30,
September 30,
September 30,
(unaudited)
2012
2012
2011
Net Interest Income:
Interest income
26,438
$
60,791
$
1,555
$
Interest expense
(4,289)
(8,521)
(143)
Net Interest Income
22,149
52,270
1,412
Other Income (Loss):
Realized gain on sale of RMBS, net
13,861
32,244
335
$
Unrealized gain (loss) on RMBS, net
54,913
75,461
(1,283)
Loss on derivative instruments (includes $9,831, $24,192 and $108 of
unrealized losses, respectively)
(16,653)
(33,486)
(223)
Interest income on cash balances
16
25
-
Other Income (Loss), net
52,137
74,244
(1,171)
Operating Expenses:
General and administrative (includes $105, $274 and $70 non-cash
stock based compensation, respectively)
(1,858)
(5,211)
(1,578)
Management fees -
related party
(2,031)
(4,386)
(549)
Total Operating Expenses
(3,889)
(9,597)
(2,127)
Net Income/(Loss)
70,397
116,917
(1,886)
Net Income/(Loss) Available/(Allocable) to Common Stock and
Participating Securities
70,397
$
116,917
$
(1,886)
$
Earnings
(Loss)
per
Common
Share
-
Basic
and
Diluted
2.91
$
6.28
$
(0.18)
$
Dividend Declared
per Share of Common Stock 0.85
$
2.35
$
-
$
|
  17
APOLLO RESIDENTIAL MORTGAGE, INC. (“AMTG”)
Balance Sheet
(in thousands—except share and per share data)
September 30, 2012
December 31, 2011
Assets:
(unaudited)
Cash
131,552
$
44,407
$
Restricted cash
58,551
10,402
RMBS, at
fair value ($4,017,679 and $1,167,487 pledged as collateral, respectively)
4,234,478
1,240,472
Investment related
receivable 154,277
116,678
Interest
receivable 11,719
3,908
Deferred financing costs, net
435
455
Swaps, at fair value
-
235
Other assets
856
370
Total Assets
4,591,868
$
1,416,927
$
Liabilities and Stockholders' Equity
Liabilities:
Borrowings under repurchase agreements
3,709,684
$
1,079,995
$
Investment related payable
132,085
121,144
Accrued interest
payable 3,420
1,123
Swaps, at fair value
27,438
3,481
Accounts payable and accrued expenses
2,053
1,534
Payable to related party
5,182
1,974
Dividends payable
20,628
3,090
Total Liabilities
3,900,490
1,212,341
Stockholders' Equity:
Preferred stock, $0.01 par value, 50,000,000 shares authorized and
6,900,000 and 0 shares issued and outstanding, respectively
($172,500 aggregate liquidation preference at September 30, 2012
69
-
Common stock, $0.01 par value, 450,000,000 shares authorized,
24,184,410 and 10,271,562 shares issued and outstanding
respectively 242
103
Additional paid-in-capital
619,229
203,101
Retained earnings
71,838
1,382
Total Stockholders' Equity
691,378
204,586
Total Liabilities and
Stockholders' Equity 4,591,868
$
1,416,927
$
|
 18
APOLLO RESIDENTIAL MORTGAGE, INC. (“AMTG”)
Operating Earnings Reconciliation
(in thousands—except share and per share data)
September 30, 2012
Earnings Per Share
(Diluted)
September 30, 2012
Earnings Per Share
(Diluted)
Operating Earnings:
Net income -
GAAP
$70,397
$2.91
$116,917
$6.28
Adjustments:
Non-cash stock-based compensation expense
105
-
274
0.01
Unrealized (gain)/loss on RMBS, net
(54,913)
(2.27)
(75,461)
(4.05)
Unrealized (gain)/loss on derivatives, net
9,831
0.40
24,192
1.30
Realized gain on sale of RMBS, net
(13,861)
(0.57)
(32,244)
(1.73)
Realized loss on Swap terminations
4,747
0.20
4,709
0.25
Total adjustments to net income:
(54,091)
(2.24)
(78,530)
(4.22)
Operating Earnings
$16,306
$0.67
$38,387
$2.06
Basic and diluted weighted average common shares outstanding
24,214,410
18,628,087
Three Months Ended
Nine Months Ended |
 19
Contact Information
Hilary Ginsberg
Investor Relations Manager
212-822-0767
APOLLO RESIDENTIAL MORTGAGE, INC. (“AMTG”)
|