Attached files
| file | filename |
|---|---|
| EX-99.1 - EXHIBIT 99.1 - MSCI Inc. | a50466759ex99_1.htm |
| 8-K - MSCI INC. 8-K - MSCI Inc. | a50466759.htm |
Exhibit 99.2
November 6, 2012 Third Quarter 2012 Earnings Presentation Forward‐Looking Statements – Safe Harbor Statement
This presentation may contain forward‐looking statements within the meaning of the Private Securities Litigation Reform Act of 1995. You should not place undue reliance on forward‐looking statements because they involve known and unknown risks, uncertainties and other factors that are, in some cases, beyond our control and that could materially affect actual results, levels of activity, performance or achievements. For a discussion of risk and uncertainties that could materially affect actual results, levels of activity, performance or achievements, please see the Company’s Annual Report on Form 10‐K for the fiscal year ended December 31, 2011 and its other reports filed with the SEC. The forward‐looking statements included in this presentation represent the Company’s view as of the date of the presentation. The Company assumes no obligation to publicly update or revise these forward‐looking statements for any reason, whether as a result of new information, future events, or otherwise. Percentage changes and totals in this Presentation may not sum due to rounding. Percentage changes are referenced to the comparable period in 2011, unless otherwise noted. Total sales equals recurring subscription sales and non‐recurring salesis presentatio
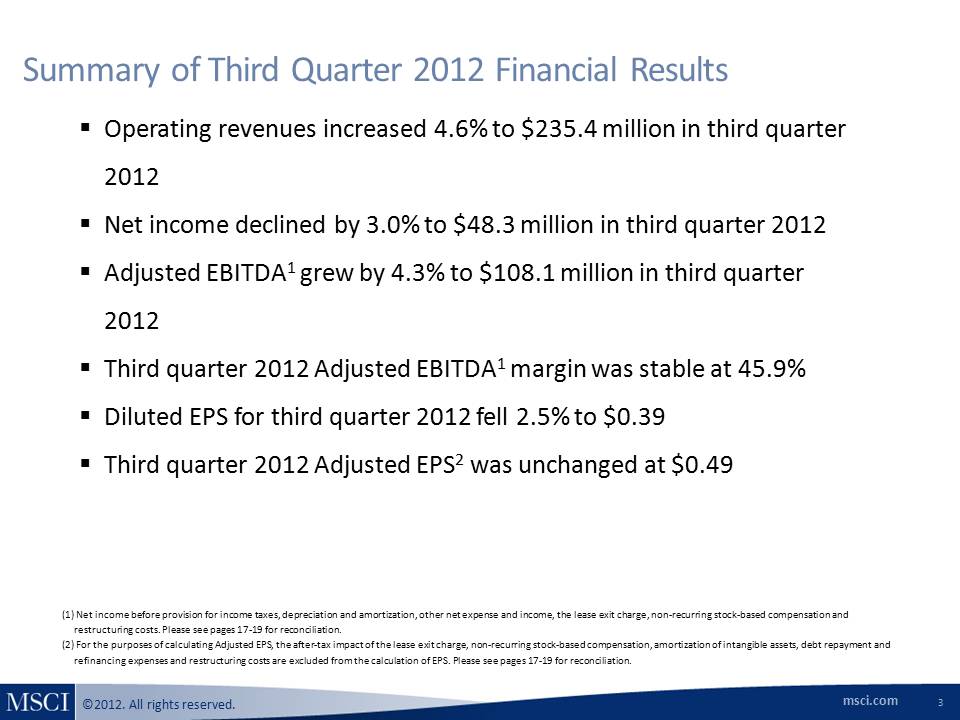
Summary of Third Quarter 2012 Financial Results Operating revenues increased 4.6% to $235.4 million in third quarter 2012 Net income declined by 3.0% to $48.3 million in third quarter 2012 Adjusted EBITDA1 grew by 4.3% to $108.1 million in third quarter 2012 Third quarter 2012 Adjusted EBITDA1 margin was stable at 45.9% Diluted EPS for third quarter 2012 fell 2.5% to $0.39 Third quarter 2012 Adjusted EPS2 was unchanged at $0.49 (1) Net income before provision for income taxes, depreciation and amortization, other net expense and income, the lease exit charge, non‐recurring stock‐based compensation and restructuring costs. Please see pages 17‐19 for reconciliation.(2) For the purposes of calculating Adjusted EPS, the after‐tax impact of the lease exit charge, non‐recurring stock‐based compensation, amortization of intangible assets, debt repayment and refinancing expenses and restructuring costs are excluded from the calculation of EPS. Please see pages 17‐19 for reconciliation.
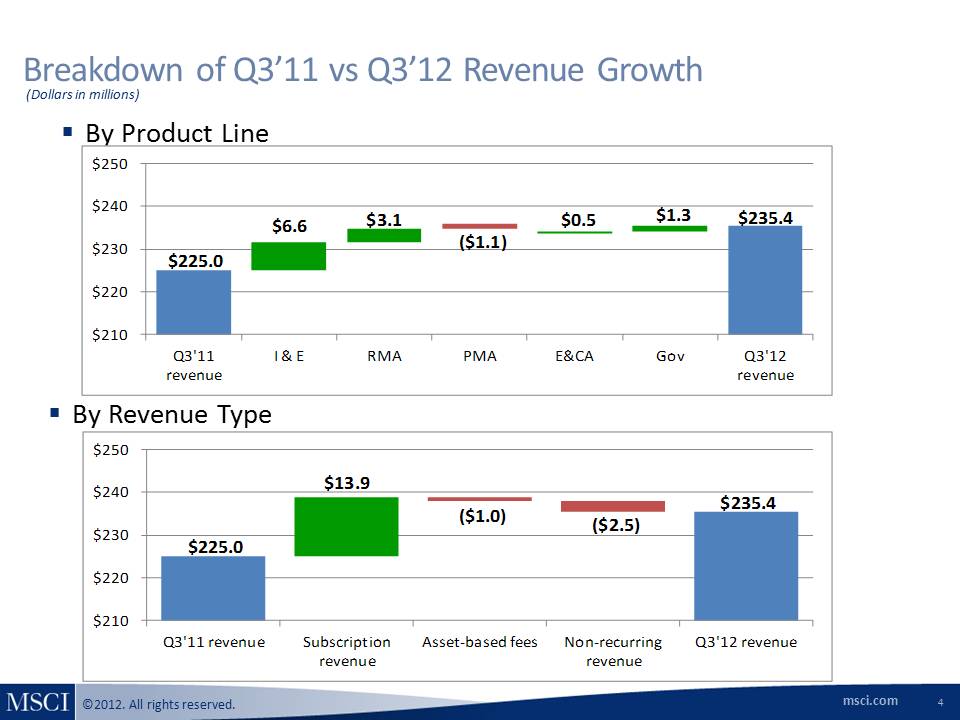
Breakdown of Q3’11 vs Q3’12 Revenue Growth By Product Line By Revenue Type $225.0 $235.4 $6.6 $3.1 ($1.1) $0.5 $1.3 $210 $220 $230 $240 $250 Q3'11 revenue I & E RMA PMA E&CA Gov Q3'12 revenue $225.0 $235.4 $13.9 $210 $220 $230 $240 $250 Q3'11 revenue Subscription revenue Asset‐based fees Non‐recurring revenue Q3'12 revenue ($2.5) ($1.0)
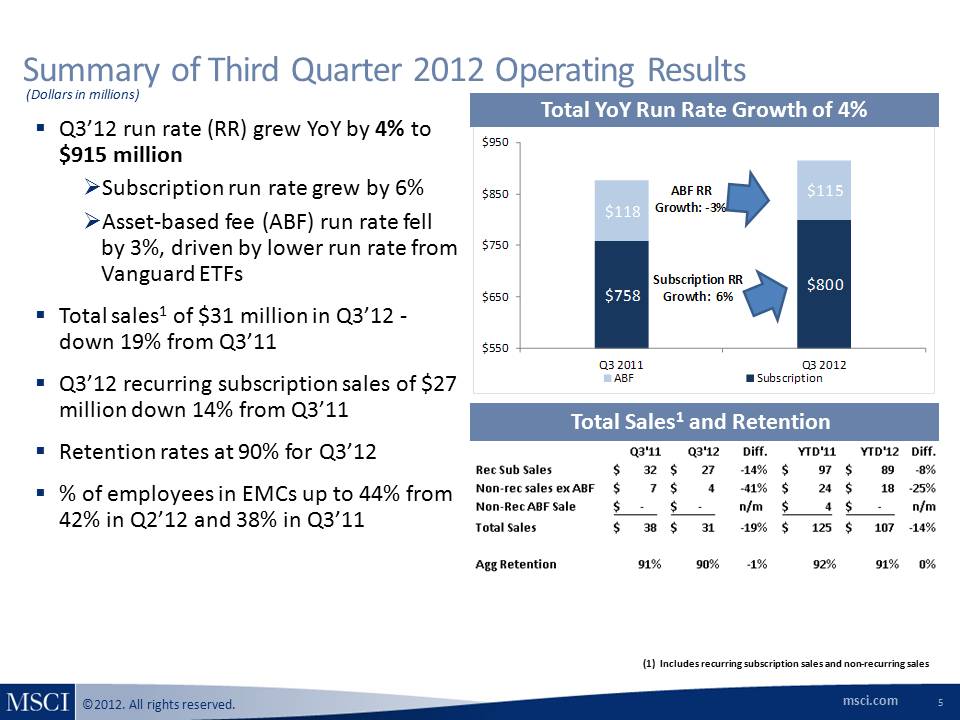
(Dollars in millions) $758 $800 $118 $115 $550 $650 $750 $850 $950 Q3 2011 Q3 2012 ABF Subscription ABF RR Growth: ‐3% Subscription RR Growth: 6% Summary of Third Quarter 2012 Operating Results Total YoY Run Rate Growth of 4% Total Sales1 and Retention Q3’12 run rate (RR) grew YoY by 4% to $915 million Subscription run rate grew by 6% Asset‐based fee (ABF) run rate fell by 3%, driven by lower run rate from Vanguard ETFs Total sales1 of $31 million in Q3’12 ‐ down 19% from Q3’11 Q3’12 recurring subscription sales of $27 million down 14% from Q3’11 Retention rates at 90% for Q3’12 % of employees in EMCs up to 44% from 42% in Q2’12 and 38% in Q3’11 (1) Includes recurring subscription sales and non‐recurring sales
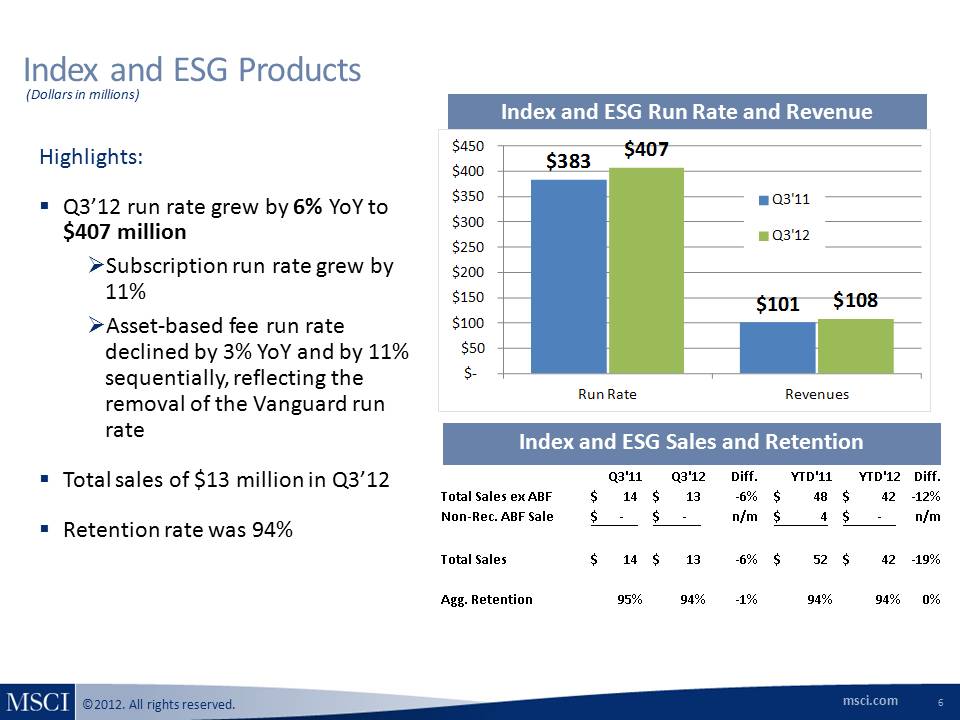
(Dollars in millions) Index and ESG Products Index and ESG Run Rate and Revenue Highlights: Q3’12 run rate grew by 6% YoY to $407 million Subscription run rate grew by 11% Asset‐based fee run rate declined by 3% YoY and by 11% sequentially, reflecting the removal of the anguard run rate Total sales of $13 million in Q3’12 Retention rate was 94% Index and ESG Sales and Retention $383 $101 $407 $108 $‐ $50 $100 $150 $200 $250 $300 $350 $400 $450 Run Rate Revenues Q3'11 Q3'12
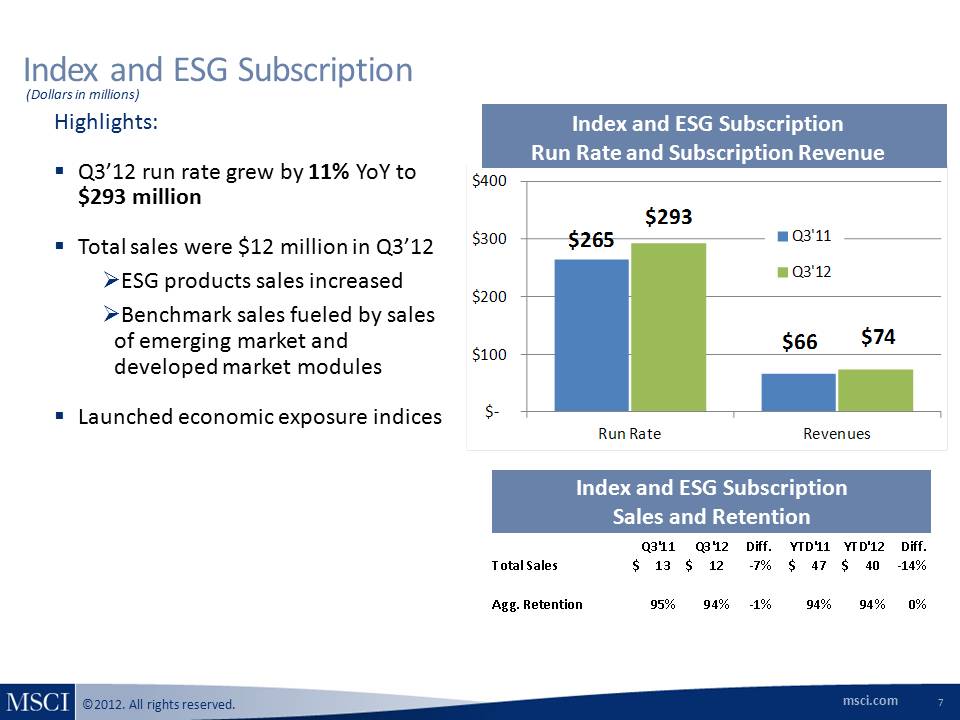
(Dollars in millions) $265 $66 $293 $74 $‐ $100 $200 $300 $400 Run Rate Revenues Q3'11 Q3'12 Index and ESG Subscription Index and ESG Subscription Run Rate and Subscription Revenue Highlights: Q3’12 run rate grew by 11% YoY to $293 million Total sales were $12 million in Q3’12 ESG products sales increased Benchmark sales fueled by sales of emerging market and developed market modules Launched economic exposure indices Index and ESG Subscription Sales and Retention Q3'11 Q3'12 Diff. YTD'11 YTD'12 Diff. Total Sales 13 $ 12 $ ‐7% 47 $ 40 $ ‐14% Agg. Retention 95% 94% ‐1% 94% 94% 0%
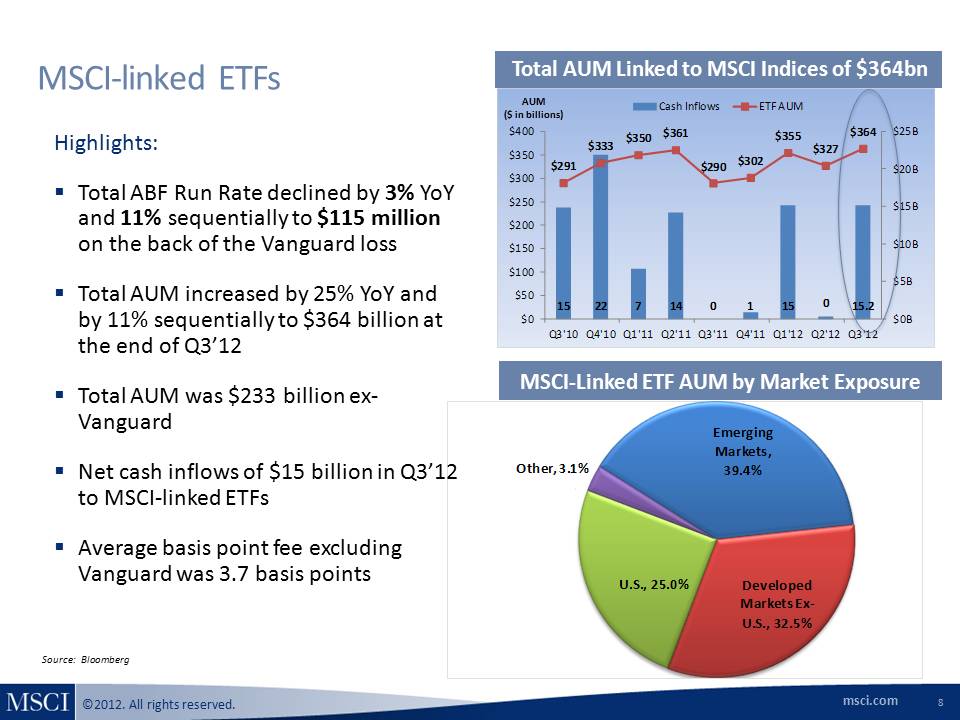
(Dollars in millions) 15 22 7 14 0 1 15 0 15.2 $291 $333 $350 $361 $290 $302 $355 $327 $364 $0B $5B $10B $15B $20B $25B $0 $50 $100 $150 $200 $250 $300 $350 $400 Q3'10 Q4'10 Q1'11 Q2'11 Q3'11 Q4'11 Q1'12 Q2'12 Q3'12 Cash Inflows ETF AUM MSCI‐linked ETFs Total AUM Linked to MSCI Indices of $364bn Source: Bloomberg MSCI‐Linked ETF AUM by Market Exposure Highlights: Total ABF Run Rate declined by 3% YoYand 11% sequentially to $115 million on the back of the Vanguard loss Total AUM increased by 25% YoY and by 11% sequentially to $364 billion at the end of Q3’12 Total AUM was $233 billion ex‐Vanguard Net cash inflows of $15 billion in Q3’12 to MSCI‐linked ETFs Average basis point fee excludingVanguard was 3.7 basis points AUM ($ in billions)
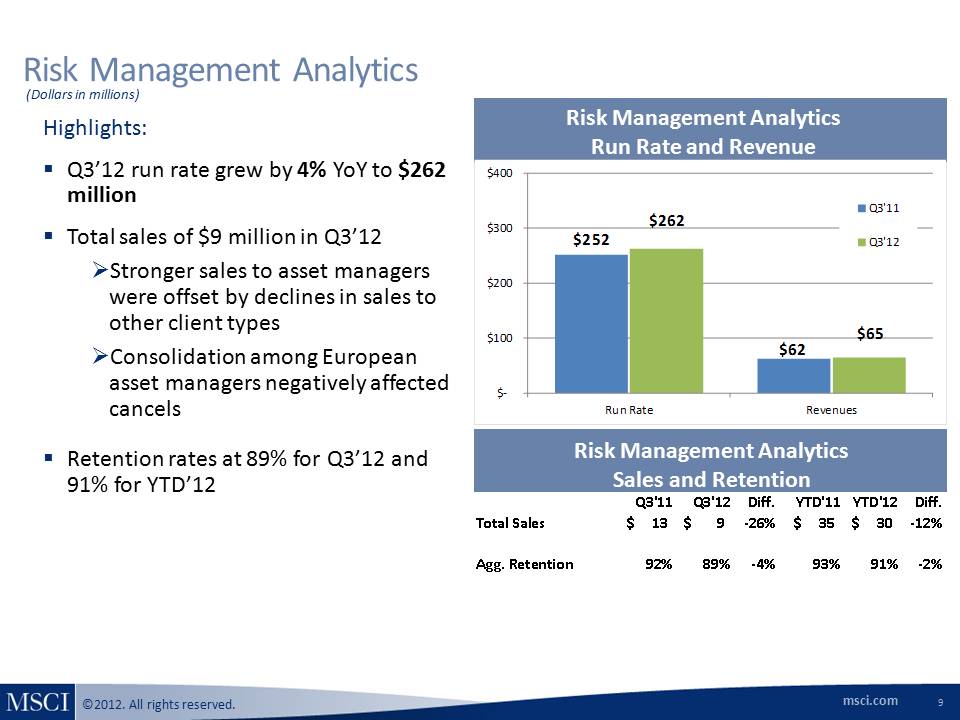
Risk Management Analytics Run Rate and Revenue Highlights: Q3’12 run rate grew by 4% YoY to $262 million Total sales of $9 million in Q3’12 Stronger sales to asset managers were offset by declines in sales to other client types Consolidation among European asset managers negatively affected cancels Retention rates at 89% for Q3’12 and 91% for YTD’12 Risk Management Analytics Sales and Retention $252 $62 $262 $65 $‐ $100 $200 $300 $400 Run Rate Revenues Q3'11 Q3'12 Q3'11 Q3'12 Diff. YTD'11 YTD'12 Diff. Total Sales 13 $ 9 $ ‐26% 35 $ 30 $ ‐12% Agg. Retention 92% 89% ‐4% 93% 91% ‐2%
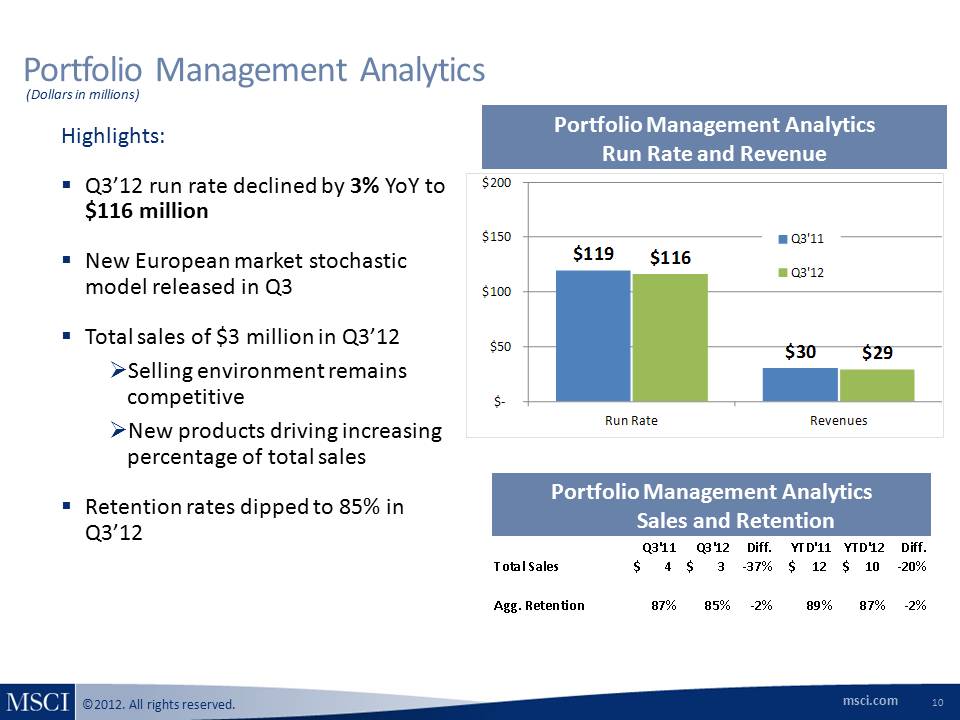
(Dollars in millions) Portfolio Management Analytics Portfolio Management Analytics Run Rate and Revenue Highlights: Q3’12 run rate declined by 3% YoY to $116 million New European market stochastic model released in Q3 Total sales of $3 million in Q3’12 Selling environment remains competitive New products driving increasing percentage of total sales Retention rates dipped to 85% in Q3’12 Portfolio Management Analytics Sales and Retention $119 $30 $116 $29 $‐ $50 $100 $150 $200 Run Rate Revenues Q3'11 Q3'12 Q3'11 Q3'12 Diff. YTD'11 YTD'12 Diff. Total Sales 4 $ 3 $ ‐37% 12 $ 10 $ ‐20% Agg. Retention 87% 85% ‐2% 89% 87% ‐2%
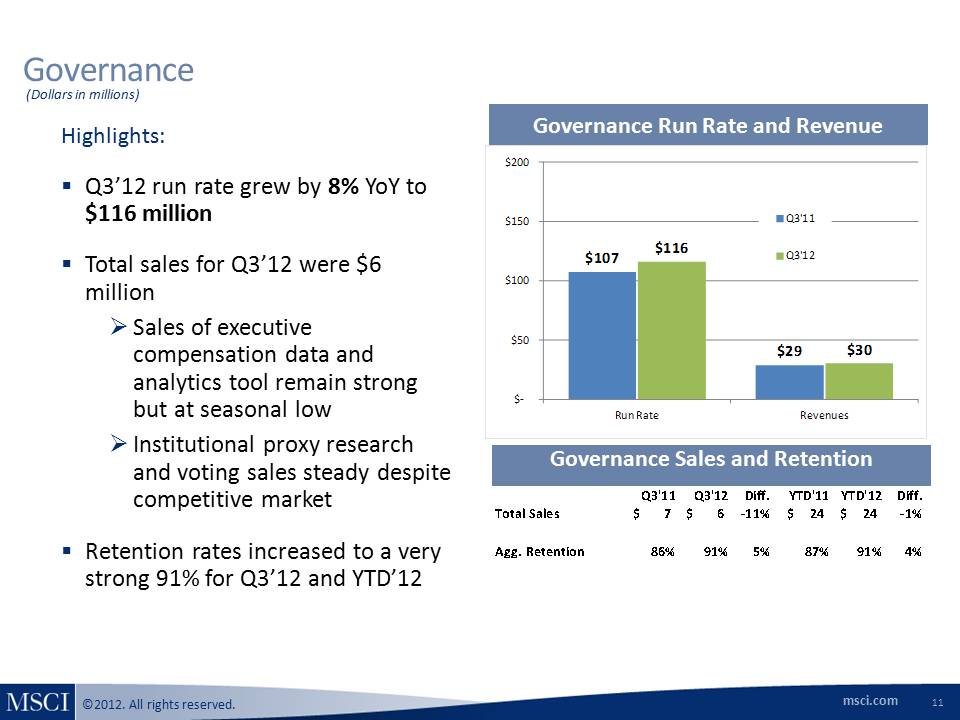
(Dollars in millions) Governance Governance Run Rate and Revenue Highlights: Q3’12 run rate grew by 8% YoY to $116 million Total sales for Q3’12 were $6 million Sales of executive compensation data and analytics tool remain strong but at seasonal low Institutional proxy research and voting sales steady despite competitive market Retention rates increased to a very strong 91% for Q3’12 and YTD’12 11 Governance Sales and Retention $107 $29 $116 $30 $‐ $50 $100 $150 $200 Run Rate Revenues Q3'11 Q3'12 Q3'11 Q3'12 Diff. YTD'11 YTD'12 Diff. Total Sales 7 $ 6 $ ‐11% 24 $ 24 $ ‐1% Agg. Retention 86% 91% 5% 87% 91% 4%
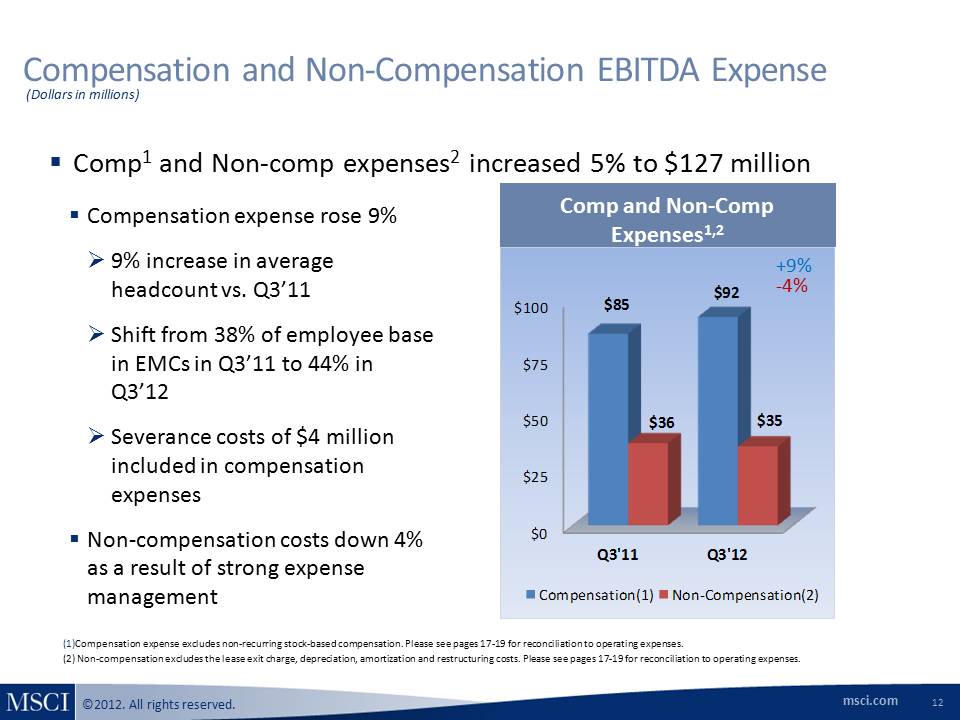
(Dollars in millions) Compensation and Non‐Compensation EBITDA Expense Comp and Non‐Comp Expenses1,2 +9% (Dollars in millions) (1)Compensation expense excludes non‐recurring stock‐based compensation. Please see pages 17‐19 for reconciliation to operating expenses. (2) Non‐compensation excludes the lease exit charge, depreciation, amortization and restructuring costs. Please see pages 17‐19 for reconciliation to operating expenses. ‐4% Comp1 and Non‐comp expenses2 increased 5% to $127 million Compensation expense rose 9% 9% increase in average headcount vs. Q3’11 Shift from 38% of employee base in EMCs in Q3’11 to 44% in Q3’12 Severance costs of $4 million included in compensation expenses Non‐compensation costs down 4% as a result of strong expense management
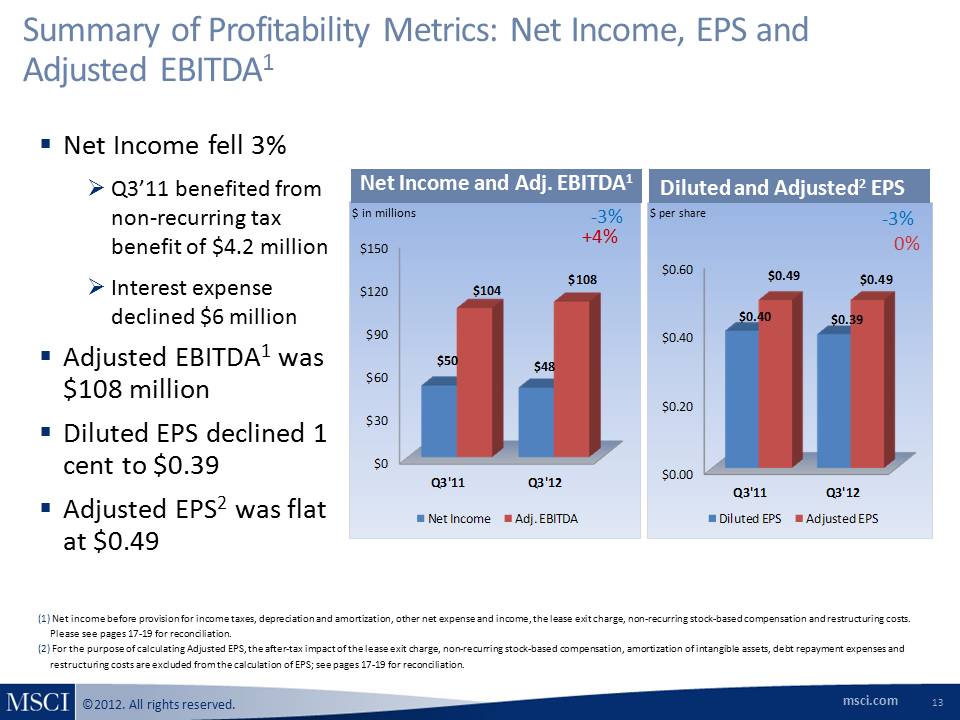
Summary of Profitability Metrics: Net Income, EPS and Adjusted EBITDA1 $ per share ‐3% 0% Diluted and Adjusted2 EPS Net Income fell 3% Q3’11 benefited from non‐recurring tax benefit of $4.2 million Interest expense declined $6 million Adjusted EBITDA1 was $108 million Diluted EPS declined 1 cent to $0.39 Adjusted EPS2 was flat at $0.49 Net Income and Adj. EBITDA1 ‐3% +4% (1) Net income before provision for income taxes, depreciation and amortization, other net expense and income, the lease exit charge, non‐recurring stock‐based compensation and restructuring costs. Please see pages 17‐19 for reconciliation. (2) For the purpose of calculating Adjusted EPS, the after‐tax impact of the lease exit charge, non‐recurring stock‐based compensation, amortization of intangible assets, debt repayment expenses and restructuring costs are excluded from the calculation of EPS; see pages 17‐19 for reconciliation. $ in millions
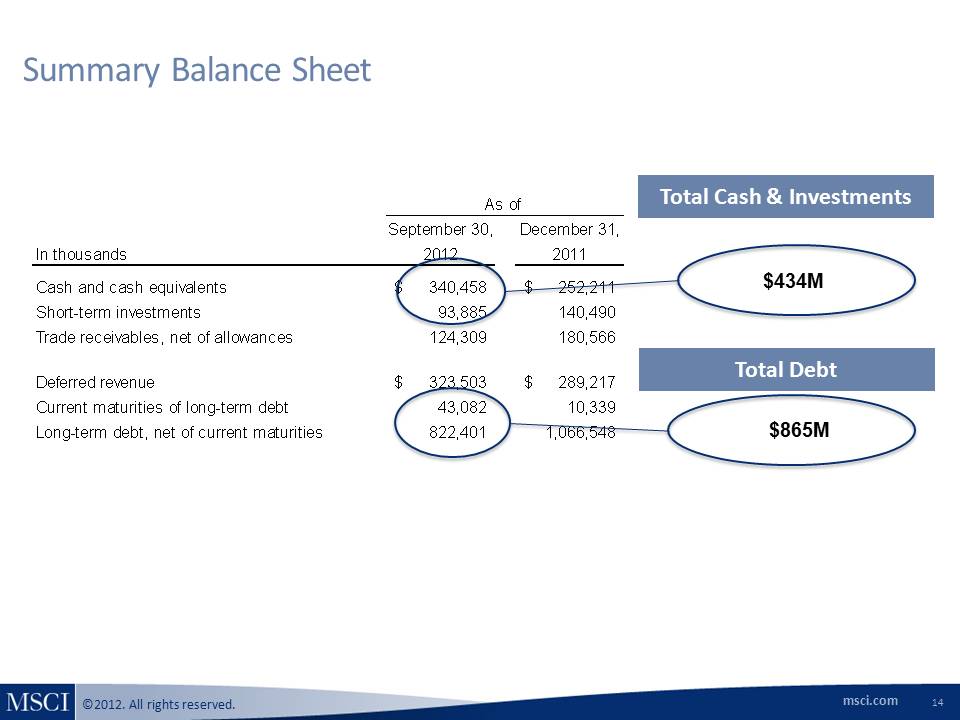
September 30, December 31, In thousands 2012 2011 Cash and cash equivalents 340,458 $ 252,211 $ Short-term investments 93,885 140,490 Trade receivables, net of allowances 124,309 180,566 Deferred revenue 323,503 $ 289,217 $ Current maturities of long-term debt 43,082 10,339 Long-term debt, net of current maturities 822,401 1,066,548 As of 14 $865M Summary Balance Sheet $434M Total Cash & Investments Total Debt
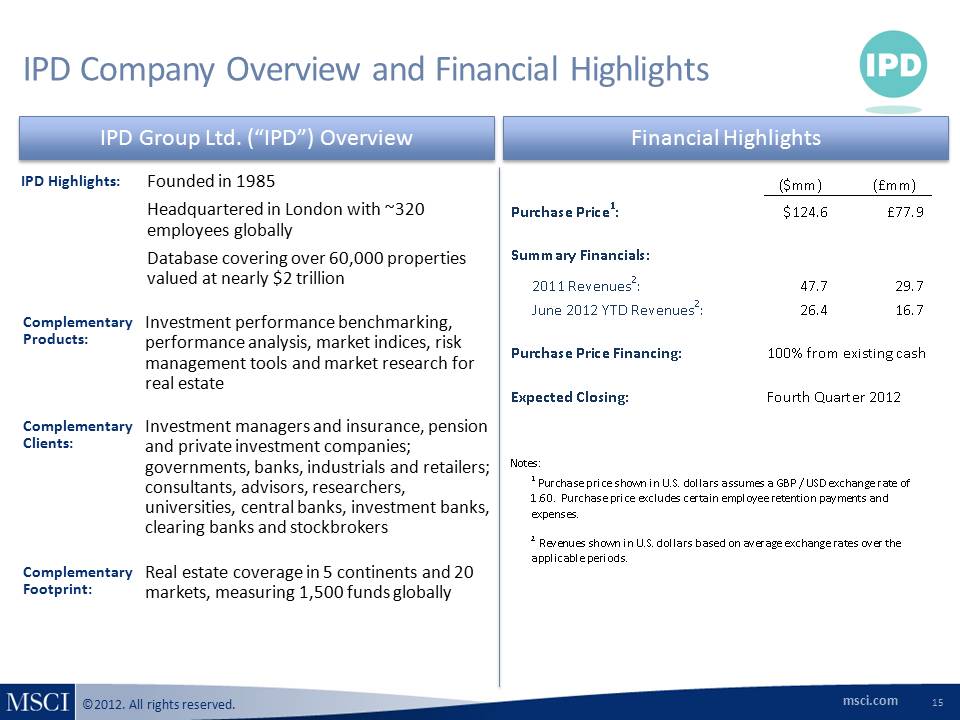
IPD Company Overview and Financial Highlights 15 IPD Highlights: Complementary Clients: Complementary Products: Complementary Footprint: Founded in 1985 Headquartered in London with ~320 employees globally Database covering over 60,000 properties valued at nearly $2 trillion Investment managers and insurance, pension and private investment companies; governments, banks, industrials and retailers; consultants, advisors, researchers, universities, central banks, investment banks, clearing banks and stockbrokers Investment performance benchmarking, performance analysis, market indices, risk management tools and market research for real estate Real estate coverage in 5 continents and 20 markets, measuring 1,500 funds globally IPD Group Ltd. (“IPD”) Overview Financial Highlights ($mm) (£mm) Purchase Price1: $124.6 £77.9 Summary Financials: 2011 Revenues2: 47.7 29.7 June 2012 YTD Revenues2: 26.4 16.7 Purchase Price Financing: 100% from existing cash Expected Closing: Fourth Quarter 2012 Notes: 1 Purchase price shown in U.S. dollars assumes a GBP / USD exchange rate of 1.60. Purchase price excludes certain employee retention payments and expenses. 2 Revenues shown in U.S. dollars based on average exchange rates over the applicable periods.
Use of Non‐GAAP Financial Measures MSCI has presented supplemental non‐GAAP financial measures as part of this presentation. A reconciliation is provided that reconciles each non‐GAAP financial measure with the most comparable GAAP measure. The presentation of non‐GAAP financial measures should not be considered as alternative measures for the most directly comparable GAAP financial measures. These measures are used by management to monitor the financial performance of the business, inform business decision making and forecast future results. Adjusted EBITDA is defined as net income before provision for income taxes, other net expense and income, depreciation and amortization, the lease exit charge, non‐recurring stock‐based compensation expense and restructuring costs. Adjusted Net Income and Adjusted EPS are defined as net income and EPS, respectively, before provision for the lease exit charge, nonrecurring stock‐based compensation expenses, amortization of intangible assets, restructuring costs and the accelerated amortization or write off of deferred financing and debt discount costs as a result of debt repayment (debt repayment and refinancing expenses), as well as for any related tax effects. We believe that adjustments related to the lease exit charge, restructuring costs and debt repayment and refinancing expenses are useful to management and investors because it allows for an evaluation of MSCI’s underlying operating performance. Additionally, we believe that adjusting for non‐recurring stock‐based compensation expenses, debt repayment and refinancing expenses and depreciation and amortization may help investors compare our performance to that of other companies in our industry as we do not believe that other companies in our industry have as significant a portion of their operating expenses represented by these items. We believe that the non‐GAAP financial measures presented in this earnings release facilitate meaningful period‐to‐period comparisons and provide a baseline for the evaluation of future results. Adjusted EBITDA, Adjusted net income and Adjusted EPS are not defined in the same manner by all companies and may not be comparable to other similarly titled measures of other companies.
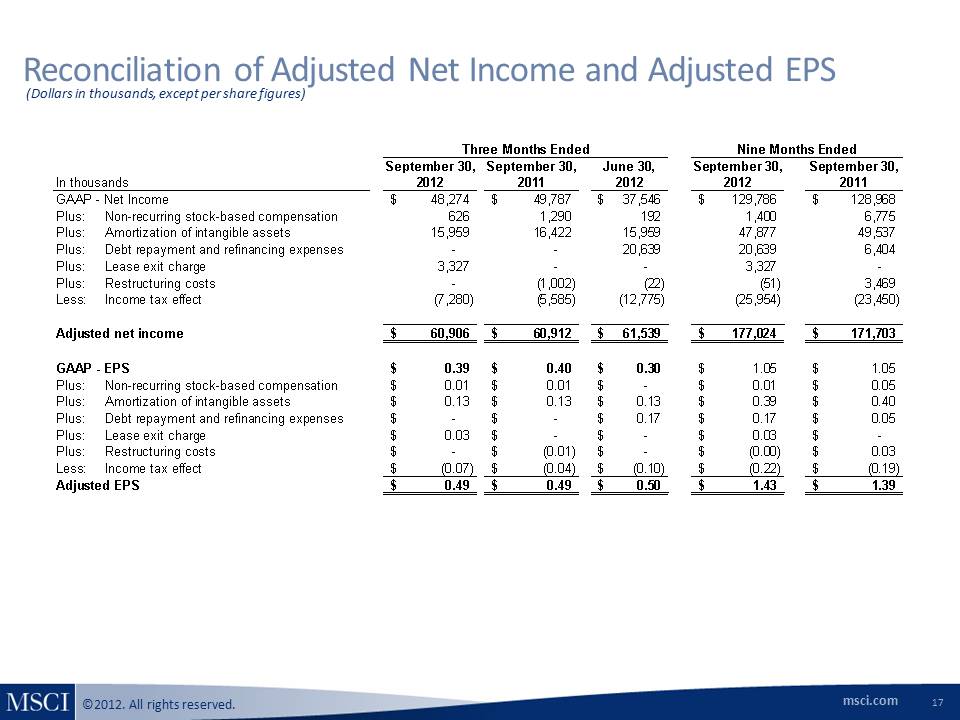
Reconciliation of Adjusted Net Income and Adjusted EPS (Dollars in thousands, except per share figures) September 30, September 30, June 30, September 30, September 30, In thousands 2012 2011 2012 2012 2011 GAAP - Net Income 48,274 $ 49,787 $ 37,546 $ 129,786 $ 128,968 $ Plus: Non-recurring stock-based compensation 626 1,290 192 1,400 6,775 Plus: Amortization of intangible assets 15,959 16,422 15,959 47,877 49,537 Plus: Debt repayment and refinancing expenses - - 20,639 20,639 6,404 Plus: Lease exit charge 3,327 - - 3,327 - Plus: Restructuring costs - (1,002) (22) (51) 3,469 Less: Income tax effect (7,280) (5,585) (12,775) (25,954) (23,450) Adjusted net income 60,906 $ 60,912 $ 61,539 $ 177,024 $ 171,703 $ GAAP - EPS 0.39 $ 0.40 $ 0.30 $ 1.05 $ 1.05 $ Plus: Non-recurring stock-based compensation 0.01 $ 0.01 $ - $ 0.01 $ 0.05 $ Plus: Amortization of intangible assets 0.13 $ 0.13 $ 0.13 $ 0.39 $ 0.40 $ Plus: Debt repayment and refinancing expenses - $ - $ 0.17 $ 0.17 $ 0.05 Plus: Lease exit charge 0.03 $ - $ - $ 0.03 $ - $ Plus: Restructuring costs - $ (0.01) $ - $ (0.00) $ 0.03 $ Less: Income tax effect (0.07) $ (0.04) $ (0.10) $ (0.22) $ (0.19) $ Adjusted EPS 0.49 $ 0.49 $ 0.50 $ 1.43 $ 1.39 $ Three Months Ended Nine Months Ended Reconciliation of Adjusted EBITDA to Net Income
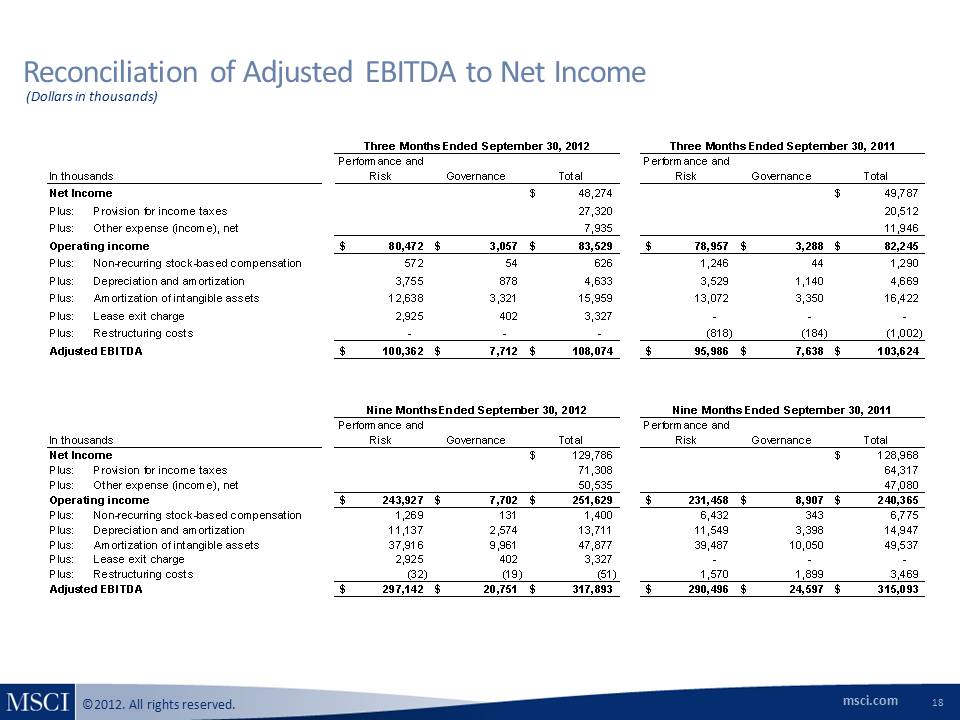
(Dollars in thousands) In thousands Performance and Risk Governance Total Performance and Risk Governance Total Net Income 48,274 $ 49,787 $ Plus: Provision for income taxes 27,320 20,512 Plus: Other expense (income), net 7,935 11,946 Operating income 80,472 $ 3,057 $ 83,529 $ 78,957 $ 3,288 $ 82,245 $ Plus: Non-recurring stock-based compensation 572 54 626 1,246 44 1,290 Plus: Depreciation and amortization 3,755 878 4,633 3,529 1,140 4,669 Plus: Amortization of intangible assets 12,638 3,321 15,959 13,072 3,350 16,422 Plus: Lease exit charge 2,925 402 3,327 - - - Plus: Restructuring costs - - - (818) (184) (1,002) Adjusted EBITDA 100,362 $ 7,712 $ 108,074 $ 95,986 $ 7,638 $ 103,624 $ In thousands Performance and Risk Governance Total Performance and Risk Governance Total Net Income 129,786 $ 128,968 $ Plus: Provision for income taxes 71,308 64,317 Plus: Other expense (income), net 50,535 47,080 Operating income 243,927 $ 7,702 $ 251,629 $ 231,458 $ 8,907 $ 240,365 $ Plus: Non-recurring stock-based compensation 1,269 131 1,400 6,432 343 6,775 Plus: Depreciation and amortization 11,137 2,574 13,711 11,549 3,398 14,947 Plus: Amortization of intangible assets 37,916 9,961 47,877 39,487 10,050 49,537 Plus: Lease exit charge 2,925 402 3,327 - - - Plus: Restructuring costs (32) (19) (51) 1,570 1,899 3,469 Adjusted EBITDA 297,142 $ 20,751 $ 317,893 $ 290,496 $ 24,597 $ 315,093 $ Three Months Ended September 30, 2012 Three Months Ended September 30, 2011 Nine Months Ended September 30, 2012 Nine Months Ended September 30, 2011
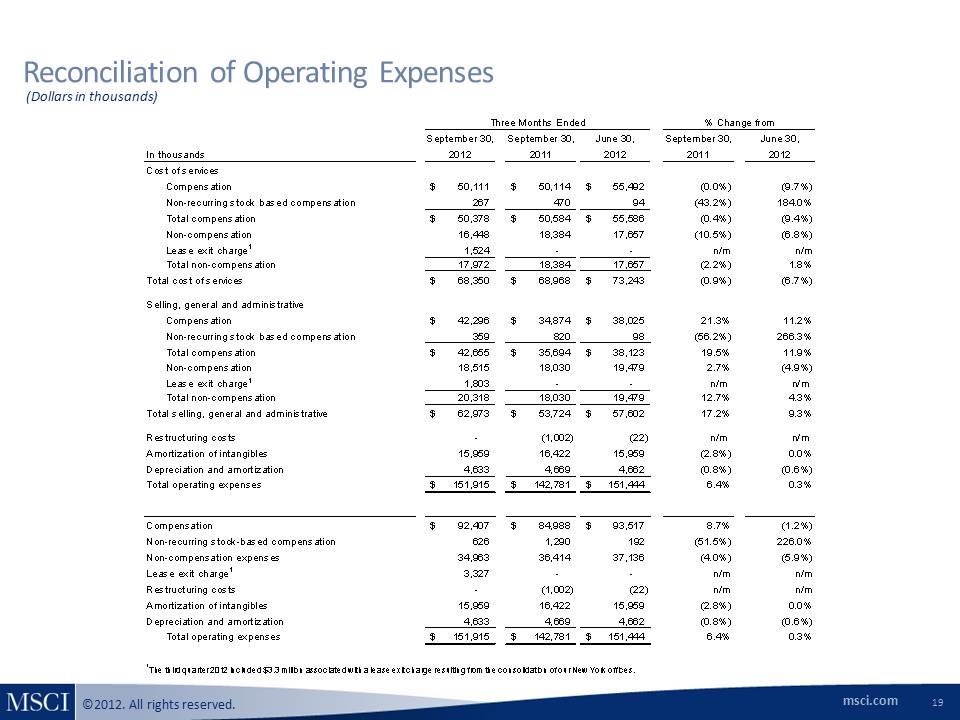
Reconciliation of Operating Expenses (Dollars in thousands) September 30, September 30, June 30, September 30, June 30, In thousands 2012 2011 2012 2011 2012 Cost of services Compensation 50,111 $ 50,114 $ 55,492 $ (0.0%) (9.7%) Non-recurring stock based compensation 267 470 94 (43.2%) 184.0% Total compensation 50,378 $ 50,584 $ 55,586 $ (0.4%) (9.4%) Non-compensation 16,448 18,384 17,657 (10.5%) (6.8%) Lease exit charge1 1,524 - - n/m n/m Total non-compensation 17,972 18,384 17,657 (2.2%) 1.8% Total cost of services 68,350 $ 68,968 $ 73,243 $ (0.9%) (6.7%) Selling, general and administrative Compensation 42,296 $ 34,874 $ 38,025 $ 21.3% 11.2% Non-recurring stock based compensation 359 820 98 (56.2%) 266.3% Total compensation 42,655 $ 35,694 $ 38,123 $ 19.5% 11.9% Non-compensation 18,515 18,030 19,479 2.7% (4.9%) Lease exit charge1 1,803 - - n/m n/m Total non-compensation 20,318 18,030 19,479 12.7% 4.3% Total selling, general and administrative 62,973 $ 53,724 $ 57,602 $ 17.2% 9.3% Restructuring costs - (1,002) (22) n/m n/m Amortization of intangibles 15,959 16,422 15,959 (2.8%) 0.0% Depreciation and amortization 4,633 4,669 4,662 (0.8%) (0.6%) Total operating expenses 151,915 $ 142,781 $ 151,444 $ 6.4% 0.3% Compensation 92,407 $ 84,988 $ 93,517 $ 8.7% (1.2%) Non-recurring stock-based compensation 626 1,290 192 (51.5%) 226.0% Non-compensation expenses 34,963 36,414 37,136 (4.0%) (5.9%) Lease exit charge1 3,327 - - n/m n/m Restructuring costs - (1,002) (22) n/m n/m Amortization of intangibles 15,959 16,422 15,959 (2.8%) 0.0% Depreciation and amortization 4,633 4,669 4,662 (0.8%) (0.6%) Total operating expenses 151,915 $ 142,781 $ 151,444 $ 6.4% 0.3% Three Months Ended % Change from 1The third quarter 2012 included $3.3 million associated with a lease exit charge resulting from the consolidation of our New York offices.