Attached files
| file | filename |
|---|---|
| 8-K - FORM 8-K - Higher One Holdings, Inc. | form8-k.htm |
| EX-99.1 - EXHIBIT 99.1 - Higher One Holdings, Inc. | exhibit99-1.htm |

Higher One Holdings, Inc. Q3’12 Earnings Results November 6, 2012

® ©2012 Higher One Holdings, Inc. Higher One, CASHNet, and Campus Labs are registered trademarks of Higher One, Inc. All other marks are owned by their respective owners. * Forward-Looking Statements This presentation includes forward-looking statements, as defined by the Securities and Exchange Commission. Management’s projections and expectations are subject to a number of risks and uncertainties that could cause actual performance to differ materially from that predicted or implied. These statements speak only as of the date they are made, and the company does not intend to update or otherwise revise the forward-looking information to reflect actual results of operations, changes in
financial condition, changes in estimates, expectations or assumptions, changes in general economic or industry conditions or other circumstances arising and/or existing since the preparation of this presentation or to reflect the occurrence of any unanticipated events. The forward-looking statements in this presentation do not include the potential impact of any acquisitions or divestitures that may be announced and/or completed after the date hereof. Information about the factors that could affect future performance can be found in our recent SEC filings, available on our website at http://ir.higherone.com/. This presentation includes certain metrics presented on a non-GAAP basis, including non-GAAP adjusted EBITDA, non-GAAP adjusted EBITDA margin, non-GAAP adjusted net income, non-GAAP adjusted diluted EPS, and non-GAAP Free Cash Flow. We believe that these non-GAAP measures, which
exclude amortization of intangibles, stock-based compensation, and certain non-recurring or non-cash impacts to our results, all net of taxes, provide useful information regarding normalized trends relating to the company’s financial condition and results of operations. Reconciliations of these non-GAAP measures to their closest comparable GAAP measure are included in the appendix of this presentation.
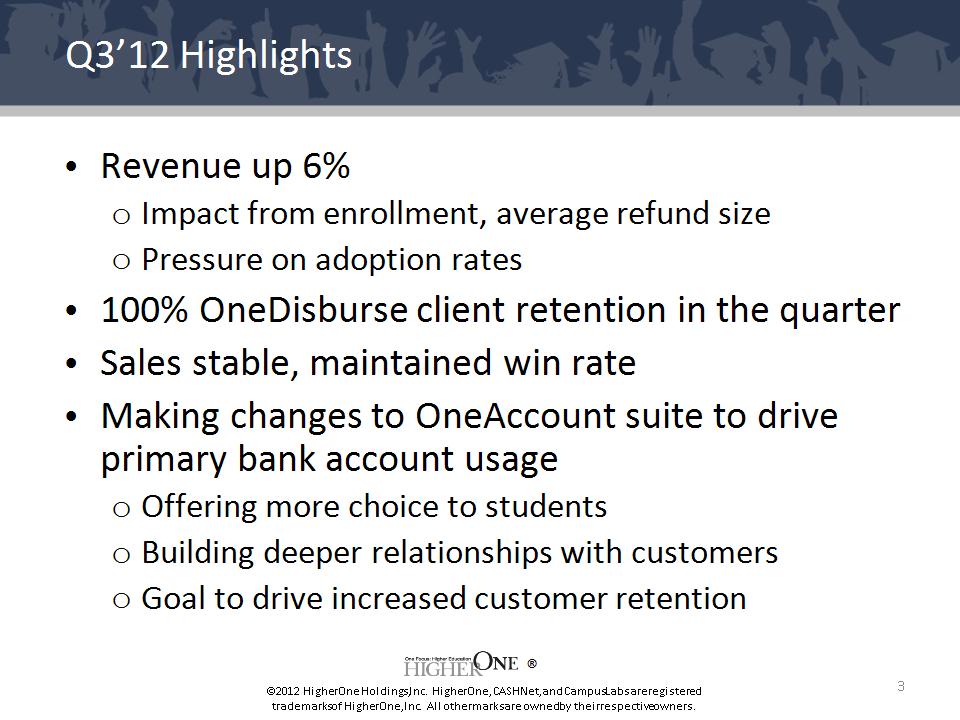
® ©2012 Higher One Holdings, Inc. Higher One, CASHNet, and Campus Labs are registered trademarks of Higher One, Inc. All other marks are owned by their respective owners. * Q3’12 Highlights Revenue up 6% Impact from enrollment, average refund size Pressure on adoption rates 100% OneDisburse client retention in the quarter Sales stable, maintained win rate Making changes to OneAccount suite to drive primary bank account usage Offering more choice to students Building deeper relationships with customers Goal to drive increased customer retention

® ©2012 Higher One Holdings, Inc. Higher One, CASHNet, and Campus Labs are registered trademarks of Higher One, Inc. All other marks are owned by their respective owners. * Account Options Provide Choice and Value for Students Fee Considerations* Fee Considerations* Fee Considerations* No minimum balance requirements No monthly fee for students Fee schedule easily available online Designed to be used for free No inactivity fee $3.95/month fee for non-students without direct deposit No minimum balance requirements Monthly fee of $5.95 waived with minimum of $300 direct deposit No PIN fees Allpoint ATM network access VIP service line, budgeting tool, other perks available Monthly fee of $4.95 One
fee only… no a la carte fees Simplest account on the market Strategic Reasoning Strategic Reasoning Strategic Reasoning Account with no monthly fee designed to be used for free, great deal for students Incentivizing direct deposit to drive more primary bank account behavior Simple, low monthly fee with no additional fees, helpful for budgeting Consumer groups appreciate uniform costs for all customers *Reflects account features and pricing expected for January 2013

® ©2012 Higher One Holdings, Inc. Higher One, CASHNet, and Campus Labs are registered trademarks of Higher One, Inc. All other marks are owned by their respective owners. * Enrollment at Title IV- Eligible Colleges (in thousands) Fall 2010 Fall 2011 % Change Total 21,588 21,544 -0.2% Public 15,280 15,242 -0.2% Private 3,882 3,955 +1.8% For-Profit 2,426 2,357 -2.9% 4-year Total 13,336 13,493 +1.2% 4-year Public 7,925 8,046 +1.5% 4-year Private 3,823 3,888 +1.8% 4-year For-Profit 1,588 1,559 -1.9% 2-year Total 7,848 7,662 -2.4% 2-year Public 7,285 7,126 -2.2% 2-year For-Profit 519 485 -7.0% Source: National Center for Education Statistics, “Enrollment in Postsecondary Institutions, Fall
2011; Financial Statistics, Fiscal Year 2011; and Graduation Rates, Selected Cohorts, 2003-2008,” October 2012

® ©2012 Higher One Holdings, Inc. Higher One, CASHNet, and Campus Labs are registered trademarks of Higher One, Inc. All other marks are owned by their respective owners. * Same-School* Fall Metrics (Excluding Newly Launched Schools) Total unique recipients: down 3% Average refund size: down 5% Total dollars disbursed: down 8% % of refund dollars going into OneAccounts: down 4% Total dollars disbursed into OneAccounts (on a same-school basis*): down 12% Fall Disbursement Cycle** Data (Same-School Basis*) Unique recipients at 2-years: -7% Unique recipients at 4-years: +6% Average refund size at 2-years: -3% Average refund size at 4-years: -9% *Includes all schools that processed disbursements
through OneDisburse for the Fall ‘11 and Fall ‘12 semesters **Fall Disbursement Cycle includes disbursements processed between the beginning of August and the end of October For guidance, had assumed enrollment and average refund size to be flat

® ©2012 Higher One Holdings, Inc. Higher One, CASHNet, and Campus Labs are registered trademarks of Higher One, Inc. All other marks are owned by their respective owners. * Hypothetical Scenario: Impacts on Financial Aid Refund Size 2011 - 12 2012 - 13 2011 -12 Financial Aid Refund: $4,056 2012 - 13 Financial Aid Refund: $3,852 Hypothetical Scenario: Tuition: +4.5% y/y Loans + Grants: +1% y/y Financial Aid Refund Size: -5% Grants Loans

® ©2012 Higher One Holdings, Inc. Higher One, CASHNet, and Campus Labs are registered trademarks of Higher One, Inc. All other marks are owned by their respective owners. * Aggregate Fall Metrics (Including Newly Launched Schools) Launched SSE: up 18% Total refund dollars disbursed: up 9% % of total dollars disbursed going into OneAccounts: down 9% Dollars disbursed into OneAccounts: down 1%

® ©2012 Higher One Holdings, Inc. Higher One, CASHNet, and Campus Labs are registered trademarks of Higher One, Inc. All other marks are owned by their respective owners. * Continued growth in major revenue streams As a % of total revenue (in $ thousands) (in $ thousands) (in $ thousands) (in $ thousands) 74% 70% 14% 16% 10% 12% 2% 2% flat +26% +29% +12%

® ©2012 Higher One Holdings, Inc. Higher One, CASHNet, and Campus Labs are registered trademarks of Higher One, Inc. All other marks are owned by their respective owners. * (in $ millions) Revenue Growth Despite Numerous Headwinds 38.6 39.8 51.4 35.1 48.1 46.5 ** ** 57.8 38.9 *Calculation of organic revenue growth is included in the appendix of this presentation **Excluding $4.7 million impact of credit project, Q4’11 gross margin would have been 63.2% 51.2

® ©2012 Higher One Holdings, Inc. Higher One, CASHNet, and Campus Labs are registered trademarks of Higher One, Inc. All other marks are owned by their respective owners. * GAAP Net Income (in $ millions)

® ©2012 Higher One Holdings, Inc. Higher One, CASHNet, and Campus Labs are registered trademarks of Higher One, Inc. All other marks are owned by their respective owners. * Increases in G&A, Marketing Spend Increase in depreciation, mainly due to new headquarters Professional fees higher in quarter as we invest in PR and GR capabilities Continue to invest in projects to increase product development flexibility, grow revenue, and manage costs Increased marketing expenses from consumer branding initiatives and broad launch of Premier Earn-out resulting in stock-based and other M&A related expense expired in 2011 (as a % of rev) (as a % of rev ) (as a % of rev) 9.8% *The Adjusted Sales and
Marketing Expense graph shows both total Sales & Marketing as a percent of revenue as well as Sales & Marketing as a percent of revenue excluding stock-based and other acquisition expense, which is related to the vesting of certain shares issued in connection with the acquisition of EduCard and CASHNET. Stock-based and other acquisition expense is recognized in the quarter as a function of sales and average share price. Stock-based and other M&A related expense 6.2%

® ©2012 Higher One Holdings, Inc. Higher One, CASHNet, and Campus Labs are registered trademarks of Higher One, Inc. All other marks are owned by their respective owners. * Adj. EBITDA Impacted By Higher CoGS, OpEx *Calculation of Adj. EBITDA and Adj. EBITDA Margin is included in the appendix of this presentation (in $ millions)

® ©2012 Higher One Holdings, Inc. Higher One, CASHNet, and Campus Labs are registered trademarks of Higher One, Inc. All other marks are owned by their respective owners. * GAAP Diluted EPS (in $)

® ©2012 Higher One Holdings, Inc. Higher One, CASHNet, and Campus Labs are registered trademarks of Higher One, Inc. All other marks are owned by their respective owners. * Adj. EPS Impacted by Margins, Interest Expense *Calculation of Adj. EPS and Adj. Net Income Margin is included in the appendix of this presentation (in $)

® ©2012 Higher One Holdings, Inc. Higher One, CASHNet, and Campus Labs are registered trademarks of Higher One, Inc. All other marks are owned by their respective owners. * Operating Cash Flow (in $ millions)

® ©2012 Higher One Holdings, Inc. Higher One, CASHNet, and Campus Labs are registered trademarks of Higher One, Inc. All other marks are owned by their respective owners. * FCF impacted by NWC timing, CapEx *Calculation of Free Cash Flow is included in the appendix of this presentation (in $ millions)

® ©2012 Higher One Holdings, Inc. Higher One, CASHNet, and Campus Labs are registered trademarks of Higher One, Inc. All other marks are owned by their respective owners. * Maintaining Strong Win Rate and Stable Sales †Government enrollment statistics (from the IPEDS database) for existing clients are updated every third quarter to reflect changes to enrollment for the fall semester of the prior school year. Updates to IPEDS impacted Q3’11 numbers by +115,000, and Q3’12 numbers by -19,000. *OneDisburse Signed School Enrollment (SSE) is recorded as the total student enrollment at all schools that are contracted at quarter-end for our OneDisburse product as of the date the
contract is signed (using the most up-to-date IPEDS data at that point in time). **Total Company SSE includes the total student enrollment at all schools that are contracted for at least one OneDisburse, CASHNet suite of payment products, or Campus Labs module, as of the date the contract is signed (using the most up-to-date IPEDS data at that point in time) OneDisburse SSE* +16% (in thousands) Total Company SSE** (in thousands) +87% (+15% ex-Campus Labs) Over 6.2 million SSE cross-sell potential for OneDisburse

® ©2012 Higher One Holdings, Inc. Higher One, CASHNet, and Campus Labs are registered trademarks of Higher One, Inc. All other marks are owned by their respective owners. * OneAccounts Impacted by Lower Enrollment, Adoption OneAccount Growth +3% (in thousands)

® ©2012 Higher One Holdings, Inc. Higher One, CASHNet, and Campus Labs are registered trademarks of Higher One, Inc. All other marks are owned by their respective owners. * Capital allocation creating value for shareholders *Other primarily includes proceeds and tax benefits from options exercises Cash & Investment Balance/Flows (in millions) FCF/Other Movements $36.6 FCF Cash and cash equivalents Investments in available for sale securities $27.3 Fully liquid assets total $27.3M $9.4M in FCF CapEx returned to lower, more normalized level Timing considerations impacting Net Working Capital ($14.8M) million on repurchasing 1.2 million shares at an average price of $12.21 in Q3 From start of
buyback program through Q3, 3.8 million shares repurchased at an average price of $14.22/share Additional $18.2 million used to repurchase ~1.5 million shares in October Entered into new five-year, $200 million revolving credit facility $100 million accordion available $37.3M outlay on Campus Labs Drew down $30 million from line of credit to help finance acquisition

® ©2012 Higher One Holdings, Inc. Higher One, CASHNet, and Campus Labs are registered trademarks of Higher One, Inc. All other marks are owned by their respective owners. * GAAP Guidance FY’12

® ©2012 Higher One Holdings, Inc. Higher One, CASHNet, and Campus Labs are registered trademarks of Higher One, Inc. All other marks are owned by their respective owners. * Non-GAAP Guidance *Calculation of Adjusted Diluted EPS is included in the appendix of this presentation FY’12 Pressure on enrollment and average refund size… could continue through summer of next year Timing considerations (when schools disburse) cause uncertainty Moved some variable expenses to fixed… greater potential variance in EPS at different revenue levels (expect additional benefits from leverage in long-run)

® ©2012 Higher One Holdings, Inc. Higher One, CASHNet, and Campus Labs are registered trademarks of Higher One, Inc. All other marks are owned by their respective owners. * Q3’12 Summary Growing revenue despite enrollment, adoption headwinds 100% OneDisburse client retention in the quarter Sales stable, maintained win rate Diversified revenue streams Changes to OneAccount suite position the business for long-term value creation

® ©2012 Higher One Holdings, Inc. Higher One, CASHNet, and Campus Labs are registered trademarks of Higher One, Inc. All other marks are owned by their respective owners. * Q & A

® ©2012 Higher One Holdings, Inc. Higher One, CASHNet, and Campus Labs are registered trademarks of Higher One, Inc. All other marks are owned by their respective owners. * Appendix
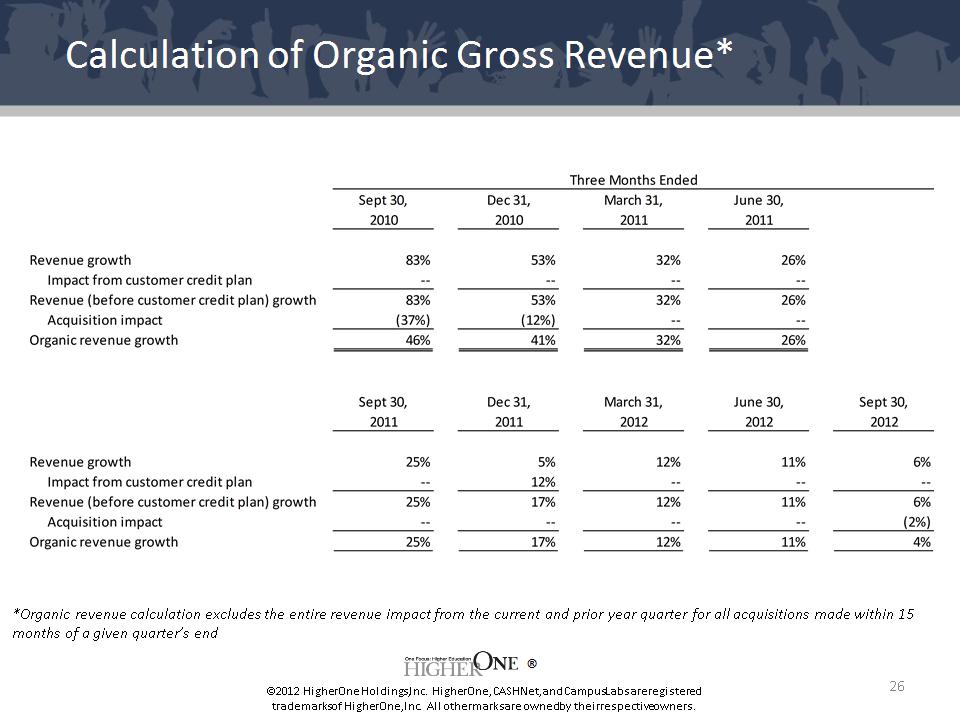
® ©2012 Higher One Holdings, Inc. Higher One, CASHNet, and Campus Labs are registered trademarks of Higher One, Inc. All other marks are owned by their respective owners. * Calculation of Organic Gross Revenue* *Organic revenue calculation excludes the entire revenue impact from the current and prior year quarter for all acquisitions made within 15 months of a given quarter’s end

® ©2012 Higher One Holdings, Inc. Higher One, CASHNet, and Campus Labs are registered trademarks of Higher One, Inc. All other marks are owned by their respective owners. * Calculation of Free Cash Flow

® ©2012 Higher One Holdings, Inc. Higher One, CASHNet, and Campus Labs are registered trademarks of Higher One, Inc. All other marks are owned by their respective owners. * Calculation of Adjusted EBITDA

® ©2012 Higher One Holdings, Inc. Higher One, CASHNet, and Campus Labs are registered trademarks of Higher One, Inc. All other marks are owned by their respective owners. * Calculation of Adjusted Diluted EPS

® ©2012 Higher One Holdings, Inc. Higher One, CASHNet, and Campus Labs are registered trademarks of Higher One, Inc. All other marks are owned by their respective owners. * Reconciliation of GAAP to non-GAAP Guidance