Attached files
| file | filename |
|---|---|
| 8-K - HAMPDEN BANCORP, INC. 8-K - Hampden Bancorp, Inc. | a50465738.htm |
Exhibit 99.1
Slide: 1 Title: ANNUAL MEETING OF THE SHAREHOLDERS Tuesday, November 6, 2012 Other Placeholder: 1 Thomas R. BurtonChief Executive Officer Glenn S. WelchPresident/Chief Operating OfficerIncoming CEO
Slide: 2 Title: Forward Looking Statements Other Placeholder: 2 Certain statements contained herein and presented orally at the shareholders meeting constitute “forward-looking statements” within the meaning of the Private Securities Litigation Reform Act of 1995. These statements are based on the beliefs and expectations of management, as well as the assumptions made using information currently available to management. Because these statements reflect the views of management concerning future events, these statements involve risks, uncertainties and assumptions. As a result, actual results may differ from those contemplated by these statements. Forward-looking statements can be identified by the fact that they do not relate strictly to historical or current facts. They often include words like “believe”, “expect”, “anticipate”, “estimate”, and “intend” or future or conditional verbs such as “will”, “would”, “should”, “could”, or “may.” Certain factors that could have a material adverse affect on the operations of the Bank include, but are not limited to, increased competitive pressure among financial service companies, national and regional economic conditions, changes in interest rates, changes in consumer spending, borrowing and savings habits, legislative and regulatory changes, adverse changes in the securities markets, inability of key third-party providers to perform their obligations to Hampden Bank, changes in relevant accounting principles and guidelines. Additionally, other risks and uncertainties are described in the Company’s Annual Report on Form 10-K filed with the Securities and Exchange Commission (the “SEC”) which is available through the SEC’s website at www.sec.gov. These risks and uncertainties should be considered in evaluating forward-looking statements and undue reliance should not be placed on such statements. Readers are cautioned not to place undue reliance on these forward-looking statements, which speak only as of the date of this report. The Company disclaims any intent or obligation to update any forward-looking statements, whether in response to new information, future events or otherwise.
Slide: 3 Title: Executive Summary Other Placeholder: 3 Hampden Bank, founded in 1852, is a wholly-owned subsidiary of Hampden Bancorp, Inc.New leadership is focused on an organic growth strategy that will provide acceptable returns to our shareholdersCommunity bank with a strong capital position, improving trends in loan and deposit growth, and a disciplined credit cultureClear strategic priorities to grow and deepen commercial clients’ business and personal needsOpportunity to exploit competitive dislocation in western Massachusetts market Culture and technology that encourages teamwork to attain greater wallet shareA strategy that will grow core loans and deposits, while improving profitability with an attractive risk / reward dynamic
Slide: 4 Title: 2012 Financial Highlights Other Placeholder: 4 Record profitability in 2012 -Net income of $3.0 million -EPS of $0.51 (diluted)Strong balance sheet growth in 1Q 2013 -Commercial loan growth of 6.20% (24.8% annualized) -Commercial deposit growth of 4.14% (16.6% annualized)Capital management -Tangible Capital Equity/Assets = 13.47% -Dividends increased from $0.03 to $0.04 per share in third and fourth quarter; payout ratio 27.7% -832,273 shares of stock repurchased in 2012Improved year over year performance ratios -ROA = 0.52% from 0.23% -ROE = 3.37% from 1.40% -NIM = 3.50% from 3.38% -Efficiency ratio = 76.58% from 81.91%Maintained conservative risk profile -Non-performing Loans/Loans = 0.66% -Non-performing Assets/Total Assets = 0.68%
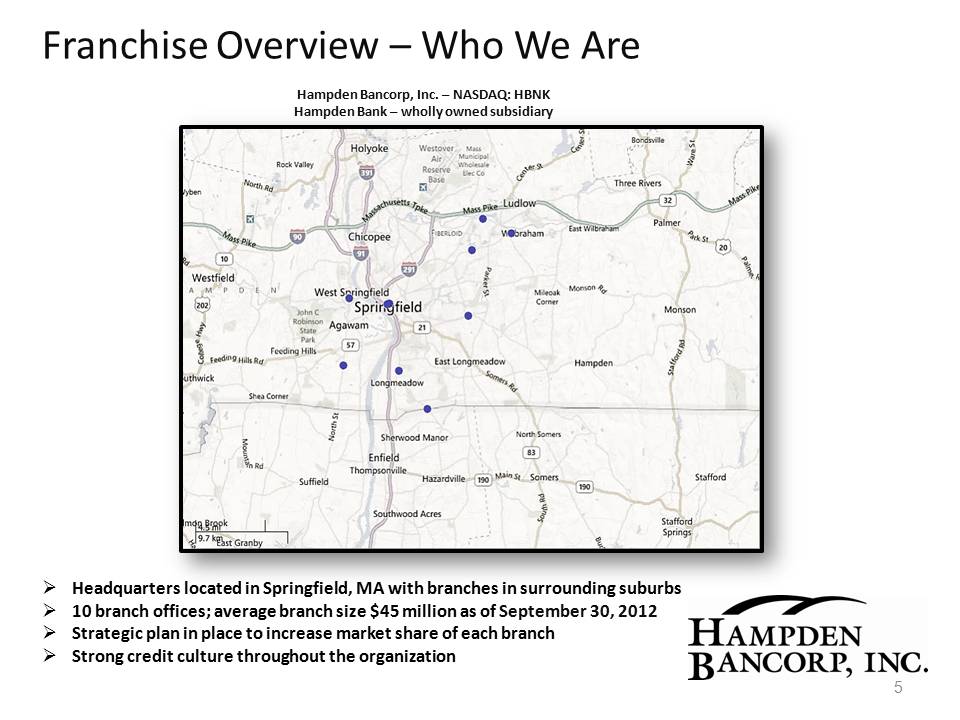
Slide: 5 Title: Franchise Overview – Who We Are Other Placeholder: 5 Hampden Bancorp, Inc. – NASDAQ: HBNKHampden Bank – wholly owned subsidiary Headquarters located in Springfield, MA with branches in surrounding suburbs10 branch offices; average branch size $45 million as of September 30, 2012Strategic plan in place to increase market share of each branchStrong credit culture throughout the organization
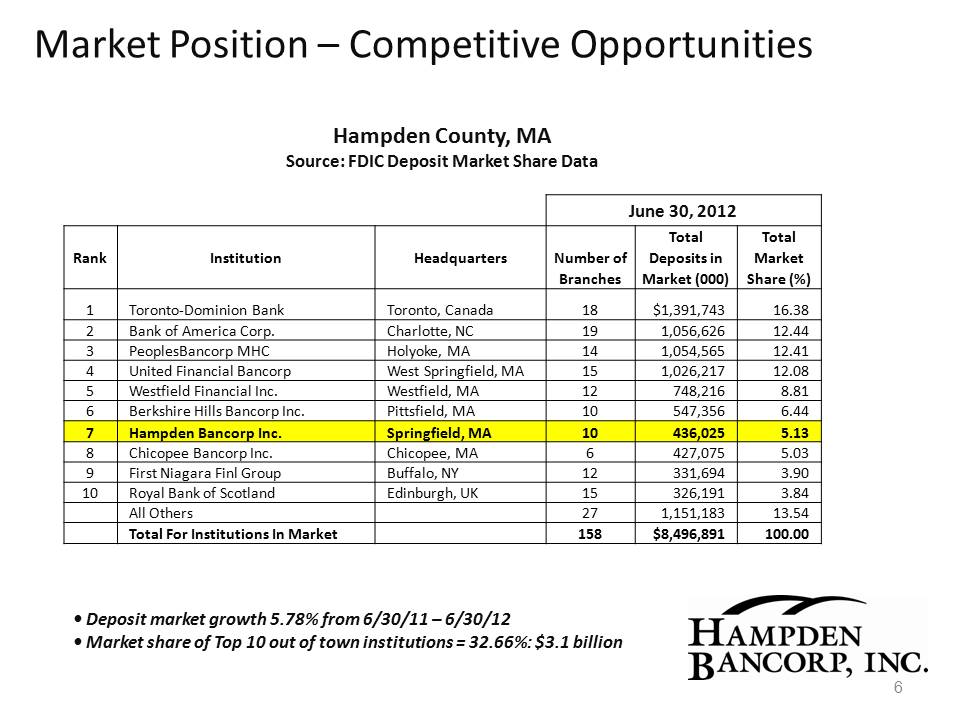
Market Position – Competitive Opportunities 6 Hampden County, MA Source: FDIC Deposit Market Share Data June 30, 2012 Rank Institution Headquarters Total Total Number of Deposits in Market Branches Market (000) Share (%) 1 Toronto‐Dominion Bank Toronto, Canada 18 $1,391,743 16.38 2 Bank of America Corp. Charlotte, NC 19 1,056,626 12.44 3 PeoplesBancorp MHC Holyoke, MA 14 1,054,565 12.41 4 United Financial Bancorp West Springfield, MA 15 1,026,217 12.08 5 Westfield Financial Inc. Westfield, MA 12 748,216 8.81 6 Berkshire Hills Bancorp Inc. Pittsfield, MA 10 547,356 6.44 7 Hampden Bancorp Inc. Springfield, MA 10 436,025 5.13 8 Chicopee Bancorp Inc. Chicopee, MA 6 427,075 5.03 9 First Niagara Finl Group Buffalo, NY 12 331,694 3.90 10 Royal Bank of Scotland Edinburgh, UK 15 326,191 3.84 All Others 27 1,151,183 13.54 Total For Institutions In Market 158 $8,496,891 100.00 • Deposit market growth 5.78% from 6/30/11 – 6/30/12 • Market share of Top 10 out of town institutions = 32.66%: $3.1 billion
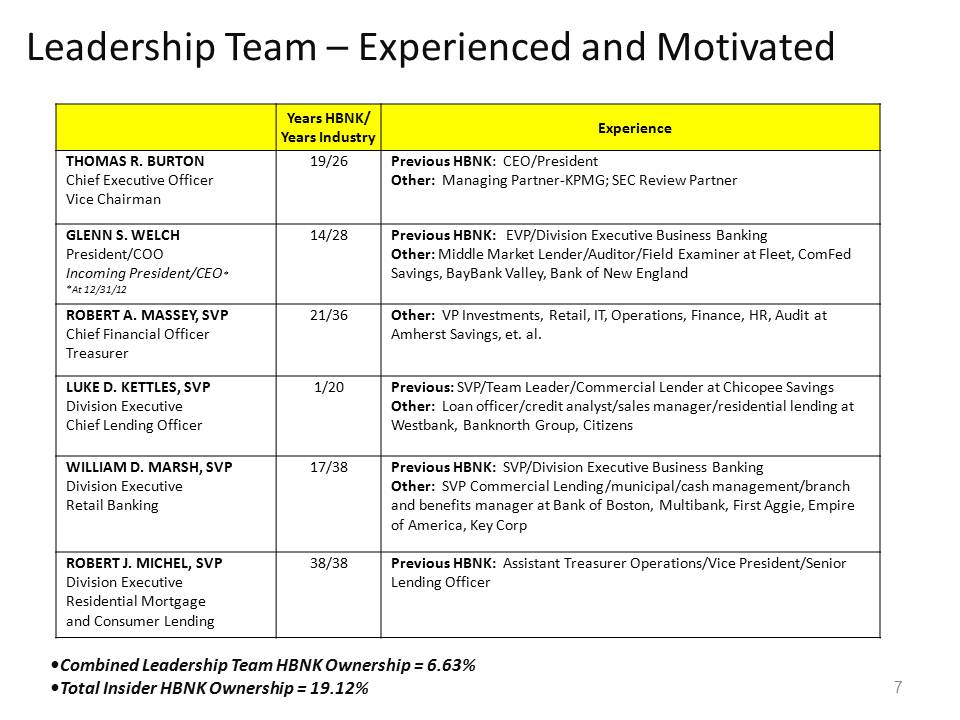
Leadership Team – Experienced and Motivated 7 Years HBNK/ Years Industry Experience THOMAS R. BURTON Chief Executive Officer Vice Chairman 19/26 Previous HBNK: CEO/President Other: Managing Partner‐KPMG; SEC Review Partner GLENN S. WELCH President/COO Incoming President/CEO* *At 12/31/12 14/28 Previous HBNK: EVP/Division Executive Business Banking Other: Middle Market Lender/Auditor/Field Examiner at Fleet, ComFed Savings, BayBank Valley, Bank of New England ROBERT A. MASSEY, SVP Chief Financial Officer Treasurer 21/36 Other: VP Investments, Retail, IT, Operations, Finance, HR, Audit at Amherst Savings, et. al. LUKE D. KETTLES, SVP Division Executive Chief Lending Officer 1/20 Previous: SVP/Team Leader/Commercial Lender at Chicopee Savings Other: Loan officer/credit analyst/sales manager/residential lending at Westbank, Banknorth Group, Citizens WILLIAM D. MARSH, SVP Division Executive Retail Banking 17/38 Previous HBNK: SVP/Division Executive Business Banking Other: SVP Commercial Lending/municipal/cash management/branch and benefits manager at Bank of Boston, Multibank, First Aggie, Empire of America, Key Corp ROBERT J. MICHEL, SVP Division Executive Residential Mortgage and Consumer Lending 38/38 Previous HBNK: Assistant Treasurer Operations/Vice President/Senior Lending Officer •Combined Leadership Team HBNK Ownership = 6.63% •Total Insider HBNK Ownership = 19.12%
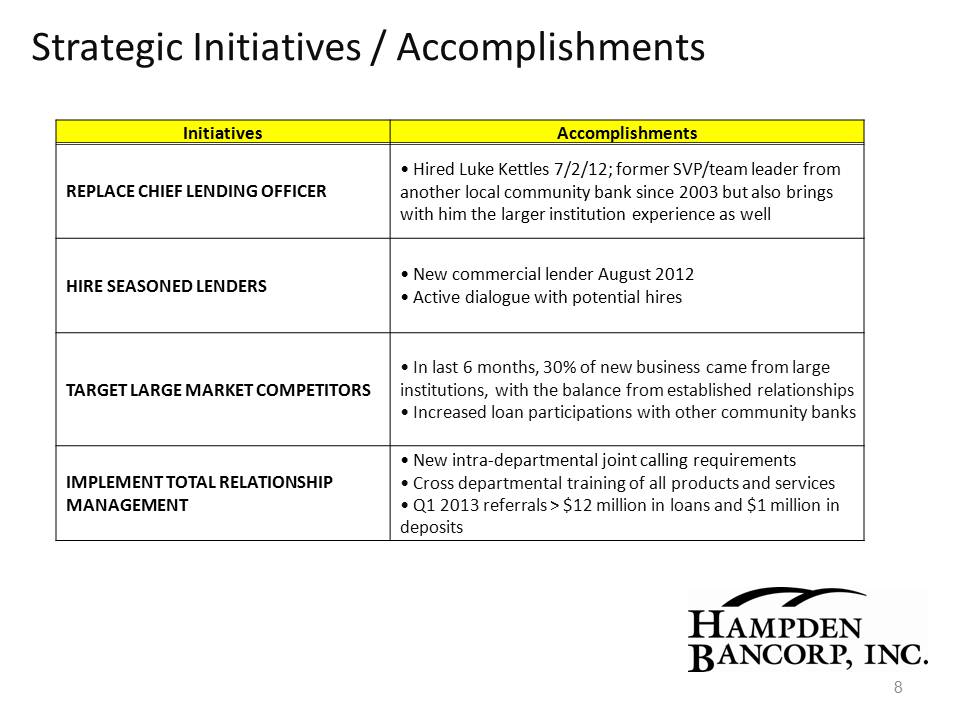
Strategic Initiatives / Accomplishments 8 Initiatives Accomplishments REPLACE CHIEF LENDING OFFICER • Hired Luke Kettles 7/2/12; former SVP/team leader from another local community bank since 2003 but also brings with him the larger institution experience as well HIRE SEASONED LENDERS • New commercial lender August 2012 • Active dialogue with potential hires TARGET LARGE MARKET COMPETITORS • In last 6 months, 30% of new business came from large institutions, with the balance from established relationships • Increased loan participations with other community banks IMPLEMENT TOTAL RELATIONSHIP MANAGEMENT • New intra‐departmental joint calling requirements • Cross departmental training of all products and services • Q1 2013 referrals > $12 million in loans and $1 million in deposits
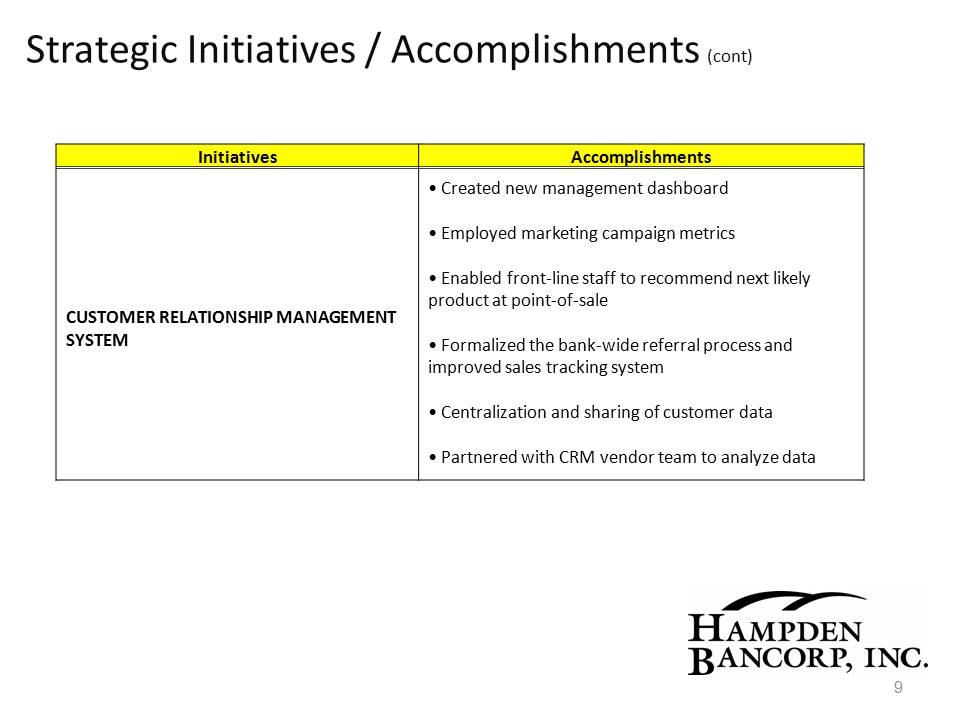
Strategic Initiatives / Accomplishments (cont) 9 Initiatives Accomplishments CUSTOMER RELATIONSHIP MANAGEMENT SYSTEM • Created new management dashboard • Employed marketing campaign metrics • Enabled front‐line staff to recommend next likely product at point‐of‐sale • Formalized the bank‐wide referral process and improved sales tracking system • Centralization and sharing of customer data • Partnered with CRM vendor team to analyze data
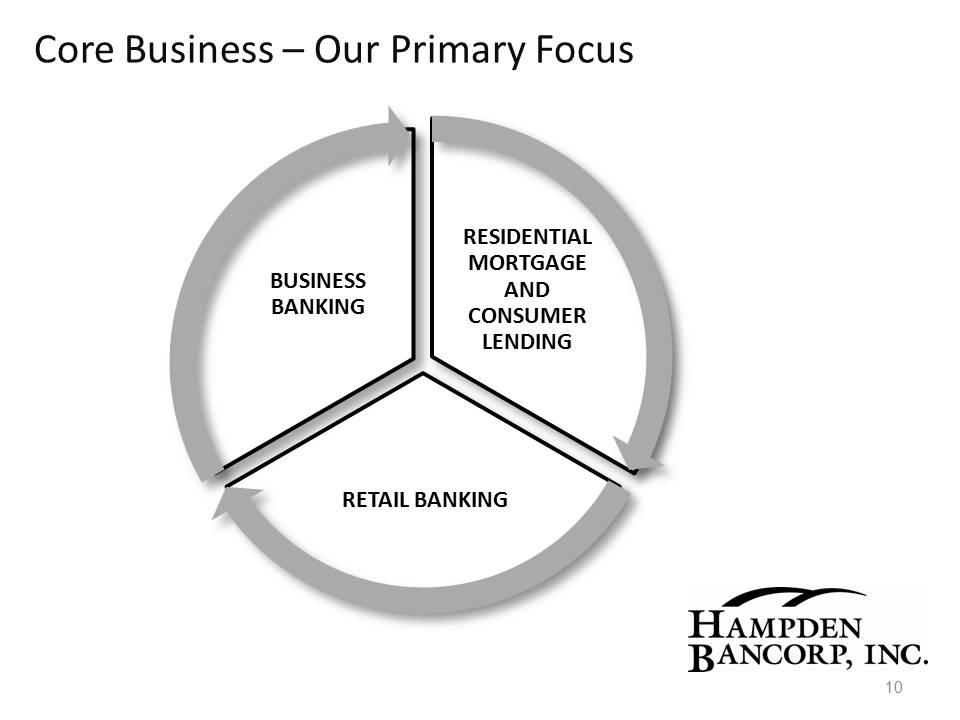
Core Business – Our Primary Focus 10 RESIDENTIAL MORTGAGE AND CONSUMER LENDING RETAIL BANKING BUSINESS BANKING
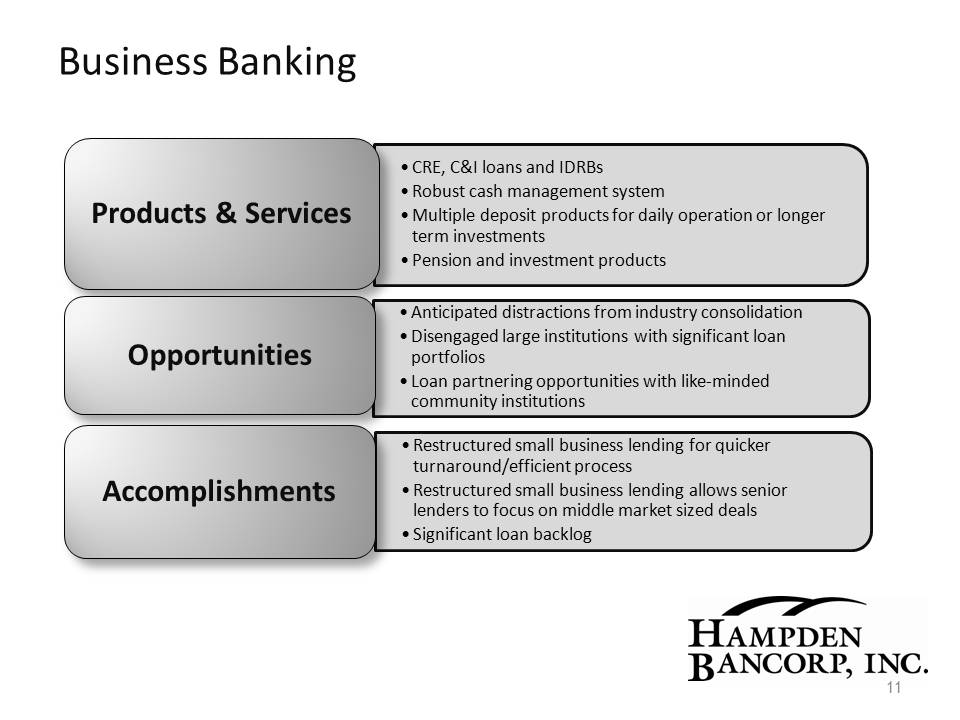
Business Banking 11 •CRE, C&I loans and IDRBs • Robust cash management system •Multiple deposit products for daily operation or longer term investments •Pension and investment products Products & Services • Anticipated distractions from industry consolidation •Disengaged large institutions with significant loan portfolios •Loan partnering opportunities with like‐minded community institutions Opportunities • Restructured small business lending for quicker turnaround/efficient process • Restructured small business lending allows senior lenders to focus on middle market sized deals •Significant loan backlog Accomplishments
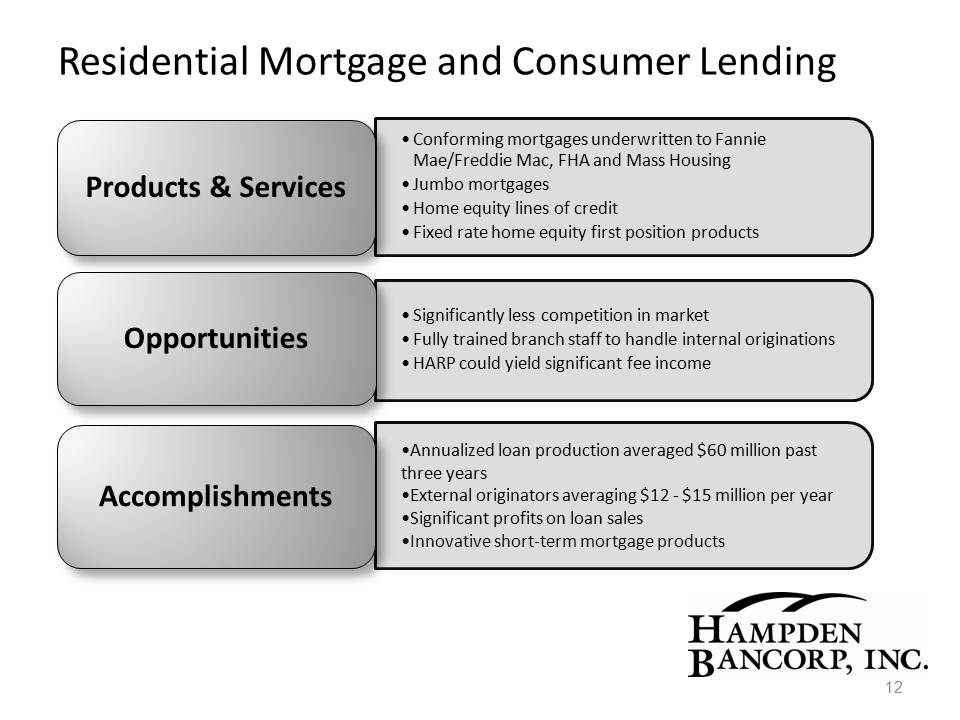
Residential Mortgage and Consumer Lending 12 •Conforming mortgages underwritten to Fannie Mae/Freddie Mac, FHA and Mass Housing • Jumbo mortgages •Home equity lines of credit •Fixed rate home equity first position products Products & Services • Significantly less competition in market • Fully trained branch staff to handle internal originations •HARP could yield significant fee income Opportunities •Annualized loan production averaged $60 million past three years •External originators averaging $12 ‐ $15 million per year •Significant profits on loan sales •Innovative short‐term mortgage products Accomplishments
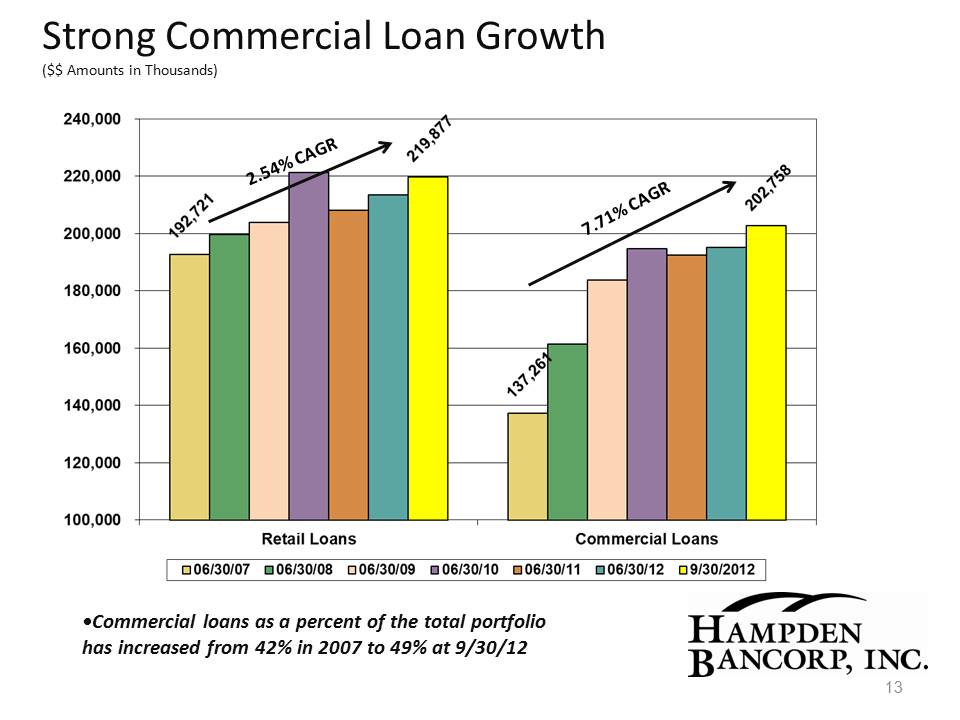
Strong Commercial Loan Growth ($$ Amounts in Thousands) 13 •Commercial loans as a percent of the total portfolio has increased from 42% in 2007 to 49% at 9/30/12
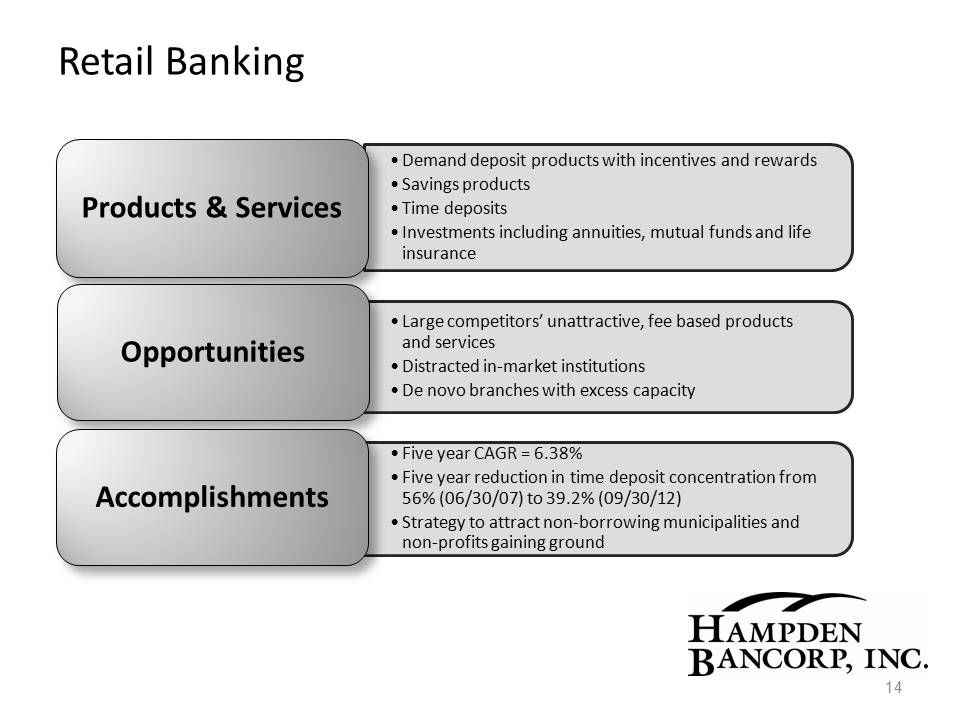
Retail Banking 14 •Demand deposit products with incentives and rewards •Savings products •Time deposits • Investments including annuities, mutual funds and life insurance Products & Services •Large competitors’ unattractive, fee based products and services •Distracted in‐market institutions •De novo branches with excess capacity Opportunities •Five year CAGR = 6.38% •Five year reduction in time deposit concentration from 56% (06/30/07) to 39.2% (09/30/12) • Strategy to attract non‐borrowing municipalities and non‐profits gaining ground Accomplishments
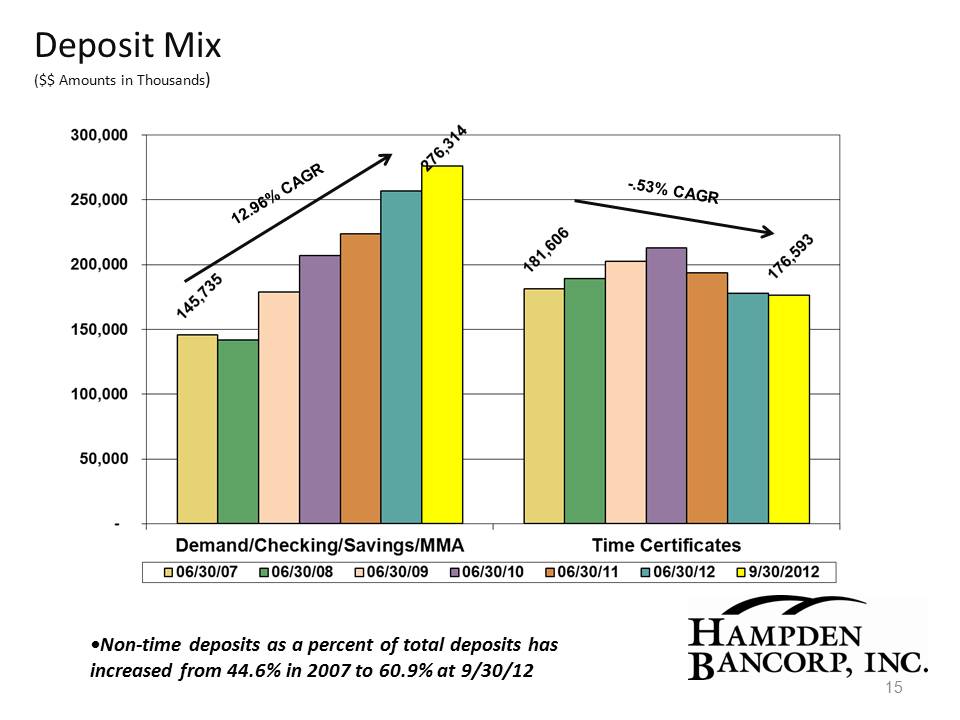
Deposit Mix ($$ Amounts in Thousands) 15 •Non‐time deposits as a percent of total deposits has increased from 44.6% in 2007 to 60.9% at 9/30/12
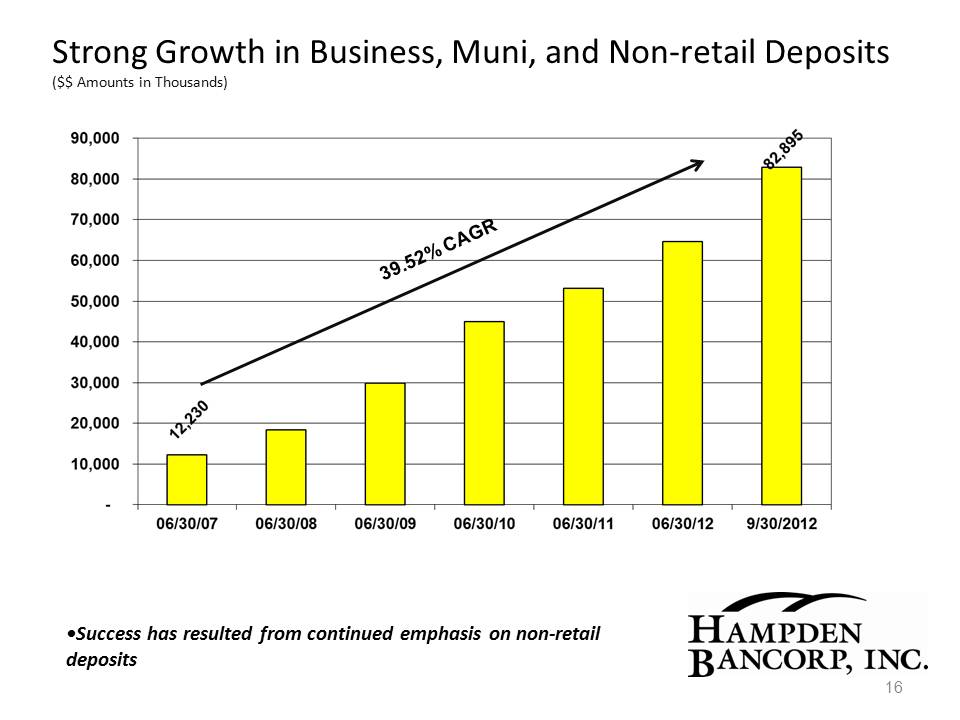
Strong Growth in Business, Muni, and Non‐retail Deposits ($$ Amounts in Thousands) •Success has resulted from continued emphasis on non‐retail deposits 16
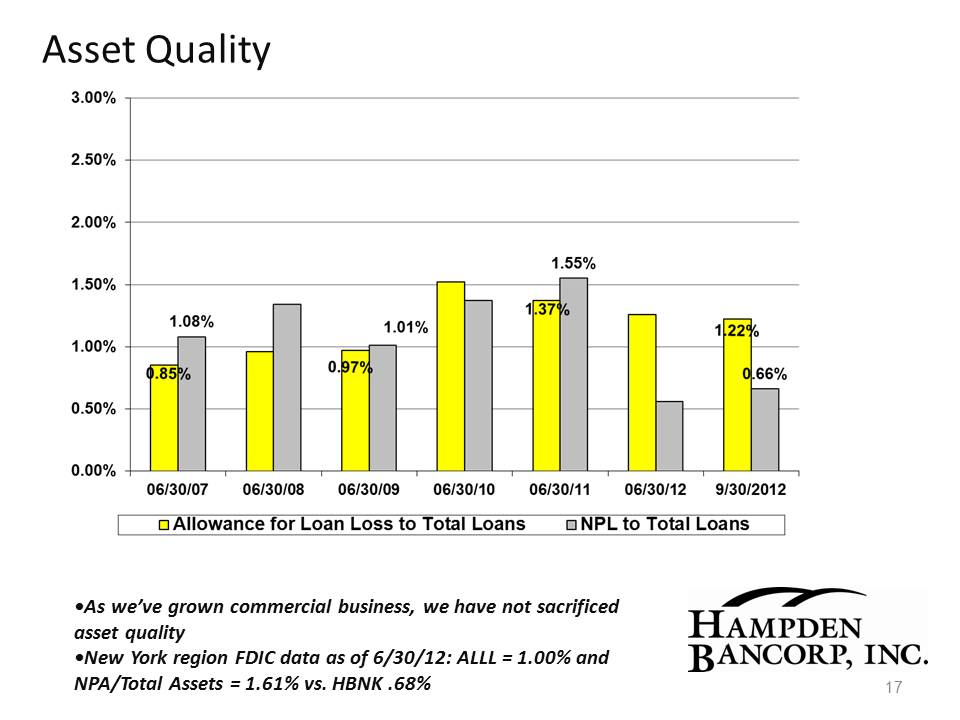
Asset Quality 17 •As we’ve grown commercial business, we have not sacrificed asset quality •New York region FDIC data as of 6/30/12: ALLL = 1.00% and NPA/Total Assets = 1.61% vs. HBNK .68%
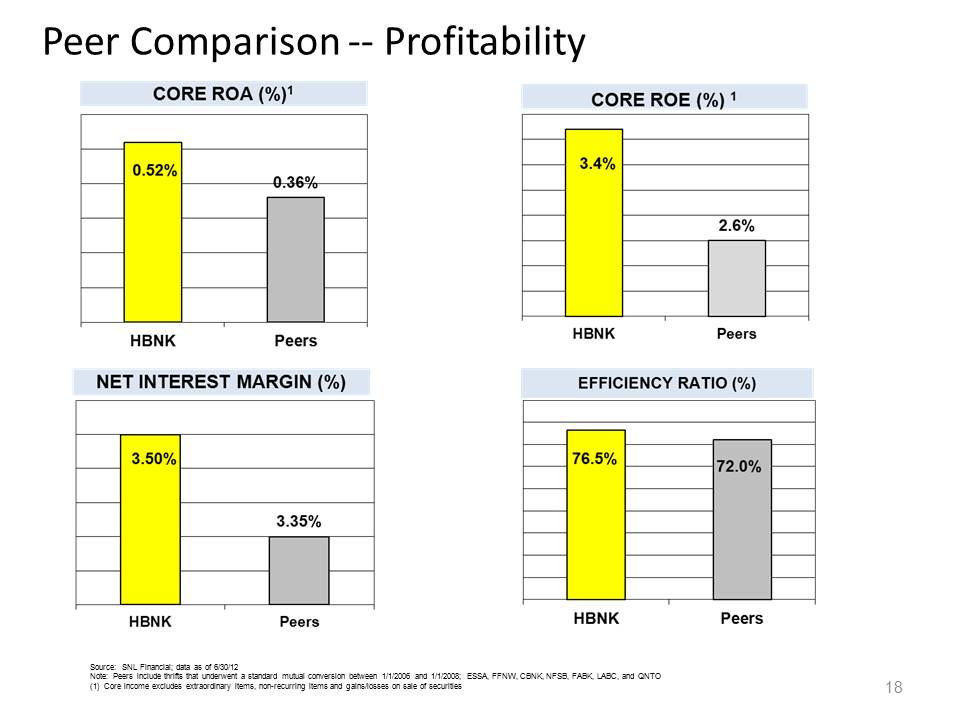
Peer Comparison ‐‐ Profitability 18 Source: SNL Financial; data as of 6/30/12 Note: Peers include thrifts that underwent a standard mutual conversion between 1/1/2006 and 1/1/2008; ESSA, FFNW, CBNK, NFSB, FABK, LABC, and QNTO (1) Core income excludes extraordinary items, non-recurring items and gains/losses on sale of securities
Slide: 19 Title: Why Invest in Us? Other Placeholder: 19 Strategically positioned franchiseEnergized management teamCommitment to strong operating performanceScalable platform built for long-term growthSuccessfully executing Strategic PlanDisciplined capital management