Attached files
| file | filename |
|---|---|
| 8-K - FORM 8-K - HYSTER-YALE MATERIALS HANDLING, INC. | d433220d8k.htm |
 BAIRD
INDUSTRIAL
CONFERENCE
November
6,
2012
Exhibit 99.1 |
 1
Safe Harbor Statement
The following information includes forward-looking statements within the meaning of
Section 27A of the Securities Act of 1933, as amended,
and
Section
21E
of
the
Securities
Exchange
Act
of
1934,
as
amended.
Any
and
all
statements
regarding
the
Company’s
expected future financial position, results of operations, cash flows, business
strategy, budgets, projected costs, capital expenditures, products, competitive
positions, growth opportunities, plans, goals and objectives of management for future operations, as well as
statements
that
include
words
such
as
“anticipate,”
“if,”
“believe,”
“plan,”
“estimate,”
“expect,”
“intend,”
“may,”
“could,”
“should,”
“will,”
and
other similar expressions are forward-looking statements. Such forward-looking
statements are inherently uncertain, and readers must recognize that actual
results may differ materially from the expectations of the Company’s management. The Company does not
undertake a duty to update such forward-looking statements. Factors that may cause
actual results to differ materially from those in the forward-looking
statements
include,
without
limitation,
reduction
in
demand
for
lift
trucks
and
related
aftermarket
parts
and
service
on
a
global basis; the ability of our dealers, suppliers and end-users to obtain
financing at reasonable rates, or at all, as a result of current economic and
market conditions; customer acceptance of pricing; delays in delivery or increases in costs, including transportation costs,
of
raw
materials
or
sourced
products
and
labor
or
changes
in
or
unavailability
of
quality
suppliers;
exchange
rate
fluctuations,
changes
in
foreign import tariffs and monetary policies and other changes in the regulatory
climate in the foreign countries in which we operate and/or sell products;
delays in manufacturing and delivery schedules; bankruptcy of or loss of major dealers, retail customers or suppliers;
customer acceptance of, changes in the costs of, or delays in the development of new
products; introduction of new products by, or more favorable product pricing
offered by, our competitors; product liability or other litigation, warranty claims or returns of products; the
effectiveness of the cost reduction programs implemented globally, including the
successful implementation of procurement and sourcing initiatives;
changes
mandated
by
federal,
state
and
other
regulation,
including
health,
safety
or
environmental
legislation;
and
other
risks
identified
in
the
Company’s
Registration
Statement
on
Form
S-1
and
other
filings
with
the
Securities
and
Exchange
Commission.
Many
of
these factors are outside of the Company’s control. |
 2
Hyster-Yale Snapshot
Hyster-Yale Materials Handling, Inc. (NYSE:HY)
Leading global designer, manufacturer and marketer of lift
trucks and provider of aftermarket parts and support
Headquartered in Cleveland, Ohio
Over 5,300 employees in 13 countries
LTM
9/30/12
revenue
–
$2.5
billion
LTM
9/30/12
net
income
-
$89.2
million
LTM 9/30/12 EBITDA
(1)
–
$145.5 million
9/30/12
net
debt
–
$0.3
million
cash
LTM 9/30/12 ROTCE
(1)
of 27.5% (Net Debt Basis)
_____________________
(1)
EBITDA and ROTCE are non-GAAP measures and should not be considered in isolation or
as a substitute for GAAP measures. For discussion of non-GAAP items and the related
reconciliations to GAAP measures, see pages starting on 35.
|
 3
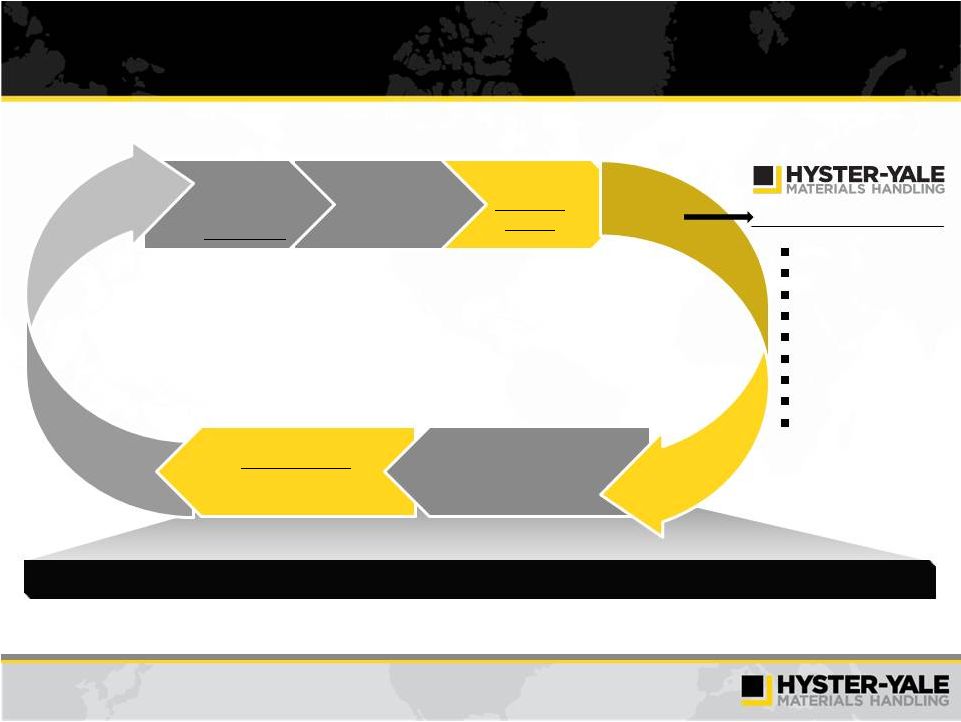
Economic Engine is Driven by Unit Volume
Volume
Economies
of Scale
Geographic
and Product
Balance
Worldwide
Distribution
Strength to Drive
Market Share
Parts and Service
Volume
Large Lift Truck
Population in Service
Design
Component Commonality
Supply Chain
Manufacturing
Quality
Marketing
Parts
Infrastructure
Capital Requirements
A large lift truck population base drives parts and service volume resulting in enhanced
profitability for dealers and Hyster-Yale Hyster-Yale’s model yields
competitive advantages Basic Business Areas |
 4
Parts and Service Contribution to
Hyster-Yale’s and Dealers’
Profitability
Average truck life of about 10 years
Hyster-Yale realizes significant additional parts margin over the life of an
average truck, in some cases, up to 85% of the new unit margin
–
Parts margin realization varies due to
Product life
Application / duty cycle
Product category
Focus on increasing parts margin realization
–
Lock in parts (for H-Y and dealer) and service (for dealer) with full service
contracts and/or fleet management
–
Understand needs of customer |
 5
Industry and Hyster-Yale Overview
Industry Overview
–
2001-2011 long-term unit market growth rate 5.7%
–
975,000 unit market globally in 2011 with Europe, Middle East and Africa at 38%,
Americas at 23% and Asia/Pacific at 39%
–
Hyster-Yale 2011 unit market share at 8% of global market and 21% of the Americas
market
Hyster-Yale Overview
–
#3 in units globally in 2011
–
Large installed base of 785,000 units worldwide
–
Serves broad set of markets
–
Internal
Combustion
Engine
(ICE)
units
at
57%,
Electric
units
at
26%,
Parts
and
Other at 17%
–
Global footprint |
 6
Growth near GDP levels in developed markets with emerging markets
driving expansion, particularly China
Strong demand for warehouse and distribution industry applications
Increasing focus on battery technology development
Integration of automated technology in products and processes
Importance of total lifecycle cost of ownership
Ongoing consolidation opportunities
Key Themes
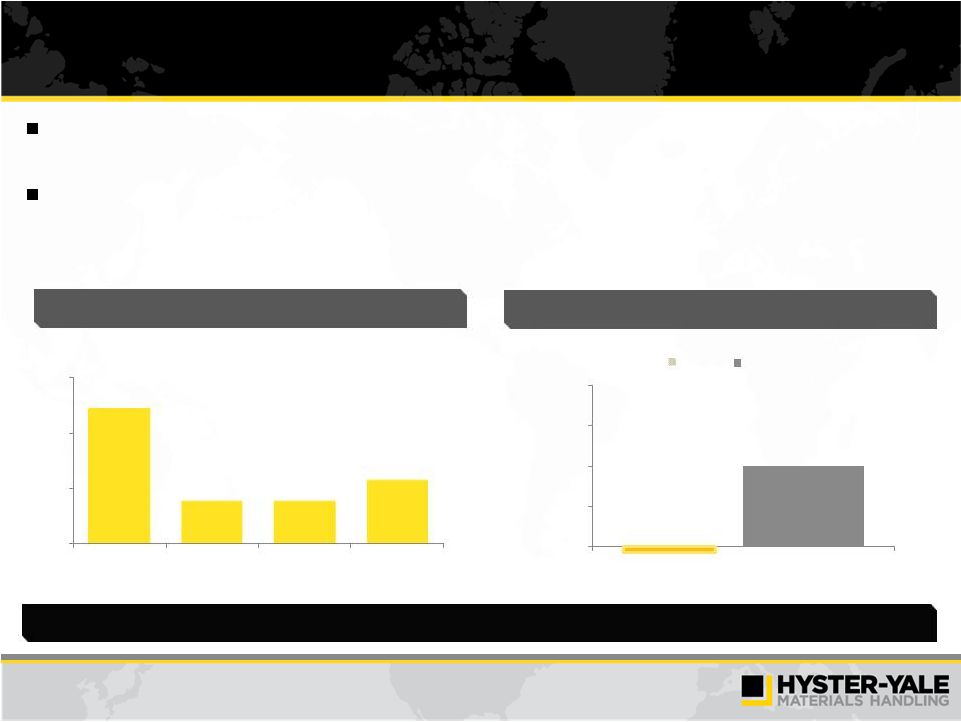
Industry Overview
(units in thousands)
Global Lift Truck Industry Size
_____________________
Source: WITS. Represents order intake.
Global Lift Truck Industry Breakdown
Lift Truck Market Share Overview
_____________________
Source: WITS and Company data. Represents order intake.
Global
Americas
_____________________
Source: WITS. Represents order intake.
Europe
33%
China
25%
Americas
23%
Japan
7%
Asia Pacific
7%
Middle East
5%
Hyster
-Yale
21%
Hyster
-Yale
8%
951
872
547
794
975
0
300
600
900
1,200
2007
2008
2009
2010
2011
Long-term CAGR (2001 –
2011) = 5.7% |
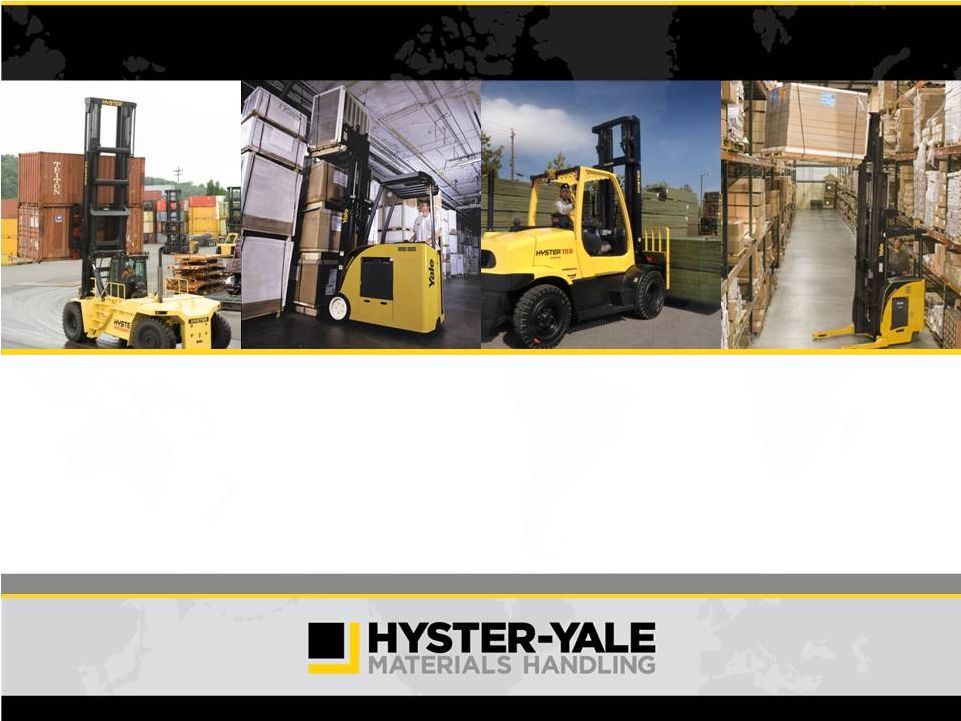
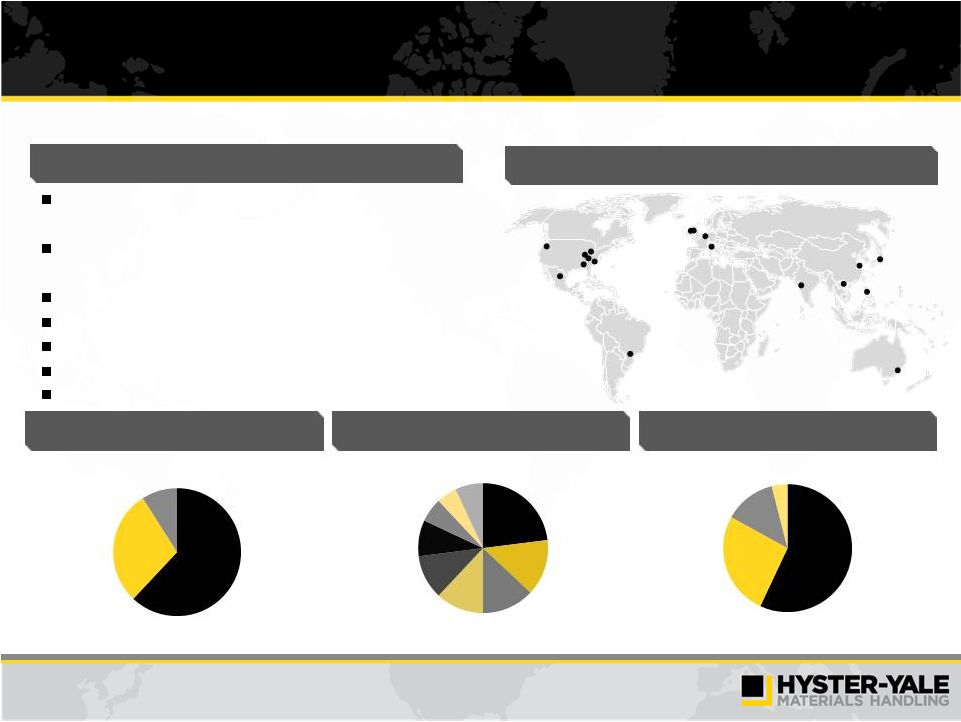 7
Hyster-Yale Overview
Leading global lift truck brands in terms of units sold
–
#3 globally
Large installed base that drives parts sales
–
Over 785,000 units worldwide
Diverse customer and application base
Global independent dealer network
Comprehensive, updated global product line
Globally integrated operations with economies of scale
Experienced management team
_____________________
(1)
Represents Hyster-Yale North American unit shipments by industry.
(2)
Includes Big Truck sales that represent 9% of total sales.
Key Highlights
Global Footprint
2011 Sales by Geography
2011 Retail Shipments by End Market
(1)
2011 Worldwide Sales by Product
Electric Units
26%
Internal
Combustion
Engine
(“ICE”)
Units
(2)
57%
Parts
13
%
Other
4%
Manufacturing
23%
Wholesale
Distribution
14%
Home Centers /
Retail
13%
Rental
12%
Food & Beverage
11%
Freight & Logistics
9%
Paper
6%
Auto
5%
Other
7%
Americas
62%
Europe, Africa &
Middle East
29%
-
Asia-Pacific
9% |
 8
Global Distribution Network and Diverse Global
Customer Base
Global Distribution Network
–
Established brand strength
–
Independent dealer network
–
Complimented by a large national accounts program
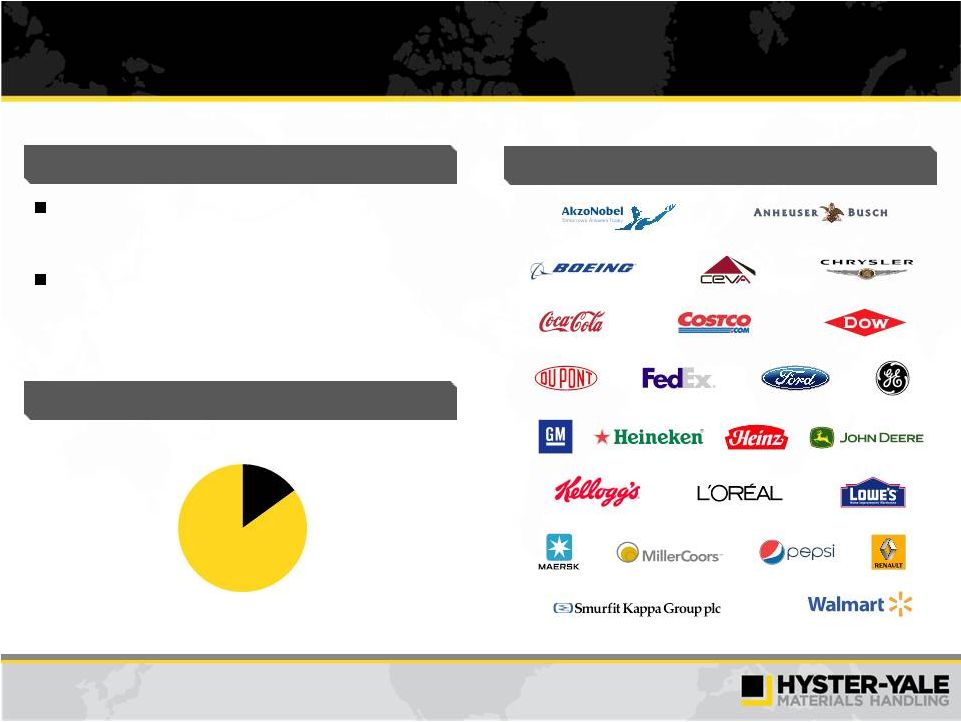
Diverse Global Customer Base
–
Blue chip customer base
–
No industry or customer concentration |
 9
Global Distribution Network
with Large Installed Base
Two brand network strategy optimizes local presence
and customer reach
–
Presence in over 130 countries worldwide
–
Increasing use of dual brand representation
Key differentiating factors:
–
Long-term relationships with dealers
–
Territorial exclusivity encourages strong, long-
term relationships with customers
–
Brand exclusivity ensures dealers’
selling efforts
focused on Hyster-Yale products
Hyster-Yale supports its dealer network purchases
through strong financing services with concentration on
a long-standing partnership with GE Capital primarily
with NMHG Financial Services, Inc., (“NFS”) in North
America, and with established financing relationships in
other regions
Hyster and Yale brands supported by strength of Hyster and Yale’s global independent
dealer network Sales of more than 79,500 units in 2011
–
Sales of more than 4,500 units at Sumitomo
NACCO JV in 2011 in Japan
Installed base of approximately 785,000 lift trucks
Utilized in more than 700 industries
No industry or customer concentration
Hyster-Yale primarily markets lift trucks and
aftermarket parts under two well-recognized and
respected brand names that resonate performance
and quality
Hyster
–
manufacturer
of
lift
trucks
since
1934
Yale
–
manufacturer
of
lift
trucks
since
1920
Large Installed Base Across Diverse Markets
Established Brand Strength
Independent Dealer Network |
 10
Diverse Global Customer Base and Served Markets
National Accounts
Worldwide Channel Mix
Blue Chip Customer Base
Focused on strategic customers with centralized
purchasing and geographically dispersed operations
across dealer territories
Fleet Management Program provides customers with
value-added services that include service,
aftermarket parts and comprehensive management
of materials handling needs
National
Accounts
15%
Independent
Dealers
85% |
 11
Key Highlights
Current strong position with significant improvement plans in
–
Products
–
Manufacturing
–
Supply Chain
–
Quality
–
Dealer Network
–
Operating Expenses
–
People |
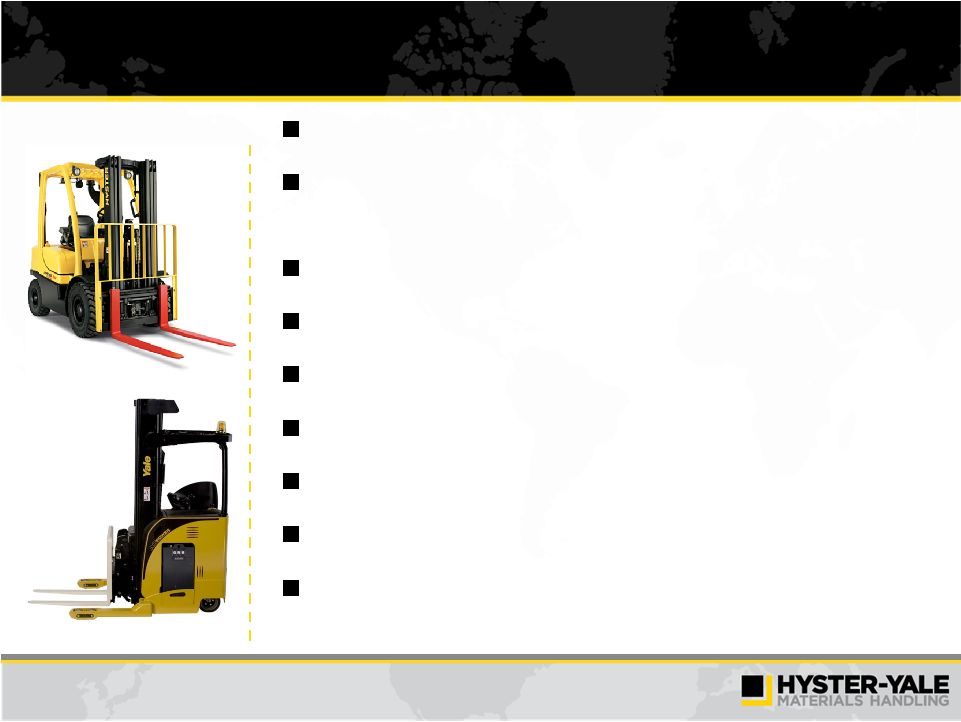
 12
Key Highlights
Comprehensive, updated global product line
Product development for 2013
2014 focuses on:
Completing
introduction
of
full
line
of
next
generation
electric
rider
products
including
some
with
“ICE
like”
capabilities
Updating narrow aisle products with latest technology for increased productivity and
robustness Enhancing
the
motorized
hand
riders
for
the
most
demanding,
high
hour
usage
Adding a range of utility and standard models to the core premium line for the ICE
products Globally integrated, lean operations with economies of scale
Assemble in market of sale
Focus on continuous improvement in lean processes, quality and cost control
Highly flexible low cost supply chain
Substantial
sourcing from low cost countries
Continuing to reduce number of suppliers
Extend supplier quality program
Focus on continuous improvement
-
Manufacturing
Supply Chain
Products |
 13
Key Highlights (continued)
Quality
Reliability engineering and lean manufacturing focus have led to low warranty costs
and increased customer satisfaction
Focus on continuous improvement
Dealer Network
Global independent, exclusive dealer network
Increasing use of dual brand representation
Strengthen networks by attracting new dealers and building on stronger dealers
Enhance services to make dealers more profitable and productive
Operating
Expenses
Efficient operating structure
Focus on continuous improvement in dealer performance, sales coverage and productivity
and pricing processes
People
Experienced management team
Focus on continuous improvement in:
Recruiting
Talent Management
Training
|
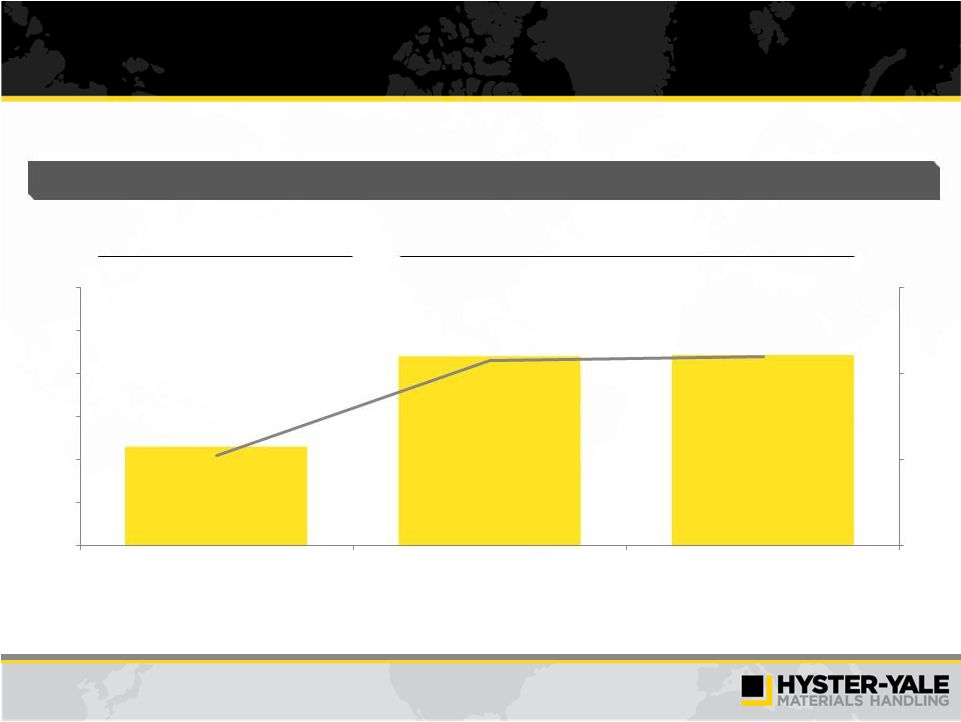 14
Operating Profit Margins
have Substantially Improved
Prior Cycle Market Peak
Mid-cycle Market
Operating Profit $ and % of Sales
($ in millions)
$57.3
$110.0
$110.7
2.1%
4.3%
4.4%
0.0%
2.0%
4.0%
6.0%
$0
$25
$50
$75
$100
$125
$150
2007
2011
2012 LTM |
 15
Gap to Target Economics
Goal
of
achieving
minimum
operating
margin
of
7%
at
mid-cycle
over
the
next
3
–
5
years
2012 LTM Gap to Target Economics
Gap equals: (2.6% ) / $63m
Margin Variances:
Target economics Gap Closure
can be achieved by:
1.
Increased margin on ICE trucks
-
Segmentation
-
Low Cost of Ownership
2.
Unit volume
-
Share Growth
-
Stronger Industry
-
Achieve Operating Leverage
–
–
Volume Variances:
–
–
Unit Margins
(1.1%)
Other
0.9%
Manufacturing Variances
(1.4%)
Operating Expenses
(1.0%) |
 16
Five Key Strategic Initiatives to Drive Margins and
Market
Share
Over
the
Next
3
-
5
Years
Unit Margin
Unit Share
Masters of the World of Low Cost Ownership
Significantly Improve Warehouse Business
Position
Enhance Independent Distribution
Succeed in Asian Markets
Enhanced Understanding of Customer Needs to
Drive Tailored Solutions
|
 17
Masters of the World of Low Cost of Ownership
Strategic Objectives
Key Elements
Key Deliverables and Timing
Strategic Advantages |
 18
Opportunity for a holistic approach:
–
Operator / Truck / Energy
–
Service / Safety / Rejuvenation / End of Life
Strategic Advantages
Strategic Objectives
Key Elements
Key Deliverables and Timing
Masters of the World of Low Cost of Ownership
Sell More Trucks
Sell More Parts
Sell More Services
Understand Major Cost Drivers:
Short Term (2013)
–
LCO metrics vs. competition/convert into
marketing materials for salesforce
Medium / Long Term
–
Expand fleet management to offer LCO-
based services
By Delivering Lowest Cost of Ownership
(LCO) in all target applications
And develop solutions that constantly
lower cost of ownership and create
differentiated competitive position
To create sustainable customer benefit
and competitive differentiation
Indirect (safety, litigation, pollution)
Direct (truck price, fuel, service, operator) |
 Significantly Improve Warehouse Business Position
Strategic Objectives
Key Deliverables and Timing
Strategic Advantages
19
Key Elements |
 20
Meets needs of specialist market while leveraging
economies of scale
Focus on the sales/ consultancy process while
leveraging its distribution network after-sales
support
Two brands covering entire market opportunity,
focused on different customer segments
Strategic Advantages
Strategic Objectives
Key Elements
Key Deliverables and Timing
Focused approach to gain share against
specialized market leaders
Improve dealer value proposition
Engage dealers to develop warehouse focus
Develop product gap closure plans
Direct support for dealer sales
Identify, qualify, assign and track performance of
key customers
Performance guarantees and protection of
residual values
Detailed project plans 2012
Dedicated warehouse specialist teams in place
–
US: Q1 2013
Product enhancements complete Q2 2013
Dealer engagement program Q2 2013
Significantly Improve Warehouse Business Position |
 21
Enhanced Independent Distribution
Strategic Objectives
Key Elements
Key Deliverables and Timing
Strategic Advantages |
 22
Exclusive, independent distribution
Two brands covering entire industry opportunity,
focused on different market segments with a
comprehensive product range
Strategic Advantages
Strategic Objectives
Key Elements
Key Deliverables and Timing
Recruit/develop strongest dealers in each territory
Ensure opportunities for dealers to make strong
returns on investment
Combine dealer entrepreneurship and performance
excellence with OEM support
Dual brand strategy
Sales specialization
Dedicated dealer development team
Identify, qualify, assign and track performance of
key customers
Dealer restructuring ongoing
–
2013 -
2016
Dealer excellence
–
Ongoing
Customer / market intelligence
–
Teams formed and deliverables defined
Enhanced Independent Distribution |
 23
Succeed in Asian Markets
Strategic Objectives
Key Elements
Key Deliverables and Timing
Strategic Advantages |
 24
Strong Partners
Restructured Product Offerings
Improved / New Dealer Organization
Strengthened Customer Facing Organization
Better dealer management
Enhanced support structure
Strategic Advantages
Strategic Objectives
Key Elements
Key Deliverables and Timing
Enhanced Dealer Organization and Structure
Develop Strategic Partners
Sales/engineering/manufacturing/sourcing
Local presence in Asia and India
Add New Products tailored to market opportunity
Strategic Alliances for New Products/Components
Build on Sumitomo Strength with Japanese
Customers
Strong local partners in China, India & Japan
Greater
“Fit
for
Market”
Product
Offering
Increased
Asian
presence –
2013
Strengthen
Dealer
Organization –
2013
Develop partners / alliances through 2014
Succeed in Asian Markets |
 25
Enhanced Understanding of Customer
Needs to Drive Tailored Solutions
Strategic Objectives
Key Elements
Key Deliverables and Timing
Strategic Advantages |
 26
Deep understanding of the market place and
dynamics
Build relationships with key customers in target
industries
Tailored solution for any application with the right
truck
Development of a culture that understands the
market and what it takes to win
Best product fit for customer application
Related services to maximize customer
satisfaction
Understand customer needs at a detailed level
Create differentiated product/service solutions and
more effective selling materials describing our
benefits vs. competition
Tailored Application Solutions
–
Develop industry strategies and application
guides
Product Positioning
–
New models focus on cost effectively serving
the
utility
and
standard
market
needs
and
relieve price pressure on premium products by
refocusing on the premium segments
Enhanced Understanding of Customer
Needs to Drive Tailored Solutions
Results
in:
–
Market
Share
Growth
–
Achievement
of
Target
Margin
Key Deliverables and Timing
Strategic Advantages
Strategic Objectives
Key Elements |
 27
Positive Environment for Hyster-Yale to Gain Share
and
Margin
Performance
Over
Next
3
-
5
Years
Product gaps filled to position H-Y in most application segments and improve
margins
Favorable cost structure relative to Japanese-centric and German-centric
competitors
Second-tier competitors in the ICE segment more vulnerable due to their
weakened economy of scale position and currency
Key warehouse segment competitors are regional
Key Big Truck segment competitors are niche |
 28
Share Gain Focus Varies by Market
Region
Focus
North America
Improve warehouse business position by enhancing product and non-product services
Continue to implement dual brand dealer network strategy
Europe and Other
Developed Markets
Strengthen dealer networks by attracting new dealers and building upon our stronger
dealers Leverage international customers to penetrate large accounts
Improve warehouse business position by enhancing product and non-product services
Enhance ICE share by focusing on standard and utility products
Developing Markets
Leverage ICE strength by supplementing current premium offering with utility and
standard products Strengthen dealer organization
|
 29
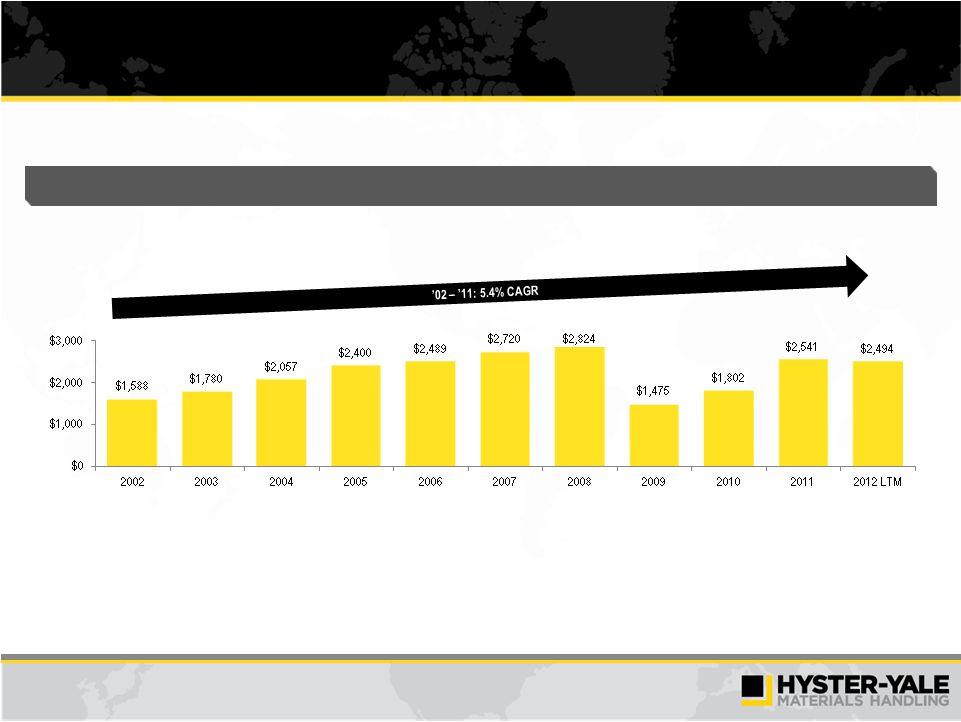
Historical Revenue
______________________________
Note: 2012 LTM as of September 30, 2012.
Revenue
($ in millions) |
 30
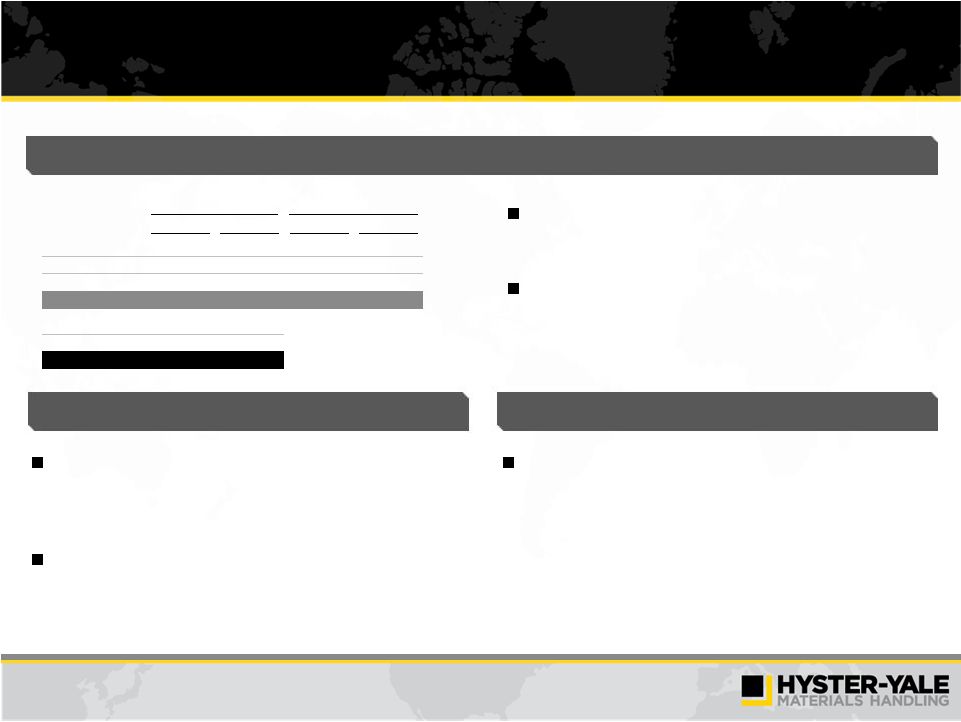
Q3 2012 and LTM Highlights
2012 Third Quarter
9/30/12 LTM
$
%
$
%
Revenue
$585.6
100.0%
$2,494.5
100.0%
Operating Profit
28.3
4.8%
110.7
4.4%
Net Income
24.9
4.3%
89.2
3.6%
EBITDA
(1)
$37.8
6.5%
$145.5
5.8%
Debt
$144.7
Cash
145.0
Net Debt
($0.3)
_____________________
(1)
EBITDA
is
a
non-GAAP
measure
and
should
not
be
considered
in
isolation
or
as
a
substitute
for
GAAP
measures.
For
discussion
of
non-GAAP
items
and
the
related
reconciliations
to
GAAP
measures,
see
pages
starting
on
35. |
 31
2012
Third
Quarter
9/30/12
LTM
$
%
$
%
Revenue
$585.6
100.0%
$2,
494.
5
100.0%
Operating Profit
28.3
4.8%
110.7
4.4%
Net Income
24.9
4.3
%
89.2
3.6%
EBITDA
$37.
8
6.5
%
$14
5.5
5.8%
Debt
$144.7
Cash
145.0
Net Debt
Q3 2012 Highlights
Q3 2012 Results
Hyster-Yale
Outlook
–
Long
Term
Revenue pressure from unfavorable foreign currency
movements due to the weakening euro and Brazilian real
and lower year-over-year unit shipments.
Net income favorable to the third quarter of 2011 due to
improved unit price, unit mix movement towards higher
value/margin products and favorable impact of FX
contracts.
Fourth quarter global lift truck market expected to continue
to moderate, with global volumes down slightly from the prior
year. Weakness in Western Europe, Japan and Latin
America offset by small improvements in other markets.
Backlog of almost 25,600 units represents 16 weeks of
production
and
supports
4
quarter
production
plan.
($ in millions)
Hyster-Yale
Outlook
–
Short
Term
Hyster-Yale is focused on increasing operating profit
margins by increasing market share and improving product
margins to target levels
–
Focus on the 5 strategic initiatives
–
Selective new product introductions
_____________________
(1)
EBITDA
is
a
non-GAAP
measure
and
should
not
be
considered
in
isolation
or
as
a
substitute
for
GAAP
measures.
For
discussion
of
non-GAAP
items
and
the
related
reconciliations
to
GAAP
measures,
see
pages
starting
on
35.
th
(1)
($0.3) |
 32
Strong Free Cash Generation and Conservative
Capital Structure
Hyster-Yale has had strong cash flow, generating $258 million cumulative cash flow
before financing from 2009 to 2012 YTD –
$145 million cash on 9/30/12
Hyster-Yale has a conservative capital structure
–
Gross debt leverage is 1.0x EBITDA
–
Net debt leverage is 0.0x EBITDA
Debt / LTM EBITDA
(2)
Stability to weather market changes with significant flexibility
for growth
Cash Flow before Financing
(1)
($ in millions)
0.0x
Net Debt
Gross Debt
_____________________
.(1)
Cash Flow before Financing is defined as cash from operating activities less cash from
investing activities. (2) EBITDA
is
a
non-GAAP
measure
and
should
not
be
considered
in
isolation
or
as
a
substitute
for
GAAP
measures.
For
discussion
of
non-GAAP
items
and
the
related
reconciliations
to
GAAP
measures,
see
pages
starting
on
35.
$122
$39
$39
$58
$0
$50
$100
$150
2009
2010
2011
2012 YTD
1.0x
0.0x
0.5x
1.0x
1.5x
2.0x
9/30/12
(1) |
 33
Why Invest in Hyster-Yale?
1)
Leading position in growing industry benefiting from globalization and worldwide
economic recovery and development
2)
Premier brands, comprehensive global product line and exclusive,
global independent distribution
network
3)
Strong economic engine driven by volume economies of scale
4)
Focused
strategic
initiatives
to
gain
market
share
and
enhance
margins
over
next
3
–
5
years
5)
High potential for partnership and consolidation opportunities
6)
Strong balance sheet, financial flexibility and attractive returns on capital
employed 7)
Focused investment in capital goods sector with growth opportunity:
a)
In developed countries from exposure to goods movement, distribution and warehousing
b)
In
developing
countries
(Brazil,
Eastern
Europe,
India
and
Asia)
from
exposure
to
industrialization |
 Appendix |
 35
Non-GAAP Disclosure
EBITDA
and
return
on
total
capital
employed
are
not
measurements
under
U.S.
GAAP,
should
not
be
considered
in
isolation or as a substitute for GAAP measures, and are not necessarily comparable with
similarly titled measures of other companies. Hyster-Yale defines each
as the following: For reconciliations from GAAP measurements to non-GAAP
measurements, see pages 36 and 37. EBITDA is defined as income before income
taxes and non-controlling interest (income) expense plus net interest
expense and depreciation and amortization expense; Return on total capital
employed (“ROTCE”) is defined as net income before interest expense, after
tax, divided by LTM average capital employed. LTM average capital employed is
defined as LTM average equity plus LTM average debt less LTM average
cash. |
 36
Non-GAAP Reconciliation
Year Ended December 31
LTM
2009
2010
2011
9/30/2012
Reconciliation of EBITDA
Net income (loss) attributable to stockholders
($43.1)
$32.4
$82.6
$89.2
Noncontrolling interest (income) loss
(0.1)
(0.1)
–
0.1
Income taxes provision (benefit)
(3.6)
1.8
18.9
15.9
Interest expense
19.0
16.6
15.8
13.6
Interest income
(2.8)
(2.3)
(1.8)
(1.5)
Depreciation and amortization expense
36.2
33.9
31.3
28.2
EBITDA
$5.6
$82.3
$146.8
$145.5
Reconciliation of cash flow from operations to EBITDA
Cash flow provided by operations
$115.9
$47.5
$54.6
$134.3
Change in working capital items
(113.7)
(6.6)
73.1
(21.5)
Gain (loss) on sale of assets and businesses
1.4
(6.1)
(0.2)
(0.1)
Restructuring (charges) reversals
(9.3)
1.9
–
–
Difference between deferred income taxes and total tax provision (benefit)
(32.1)
1.0
5.2
14.4
Other non-cash items
27.2
30.3
0.1
6.3
Interest expense, net
16.2
14.3
14.0
12.1
EBITDA
$5.6
$82.3
$146.8
$145.5
($ in millions)
_____________________
Note: *EBITDA is provided solely as a supplemental disclosure. EBITDA does not represent
net income or cash flow from operations, as defined by U.S. GAAP and should not be considered as a substitute for net income or net loss, or as an indicator of operating
performance or whether cash flows will be sufficient to fund cash needs. Hyster-Yale
defines EBITDA as income before income taxes and non-controlling interest income plus net interest expense and depreciation and amortization expense. EBITDA is not a
measurement under U.S. GAAP and is not necessarily comparable with similarly titled
measures of other companies. |
 37
Non-GAAP Reconciliation (continued)
($ in millions)
Reconciliation of Return on Total Capital Employed (ROTCE)
9/30/12 LTM
LTM Average Equity (9/30/12, 6/30/12, 3/31/12, 12/31/11 and 9/30/11)
$323.2
LTM Average Debt (9/30/12, 6/30/12, 3/31/12, 12/31/11 and 9/30/11)
192.7
LTM Average Cash (9/30/12, 6/30/12, 3/31/12, 12/31/11 and 9/30/11)
(160.8)
LTM average capital employed
$355.1
LTM Net income
$89.2
Plus: LTM Interest expense
13.6
Less: Income taxes on LTM interest expense at 38%
(5.2)
Actual return on capital employed = actual net income before interest expense, after tax
$97.6
Actual return on capital employed percentage
27.5%
_____________________
Note: Return on capital employed is provided solely as a supplemental disclosure with
respect to income generation because management believes it provides useful information with respect to earnings in a form that is comparable to the Company’s cost of capital
employed,
which
includes
both
equity
and
debt
securities,
net
of
cash. |
 38
Cash Flow before Financing Calculation
($ in millions)
Year Ended December 31
Trailing 12 Months
2009
2010
2011
9/30/2012
Reconciliation of Cash Flow before Financing
Net cash provided by (used for) operations
$115.9
$47.5
$54.6
$134.3
Net cash provided by (used for) investing activities
5.8
(8.5)
(15.9)
(15.9)
Cash Flow before Financing
$121.7
$39.0
$38.7
$118.4
|
 Supplemental Perspective |
 40
Mission Statement
Be a leading globally integrated designer,
manufacturer and marketer of a complete range of
high quality,
application-tailored lift trucks, offering
the lowest cost of ownership, outstanding parts
and service support and the best overall value |
 41
Experienced Management Team
Alfred M. Rankin Jr.
Chairman, President and
Chief Executive Officer
Chairman, President and CEO of NACCO Industries since 1994
Former Vice Chairman, Chief Operating Officer and Director of Eaton
Corporation
Michael Brogan
President and CEO, NACCO Materials
Handling Group (“NMHG”)
Former Executive Vice President, International Operations of NMHG
Joined NMHG in 1983
Former President, NMHG Americas
Joined NMHG in 1988
Colin Wilson
Vice President and COO
Previously Divisional President at Villeroy and Boch
AG and VP of Group Marketing at Linde AG
Joined NMHG in 2006
Ralf Mock
Managing Director, Europe,
Africa and Middle East
Former VP, Chief Marketing Officer of NMHG
Formerly, SVP Strategy & Product Development,
Case Corporation
Joined NMHG in 1995
Victoria Rickey
Vice President, Asia-Pacific
Rajiv Prasad
Vice President, Global
Product Development and
Manufacturing
Former VP, Global Product Development of NMHG
VP Global Product Development for International
Truck, Navistar
Joined NMHG in 2007
Charles Bittenbender
Vice President, General
Counsel and Secretary
Previously Deputy General Counsel of G.D. Searle &
Co.
Joined NACCO in 1990
Kenneth Schilling
Vice President and CFO
Previously CFO of NMHG and Vice President and
Controller of NACCO
Joined NACCO in 1991
Hyster-Yale’s Executive Leadership |
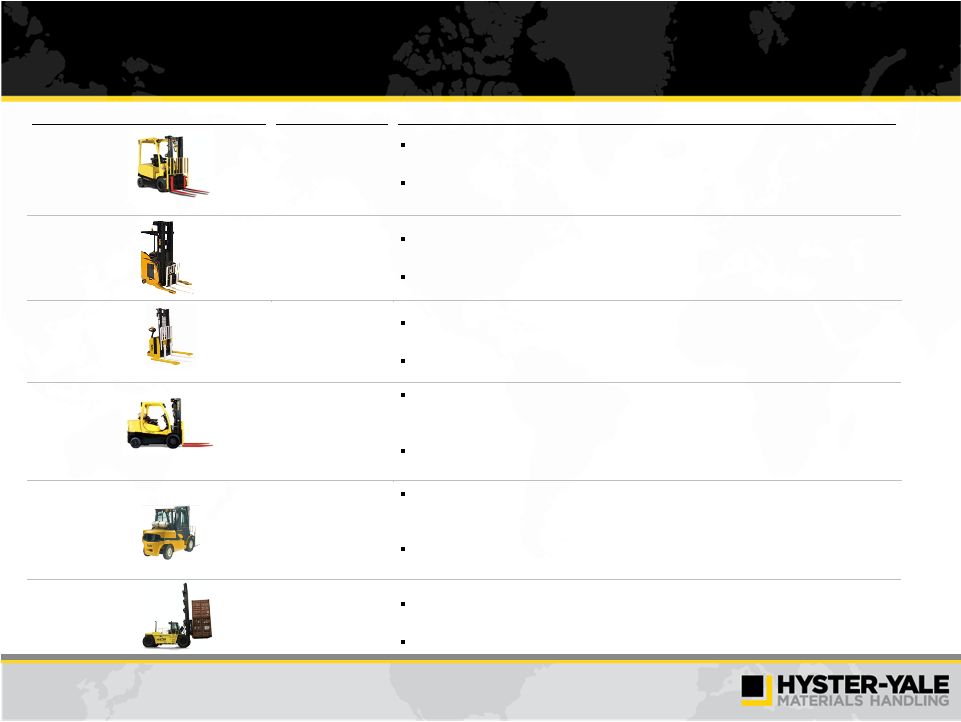 42
Class
Capacity Range
Description / Illustrative Application
Class I
1 ton – 5.5 tons
Electric counterbalanced trucks used in warehousing and manufacturing operations
where noise or fuel emissions are undesirable
A distribution center customer uses a Class I truck to move pallets from one trailer
to another
Class II
1.5 tons – 6 tons
Electric narrow aisle trucks used indoors to handle high-density storage of
materials in narrow-aisled buildings
Retail and warehouse customers rely on Class II trucks to pick orders off their
shelves Class III
1.5 tons – 8 tons
Electric hand trucks used indoors and outdoors for applications requiring the user to
select and transport materials
Retail customers use Class III trucks to move pallets of goods to their store aisles
Class IV
1 ton – 7 tons
Internal combustion engine counterbalanced trucks with cushion tires used indoors in
warehousing and manufacturing operations and outdoors on smooth surfaces.
Utility, standard and premium models for different customer applications.
A customer relies on Class IV trucks to move heavy parts on a pallet from the
machining area in a factory to assembly
Class V
1 ton – 8 tons
Internal combustion engine counterbalanced trucks with pneumatic tires used indoors
and outdoors in warehousing and manufacturing operations. Utility, standard and
premium models to address different customer applications.
A warehouse or manufacturer relies on Class V trucks to move coils of steel from the
mill to a storage area
Class V Big
Trucks
8
ton – 52 tons
Internal combustion engine counterbalanced trucks with pneumatic tires used indoors
and outdoors in ports and heavy manufacturing operations
A port relies on Class V Big Trucks to move containers from the port to a rail area
Comprehensive Updated Global Product Line |
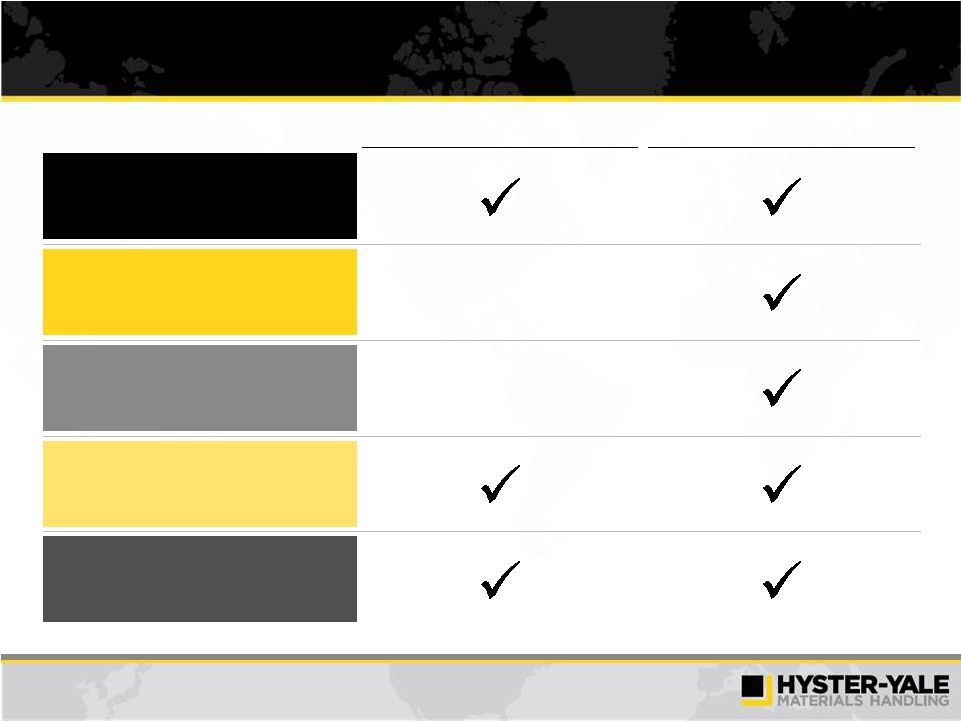
 43
Key Investment Highlights
Leading Market
Share in Materials
Handling
Comprehensive
Global Product Line
Large Installed
Base Worldwide
Established
Brand Strength
Global
Independent Dealer
Network
Long-Term
Relationships
with Diverse
Customer Base
Experienced
Management Team
Modest Leverage
& Strong
Cash Flow
High-Impact
Strategic Initiatives
Continuous Focus on
Product Development
and Innovation
Worldwide
Economies
of Scale
Highly Flexible,
Low Cost Supply Chain
and Efficient Operating
Structure
Global Scope of
Manufacturing |