Attached files
| file | filename |
|---|---|
| 8-K - FORM 8-K - STIFEL FINANCIAL CORP | d435200d8k.htm |
| EX-99.1 - PRESS RELEASE - STIFEL FINANCIAL CORP | d435200dex991.htm |
 3
rd
Quarter
2012
Financial Results Presentation
November 5, 2012
Exhibit 99.2 |
 1
Disclaimer
This presentation may contain “forward-looking statements” within the meaning of
the Private Securities Litigation Reform Act of 1995 that involve significant risks,
assumptions, and uncertainties, including statements relating to the market opportunity and future business
prospects of Stifel Financial Corp., as well as Stifel, Nicolaus & Company, Incorporated
and its subsidiaries (collectively, “SF” or the “Company”).
These statements can be identified by the use of the words “may,” “will,” “should,” “could,” “would,” “plan,” “potential,”
“estimate,” “project,” “believe,” “intend,”
“anticipate,” “expect,” and similar expressions. In particular, these statements may refer to our
goals, intentions, and expectations, our business plans and growth strategies, our ability to
integrate and manage our acquired businesses, estimates of our risks and future costs
and benefits, and forecasted demographic and economic trends relating to our industry.
You should not place undue reliance on any forward-looking statements, which speak only as
of the date they were made. We will not update these forward-looking
statements, even though our situation may change in the future, unless we are obligated to do so under federal
securities laws. Actual results
may differ materially and reported results should not be considered as an indication of future performance. Factors that could
cause actual results to differ are included in the Company’s annual and quarterly reports
and from time to time in other reports filed by the Company with the Securities and
Exchange Commission and include, among other things, changes in general economic and business
conditions, actions of competitors, regulatory and legal actions, changes in legislation, and
technology changes.
The company utilized non-GAAP calculations of presented net revenues, compensation and
benefits, non-compensation operating expenses, income before income taxes,
provision for income taxes, net income, compensation and non-compensation operating expense ratios, pre-tax
margin and diluted earnings per share as an additional measure to aid in understanding and
analyzing the company’s financial results for the nine months ended September 30,
2012. Specifically, the company believes that the non-GAAP measures provide useful information by
excluding certain items that may not be indicative of the company’s core operating
results and business outlook. The company believes that these non-GAAP measures
will allow for a better evaluation of the operating performance of the business and facilitate a meaningful
comparison of the company’s results in the current period to those in prior periods and
future periods. Reference to these non-GAAP measures should not be considered as a
substitute for results that are presented in a manner consistent with GAAP. These non-GAAP
measures are provided to enhance investors' overall understanding of the company’s
financial performance. Forward-Looking Statements
Use
of
Non-GAAP
Financial
Measures |
 2
Chairman’s Comments
“I am pleased with our third quarter results, which included
record net revenues, as well as with our record net revenues and
net income for the first nine months of 2012. Our results highlight
the soundness of our balanced business model, particularly
against a challenging economic backdrop. In the quarter, both the
Global Wealth Management and Institutional Group segments
performed well. We continue to invest in businesses that expand
our client services, and which we believe will return shareholder
value. Opportunities drive our growth. Today’s announcement of
our merger with KBW furthers our goal of creating the premier
middle-market investment bank with a specialized focus on the
financial services industry.”
|
 Financial
Results
Results |
 4
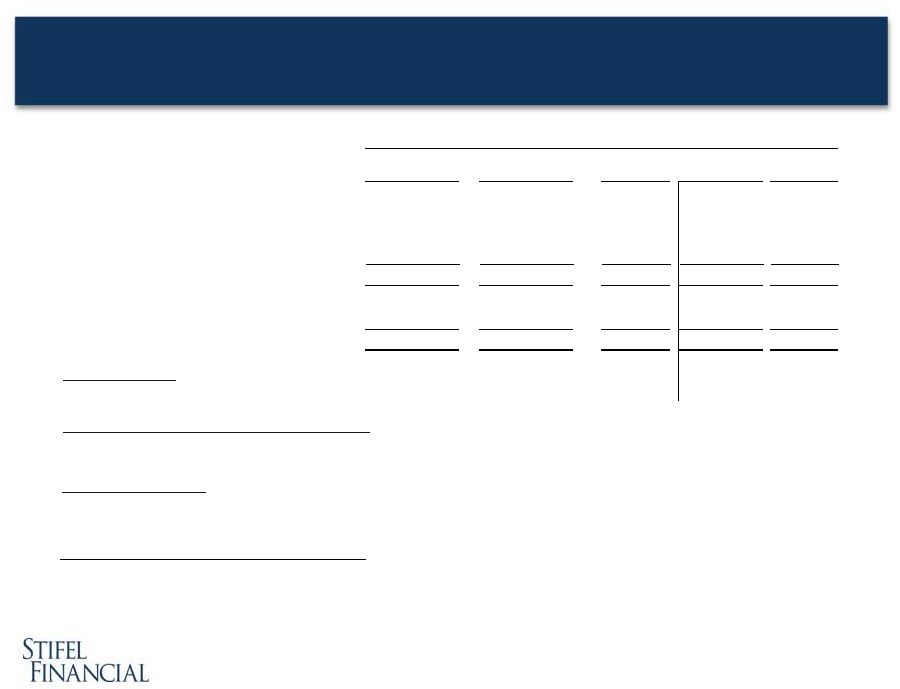
Stifel Financial Corp. Results
Three months ended September 30, 2012
($ in thousands, except per share amounts)
9/30/12
(1)
9/30/11
% Change
6/30/12
% Change
Net revenues
420,080
$
334,214
$
25.7%
374,407
$
12.2%
Compensation and benefits
267,652
210,573
27.1%
239,374
11.8%
Non-comp operating expenses
90,751
84,618
7.2%
91,159
(0.4%)
Total non-interest expenses
358,403
295,191
21.4%
330,533
8.4%
Income before income taxes
61,677
39,023
58.1%
43,874
40.6%
Provision for income taxes
23,967
16,719
43.4%
17,738
35.1%
Net income
37,710
$
22,304
$
69.1%
26,136
$
44.3%
Earnings per share:
Diluted
0.60
$
0.35
$
71.4%
0.42
$
42.9%
Weighted average number of shares outstanding:
Diluted
63,054
63,152
(0.2%)
62,678
0.6%
Ratios to net revenues:
Compensation and benefits
63.7%
63.0%
63.9%
Non-comp operating expenses
21.6%
25.3%
24.4%
Income before income taxes
14.7%
11.7%
11.7%
Three Months Ended
(1)
Results for the three months ended September 30, 2012 include realized and unrealized
gains on the Company's investment in Knight Capital Group Inc. of
$25.6 million. The after-tax impact was $0.09 per diluted share. |
 5
Stifel Financial Corp. Results
Nine months ended September 30, 2012
($ in thousands, except per share amounts)
9/30/12
(1)
9/30/11
% Change
Net revenues
1,194,820
$
1,059,684
$
12.8%
Compensation and benefits
761,730
671,678
13.4%
Non-comp operating expenses
268,285
294,424
(8.9%)
Total non-interest expenses
1,030,015
966,102
6.6%
Income before income taxes
164,805
93,582
76.1%
Provision for income taxes
66,186
36,464
81.5%
Net income
98,619
$
57,118
$
72.7%
Earnings per share
:
Diluted
(2)
1.57
$
0.90
$
74.4%
Weighted average number of shares outstanding:
Diluted
62,817
63,174
(0.6%)
Ratios to net revenues
:
Compensation and benefits
63.8%
63.4%
Non-comp operating expenses
22.4%
27.8%
Income before income taxes
13.8%
8.8%
Nine Months Ended
(1)
Results for the nine months ended September 30, 2012 include realized and unrealized gains on
the Company's investment in Knight Capital Group, Inc. of $25.6 million.
The after-tax impact was $0.09 per diluted share. (2)
Results for the nine months ended September 30, 2011 include previously
disclosed litigation-related charges and merger- related expenses of
$0.47 per diluted share after-tax. |
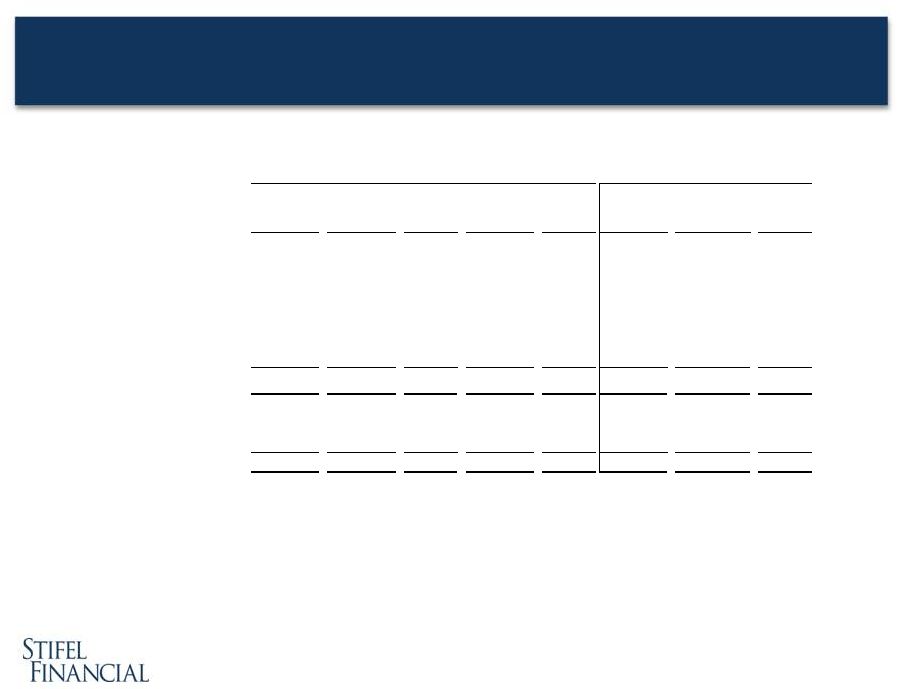
 6
Source of Revenues
($ in thousands)
9/30/12
9/30/11
%
Change
6/30/12
% Change
9/30/12
9/30/11
%
Change
Commissions
127,966
$
143,243
$
(10.7%)
127,427
$
0.4%
378,696
$
437,344
$
(13.4%)
Principal transactions
102,979
76,650
34.3%
91,564
12.5%
310,776
249,250
24.7%
Capital raising
45,733
25,254
81.1%
40,733
12.3%
141,299
97,301
45.2%
Advisory
27,205
12,419
119.1%
26,630
2.2%
69,440
46,208
50.3%
Investment banking
72,938
37,673
93.6%
67,363
8.3%
210,739
143,509
46.8%
Asset mgt and service fees
62,881
58,253
7.9%
65,311
(3.7%)
189,010
172,914
9.3%
Other
(1)
31,922
540
*
5,418
489.2%
50,634
11,352
346.0%
Total operating revenues
398,686
316,359
26.0%
357,083
11.7%
1,139,855
1,014,369
12.4%
Interest revenue
27,306
24,161
13.0%
27,181
0.5%
79,744
64,246
24.1%
Total revenues
425,992
340,520
25.1%
384,264
10.9%
1,219,599
1,078,615
13.1%
Interest expense
5,912
6,306
(6.2%)
9,857
(40.0%)
24,779
18,931
30.9%
Net revenues
420,080
$
334,214
$
25.7%
374,407
$
12.2%
1,194,820
$
1,059,684
$
12.8%
* Percentage not meaningful.
Quarter Ended
Nine Months Ended
(1)
Results for the three and nine months ended September 30, 2012 include $25.6 million in
realized and unrealized gains on the Company's investment in Knight Capital Group,
Inc. |
 7
Brokerage Revenues
($ in thousands)
9/30/12
9/30/11
%
Change
6/30/12
%
Change
9/30/12
9/30/11
%
Change
Principal transactions:
Taxable debt
55,908
$
41,871
$
33.5%
47,831
$
16.9%
165,172
$
136,310
$
21.2%
Municipal debt
24,412
19,335
26.3%
23,851
2.4%
70,089
57,722
21.4%
Equities
10,959
6,397
71.3%
8,463
29.5%
40,530
26,916
50.6%
Other
11,700
9,047
29.3%
11,419
2.5%
34,985
28,302
23.6%
Total principal transactions
102,979
$
76,650
$
34.3%
91,564
$
12.5%
310,776
$
249,250
$
24.7%
Commissions
127,966
143,243
(10.7%)
127,427
0.4%
378,696
437,344
(13.4%)
Total brokerage revenues
230,945
$
219,893
$
5.0%
218,991
$
5.5%
689,472
$
686,594
$
0.4%
Nine Months Ended
Quarter Ended |
 8
Non-Interest Expenses
Three months ended September 30, 2012
($ in thousands)
9/30/12
9/30/11
% Change
6/30/12
% Change
9/30/12
9/30/11
6/30/12
Compensation and benefits
247,964
193,818
27.9%
219,004
13.2%
59.0%
58.0%
58.5%
Transitional pay
(1)
19,688
16,755
17.5%
20,370
(3.3%)
4.7%
5.0%
5.4%
Total compensation and benefits
267,652
210,573
27.1%
239,374
11.8%
63.7%
63.0%
63.9%
Occupancy and equipment rental
33,061
30,914
6.9%
32,320
2.3%
7.9%
9.2%
8.6%
Communication and office supplies
19,976
18,838
6.0%
20,797
(3.9%)
4.8%
5.6%
5.6%
Commissions and floor brokerage
8,031
7,400
8.5%
7,747
3.7%
1.9%
2.2%
2.1%
Other operating expenses
29,683
27,466
8.1%
30,295
(2.0%)
7.1%
8.1%
8.1%
Total non-comp operating expenses
90,751
84,618
7.2%
91,159
(0.4%)
21.7%
25.3%
24.3%
Total non-interest expense
358,403
295,191
21.4%
330,533
8.4%
85.3%
88.3%
88.3%
Quarter Ended
% of Net revenues
(1)
Transition pay includes amortization of upfront notes, signing bonuses and retention awards.
|
 9
Non-Interest Expenses
Nine months ended September 30, 2012
($ in thousands)
9/30/12
9/30/11
% Change
9/30/12
9/30/11
Compensation and benefits
703,300
618,556
13.7%
58.9%
58.5%
Transitional pay
(1)
58,430
53,122
10.0%
4.9%
5.0%
Total compensation and benefits
761,730
671,678
13.4%
63.8%
63.4%
Occupancy and equipment rental
96,172
89,962
6.9%
8.0%
8.5%
Communication and office supplies
61,146
56,198
8.8%
5.1%
5.3%
Commissions and floor brokerage
23,390
20,943
11.7%
2.0%
2.0%
Other operating expenses
(2)
87,577
127,321
(31.2%)
7.3%
12.0%
Total non-comp operating expenses
268,285
294,424
(8.9%)
22.5%
27.8%
Total non-interest expense
1,030,015
966,102
6.6%
86.2%
91.2%
Nine Months Ended
% of Net revenues
(2)
Results for the nine months ended September 30, 2011 include litigation-related charges
and merger-related expenses of $29.4 million after-tax. (1)
Transition pay includes amortization of upfront notes, signing bonuses and retention awards.
|
 10
Segment Comparison
($ in thousands)
9/30/12
9/30/11
%
Change
6/30/12
%
Change
9/30/12
9/30/11
%
Change
Net revenues:
Global Wealth Management
251,728
$
219,489
$
14.7%
240,029
$
4.9%
740,105
$
683,589
$
8.3%
Institutional Group
(1)
169,679
113,259
49.8%
135,297
25.4%
453,480
373,168
21.5%
Other
(1,327)
1,457
(191.1%)
(919)
(44.4%)
1,235
2,927
(57.8%)
420,080
$
334,205
$
25.7%
374,407
$
12.2%
1,194,820
$
1,059,684
$
12.8%
Operating contribution:
Global Wealth Management
68,370
$
55,612
$
22.9%
61,353
$
11.4%
198,901
$
172,510
$
15.3%
Institutional Group
(1)
33,427
9,152
265.2%
17,546
90.5%
74,677
52,496
42.3%
Other
(2)
(40,120)
(25,741)
55.9%
(35,025)
14.5%
(108,773)
(131,424)
(17.2%)
61,677
$
39,023
$
58.1%
43,874
$
40.6%
164,805
$
93,582
$
76.1%
Nine Months Ended
Quarter Ended
(2)
Results for the nine months ended September 30, 2011 include litigation-related charges
and merger-related expenses of $47.5 million pre-tax. (1)
Results for the three and nine months ended September 30, 2012 include $25.6 million in
realized and unrealized gains recognized on the Company's investment in Knight Capital
Group, Inc. |
 11
Global Wealth Management
($ in thousands)
9/30/12
9/30/11
% Change
6/30/12
% Change
9/30/12
9/30/11
% Change
Commissions
89,393
$
92,029
$
(2.9%)
88,423
$
1.1%
268,839
$
287,384
$
(6.5%)
Principal transactions
58,801
48,836
20.4%
55,628
5.7%
173,474
156,262
11.0%
Asset management & service fees
62,871
58,007
8.4%
65,169
(3.5%)
188,626
172,354
9.4%
Net interest
22,283
15,016
48.4%
18,233
22.2%
58,163
39,586
46.9%
Investment banking
13,347
3,737
257.2%
8,531
56.5%
34,348
16,460
108.7%
Other income
5,033
1,873
168.7%
4,045
24.4%
16,655
11,543
44.3%
Net revenues
251,728
219,498
14.7%
240,029
4.9%
740,105
683,589
8.3%
Compensation and benefits
146,882
128,244
14.5%
140,984
4.2%
431,623
403,782
6.9%
Non-comp operating expenses
36,476
35,642
2.3%
37,692
(3.2%)
109,581
107,297
2.1%
Total non-interest expenses
183,358
163,886
11.9%
178,676
2.6%
541,204
511,079
5.9%
Income before income taxes
68,370
$
55,612
$
22.9%
61,353
$
11.4%
198,901
$
172,510
$
15.3%
Ratios to net revenues
:
Compensation and benefits
58.3%
58.4%
58.7%
58.3%
59.1%
Non-comp operating expenses
14.5%
16.3%
15.7%
14.8%
15.7%
Income before income taxes
27.2%
25.3%
25.6%
26.9%
25.2%
Quarter Ended
Nine Months Ended |
 12
Stifel Bank & Trust
(an operating unit of GWM)
% Change
% Change
(in 000s, except percentages)
Net revenues
$
19,862
$
17,584
13.0
$
18,997
4.6
Income before income taxes
18,063
13,240
36.4
14,769
22.3
As of
9/30/12
9/30/11
% Change
6/30/12
% Change
Assets
$
3,228,021
$
2,311,371
39.7
$
3,058,971
5.5
Investment securities
2,133,494
1,470,812
45.1
1,849,622
15.3
Retained loans, net
746,120
567,341
31.5
709,079
5.2
Loans held for sale
209,358
114,452
82.9
117,166
78.7
Deposits
2,923,671
2,120,763
37.9
2,776,684
5.3
Allowance as a percentage of loans
0.85
%
0.67
%
0.88
%
Non-performing assets as a percentage of total
assets
0.07
%
0.08
%
0.08
%
As of
For the Three Months Ended
9/30/12
9/30/11
6/30/12 |
 13
Institutional Group
($ in thousands)
9/30/12
9/30/11
% Change
6/30/12
% Change
9/30/12
9/30/11
% Change
Commissions
38,574
$
51,214
$
(24.7%)
39,004
$
(1.1%)
109,858
$
149,960
$
(26.7%)
Principal transactions
44,178
27,815
58.8%
35,936
22.9%
137,302
92,988
47.7%
Investment banking
59,591
33,936
75.6%
58,832
1.3%
176,391
127,049
38.8%
Other
(1)
27,336
294
*
1,525
*
29,929
3,171
*
Net revenues
169,679
113,259
49.8%
135,297
25.4%
453,480
373,168
21.5%
Compensation and benefits
104,913
74,813
40.2%
84,754
23.8%
283,691
234,006
21.2%
Non-comp operating expenses
31,339
29,294
7.0%
32,997
(5.0%)
95,112
86,666
9.7%
Total non-interest expenses
136,252
104,107
30.9%
117,751
15.7%
378,803
320,672
18.1%
Income before income taxes
33,427
$
9,152
$
265.2%
17,546
$
90.5%
74,677
$
52,496
$
42.3%
Ratios to net revenues
:
Compensation and benefits
61.8%
66.0%
62.6%
62.6%
62.7%
Non-comp operating expenses
18.5%
25.9%
24.4%
20.9%
23.2%
Income before income taxes
19.7%
8.1%
13.0%
16.5%
14.1%
* Percentage not meaningful.
Quarter Ended
Nine Months Ended
(1)
Includes net interest and other income. Other income for the three and nine months ended
September 30, 2012 includes $25.6 million pre-tax in realized and unrealized gains
recognized on the Company's investment in Knight Capital Group, Inc. |
 14
Institutional Group Revenues
($ in thousands)
9/30/12
9/30/11
% Change
6/30/12
% Change
9/30/12
9/30/11
% Change
Institutional brokerage:
Equity
37,956
$
47,185
$
(19.6%)
38,466
$
(1.3%)
120,594
$
141,278
$
(14.6%)
Fixed income
44,796
31,844
40.7%
36,474
22.8%
126,566
101,670
24.5%
82,752
79,029
4.7%
74,940
10.4%
247,160
242,948
1.7%
Investment Banking:
Capital raising
Equity
17,527
16,382
7.0%
17,651
(0.7%)
66,728
67,386
(1.0%)
Fixed income
14,859
5,054
194.0%
14,551
2.1%
40,223
13,268
203.2%
32,386
21,436
51.1%
32,202
0.6%
106,951
80,654
32.6%
Advisory fees
27,205
12,500
117.6%
26,630
2.2%
69,440
46,395
49.7%
Investment banking
59,591
33,936
75.6%
58,832
1.3%
176,391
127,049
38.8%
Other
(1)
27,336
294
*
1,525
*
29,929
3,171
*
Total net revenue
169,679
$
113,259
$
49.8%
135,297
$
25.4%
453,480
$
373,168
$
21.5%
* Percentage not meaningful.
Nine Months Ended
Quarter Ended
(1)
Includes net interest and other income. Other income for the three and nine months ended
September 30, 2012 includes $25.6
million
pre-tax
in
realized
and
unrealized
gains
recognized
on
the
Company's
investment
in
Knight
Capital
Group,
Inc. |
 Financial
Condition
Condition |
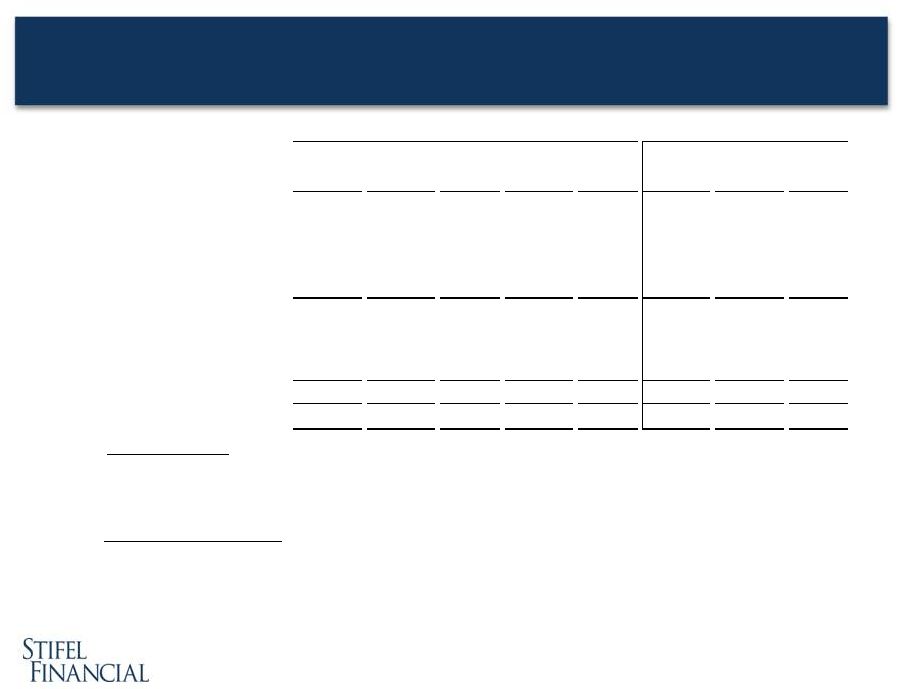
 16
Capital Structure
As of September 30, 2012
(in thousands, except ratios)
($ in thousands)
Total Assets
6,139,530
$
Stockholders' Equity
1,427,124
$
Debentures to Stifel Financial Capital Trusts II, III, & IV
82,500
$
6.70% Senior Notes due 2022
175,000
$
Total Capitalization
1,684,624
$
Ratios:
Debt to Equity
(1)
18.0%
Leverage Ratio
(2)
3.6x
Equity Capitalization
(3)
4.3x
(1)
Debt to equity ratio includes the debentures to Stifel Financial Capital Trusts ($82.5m) and
Senior Notes ($175.0m) divided by stockholders’ equity.
(2)
Leverage ratio = total assets divided by total capitalization.
(3)
Equity capitalization = total assets divided by stockholders’ equity. |
 17
Other Financial Data
Total assets (000s):
Stifel Nicolaus & Stifel Financial
Stifel Bank
Total assets
Total shareholders' equity (000s):
Stifel Nicolaus & Stifel Financial
Stifel Bank
Total shareholders' equity
Leverage ratio:
Stifel Nicolaus & Stifel Financial
Stifel Bank
Total leverage ratio
Book value per share
Financial advisors
(1)
Full-time associates
Locations
Total client assets (000s)
(2)
(1)
Includes 154, 160 and 156 independent contractors as of September 30, 2012 and 2011 and June
30, 2012, respectively. (2)
Includes money market and FDIC-insured balances. Prior period amounts have been adjusted
to conform to the current period presentation. As of
9/30/12
9/30/11
% Change
6/30/12
% Change
2,911,509
$
2,630,993
$
10.7%
3,079,564
$
(5.5%)
3,228,021
2,311,371
39.7%
3,058,971
5.5%
6,139,530
$
4,942,364
$
24.2%
6,138,535
$
0.0%
1,176,935
$
1,086,832
$
8.3%
1,140,188
$
3.2%
250,189
174,919
43.0%
231,657
8.0%
1,427,124
$
1,261,751
$
13.1%
1,371,845
$
4.0%
2.0
2.2
0.0%
2.2
10.0%
12.9
13.2
(2.5%)
13.2
0.0%
3.6
3.7
(0.8%)
3.8
11.8%
26.62
$
24.48
$
8.7%
25.63
$
3.9%
2,042
1,961
4.1%
2,028
0.7%
5,266
4,942
6.6%
5,196
1.3%
338
313
8.0%
332
1.8%
136,015,000
$
110,797,000
$
22.8%
131,026,000
$
3.8%
As of |
 18
Level 3 Assets
($ in thousands)
9/30/12
12/31/11
Auction Rate Securities (ARS)
(1)
162,761
$
181,801
$
Stifel Bank & Trust Investments
11,529
12,000
Trading Securities
3,471
3,742
Other Investments
(2)
36,717
37,033
Level 3 assets (excluding ARS)
51,717
52,775
Total Level 3 assets
214,478
$
234,576
$
Percentage of Equity
15.0%
18.0%
Percentage of Equity (excluding ARS)
3.6%
4.1%
(1)
Includes $84.1 million and $66.9 million, respectively, of ARS held at Stifel Bank &
Trust. (2)
Includes $30.0 million and $30.2 million, respectively, of investments held by TWPG
subsidiaries. Carrying Value |
 2012
2012
Investments
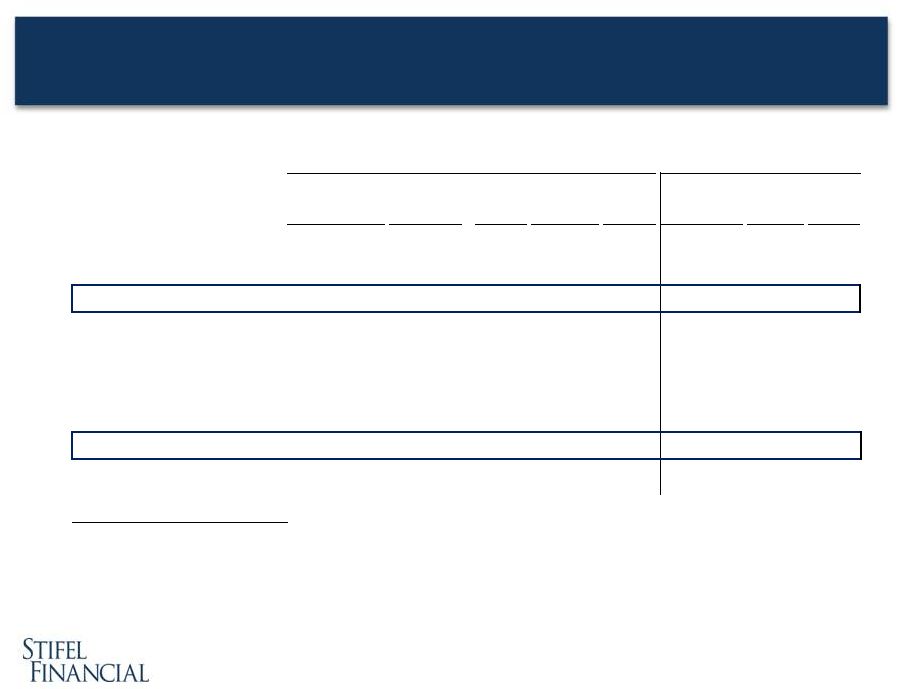
Investments |
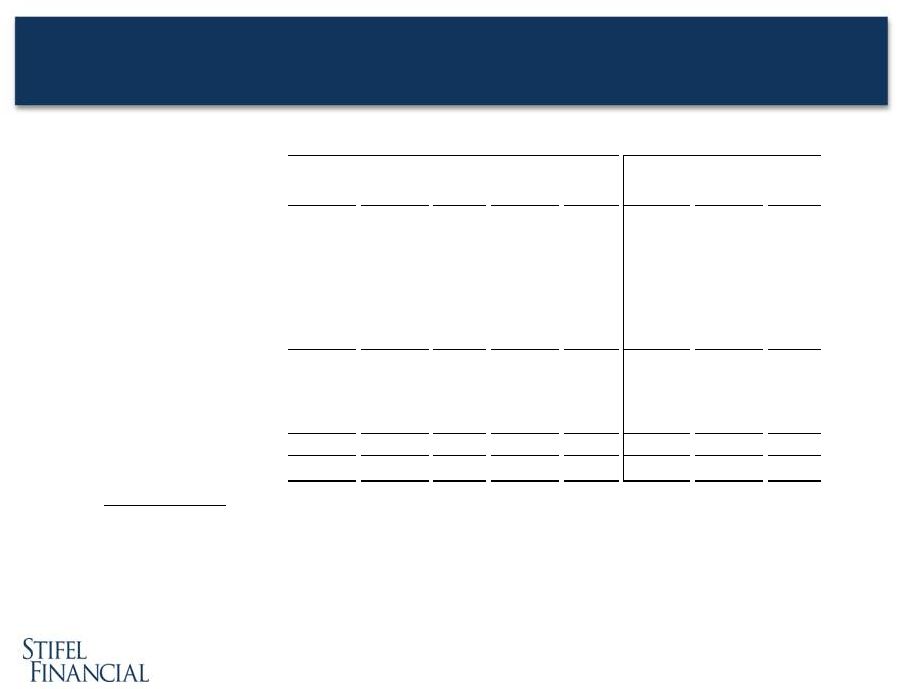
 20
2012 Legacy Business vs. Investments
¹As of October 31, 2012.
2
Legacy revenues and expense s exclude new business and investments.
3
Legacy provision for income taxes is calculated using the tax rate for the nine month period
2012 of 40.2%. 2012 Investments include hiring 132 financial advisors and 65 fixed
income sales and trading professionals YTD .
($ in thousands, except per share amounts)
Legacy
2
Investments
Total
9m2012
Q3
Q2
Q1
Net revenues
1,165,461
29,359
1,194,820
29,359
15,131
9,227
5,001
Compensation and benefits
732,609
29,121
761,730
29,121
11,603
10,013
7,505
Non-compensation operating expenses
252,305
15,980
268,285
15,980
5,104
5,844
5,032
Total non-interest expenses
984,914
45,101
1,030,015
45,101
16,707
15,857
12,537
Income before income taxes
180,547
(15,742)
164,805
(15,742)
(1,576)
(6,630)
(7,536)
Provision
for
income
taxes
3
72,508
(6,322)
66,186
(6,322)
(523)
(2,685)
(3,114)
Net income
108,039
(9,420)
98,619
(9,420)
(1,053)
(3,945)
(4,422)
Earnings per share
1.72
$
(0.15)
$
1.57
$
(0.15)
$
(0.02)
$
(0.06)
$
(0.07)
$
Ratios to net revenues:
Compensation and benefits
62.9
63.8
Non-compensation operating expenses
21.6
22.5
Income before income taxes
15.5
13.8
As Reported
9M2012
Investments -
2012 Comparision
1 |
 Q&A
Q&A |