Attached files
| file | filename |
|---|---|
| EX-99.1 - EX-99.1 - KBW, INC. | a12-26174_1ex99d1.htm |
| 8-K - 8-K - KBW, INC. | a12-26174_18k.htm |
Exhibit 99.2
|
|
Presentation to Investors November 5, 2012 Ronald J. Kruszewski Chairman of the Board, President, and CEO Stifel Financial Corp. Thomas B. Michaud President and CEO KBW, Inc. Building the Premier Middle-Market Investment Bank |
|
|
Forward-Looking Statements Statements in this presentation that relate to the future plans, events, expectations, performance, objectives and the like of Stifel Financial Corp., as well as Stifel, Nicolaus and Company, Inc. and its other subsidiaries (collectively, “Stifel” or the “Company”) and KBW, Inc. (“KBW”), may constitute “forward-looking statements” within the meaning of the Private Securities Litigation Reform Act of 1995, Section 27A of the Securities Act of 1933, as amended, and Section 21E of the Securities Exchange Act of 1934, as amended. Future events, risks and uncertainties, individually or in the aggregate, could cause our actual results to differ materially from those expressed or implied in these forward-looking statements. The material factors and assumptions that could cause actual results to differ materially from current expectations include, without limitation, the following: (1) the inability to close the merger in a timely manner; (2) the inability to complete the merger due to the failure to obtain stockholder approval and adoption of the merger agreement and approval of the merger or the failure to satisfy other conditions to completion of the merger, including required regulatory and other approvals; (3) the failure of the transaction to close for any other reason; (4) the possibility that the integration of KBW’s business and operations with those of Stifel may be more difficult and/or take longer than anticipated, may be more costly than anticipated and may have unanticipated adverse results relating to KBW’s or Stifel’s existing businesses; (5) the challenges of integrating and retaining key employees; (6) the effect of the announcement of the transaction on Stifel’s, KBW’s or the combined company’s respective business relationships, operating results and business generally; (7) the possibility that the anticipated synergies and cost savings of the merger will not be realized, or will not be realized within the expected time period; (8) the possibility that the merger may be more expensive to complete than anticipated, including as a result of unexpected factors or events; (9) the challenges of maintaining and increasing revenues on a combined company basis following the close of the merger; (10) diversion of management’s attention from ongoing business operations and opportunities; (11) general competitive, economic, political and market conditions and fluctuations; (12) actions taken or conditions imposed by the United States and foreign governments; (13) adverse outcomes of pending or threatened litigation or government investigations; (14) the impact of competition in the industries and in the specific markets in which Stifel and KBW, respectively, operate; and (15) other factors that may affect future results of the combined company described in the section entitled “Risk Factors” in the proxy statement/prospectus to be mailed to KBW’s shareholders and in Stifel’s and KBW’s respective filings with the U.S. Securities and Exchange Commission (“SEC”) that are available on the SEC’s web site located at www.sec.gov, including the sections entitled “Risk Factors” in Stifel’s Form 10-K for the fiscal year ended December 31, 2011, and “Risk Factors” in KBW’s Form 10-K for the fiscal year ended December 31, 2011. Readers are strongly urged to read the full cautionary statements contained in those materials. We assume no obligation to update any forward-looking statements to reflect events that occur or circumstances that exist after the date on which they were made. Disclaimer |
|
|
Additional Information and Where to Find It In connection with the proposed merger, Stifel will be filing a registration statement on Form S-4 that will include a proxy statement of KBW that also constitutes a prospectus of Stifel and other relevant documents relating to the merger with the Securities and Exchange Commission (the “SEC”). Stifel and KBW shareholders are urged to read the registration statement and any other relevant documents filed with the SEC, including the proxy statement/prospectus that will be part of the registration statement, because they will contain important information about Stifel, KBW and the proposed transaction. The final proxy statement/prospectus will be mailed to shareholders of KBW. Investors and security holders will be able to obtain free copies of the registration statement and proxy statement/prospectus (when available) as well as other filed documents containing information about Stifel and KBW, without charge, at the SEC’s website (www.sec.gov). Free copies of Stifel’s SEC filings are also available on Stifel’s website (www.stifel.com), and free copies of KBW’s SEC filings are available on KBW’s website (www.kbw.com). Free copies of Stifel’s filings also may be obtained by directing a request to Stifel Investor Relations by phone to (314) 342-2000 or in writing to Stifel Financial Corp., Attention: Investor Relations, 501 North Broadway, St. Louis, Missouri 63102. Free copies of KBW’s filings also may be obtained by directing a request to KBW Investor Relations by phone to 415-364-2500, in writing to KBW, Inc., Attn: Alan Oshiki, c/o King Worldwide Investor Relations, 48 Wall Street, 32nd Floor, New York, New York 10005, or by email to kbw.inv.relations@kbw.com. This communication shall not constitute an offer to sell or the solicitation of an offer to buy securities, nor shall there be any sale of securities in any jurisdiction in which such solicitation or sale would be unlawful prior to registration or qualification under the securities laws of such jurisdiction. Participants in the Solicitation Stifel, KBW and their respective directors and executive officers may be deemed, under SEC rules, to be participants in the solicitation of proxies from the shareholders of KBW with respect to the proposed transaction. More detailed information regarding the identity of the potential participants, and their direct or indirect interests, by securities holdings or otherwise, will be set forth in the registration statement and proxy statement/prospectus and other materials to be filed with the SEC in connection with the proposed transaction. Information regarding Stifel’s directors and executive officers is also available in Stifel’s definitive proxy statement for its 2012 Annual Meeting of Shareholders filed with the SEC on April 20, 2012. Information regarding KBW’s directors and executive officers is also available in KBW’s definitive proxy statement for its 2012 Annual Meeting of Shareholders filed with the SEC on April 27, 2012. These documents are available free of charge at the SEC’s web site at www.sec.gov and from Investor Relations at KBW and Stifel Financial. Disclaimer |
|
|
Why this Combination Makes Sense The Financial Institutions Sector is Poised to Benefit from Improving Fundamentals and Catalysts + |
|
|
Stifel Financial and KBW Today Full-service, publicly traded investment bank (NYSE: SF) Over 5,000 associates in 330 global locations Demonstrating growth, scale and stability with balanced business model Investment Banking #1 U.S. equity underwriter for issuers with market caps <$500 million since 2005(1) Extensive advisory and capital raising expertise across 15 industry focused groups Research One of the largest providers of U.S. Equity Research with over 1,000 stocks under coverage 85 senior research analysts Most # 1 awards in 2011 FT / Starmine Survey Institutional Sales & Trading Senior team leaders with 15+ years of experience ~200 equity & ~250 fixed income professionals Global Wealth Management Over $136 billion in client assets More than 2,000 Financial Advisors & 300 locations Over $3 billion in assets at Stifel Bank & Trust A leading global investment bank focused exclusively on the Financial Services Industry (NYSE: KBW) Approximately 448 employees in 10 global locations Celebrating 50th anniversary in 2012 Investment Banking #1 advisor to U.S. Financial Institutions (2) #1 manager of equity offerings for financial institutions (3) Research Only boutique with comprehensive research coverage of financial services universe globally ~390 stocks covered in the U.S. #2 Best Financial Sector Research Firm by Bloomberg Institutional Sales & Trading Largest FIG specialist sales force globally A top U.S. FIG sales force Top ten trader in NASDAQ Financial 100 A leading European specialist salesforce in both banks and insurance A leading financial services index provider Note: Data for Stifel Financial and KBW is as of November 2, 2012 unless indicated otherwise. (1) Source: Dealogic. Rank eligible SEC registered IPOs and Follow-On offerings since 2005. Includes demutualizations. As of 10/31/12. (2) SNL Financial. Represents domestic bank and thrift, insurance, securities and investments and specialty finance transactions from 1/1/04 to 6/30/12. (3) Dealogic. Excludes best efforts offerings, bought deals, SPACS and BDCs. Includes SEC registered underwritten IPOs and follow-on offerings for financial institutions from the USA, Puerto Rico, Bermuda and Cayman Islands. Full credit given to the bookrunner. |
|
|
Stifel Net Revenue Mix (9 mo 2012) Combined Net Revenue Mix (9 mo 2012) Annualized Net Revenue: $1,593 mm (1) Annualized Net Revenue: $1,824 mm (1) ($ in millions) Balanced Business Mix Annualized net revenues are based on nine months ended September 30, 2012. “GWM”, Global Wealth Management “IG”, Institutional Group + GWM 62% IG 38% GWM 54% IG 46% (1) |
|
|
Summary of Key Transaction Terms Consideration KBW shareholders receive $17.50 per share, or total consideration of approximately $533 million $10.00 per share in cash and $7.50 per share in SF stock(1) Restricted stock (owned by KBW employees) exchanged for SF restricted stock. Restricted stock is also valued at $17.50 per share, or approximately $45 million in aggregate, net of tax Transaction Stifel Financial Corp. (“SF”) to acquire 100% of KBW, Inc. (“KBW”) common stock Synergy Opportunities 9/11 Stifel is honored to partner with KBW in continuing their commitment to 9/11 Excess Capital $250 million in KBW excess capital is estimated to be available to SF following closing Exchange Ratio Based on SF stock price (subject to SF stock price collar of $29.00 - $35.00 per share) Significant back office cost savings already identified Minimal client facing changes/ cost savings principally from redundancies No revenue enhancements assumed in financial modeling Management Board Seats Tom Michaud to remain CEO of KBW Tom Michaud and one outside KBW director to join SF Board Assuming an SF stock price of between $29.00 and $35.00 per share. Approvals Retention Key KBW employees have signed retention agreements Subject to customary regulatory approvals and KBW shareholder approval |
|
|
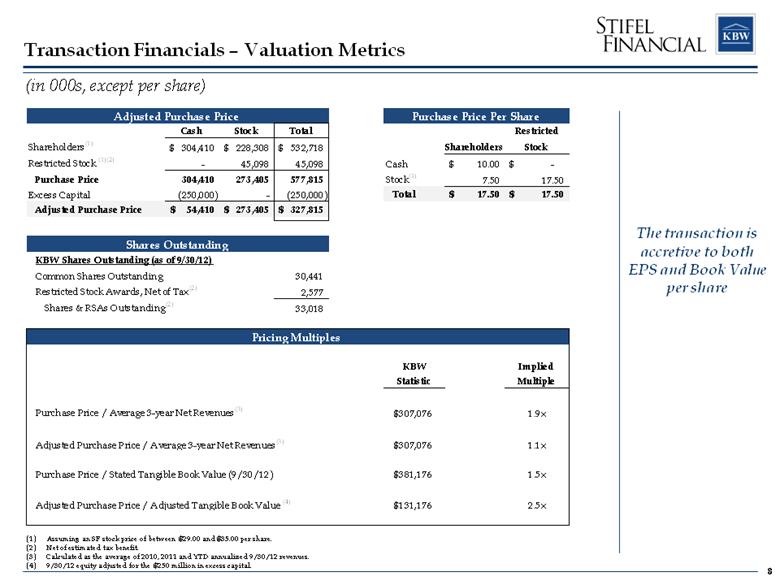
Transaction Financials – Valuation Metrics The transaction is accretive to both EPS and Book Value per share Assuming an SF stock price of between $29.00 and $35.00 per share. Net of estimated tax benefit. Calculated as the average of 2010, 2011 and YTD annualized 9/30/12 revenues. 9/30/12 equity adjusted for the $250 million in excess capital. (in 000s, except per share) Adjusted Purchase Price Purchase Price Per Share Cash Stock Total Restricted Shareholders (1) 304,410 $ 228,308 $ 532,718 $ Shareholders Stock Restricted Stock (1)(2) - 45,098 45,098 Cash 10.00 $ - $ Purchase Price 304,410 273,405 577,815 Stock (1) 7.50 17.50 Excess Capital (250,000) - (250,000) Total 17.50 $ 17.50 $ Adjusted Purchase Price 54,410 $ 273,405 $ 327,815 $ KBW Shares Outstanding (as of 9/30/12) Common Shares Outstanding 30,441 Restricted Stock Awards, Net of Tax (2) 2,577 Shares & RSAs Outstanding (2) 33,018 KBW Implied Statistic Multiple Purchase Price / Average 3-year Net Revenues (3) $307,076 1.9x Adjusted Purchase Price / Average 3-year Net Revenues (3) $307,076 1.1x Purchase Price / Stated Tangible Book Value (9/30/12) $381,176 1.5x Adjusted Purchase Price / Adjusted Tangible Book Value (4) $131,176 2.5x Shares Outstanding Pricing Multiples |
|
|
Accretive Transaction Delivers 10% - 16% ROE ($ in 000s) Assuming an SF stock price of between $29.00 and $35.00 per share. Consideration for restricted stock is net of potential tax benefit. Total incremental shares issued in consideration and retention (net of tax benefit). Assumptions include: Potential revenue range for KBW between $250 - $325 million based on trough years $64 million in estimated incremental operating expenses at KBW, after associated cost saves Net incremental Stifel shares outstanding are approximately 8.9 million(2) Stifel’s Equity Investment Attractive Returns Conservatively Modeled Expected Return on Equity Investment of 10% - 16% Approximately 5%-7% accretive to EPS, after cost savings Attractive Returns Based on Conservative Modeling Purchase Price (1) 577,815 $ After-tax Retention 34,200 Less: Excess Capital (250,000) Total Investment 362,015 $ Less: Cash Borrowings (100,000) Equity Investment 262,015 $ Purchase Price (1) After-tax Retention Less: Excess Capital Total Investment Less: Cash Borrowings Equity Investment $ 577,815 34,200 (250,000) $ 362,015 (100,000) $ 262,015 (1) (2)
|
|
|
Capital Markets Drivers Improving equity markets Continued demand for yield product Thawing M&A markets TARP, SBLF and TruPS repayment events Renewal of Traditional Depository M&A Excess Capacity 7,246 depository institutions – 99% have assets under $20 billion 1,291 institutions with assets between $500 million and $20 billion Operating Environment Low growth and low interest rate environment make it more difficult, especially for smaller institutions, to generate desired shareholder returns Credit Environment Credit trends improving - buyers becoming more comfortable with credit risk Regulatory Environment Higher regulatory costs and capital requirements - hybrid capital has gone away or has limited availability Fixed Income is a Meaningful Revenue Driver This is the Time to Invest in Financial Services Financials Outperforming for the First Year Since 2006 First year since 2006 that U.S. financials have outperformed both broad U.S. stock market indices And market participants remain underweight financials Financials are a Substantial Share of Industry IB Revenues #1 #1 #2 #3 Which are Expected to Increase #1 Expected Increase in Capital Markets, M&A & FI Activity Source: Dealogic. Percentages are based on FIG U.S. investment banking fees as a % of total U.S. investment banking fees for all products in each respective year. FIG is a large driver of the U.S. economy and comprises 22% of the Russell 2000 S&P 500 Financials Index #3 (40%) (20%) 0% 20 % 40% '00 '01 '02 '03 '04 '05 '06 '07 '08 '09 ' 10 '11 '12 vs. SPX500 vs. DJII 20.2% 26.3% 25.0% 18.5% 13.7% 15.7% 0% 5% 10 % 15% 20% 25 % 30% 2007 2008 2009 2010 2011 2012YTD (1) |
|
|
Combined Platform will be a Dominant Force in the Financial Services Vertical Leading Financial Services IPO & Follow-on Bookrunner # 1 Depository Bookrunner(1) # 1 Conversion Advisor(2) # 1 FIG M&A Advisor(3) The Most Trusted Advisor to Financial Institutions INVESTMENT BANKING # 1 U.S. Equity Research Coverage # 1 U.S. Depository Equities Coverage 427 Financial Services companies under coverage Leader in Financial Services Equity Research EQUITY RESEARCH Largest Financial Services specialist sales force globally Top 10 market maker in the NASDAQ Financial 100 index Leading Financial Services index provider Recognized Leader for Financial Services Sales Excellence SALES & TRADING Significant FIG fixed income expertise Major growth initiative – Stifel has hired 65 professionals YTD Substantial platform offering full suite of products Leader in Financial Services Fixed Income FIXED INCOME Source: SNL Financial. Top Global Coordinator, Book Manager in depository common stock offerings, ranked by number of deals from 1/1/05 - 10/31/12. Source: SNL Financial, includes all mutual to stock conversions in the U.S., ranked by number of deals from 1/1/05 – 10/31/12. Source: SNL Financial. Top financial advisors in Banking, Insurance, Securities & Investments, Specialty Finance, Financial Technology. Includes government assisted transactions, ranked by number of deals from 1/1/05 – 10/31/12. + (1) (2) (3) |
|
|
Operating Strategy Global Wealth Management Award-winning Research Institutional Equity & Fixed Income Brokerage Equity & Fixed Income Capital Raising M&A Advisory Private Client Stifel Bank & Trust Customer Financing Asset Management The addition of KBW adheres to our philosophy of building out highly focused specialized businesses within an integrated platform (Private Client) (Bank & Trust) (Institutional) Middle-Market Experts Focused Research Focused M&A Advisory Focused Institutional Equity Brokerage Focused Equity & Fixed Income Capital Raising Financial Institution Experts STIFEL FINANCIAL Institutional Group Global Wealth Management Information Technology | Risk Management | Legal | Operations | Compliance | Finance & Accounting Leverages Platform and Supports Capabilities of Stifel Revenues: $1.0 Billion $600 Million $250 - $325 Million |
|
|
Maintaining the KBW Culture and Brand Combined KBW & Stifel FIG investment banking franchise to be run under the premier “KBW” brand KBW to become Financial Institutions brand for Stifel Best performers on both teams joined together to drive future growth Separate KBW research and equity sales force to be maintained Existing Stifel FIG ECM and FIG Research to be integrated and marketed as KBW KBW institutional sales force responsible for all FIG sales coverage KBW FIG fixed income expertise integrated into Stifel’s substantial platform Existing KBW fixed income integrated and marketed as Stifel Building on Stifel’s strong institutional fixed income base, Stifel has hired 65 fixed income sales and trading professionals year-to-date Stifel will leverage fixed income products into KBW depository account base |
|
|
U.S. Equity Research Coverage(1)(2) (1) Source: StarMine and Thomson Reuters rankings. Internal for Stifel. (2) SNW/KBW pro forma eliminates duplicate coverage. As of October 31, 2012. The Largest U.S. Equity Research Platform FIG Research Coverage 427 FIG companies under coverage Combination enhances research coverage of global financial institutions, regional banks and insurance #1 U.S. FIG equities coverage #1 U.S. FIG depositories equities coverage Pro Forma FIG Research Coverage Universe #2 Provider of small-cap equities coverage #1 Provider of Technology, Transportation, REITs and now FIG Rank Firm Overall 1 SNW / KBW 1,287 1 JPMorgan 1,074 2 Bank of America Merrill Lynch 1,040 3 Stifel Nicolaus Weisel 1,022 4 Barclays Capital 960 5 Raymond James 957 6 Citi 901 7 Sidoti & Company LLC 867 8 Wells Fargo Securities 849 9 Goldman Sachs 836 10 Credit Suisse 835 11 Morgan Stanley 830 12 Morningstar, Inc. 808 13 UBS 807 14 Deutsche Bank 806 15 RBC Capital Markets 802 16 Jefferies & Co. 790 17 Robert W. Baird & Co. 630 18 BMO Capital Markets 537 19 William Blair 522 20 Keybanc Capital Markets 518 21 Piper Jaffray 501 22 Oppenheimer & Co. 494 23 Macquarie Group 484 24 Sterne, Agee & Leach 453 25 Janney Capital Markets 408 N/A Keefe Bruyette & Woods 390 |
|
|
Affirms industry leading equity research platform Enhances full-service middle-market platform with opportunities for additional market share gains Substantially strengthens FIG sales & trading with a leading market maker in financial stocks Largest FIG specialist sales force globally Leading market maker in financial stocks SNW/KBW #9: NASDAQ Financial 100 Index (2) Trading Volume Ranking: 2011 SNW/KBW #11: U.S. Regional Bank Stocks (KRX) (3) Trade Volume Ranking: 2011 2011 U.S. Trading Volume: Middle Market Banks(1) Strategic Rationale Source: Bloomberg RANK. Ranking reflects rank among middle-market investments banks. As of 10/30/12. Assumes no loss of market share due to client overlap. Source: Autex Block Data as of 12/31/11. Source: Autex Block Data; Regional Bank Stocks (KRX) consists of the current components of the KBW Regional Bank Index as of 12/31/11. The Premier Middle-Market Equities Platform Rank Firm Shares (in millions) 1 Jefferies & Company 17,420 2 SNW / KBW Pro Forma 12,612 3 Stifel Nicolaus Weisel 9,080 4 Cowen & Co. LLC 6,266 5 Raymond James 5,555 6 Oppenheimer & Co Inc 5,238 7 Robert W. Baird & Co 4,991 8 FBR Capital Markets 4,662 9 Piper Jaffray & Co 4,287 10 Macquarie Group 3,648 11 Keefe Bruyette & Woods 3,532 12 William Blair & Co. LLC 2,661 13 Sterne, Agee & Leach Inc 2,498 14 Rodman & Renshaw Inc 1,871 15 Lazard Freres Securities 1,827 16 Canaccord Genuity Corp 1,824 17 BMO Capital Markets 1,776 18 Dahlman Rose & Co 1,714 19 Keybanc Captial Markets 1,538 20 Leerink Swann & Co 1,460 21 JMP Securities LLC 1,304 22 Sunrise Securities 1,231 23 BB&T 1,205 24 Suntrust Capital Markets 1,051 25 Pacific Crest Securities 1,023 26 Needham & Company LLC 913 |
|
|
Source: Dealogic. Rank eligible SEC registered IPOs and Follow-On offerings since 2005. Includes demutualizations. As of 10/30/12. Ranked based upon number of deals. Note: $ Volume represents full credit to underwriter for All Managed Equity Deals and apportioned credit to bookrunner for Bookrun Equity Deals. Note: Stifel results based on pro forma figures for both Stifel and TWPG. (1) Net of overlapped transactions. ($ in billions) ($ in billions) Bookrun Equity Offerings <$500M Mkt Cap Since 2005 (1) All Managed Equity Offerings Since 2005 (1) The Premier Middle-Market Investment Bank Rank Firm # $ Volume 1 Bank of America Merrill Lynch 1,489 $943.3 2 JPMorgan 1,405 861.7 3 Citi 1,173 731.2 4 Morgan Stanley 1,076 735.8 5 UBS 1,076 634.2 6 Wells Fargo Securities 1,072 585.1 7 SNW / KBW Pro Forma 1,037 7 Barclays 991 619.8 8 Credit Suisse 952 650.7 9 Deutsche Bank 911 554.4 10 Goldman Sachs 875 644.2 11 RBC Capital Markets 871 391.7 12 Stifel Nicolaus Weisel 772 231.0 13 Raymond James 754 324.8 14 Oppenheimer & Co Inc 534 120.1 15 Piper Jaffray & Co 495 181.6 16 Jefferies & Company 473 119.6 17 Robert W Baird & Co 357 99.6 18 Keefe Bruyette & Woods 326 156.3 19 JMP Securities LLC 308 61.7 20 BMO Capital Markets 307 123.0 Rank Firm # $ Volume 1 Bank of America Merrill Lynch 240 $15.1 2 SNW / KBW Pro Forma 199 2 JPMorgan 186 10.1 3 Citi 182 12.8 4 UBS 160 8.6 5 Deutsche Bank 153 8.9 6 Credit Suisse 147 8.1 7 Morgan Stanley 131 7.6 8 Barclays 126 7.4 9 Stifel Nicolaus Weisel 125 5.0 10 Jefferies & Company 122 5.2 11 Wells Fargo Securities 107 5.0 12 Piper Jaffray & Co 100 3.8 13 Roth Capital Partners 87 2.3 13 RBC Capital Markets 83 3.3 15 Oppenheimer & Co Inc 79 2.7 16 Raymond James 77 3.8 17 Keefe Bruyette & Woods 75 4.5 18 Goldman Sachs 69 4.1 19 Cowen & Co LLC 64 2.0 20 Lazard Capital Markets 63 2.5 |
|
|
Source: Dealogic. Rank eligible SEC registered IPOs and Follow-On offerings since 2005. Includes demutualizations. As of 10/30/12. Ranked based upon number of deals. Note: $ Volume represents full credit to underwriter for All Managed Equity Deals and apportioned credit to bookrunner for Bookrun Equity Deals. Note: Stifel results based on pro forma figures for both Stifel and TWPG. (1) Net of overlapped transactions. ($ in billions) ($ in billions) Bookrun Equity Offerings <$500M Mkt Cap Since 2005 (1) All Managed Equity Offerings Since 2005 (1) The Premier Middle-Market Investment Bank Rank Firm # $ Volume 1 Bank of America Merrill Lynch 1,489 $943.3 2 JPMorgan 1,405 861.7 3 Citi 1,173 731.2 4 Morgan Stanley 1,076 735.8 5 UBS 1,076 634.2 6 Wells Fargo Securities 1,072 585.1 7 SNW / KBW Pro Forma 1,037 7 Barclays 991 619.8 8 Credit Suisse 952 650.7 9 Deutsche Bank 911 554.4 10 Goldman Sachs 875 644.2 11 RBC Capital Markets 871 391.7 12 Stifel Nicolaus Weisel 772 231.0 13 Raymond James 754 324.8 14 Oppenheimer & Co Inc 534 120.1 15 Piper Jaffray & Co 495 181.6 16 Jefferies & Company 473 119.6 17 Robert W Baird & Co 357 99.6 18 Keefe Bruyette & Woods 326 156.3 19 JMP Securities LLC 308 61.7 20 BMO Capital Markets 307 123.0 Rank Firm # $ Volume 1 Bank of America Merrill Lynch 240 $15.1 2 SNW / KBW Pro Forma 199 2 JPMorgan 186 10.1 3 Citi 182 12.8 4 UBS 160 8.6 5 Deutsche Bank 153 8.9 6 Credit Suisse 147 8.1 7 Morgan Stanley 131 7.6 8 Barclays 126 7.4 9 Stifel Nicolaus Weisel 125 5.0 10 Jefferies & Company 122 5.2 11 Wells Fargo Securities 107 5.0 12 Piper Jaffray & Co 100 3.8 13 Roth Capital Partners 87 2.3 13 RBC Capital Markets 83 3.3 15 Oppenheimer & Co Inc 79 2.7 16 Raymond James 77 3.8 17 Keefe Bruyette & Woods 75 4.5 18 Goldman Sachs 69 4.1 19 Cowen & Co LLC 64 2.0 20 Lazard Capital Markets 63 2.5 Rank Firm 1 SNW/KBW 119 1 Keefe, Bruyette & Woods, Inc. 78 2 Sandler O’Neill & Partners, L.P. 64 3 Stifel Nicolaus Weisel 41 4 J.P. Morgan Securities LLc 38 5 Morgan Stanley 33 6 Goldman, Sachs & Co. 3 7 Bank of America Merrill Lynch 20 8 Raymond James & Associates, Inc. 19 9 Barclays Capital Inc. 15 10 Citigroup Global Markets Inc. |
|
|
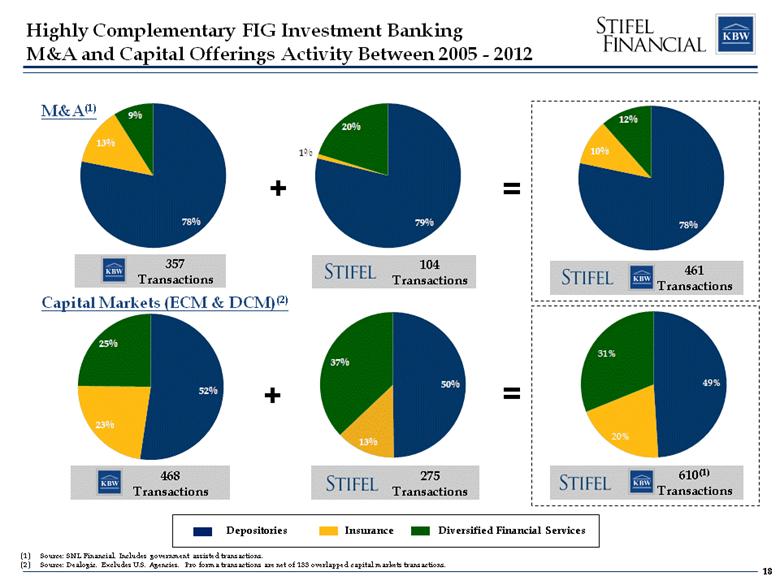
Highly Complementary FIG Investment Banking M&A and Capital Offerings Activity Between 2005 - 2012 M&A(1) Capital Markets (ECM & DCM)(2) Source: SNL Financial. Includes government assisted transactions. Source: Dealogic. Excludes U.S. Agencies. Pro forma transactions are net of 133 overlapped capital markets transactions. + = 104 Transactions 357 Transactions 461 Transactions + = 468 Transactions 610(1) Transactions 275 Transactions Depositories Insurance Diversified Financial Services 78% 13% 9% 52% 23% 25% 79% 1% 20% 49% 20% 31% 50% 13% 37% 78% 10% 12% |
|
|
Strengthens Fixed Income Capabilities KBW FIG fixed income expertise integrated into Stifel’s substantial fixed income platform Major growth initiative at Stifel, having hired 65 fixed income sales and trading professionals year-to-date Stifel’s comprehensive platform has annual client trade volume approaching $300 billion Aircraft Finance & Credit Solutions Whole Loans Municipals Emerging Markets Structured Products Fixed Income Research Products Agency/Gov’t Securities Money Markets Mortgages Asset–Backed Securities Investment Grade Credit High Yield Credit Widespread coverage with a combined fixed income institutional sales team of over 200 professionals Offers high quality fixed income research and provides custom analytics and unique insights to clients Full service loan sale advisory platform and asset/liability management services Combination strengthens platform and will be leveraged across a larger depository account base |
|
|
Leverages Stifel’s Global Wealth Management Platform Leverages a substantial Private Client platform with over 2,000 advisors with over $136 billion in client assets Provides enhanced product suite to financial advisors Enhances fixed income origination efforts, including “baby bond” offerings and preferreds Builds on Stifel’s robust yield equities platform Leverages Stifel’s GWM Platform Broad GWM Geographical Footprint National network with over 300 locations |
|
|
Growth Focused Investment Banking Research, Sales and Trading Achieved cost efficiencies July 2010 Private Client Revenue production has exceeded expectations October 2009 Significant enhancement to our Capital Markets business Achieved cost savings objectives December 2005 Bank holding company Financial holding company Grown assets from ~ $100M to $3.2B April 2007 Private Client Public Finance Seamless & efficient integration December 2008 Fixed Income IB Fixed Income Sales and Trading Private Client Seamless & efficient integration October 2011 The Proven Ability to Enhance Profitability, Build Scale and Drive Shareholder Value Stifel Share Price Performance FIG Investment Banking FIG Sales and Trading FIG Research Announced November 2012 (56 Branches) Private Client Capital Markets Achieved cost savings objectives February 2007 Each merger has been accretive to Stifel; Retention Remains High +250% Net Revenues ($MM) $5 $15 $25 $35 $45 12/31/04 5/31/06 10/31/07 3/31/09 8/31/10 1/31/12 $264 $452 $763 $870 $1,091 $1,382 $1,417 $1,593 $0 $400 $800 $1,200 $1,600 2005 2006 2007 2008 2009 2010 2011 2012 YTD Ann. |
|
|
Q&A Ronald J. Kruszewski Chairman of the Board, President, and CEO Stifel Financial Corp. Thomas B. Michaud President and CEO KBW, Inc. |