Attached files
| file | filename |
|---|---|
| 8-K - 8-K - FNB CORP/PA/ | d433221d8k.htm |
 Vincent J. Delie,
Jr. President and Chief Executive Officer
Vincent J. Calabrese, Jr.
Chief Financial Officer
F.N.B. Corporation
Investor Presentation
Third Quarter 2012
Dated: November 5, 2012
Exhibit 99.1 |
 Cautionary Statement Regarding Forward-Looking Information
and Non-GAAP Financial Information
2
This presentation and the reports F.N.B. Corporation files with the Securities and Exchange
Commission often contain “forward-looking statements” relating to
present or future trends or factors affecting the banking industry and, specifically, the financial operations, markets and products of F.N.B.
Corporation. These forward-looking statements involve certain risks and uncertainties.
There are a number of important factors that could cause F.N.B. Corporation’s
future results to differ materially from historical performance or projected performance. These factors include, but are not limited to: (1) a
significant increase in competitive pressures among financial institutions; (2) changes in the
interest rate environment that may reduce interest margins; (3) changes in prepayment
speeds, loan sale volumes, charge-offs and loan loss provisions; (4) general economic conditions; (5) various monetary and
fiscal policies and regulations of the U.S. government that may adversely affect the
businesses in which F.N.B. Corporation is engaged; (6) technological issues which may
adversely affect F.N.B. Corporation’s financial operations or customers; (7) changes in the securities markets; (8) risk factors
mentioned in the reports and registration statements F.N.B. Corporation files with the
Securities and Exchange Commission; (9) housing prices; (10) job market; (11) consumer
confidence and spending habits; (12) estimates of fair value of certain F.N.B. Corporation assets and liabilities; (13) in connection
with the pending merger with Annapolis Bancorp, Inc., difficulties encountered in expanding
into a new market; or (14) the effects of current, pending and future legislation,
regulation and regulatory actions. F.N.B. Corporation undertakes no obligation to revise these forward-looking statements or to
reflect events or circumstances after the date of this presentation. To
supplement its consolidated financial statements presented in accordance with Generally Accepted Accounting Principles (GAAP), the Corporation
provides additional measures of operating results, net income and earnings per share (EPS)
adjusted to exclude certain costs, expenses, and gains and losses. The
Corporation believes that these non-GAAP financial measures are appropriate to enhance the understanding of its past performance
as well as prospects for its future performance. In the event of such a disclosure or
release, the Securities and Exchange Commission’s Regulation G requires: (i)
the presentation of the most directly comparable financial measure calculated and presented in accordance with GAAP and (ii) a
reconciliation of the differences between the non-GAAP financial measure presented and the
most directly comparable financial measure calculated and presented in accordance with
GAAP. The required presentations and reconciliations are contained herein and can be found at our website,
www.fnbcorporation.com, under “Shareholder and Investor Relations” by clicking on
“Non-GAAP Reconciliation.”
The Appendix to this presentation contains non-GAAP financial measures used by the
Corporation to provide information useful to investors in understanding the
Corporation's operating performance and trends, and facilitate comparisons with the performance of the Corporation's peers. While
the Corporation believes that these non-GAAP financial measures are useful in evaluating
the Corporation, the information should be considered supplemental in nature and not as
a substitute for or superior to the relevant financial information prepared in accordance with GAAP. The non-GAAP
financial measures used by the Corporation may differ from the non-GAAP financial measures
other financial institutions use to measure their results of operations. This
information should be reviewed in conjunction with the Corporation’s financial results disclosed on October 22, 2012 and in its
periodic filings with the Securities and Exchange Commission. |
 Additional Information About the Merger
3
ADDITIONAL INFORMATION ABOUT THE MERGER
F.N.B.
Corporation
and
Annapolis
Bancorp,
Inc.
will
file
a
proxy
statement/prospectus
and
other
relevant
documents
with
the
SEC
in
connection
with
the
merger.
SHAREHOLDERS OF ANNAPOLIS BANCORP, INC. ARE ADVISED TO READ THE PROXY STATEMENT/PROSPECTUS
WHEN IT BECOMES AVAILABLE AND ANY OTHER RELEVANT DOCUMENTS FILED WITH THE SEC, AS WELL
AS ANY AMENDMENTS OR SUPPLEMENTS TO THOSE DOCUMENTS, BECAUSE THEY WILL CONTAIN IMPORTANT INFORMATION.
The proxy statement/prospectus and other relevant materials (when they become available), and
any other documents F.N.B. Corporation has filed with the SEC, may be obtained
free
of
charge
at
the
SEC's
website
at
www.sec.gov.
In
addition,
investors
and
security
holders
may
obtain
free
copies
of
the
documents
F.N.B.
Corporation
has
filed with the SEC by contacting James Orie, Chief Legal Officer, F.N.B. Corporation,
One F.N.B. Boulevard, Hermitage, PA 16148, telephone: (724) 983-3317; and free
copies of the documents Annapolis Bancorp, Inc. has filed with the SEC by contacting Edward
Schneider , Treasurer and CFO, Annapolis Bancorp, Inc., 1000 Bestgate Road, Suite
400, Annapolis, MD 21401, telephone: (410) 224-4455. F.N.B. Corporation and
Annapolis Bancorp, Inc. and certain of their directors and executive officers may be deemed to be participants in the solicitation of proxies from its
shareholders
in
connection
with
the
proposed
merger.
Information
concerning
such
participants'
ownership
of
Annapolis
Bancorp,
Inc.
common
stock
will
be
set
forth
in the
proxy
statement/prospectus
relating
to
the
merger
when
it
becomes
available.
This
communication
does
not
constitute
an
offer
of
any
securities
for
sale. |
 4
F.N.B. Corporation |
 Key
Facts 5
Attractive Footprint
–
#3 Market Share in the Pittsburgh MSA
–
Banking locations network spanning 45 counties
NYSE Listed
–
Market Cap of $1.5 Billion
–
Member S&P SmallCap 600 Index
Fourth Largest Pennsylvania-Based Bank
–
Assets
$12.0 Billion
–
Loans
$8.0 Billion
–
Deposits
$10.0 Billion
–
Banking Locations
266
–
Consumer Finance Locations
71
–
Headquarters
Hermitage, PA
Diverse Fee Income Sources with
Complementary Business Lines
–
Business and Personal Banking
–
Wealth Management
–
Insurance
–
Commercial Equipment Leasing
–
Merchant Banking
Diversified Financial Institution with a Network of Banking Locations
Spanning 45 Counties in Pennsylvania, Northeastern Ohio and West
Virginia
•
First National Bank Location
Ohio
Pennsylvania |
 Key
Investment Considerations 6
Strong Performance
Positioning for Sustained Growth
1.
Experienced leadership, compelling core competencies and a sustainable business model
2.
Clear market position strategy
3.
Consistent, strong operating results
4.
Ongoing reposition and reinvest focus
5.
Proven and disciplined acquisition strategy
6.
Investment thesis and high quality earnings creates P/E expansion opportunity
|
 Years of
Banking
Experience
Joined FNB
Prior Experience
President and CEO
Vincent J. Delie, Jr.
25
2005
National City
President, First National Bank
John C. Williams, Jr.
41
2008
National City, Mellon Bank
Chief Financial Officer
Vincent J. Calabrese, Jr.
24
2007
People’s United
Chief Credit Officer
Gary L. Guerrieri
26
2002
FNB, Promistar
Leadership
7
Experienced and respected executive management team |
 Core
Competencies 8
Proven success and solid foundation for sustainable growth opportunities
Core
Competency
Proven
Sustainable
Commercial
Bank -
Strong
C&I Focus
3Q12 marks fourteen consecutive quarters of organic commercial
loan
growth
(1)
C&I
loan
portfolio
comprises
34%
of
the
total
loan
portfolio
(2)(3)
People: Experienced team
of bankers built over the
past several years
Process: Proprietary, cross-
functional and enterprise-
wide sales management
process
Positioning: Attractively
positioned in markets with
growth potential
Products: Unique ability to
deliver a sophisticated
product set while
maintaining a local,
community bank culture
Consumer
Product
Distribution
Strong cross-functional and cross-sell focus
Customer-based funding comprises 98% of total deposits and
borrowings
(2)
Low Risk Profile
Operating
Strategy
Balance growth strategy with a low risk profile
Consistent, better-than-peers asset quality results
Proven,
Disciplined,
Strategic
Acquirer
Nine bank acquisitions completed since 2002 with two completed
since the beginning of 2011
Acquisition of Annapolis Bancorp, Inc. announced 10/22/2012
Acquisition evaluation guided by disciplined capital recoupment
and operating EPS accretion hurdles
Well-positioned in strategically important markets
(1)
Organic,
linked-quarter
growth
for
the
Pennsylvania
commercial
portfolio;
(2)
As
of
September
30,
2012;
(3)
Represents
C&I
and
owner-occupied
CRE |
 Sustainable Business Model
9
Sustainable Business Model
Disciplined Risk
Management
Maintain low risk
profile
Target neutral interest
rate risk position
Fund loan growth with
deposits
Adhere to consistent
underwriting and
pricing standards
Maintain rigid
expense control
Efficient capital
management
Growth
Oriented
Organic growth driven
by:
Investments in
people, product
development, high-
growth potential
market segments
Acquisition-related
growth:
FNB
Culture
Attract, retain and
develop top talent
Foster a strong cross-
sell environment
Holistic incentive
compensation
structure supports
cross-functional focus
Regularly monitor
external and internal
service excellence,
quality and
satisfaction
Recognize
accomplishments and
innovation
Shareholder
Value
Disciplined, growth
oriented focus guided
by commitment to
shareholder value
Long-term investment
thesis centered on:
Best-in-class,
enterprise-wide
sales management
Deep product set
Disciplined,
strategic, accretive
Targeted EPS
growth
Strong dividend |
 4.30%
3.20%
10.00%
6.70%
5.20%
1.20%
3.40%
11.60%
9.20%
8.70%
6.80%
5.93%
7.21%
8.90%
0.00%
2.00%
4.00%
6.00%
8.00%
10.00%
12.00%
14.00%
Pennyslvania Commercial Portfolio
Industry Leading Loan Growth
10
13
th
consecutive quarter of total loan growth
14
th
consecutive quarter of Pennsylvania commercial portfolio growth
(1)
Reflects linked-quarter average organic loan growth results on an annualized basis,
excluding reductions in the Florida commercial portfolio Total Loans
(1)
(1)
Over three years of consecutive quarterly organic loan growth accomplished
1.50%
5.60%
2.10%
3.90%
5.20%
4.40%
6.60%
5.70%
8.00%
6.00%
2.64%
4.36%
6.90%
0.00%
1.00%
2.00%
3.00%
4.00%
5.00%
6.00%
7.00%
8.00%
9.00%
FNB Excl Non-Core Florida Portfolio
(1)
PA Commercial Loans
(1) |
 Strong Profitability Trends
11
Return on Average Tangible Equity
(1)
Return on Average Tangible Assets
(1)
Peer data per SNL Financial, refer to Appendix for peer listing
(1) Operating ROTE and ROTA for FNB, excludes merger and severance costs and certain other
one-time items, refer to Non-GAAP Reconciliation included under Supplemental
Information 18.51%
16.32%
14.71%
0.00%
2.00%
4.00%
6.00%
8.00%
10.00%
12.00%
14.00%
16.00%
18.00%
20.00%
3Q12 YTD
2011
2010
FNB
Peer Group Median
1.10%
1.02%
0.87%
0.00%
0.20%
0.40%
0.60%
0.80%
1.00%
1.20%
3Q12 YTD
2011
2010
FNB
Peer Group Median |
 12
Market Position and Opportunity |
 Top
Overall Market Position 13
Source: SNL Financial, deposit data as of June 30, 2012, pro-forma as of October 26,
2012, excludes custodian bank FNB Counties of Operation
Rank
Institution
Branch
Count
Total Market Deposits
($ 000)
Total Market Share
(%)
1
PNC Financial Services Group
367
53,477,806
30.3
2
Royal Bank of Scotland Group, PLC
227
10,728,368
6.1
3
F.N.B. Corporation
274
9,437,811
5.3
4
M&T Bank Corp.
152
8,603,725
4.9
5
Huntington Bancshares, Inc.
127
6,172,157
3.5
6
Wells Fargo & Co.
76
5,575,216
3.2
7
First Commonwealth Financial
101
3,957,651
2.2
8
Banco Santander
75
3,854,650
2.2
9
Dollar Bank Federal Savings Bank
40
3,665,400
2.1
10
Susquehanna Bancshares
84
3,172,621
1.8
Total (1-188)
3,035
176,528,069
100.0
FNB
holds
the
#3
overall
retail
market
position
for
all
counties
of
operation
–
with
significant
opportunities present for continued market share gains |
  Top
Position in a Major Metropolitan Market 14
Source: MSA population per U.S. Census Bureau 2010 data; Deposit market share per SNL
Financial as of June 30, 2012, pro-forma as of October 8, 2012 (1) Excludes
custodian bank Population
Rank
MSA
(000's)
#1
#2
#3
1
New York
(1)
18,897
JPM
BofA
Citi
2
Los Angeles
12,829
BofA
Wells Fargo
Mitsubishi UFJ
3
Chicago
9,461
JPM
BMO
BofA
4
Dallas
6,372
BofA
JPM
Wells Fargo
5
Philadelphia
5,965
TD
Wells Fargo
HSBC
6
Houston
5,947
JPM
Wells Fargo
BofA
7
Washington
5,582
Capital One
Wells Fargo
BofA
8
Miami
5,565
Wells Fargo
BofA
Citi
9
Atlanta
5,269
SunTrust
Wells Fargo
BofA
10
Boston
4,552
BofA
RBS
Banco Santander
11
San Francisco
4,335
BofA
Wells Fargo
Citi
12
Detroit
4,296
JPM
Comerica
BofA
13
Riverside
4,225
BofA
Wells Fargo
JPM
14
Phoenix
4,193
Wells Fargo
JPM
BofA
15
Seattle
3,440
BofA
Wells Fargo
U.S. Bancorp
16
Minneapolis
(1)
3,280
Wells Fargo
U.S. Bancorp
TCF
17
San Diego
3,095
Wells Fargo
Mitsubishi UFJ
BofA
18
St. Louis
2,813
U.S. Bancorp
BofA
Commerce
19
Tampa
2,783
BofA
Wells Fargo
SunTrust
20
Baltimore
2,710
BofA
M&T
PNC
21
Denver
2,543
Wells Fargo
FirstBank
U.S. Bancorp
22
Pittsburgh
(1)
2,356
PNC
RBS
23
Portland
2,226
BofA
U.S. Bancorp
Wells Fargo
24
Sacramento
2,149
Wells Fargo
BofA
U.S. Bancorp
25
San Antonio
2,143
Cullen/Frost
BofA
Wells Fargo
Top 3 Banks in MSA by Deposit Market Share
FNB is uniquely
positioned as
one of only very
few community
banks to hold a
Top 3 deposit
market rank in
one of the
nation’s 25
largest
metropolitan
statistical areas.
F.N.B. Corporation |
 Pittsburgh Market Opportunity
15
Pittsburgh, PA
FNB Presence
Strong FNB Presence
Pittsburgh MSA Market
Deposits
(1)
$3.5 billion
% of FNB Total Deposits
(1)
39%
Deposit Market Share
(1) (2)/
Rank
4.5% / #3
Market
Deposits
(2)
$96.7 billion
Population
(2)
2.4 million
Households
(2)
1.0 million
(1) As of June 30, 2012; Market Share Rank excludes custodian bank; (2) Data per SNL; (3)
Source: PittsburghToday.org 4-Year % Change in Jobs
Sept. 2008 –
Sept. 2012
(3)
1-Year Housing
Appreciation
Unemployment Rate
(3)
1
Quarter 2012
st
–
22
nd
largest
based
on
population
–
16
th
largest
based
on
deposits
–
Favorable economic trends that have
outperformed much of nation
(3)
–
#3 market retail rank
–
Regional headquarters accommodating all
lines of business |
 Pittsburgh Market Position Timeline
16
Successful execution of an organic and acquisition growth strategy in the Pittsburgh
market 2004
2008
2009
2011
2003
2002
2005
2006
2007
2010
Iron &
Glass
Bancorp
Deposits:
$0.2 bn
Parkvale
Financial
Deposits:
$1.5 bn
Promistar
Financial
(Market
Entry)
Deposits:
$0.6 bn
Slippery
Rock
Deposits:
$0.2 bn
NSD
Bancorp
Deposits:
$0.4 bn
Invest in
Downtown Pittsburgh
Regional Headquarters
Relocate Wealth
Management and Insurance
to Downtown Pittsburgh
Lift-out of
Asset-Based
Lending
Group from
RBS Citizens
Bank
Acquisitions:
Other
Actions:
Lift-out of
Commercial
Banking Team
from
National City
12/31/2001:
Market Rank #34
Deposits
(1)
: $161 mm
Employees (FTE): 40
9/30/2012:
Market Rank #3
Deposits
(1)
: $3.5 bn
Employees (FTE): 592
2012
(1) Source: SNL Financial as of June 30 of each respective year |
 Market Opportunity
17
Note: Above metrics at the MSA level
(1)
Data per Hoover’s as of October 29, 2012
(2)
Data per SNL Financial
1,000,755
852,488
223,760
230,329
227,644
1,042,841
200,000
400,000
600,000
800,000
1,000,000
1,200,000
# of Households
$45,359
$46,212
$53,289
$41,077
$39,404
$62,687
$0
$10,000
$20,000
$30,000
$40,000
$50,000
$60,000
$70,000
Median Household Income
2,356,285
2,077,240
549,745
563,631
565,773
2,710,489
-
500,000
1,000,000
1,500,000
2,000,000
2,500,000
3,000,000
Population
9,699
9,142
2,160
2,016
1,939
10,690
-
2,000
4,000
6,000
8,000
10,000
12,000
# of Companies with Revenue Greater Than $1 Million
(2)
(2)
(1)
(2)
- |
 Marcellus and Utica Shale Exposure
18
(1) Sources: www.marcellus.psu.edu, retrieved May 31, 2012; (2) www.dnr.state.oh.us, retrieved
May 31, 2012; (3) Sterne Agee June 7, 2010 and FBR Capital Markets, March 2,
2011. FNB is well-positioned in the Marcellus Shale and Utica
Shale regions with a Pennsylvania footprint that closely
aligns with the Marcellus Shale concentration and
exposure to the Utica Shale region in Ohio.
FNB has been noted by analysts as being one of the
best geographically positioned banks to benefit from
the Marcellus Shale.
(3)
This presents opportunity for FNB given the expected
positive economic lift across much of FNB’s footprint.
FNB Banking Locations
Pennsylvania
Ohio
Ohio Utica Shale Well Locations
(2)
(1) |
 Marcellus and Utica Shale FNB Strategic Focus
19
Opportunity for FNB relates to potential indirect and induced economic benefits across
footprint Direct Effect:
Oil and Gas
Directly associated with the extraction, processing and
delivery of the gas
Drilling, extraction and support activities
Indirect Effect:
Supply Chain
Provides goods and services to the energy industry
e.g.: Iron and steel, transportation, commodity traders,
heavy equipment, surveyors, utilities, rig parts,
attorneys, real estate, machinery manufacturers, etc.
Induced Benefit:
Consumption
Resulting benefit to industries and individuals from
positive direct and indirect effects
e.g.: Higher education, travel, housing, food and drink,
entertainment, utilities, etc.
FNB
Strategic Focus:
Supply Chain and
Consumption |
 20
Strong Operating Results |
 3Q12 Operating Highlights
21
3Q12
2Q12
3Q11
Consistent
Earnings
Growth
Net income
$30,743
$29,130
$23,773
Earnings per diluted share
$0.22
$0.21
$0.19
Profitability
Performance
ROTE
(1)
19.10%
19.01%
16.23%
ROTA
(1)
1.03%
1.00%
0.95%
Net interest margin
3.70%
3.80%
3.79%
Efficiency ratio
56.8%
57.7%
59.0%
Strong
Organic
Balance Sheet
Growth
Trends
(2)
Total loan growth
(3)
6.9%
4.4%
8.1%
Commercial loan growth
(3)
8.9%
7.2%
8.7%
Consumer loan growth
12.0%
8.3%
9.1%
Transaction
deposits
and
customer
repo
growth
(4)
8.7%
14.3%
5.6%
(1) ROTE and ROTA are non-GAAP measures, refer to Non-GAAP Reconciliation included
under Supplemental Information; (2)Average, annualized linked quarter organic growth
results; (3)Excludes the Florida commercial portfolio; (4)Excludes time deposits |
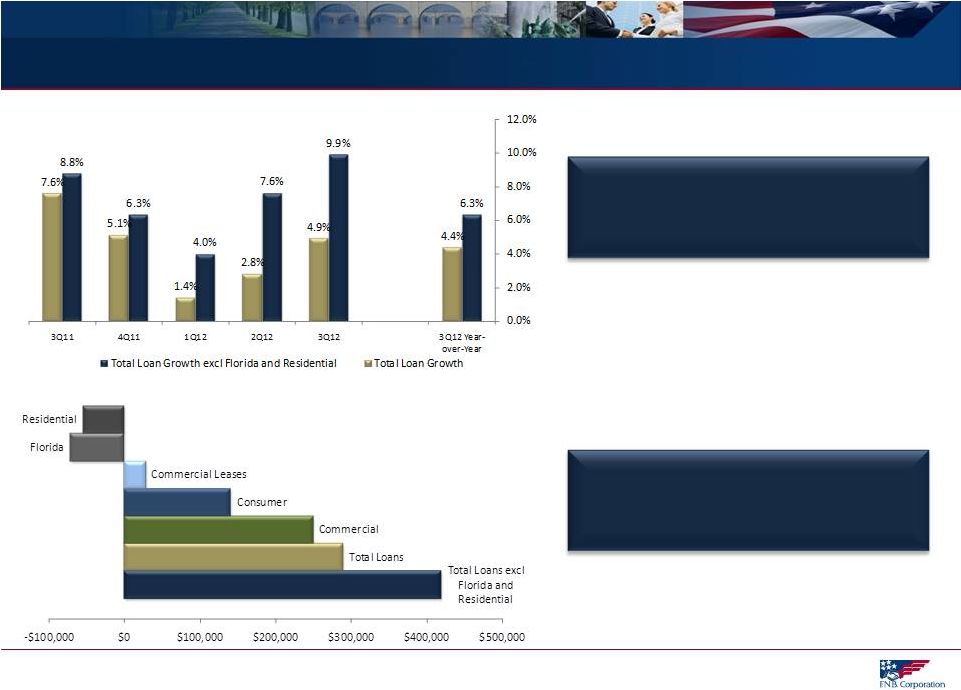 Sustained Loan Growth Momentum
22
(1)
Average, linked-quarter organic growth results
(2)
Year-over-year (Y-o-Y) organic growth results by portfolio, $ in
millions (3)
The Florida portfolio is an exit-strategy portfolio, the residential portfolio has
experienced accelerated pre-payment speeds and expected declines following the
Parkvale acquisition. Positive loan growth results despite
declines in the Florida portfolio and the
residential
mortgage
portfolio
(3)
Strong year-over-year results for FNB’s
commercial and consumer portfolios
Linked
Quarter
and
Y-o-Y
Loan
Growth
(%)
(1)
Y-o-Y
Loan
Growth
($)
(2) |
 Positive Operating
Trends: Pre-Provision Net Revenue Results 23
21%
Year-over-Year
PPNR
Growth
9%
$147,993
$122,014
$
-
$20,000
$40,000
$60,000
$80,000
$100,000
$120,000
$140,000
$160,000
3Q12
YTD
3Q11 YTD
$1.05
$0.96
$0.90
$0.92
$0.94
$0.96
$0.98
$1.00
$1.02
$1.04
$1.06
$1.08
3Q12 YTD
3Q11 YTD
Pre-Provision Net Revenue EPS
Pre-Provision Net Revenue
9%
Year-over-Year
PPNR EPS
Growth
21%
Pre-provision net revenue (PPNR) represents net interest income (FTE), plus
non-interest income (excluding securities gains and losses and OTTI) less non-
interest expense. Non-interest income and non-interest expense have been
adjusted to exclude certain non-operating items, refer to appendix for calculation. |
 Net
Interest Margin 24
Net Interest Margin Trend
Parkvale
Acquisition
1/1/2012
Net interest margin results reflects effective interest rate risk management
Consistent loan and transaction deposit growth contributes to stability in the net interest
margin 3Q12 and 2Q12 margin included the benefit of $1.4 million and $2.5 million,
respectively, in accretable yield on acquired loans.
Total
variable
and
adjustable-rate
loans
total
59.6%
of
total
loans
at
both
September
30,
2012
and
December 31, 2011
3.65%
3.70%
0.05%
0.10%
3.70%
3.80%
3.74%
3.79%
3.79%
3.00%
3.20%
3.40%
3.60%
3.80%
4.00%
3Q12
2Q12
1Q12
4Q11
3Q11
Core Net Interest Margin
Accretable Yield |
 Asset Quality Results
(1)
25
$ in thousands
3Q12
2Q12
3Q11
3Q12 Highlights
NPL’s+OREO/Total loans+OREO
1.69%
1.93%
2.48%
Overall results reflect the consistent,
solid performance of the core portfolios
(Pennsylvania and Regency portfolios,
representing 99.1% of total loans)
Non-performing loans plus OREO
declined $13.3 million or 10.1%
Provision for loan losses
$6.2 million for the originated
portfolios
$2.2 million for the acquired
portfolios
Continued positive trends seen in
delinquency levels
NCO’s remain at good levels
Total delinquency
1.66%
1.78%
2.35%
Provision for loan losses
(2)
$8,429
$7,027
$8,573
Net charge-offs (NCO’s)
(2)
$7,362
$7,473
$8,984
NCO’s/Total average loans
(2)
0.37%
0.38%
0.53%
NCO’s/Total average originated loans
0.42%
0.45%
0.56%
Allowance for loan losses/
Total loans
1.43%
1.49%
1.69%
Allowance for loan losses/
Total non-performing loans
120.23%
104.89%
86.75%
(1) Metrics shown are originated portfolio metrics unless noted as a total
portfolio metric. “Originated portfolio” or “Originated loans” excludes loans
acquired at fair value and accounted for in accordance with ASC 805 (effective January 1,
2009), as the risk of credit loss has been considered by virtue of the
Corporation’s estimate of fair value.
(2) Total portfolio metric
|
 Positive Asset Quality Trends
26
Peer data per SNL Financial, refer to Appendix for peer listing;
(1) Based on balances at year-end and quarter-end for each period presented.
“Originated Loans”
excludes loans acquired at fair value and accounted for in accordance with ASC 805 (effective
January 1, 2009), as the risk of credit loss has been considered by virtue of the
Corporation’s estimate of fair value; (2) Florida-related NCO’s 3Q12 YTD included in total metric
NPL’s+OREO to Originated Loans+OREO
(1)
NCO’s to Average Originated Loans
(1)
0.77%
0.62%
0.39%
0.00%
0.20%
0.40%
0.60%
0.80%
1.00%
1.20%
1.40%
2010
2011
3Q12 YTD
FNB excluding Florida
Florida
Peer
Group
Median
(2)
2.74%
2.15%
1.69%
1.56%
1.28%
1.22%
0.00%
0.50%
1.00%
1.50%
2.00%
2.50%
3.00%
3.50%
4.00%
2010
2011
3Q12
FNB
FNB Excluding Florida Portfolio
Peer Group Median |
 Diversified Loan Portfolio
27
Note: Balance, CAGR and % of Portfolio based on period-end balances
9/30/12
CAGR
% of Portfolio
($ in millions)
Balance
12/08-
9/12
12/31/08
9/30/12
C&I
$1,532
13.7%
16%
19%
CRE: Non-Owner Occupied
1,368
10.7%
16%
17%
CRE: Owner Occupied
1,229
5.6%
17%
15%
Commercial Leases
127
38.9%
1%
2%
Total Commercial
$4,256
10.6%
50%
53%
Consumer Home Equity
1,670
8.9%
21%
21%
Residential Mortgage
1,074
18.0%
10%
14%
Indirect
570
3.1%
9%
7%
Other
173
2.8%
3%
2%
Regency
164
1.0%
3%
2%
Florida
72
-31.3%
5%
1%
Total Loan Portfolio
$7,979
8.8%
100%
100%
Well diversified portfolio
Strong growth results driven by commercial loan growth
$8.0 Billion Loan Portfolio
September 30, 2012
Commercial &
Industrial 19%
Consumer
Home Equity
21%
Residential
Mortgage 14%
Indirect
7%
Other 2%
Regency 2%
Florida 1%
Commercial
Leases 2%
CRE: Owner
Occupied 15%
CRE: Non-
Owner
Occupied 17% |
 Deposits and Customer Repurchase Agreements
28
Note: Balance, CAGR and % of Portfolio based on period-end balances; (1) Transaction
deposits include savings, NOW, MMDA and non-interest bearing deposits; (2) December
31, 2008 through September 30, 2012; (3) Transaction-based deposits represent all deposits and customer
repos other than time deposits
9/30/12
CAGR
Mix %
($ in millions)
Balance
12/08-
9/12
12/31/08
9/30/12
Savings, NOW, MMDA
$4,539
13.6%
44%
45%
Time Deposits
2,626
3.4%
36%
26%
Non-Interest Bearing
1,736
18.5%
14%
17%
Customer Repos
1,111
30.0%
6%
11%
Total Deposits and
Customer Repo Agreements
$10,012
12.3%
100%
100%
Transaction Deposits
(1)
and
Customer Repo Agreements
$7,386
16.6%
64%
74%
Loans to Deposits and Customer Repo Agreements Ratio =
80% at September 30, 2012
Focus on new client acquisition and growing lower cost relationship-based deposits
–
16.6%
average
growth
for
transaction
deposits
and
customer
repo
agreements
(2)
–
74%
of
total
deposits
and
customer
repo
agreements
are
transaction-based
deposits
(3)
$10.0 Billion Deposits and
Customer Repo Agreements
September 30, 2012
Non-Interest
Bearing 17%
Savings, NOW,
MMDA 45%
Customer
Repos 11%
Time Deposits
26% |
 %
Ratings
($ in millions
(1)
)
Portfolio
Investment %
Agency MBS
$1,160
48%
AAA
100%
Highly Rated $2.4 Billion Investment Portfolio
September 30, 2012
CMO Agency
513
21%
AAA
100%
Agency Senior Notes
342
14%
AAA
100%
Municipals
183
7%
AAA
AA
A
2%
90%
8%
Short-Term
164
7%
AAA
100%
Trust Preferred
(2)
29
1%
A
BBB
BB
B
CCC
C
3%
5%
25%
10%
7%
50%
CMO Private Label
19
1%
AAA
AA
A
BBB
BB
CCC
19%
8%
14%
23%
15%
21%
Corporate
17
1%
AA
A
BBB
12%
61%
27%
Bank Stocks
2
-
Non-Rated
Commercial MBS
1
-
AAA
100%
Total Investment Portfolio
$2,430
100%
Investment Portfolio
29
(1) Amounts reflect GAAP; (2) Original cost of $107 million, adjusted cost of $44 million,
fair value of $29 million 2%
AAA, 89.4%
AA, 7.4%
A, 1.2%
BBB,BB,B
CCC,CC,C
Non
Rated
-
98% of total portfolio rated AA or better
Relatively low duration of 2.8
Municipal bond portfolio
–
Highly rated with an average rating of AA and 100%
of the portfolio rated A or better
–
General obligation bonds = 99.5% of portfolio
–
77.9% from municipalities located throughout
Pennsylvania |
 Well Capitalized
30
Consistent capital management strategy focused on the efficient use of capital
Regulatory “Well-Capitalized”
Dividend Payout Ratio
3Q12 YTD
2011
2010
FNB
62.3%
69.7%
74.0%
Regional Peer Group Median
37.1%
31.1%
40.0%
12.0%
10.5%
8.1%
6.0%
12.2%
10.6%
8.2%
6.0%
0.0%
2.0%
4.0%
6.0%
8.0%
10.0%
12.0%
14.0%
Total Risk-Based
Tier One
Leverage
Tangible Common Equity
June 30, 2012
September 30, 2012 |
 31
Acquisition Strategy |
 Strategy
Focus on strategically important markets with growth potential.
Acquisition-related expansion has historically been focused on enhancing presence in the
Pittsburgh market and eastern and central Pennsylvania.
Consideration also given to contiguous attractive markets with concentrated commercial and
industrial business prospect opportunities.
Acquisition Criteria/Evaluation
Proficient due diligence and integration team in place
Disciplined approach to identifying and selecting targets
Targeted financial hurdles taken into consideration
Accretive to operating earnings per share the first full year following close.
Recoup diminution of capital within a relatively short time-period (target 12-18
months). Superior post-acquisition execution
Acquisition Strategy
32 |
 Acquisition-Related Expansion
33
FNB Banking Location (pro-forma, including 8 ANNB branches in Maryland)
Erie
Pre-2002
Presence
Additional
Acquisition-Related Expansion
Pittsburgh
MSA Acquisition Expansion
Pending
ANNB Acquisition
Nine bank
acquisitions
completed since
2002, totaling $7.9
billion in assets
Pending acquisition
of ANNB announced
on October 22, 2012 |
 34
Investment Thesis |
 Long-Term Investment Thesis
35
FNB’s long-term investment thesis reflects a commitment to efficient capital management
and creating value for our shareholders
Long
-Term Investment Thesis:
Targeted EPS Growth
5-6%
Expected Dividend Yield
(Targeted Payout Ratio 60-70%)
4-6%
Total Shareholder Return
9-12% |
 Relative Valuation Multiples
36
FNB
Regional Peer
Group Median
National Peer
Group Median
(1)
Price/Earnings Ratio
(2)
FY13 Consensus EPS (FNB=$0.88)
12.1x
12.8x
12.8x
Price/Tangible Book Value
(2)
2.2x
1.4x
1.4x
Price/Book Value
(2)
1.1x
1.1x
1.1x
Dividend Yield
(2)
4.5%
2.9%
2.3%
FNB has a modest P/E valuation relative to peers given its higher-quality earnings stream,
stronger dividend yield and future growth potential
Data per SNL Financial: Price/Earnings Ratio based on analyst consensus estimates for FNB and
peers; (1) National peer group consists of banks with assets between $5 and $25
billion; (2) As of October 26, 2012 closing prices (FNB=$10.69) |
   FNB
Among Top Performing Banks 37
Assets
($ billions)
ROTCE (%)
Efficiency
Ratio (%)
Net Charge
Offs (%)
Net
Interest
Margin
Price/TBV (x)
Price/ 2013E
EPS (x)
Dividend
Yield (%)
Total Return
3 Yr (%)
Peer Median Results
Regional Peer Group
$9.5
11.45
58.0
0.57
3.73
1.36
12.8
2.89
27.86
Top 100 Banks/Thrifts Based on Asset Size
$13.3
11.23
62.2
0.46
3.62
1.37
12.6
2.35
23.04
Top 100 Trading at > 2.0x Tangible Book
$13.7
18.12
56.8
0.46
3.58
2.31
12.6
2.71
67.83
F.N.B. Corporation
$12.0
18.51
58.3
0.34
3.75
2.20
12.1
4.49
81.28
Year-to-Date Performance
Relative Valuation/Total Return
Notes: Data per SNL Financial and FNB. Year-to-date performance represents
the first nine months of 2012. Relative valuation metrics and total return as of
October 26, 2012. FNB ROTCE represents operating ROTCE – refer to Supplemental
Information. |
 Relative Valuation Analysis
Where a bank trades relative to tangible book value is highly correlated with its projected
return on tangible capital
Source: SNL Financial as of 10/30/12; Note: Data set above includes FNB’s regional peer
group; (1)R-squared represents the percentage of the variation in price to tangible
book value (P/TBV) that can be explained by variation in 2013E projected return on average tangible equity (ROATE); (2)Based on
consensus mean estimates for FY2013.
38
FNB
currently
trades at a
discount to
its peers
based on its
projected
ROATE of
18.3%
(2)
6%
8%
10%
12%
14%
16%
18%
20%
0.50x
0.75x
1.00x
1.25x
1.50x
1.75x
2.00x
2.25x
2.50x
2.75x
Price/Tangible Book Value
R-squared
=
78%
(1) |
 39
Supplemental Information |
 40
Supplemental Information Index
Acquisition Announcement Presentation: Annapolis Bancorp, Inc., October 22, 2012
Loan Risk Profile (September 30, 2012)
Regency Finance Company Profile
Regional Peer Group Listing
Board of Directors
GAAP to Non-GAAP Reconciliation
Third Quarter 2012 Earnings Release (October 22, 2012) |
 F.N.B. Corporation
Announces Agreement to Acquire
Annapolis Bancorp, Inc.
October 22, 2012 |
 Natural
progression Consistent with stated expansion strategy
Market opportunity
Attractive demographics
Significant commercial banking opportunities
Excellent retail and wealth opportunities
Access to greater Baltimore and Washington
D.C. markets
Execute FNB’s scalable, proven business
model and strong sales management culture
Establishes
a
5
th
FNB
region
(refer
to
page
5)
Attractive partner
ANNB is a relationship-focused bank with
strong community ties and presence
Opportunity Overview
42
Source:
Deposit
and
demographic
data
per
SNL
Financial;
deposits
as
of
June
30,
2012
(1) Includes branch opened October, 2012 in Waugh Chapel
County
Branches
Deposits in
Market ($000)
HH Income
($ -
2011)
Anne
Arundel,
MD
(1)
7
298,251
79,692
Queen Anne’s, MD
1
45,107
72,774
FNB Current Wtd Avg. by County
42,350
Attractive Market Entry Opportunity
Markets conducive to FNB’s model
Annapolis Bancorp (ANNB) (8 branches)
(1)
F.N.B. (FNB) (266 branches) |
 Market Opportunity
43
Leverage FNB’s core competencies and proven business model in a high growth market
Execute FNB’s scalable, cross-functional sales management process
Regional model with local decision making, market leaders, credit authority and functional
support Competitive environment : Similar to FNB’s larger markets
Future
opportunity
for
expansion:
25
identified
banks
in
close
proximity
(1)
Attractive markets present commercial and retail opportunities
Strong demographics present retail, wealth management, private banking and insurance
opportunities Strong commercial opportunities with access to more than 35,000 companies
within 50-mile radius (1)
Source: SNL Financial; Includes banks with assets between $200 million and $5 billion with
NPA’s/assets<4%; Excludes MHC’s, merger targets and banks with 5 or fewer
branches (2)
Source: Hoover’s; Includes companies within a 50-mile radius of ANNB headquarters
with revenue >$5 million, between $1 and $5 million and total companies with
revenue >$1 million Number
of
Commercial
Companies
Within
50-Mile
Radius
of
ANNB
(2)
9,693
25,379
35,072
0
5,000
10,000
15,000
20,000
25,000
30,000
35,000
40,000
>$5 million
$1-$5 million
Total
Revenue |
 44
FNB’s Regional Model
Northwest Region
Pittsburgh Region
Central Region
Capital Region
Newly Created
Maryland Region
The ANNB transaction will
create
a
5
th
FNB
region
Benefits of a regional model
Local established
management team with
strong ties to region
Local decision making
Leverage newly created
regional hub to integrate
future acquisitions
Regional Model
FNB Regions |
 (1)
Based on FNB stock price as of Friday, October 19, 2012
(2)
Subject to incremental cash pay-out for potential credit -related adjustment
(3)
Dependent upon credit related adjustment
(4)
Excluding one-time costs
Transaction Overview
45
Consideration
$12.09
(1)
per Annapolis Bancorp share
Fixed 1.143x exchange ratio
100%
stock
(2)
Price/TBV of 1.56x
Credit Related
Adjustment
Maximum additional cash consideration of up to $0.36 per share in cash based
on Annapolis Bancorp’s ability to resolve an agreed upon credit
matter Gross Credit Mark
5%
-
6%
of
loans
(3)
Detailed Due Diligence
Completed
Required Approvals
Customary regulatory and Annapolis Bancorp shareholders
Expected Closing
April 2013
TARP Repayment
Annapolis Bancorp intends to redeem its $4 million of remaining TARP prior to
closing, subject to Treasury approval
Financial Impact
Neutral to tangible book value per share
Highly accretive on a marginal basis to earnings per share
Slightly
accretive
to
total
FNB
earnings
per
share
in
the
first
full
year
(4) |
 46
Source: SNL Financial and public filings as of June 30, 2012.
Annapolis Bancorp, Inc. Financial Overview
Consumer
3%
C&D
13%
CRE
41%
C&I
16%
Home Equity
12%
1-4 Family
16%
5.66%
Yield:
Savings
38%
Time
Deposits
21%
NOW
10%
Money
Market
15%
Noninterest
Bearing
16%
0.47%
Cost:
$297 Million Loan Portfolio
$343 Million of Deposits
Annapolis Bancorp (8 branches) |
  Annapolis Bancorp, Inc. Financial Highlights
47
Source: SNL Financial and public filings.
($ in millions, except EPS)
Year Ended December 31
Quarter Ended
2008
2009
2010
2011
03/31/12
06/30/12
Balance Sheet
Total Assets
$395
$444
$432
$442
$441
$437
Gross Loans
268
282
280
290
301
297
Total Deposits
301
350
341
350
347
343
Loans / Deposits
89%
80%
82%
83%
87%
87%
Capital
TARP
$0
$8
$8
$8
$8
$4
Common Equity
27
25
27
29
30
31
TCE / TA
6.8%
5.5%
6.2%
6.6%
6.8%
7.0%
Tier 1 Ratio
11.4
12.5
12.8
12.8
12.7
11.8
Total Capital Ratio
12.6
13.7
14.1
14.0
14.0
13.1
Leverage Ratio
8.4
8.6
9.1
9.4
9.6
8.8
Income Statement
Net Income
$1.4
($1.7)
$1.6
$2.2
$0.8
$0.9
ROAA
0.38%
(0.38%)
0.37%
0.50%
0.75%
0.83%
ROAE
5.4
(5.2)
4.7
6.1
8.7
10.4
Net Interest Margin
3.6
3.3
3.7
3.9
3.8
3.9
Efficiency Ratio
70
76
72
69
67
65
Fee Income / Revenue
12
12
11
10
10
10
EPS
$0.35
($0.56)
$0.29
$0.39
$0.18
$0.21
Asset Quality
Reserves / Loans
1.54%
2.81%
2.45%
2.47%
2.25%
2.32%
NPAs / Assets
1.64
4.35
2.35
1.88
1.94
1.97
NCOs / Avg. Loans
0.21
1.00
1.16
0.64
0.79
(0.04) |
 48
Additional Supplemental Information |
 49
Loan Risk Profile
$ in millions
Balance 9/30/12
% of Loans
NPL's/Loans
(1)
YTD Net Charge-
Offs/Loans
(1)
Total Past
Due/Loans
(1)
Commercial and Industrial
$1,532,366
19.2%
0.45%
0.56%
0.65%
CRE: Non-Owner Occupied
1,368,038
17.1%
1.33%
0.10%
1.63%
CRE: Owner Occupied
1,228,991
15.4%
2.02%
0.29%
2.55%
Home Equity and Other Consumer
1,806,577
22.6%
0.37%
0.25%
0.79%
Residential Mortgage
1,073,596
13.5%
0.96%
0.02%
2.52%
Indirect Consumer
569,514
7.1%
0.19%
0.36%
0.97%
Regency Finance
163,954
2.1%
4.20%
3.50%
3.55%
Commercial Leases
127,065
1.6%
0.90%
0.37%
1.74%
Florida
71,887
0.9%
19.44%
-0.32%
19.44%
Other
37,462
0.5%
9.34%
2.66%
9.39%
Total
$7,979,450
100.0%
1.19%
0.39%
1.66%
(1)
Originated portfolio metric |
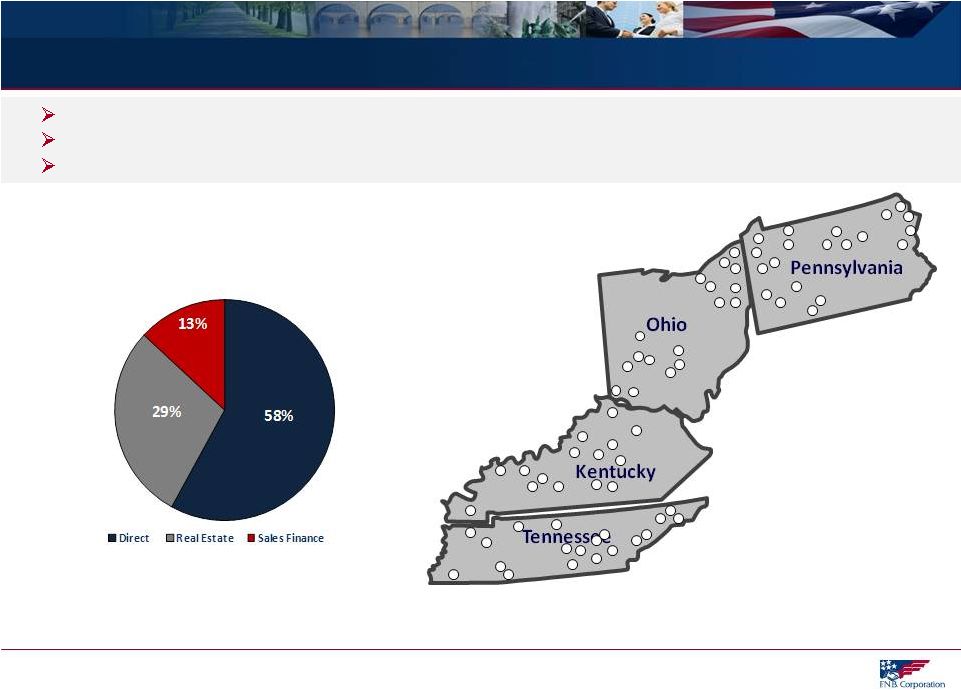 Conservatively run consumer finance business with over 80 years of consumer lending
experience Good credit quality: Year-to-date net charge-offs to average
loans of 3.50% Strong returns: First nine months of 2012: ROA 3.19%, ROE 33.66%, ROTE
37.92% Regency Finance Company Profile
(1)
Return on average tangible common equity (ROTCE) is calculated by dividing net
income less amortization of intangibles by average common equity less
average intangibles. 50
71 Locations
Spanning Four
States
Regency Finance Company
$164 Million Loan Portfolio
87% of Real Estate Loans are First Mortgages |
 Regional Peer Group Listing
51
ASBC
Associated Bancorp
NPBC
National Penn Bancshares, Inc.
CBSH
Commerce Bancshares, Inc.
ONB
Old National Bancorp
CBU
Community Bank Systems, Inc.
PRK
Park National Corp
CHFC
Chemical Financial Corp.
PVTB
Private Bancorp, Inc.
CRBC
Citizens Republic Bancorp, Inc.
SBNY
Signature Bank
CSE
CapitalSource, Inc.
SUSQ
Susquehanna Bancshares, Inc.
FCF
First Commonwealth Financial
TCB
TCF Financial Corp.
FFBC
First Financial Bancorp, Inc.
UBSI
United Bankshares, Inc.
FMBI
First Midwest Bancorp, Inc.
UMBF
UMB Financial Corp.
FMER
First Merit Corp.
VLY
Valley National Bancorp
FULT
Fulton Financial
WSBC
WesBanco, Inc.
MBFI
MB Financial, Inc.
WTFC
Wintrust Financial Corp.
NBTB
NBT Bancorp, Inc. |
 Board of Directors
52
Name
Age
Director
Since
Biography
Stephen J. Gurgovits
69
1981
Chairman of the Board effective January 2012; former Chief Executive Officer of F.N.B.
Corporation Vincent J. Delie, Jr.
48
2012
President and Chief Executive Officer effective January 2012
William B. Campbell
74
1975
Former Chairman of the Board; More than 30 years executive experience in the manufacturing,
steel, commercial development and construction industries.
James D. Chiafullo
54
2012
Partner, Cohen & Grigsby, PC
Philip E. Gingerich
75
2008
Director of Omega Financial Corporation from 1994 to 2008; retired real estate appraiser,
broker and consultant.
Robert R. Goldstein
72
2003
Over 46 years experience in the financial services industry; principal of CapGen Financial
Advisors LLC since 2007; Former Chairman of Bay View Capital Corporation.
Dawne S. Hickton
54
2006
Vice Chairman, president and chief executive officer of RTI International Metals, Inc. based
in Pittsburgh, Pennsylvania.
David J. Malone
58
2005
President and Chief Executive Officer of Gateway Financial Group, Inc., a financial services
firm located in Pittsburgh, Pennsylvania.
D. Stephen Martz
70
2008
Over 45 years experience in the banking and financial services industry; former director,
president and chief operating officer of Omega Financial Corporation.
Robert J. McCarthy
69
2012
Previously President and CEO of Parkvale Bank and Parkvale Financial Corporation and Vice
Chairman of Parkvale Financial Corporation’s Board of Directors.
Harry F. Radcliffe
61
2002
Investment manager with extensive prior experience in the financial services industry.
Arthur J. Rooney, II
60
2006
President of Pittsburgh Steelers Sports, Inc.; of counsel with Buchanan, Ingersoll &
Rooney, P.C. John W. Rose
63
2003
Has served on the boards of 25 separate banks or bank holding companies; currently principal
of CapGen Financial Advisors LLC.
Stanton R. Sheetz
57
2008
Co-owner and Chief Executive Officer of Sheetz, Inc.; director of Omega Financial
Corporation from 1994 to 2008.
William J. Strimbu
51
1995
President of Nick Strimbu, Inc. since 1994, a trucking company with common carrier authority.
Earl K. Wahl
71
2002
Over 36 years executive experience, owning and operating various businesses involving mining,
drilling, industrial contracting, restaurant, municipal and environmental services.
|
 GAAP to Non-GAAP Reconciliation
53
Return on Average Tangible Equity
Return on Average Tangible Assets
September 30, 2012
June 30, 2012
September 30, 2011
2012
2011
Net income
$30,743
$29,130
$23,774
$81,455
$63,310
Return on average tangible equity
Net income, annualized
$122,304
$117,162
$94,319
$108,805
$84,646
Amortization of intangibles, net of tax, annualized
5,798
6,192
4,663
5,984
4,701
$128,102
$123,354
$98,982
$114,789
$89,347
Average shareholders' equity
$1,385,282
$1,367,333
$1,210,953
$1,368,457
$1,169,258
Less: Average intangible assets
714,501
718,507
601,010
717,390
600,020
Average tangible equity
$670,781
$648,826
$609,942
$651,066
$569,238
Return on average tangible equity
19.10%
19.01%
16.23%
17.63%
15.70%
Return on average tangible assets
Net income, annualized
$122,304
$117,162
$94,319
$108,805
$84,646
Amortization of intangibles, net of tax, annualized
5,798
6,192
4,663
5,984
4,701
$128,102
$123,354
$98,982
$114,789
$89,347
Average total assets
$11,842,204
$11,734,221
$9,971,847
$11,713,834
$9,845,310
Less: Average intangible assets
714,501
718,507
601,010
717,390
600,020
Average tangible assets
11,127,704
$
11,015,714
$
9,370,837
$
10,996,443
$
9,245,290
$
Return on average tangible assets
1.15%
1.12%
1.06%
1.04%
0.97%
For the Quarter Ended
September 30 Year-to-Date |
 GAAP to Non-GAAP Reconciliation
54
Year-to-Date and Full Year
Operating Return on Average Tangible Equity
Operating Return on Average Tangible Assets
2012
2011
2011
2010
Operating net income
Net income
$81,455
$63,310
$87,047
$74,652
Add: Merger and severance costs, net of tax
5,206
2,983
3,238
402
Less: Gain on sale of building, net of tax
942
Less: One-time pension credit
6,853
Operating net income
$85,719
$66,294
$90,285
$68,201
Operating return on average tangible equity
Operating net income (annualized)
$114,500
$88,634
$90,285
$68,201
Amortization of intangibles, net of tax (annualized)
5,984
4,701
4,698
4,364
$120,484
$93,335
$94,983
$72,565
Average shareholders' equity
$1,368,457
$1,169,258
$1,181,941
$1,057,732
Less: Average intangible assets
717,390
600,020
599,851
564,448
Average tangible equity
$651,066
$569,238
$582,090
$493,284
Operating return on average tangible equity
18.51%
16.40%
16.32%
14.71%
Operating return on average tangible assets
Operating net income (annualized)
$114,500
$88,634
$90,285
$68,201
Amortization of intangibles, net of tax (annualized)
5,984
4,701
4,698
4,364
$120,484
$93,335
$94,983
$72,565
Average total assets
$11,713,834
$9,845,310
$9,871,164
$8,906,734
Less: Average intangible assets
717,390
600,020
599,851
564,448
Average tangible assets
10,996,443
$
9,245,290
$
9,271,313
$
8,342,286
$
Operating return on average tangible assets
1.10%
1.01%
1.02%
0.87%
September 30 Year-to-Date
Year Ended |
 GAAP to Non-GAAP Reconciliation
55
(1)
Represents gain on sale of building, net gain/(loss) on securities and OTTI
(2)
Represents merger and severance costs
Pre-Provision Net Revenue
2012
2011
Pre-Provision Net Revenue (PPNR)
Net interest income (FTE)
$284,518
$242,353
Non-interest income
99,336
87,320
Non-interest expense
242,237
212,143
Pre-Provision Net Revenue (GAAP)
$141,617
$117,529
Less: Non-operating
non-interest
income
(1)
1,633
105
Add: Non-operating
non-interest
expense
(2)
8,009
4,589
Operating Pre-Provision Net Revenue
$147,993
$122,014
PPNR Earnings per Diluted Share
$1.05
$0.96
September 30 Year-to-Date |