Attached files
| file | filename |
|---|---|
| 8-K - 8-K - AMICUS THERAPEUTICS, INC. | a12-26177_18k.htm |
| EX-99.1 - EX-99.1 - AMICUS THERAPEUTICS, INC. | a12-26177_1ex99d1.htm |
Exhibit 99.2
|
|
At the Forefront of Therapies for Rare and Orphan DiseasesTM November 5, 2012 |
|
|
Safe Harbor This conference call and presentation contain “forward-looking statements” within the meaning of the Private Securities Litigation Reform Act of 1995 relating to business, operations and financial conditions of Amicus including but not limited to preclinical and clinical development of Amicus’ candidate drug products, the timing and reporting of results from preclinical studies and clinical trials evaluating Amicus’ candidate drug products, the projected cash position for the Company, and business development and other transactional activities. Words such as, but not limited to, “look forward to,” “believe,” “expect,” “anticipate,” “estimate,” “intend,” “plan,” “would,” “should” and “could,” and similar expressions or words, identify forward-looking statements. Although Amicus believes the expectations reflected in such forward-looking statements are based upon reasonable assumptions, there can be no assurance that its expectations will be realized. Actual results could differ materially from those projected in Amicus’ forward-looking statements due to numerous known and unknown risks and uncertainties, including the “Risk Factors” described in our Annual Report on Form 10-Q for the quarter ended June 30, 2012. All forward-looking statements are qualified in their entirety by this cautionary statement, and Amicus undertakes no obligation to revise or update this news release to reflect events or circumstances after the date hereof. Slide 2 |
|
|
Slide 3 Agenda Corporate Highlights Fabry Monotherapy Program Updates 3Q12 Financial Results & FY12 Guidance Upcoming Milestones/Concluding Remarks Chaperone-ERT Program Highlights Updated Pompe Results Q&A John F. Crowley, Chairman & CEO Bradley L. Campbell, Chief Business Officer Chip Baird, Chief Financial Officer Pol F. Boudes, Chief Medical Officer David J. Lockhart, PhD, Chief Scientific Officer Chip Baird, Chief Financial Officer John F. Crowley, Chairman & CEO John F. Crowley, Chairman & CEO John F. Crowley, Chairman & CEO Bradley L. Campbell, Chief Business Officer David Lockhart, Chief Scientific Officer |
|
|
Superstorm Sandy Amicus NJ Facility and Operations Intact and Fully Functional Slide 4 |
|
|
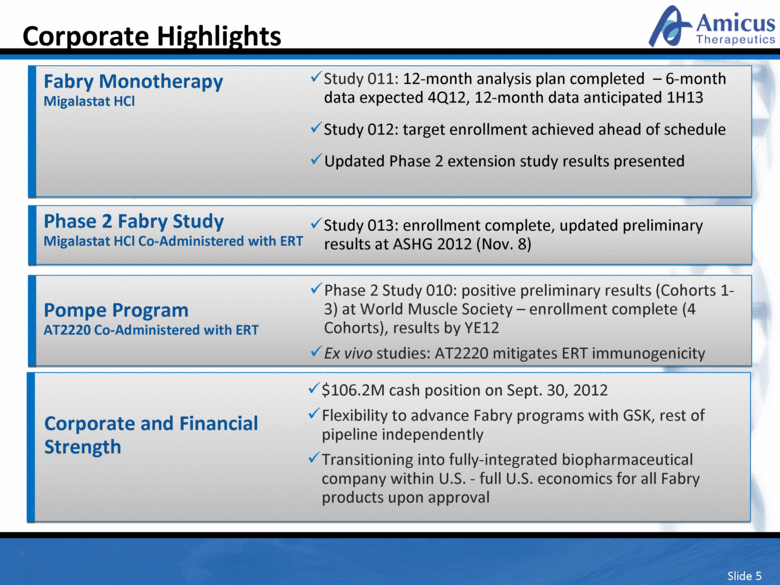
Slide 5 Corporate Highlights Fabry Monotherapy Migalastat HCl Study 011: 12-month analysis plan completed – 6-month data expected 4Q12, 12-month data anticipated 1H13 Study 012: target enrollment achieved ahead of schedule Updated Phase 2 extension study results presented Corporate and Financial Strength $106.2M cash position on Sept. 30, 2012 Flexibility to advance Fabry programs with GSK, rest of pipeline independently Transitioning into fully-integrated biopharmaceutical company within U.S. - full U.S. economics for all Fabry products upon approval Pompe Program AT2220 Co-Administered with ERT Phase 2 Study 010: positive preliminary results (Cohorts 1-3) at World Muscle Society – enrollment complete (4 Cohorts), results by YE12 Ex vivo studies: AT2220 mitigates ERT immunogenicity Phase 2 Fabry Study Migalastat HCl Co-Administered with ERT Study 013: enrollment complete, updated preliminary results at ASHG 2012 (Nov. 8) |
|
|
Slide 6 Miglastat HCl Monotherapy for Fabry Disease Global Phase 3 Registration Studies Both Studies Evaluating Migalastat HCl 150 mg, Every-Other-Day in Patients with Amenable Genetic Mutations U.S. Registration Study Placebo-controlled 67 patients 6-month surrogate endpoint: kidney GL-3 Potential for accelerated approval 6-month primary treatment period complete – data expected 4Q12 6-month open-label treatment extension data expected 1H13 Ongoing treatment provided in Phase 3 extension studies 12-month analysis plan completed Global Registration Study First clinical study to compare ERT to migalastat HCl 1.5: 1 randomization to migalastat HCl or ERT Target enrollment achieved ahead of schedule 57 patients now randomized (24 male / 33 female), final enrollment expected by YE12 18-month clinical endpoint: kidney function (GFR) – descriptive statistics |
|
|
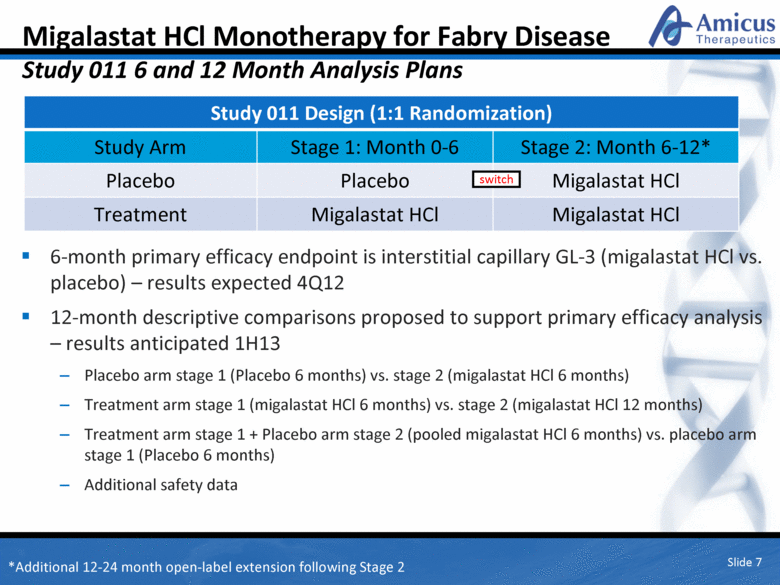
Migalastat HCl Monotherapy for Fabry Disease Study 011 6 and 12 Month Analysis Plans 6-month primary efficacy endpoint is interstitial capillary GL-3 (migalastat HCl vs. placebo) – results expected 4Q12 12-month descriptive comparisons proposed to support primary efficacy analysis – results anticipated 1H13 Placebo arm stage 1 (Placebo 6 months) vs. stage 2 (migalastat HCl 6 months) Treatment arm stage 1 (migalastat HCl 6 months) vs. stage 2 (migalastat HCl 12 months) Treatment arm stage 1 + Placebo arm stage 2 (pooled migalastat HCl 6 months) vs. placebo arm stage 1 (Placebo 6 months) Additional safety data Slide 7 Study 011 Design (1:1 Randomization) Study Arm Stage 1: Month 0-6 Stage 2: Month 6-12* Placebo Placebo Migalastat HCl Treatment Migalastat HCl Migalastat HCl switch *Additional 12-24 month open-label extension following Stage 2 |
|
|
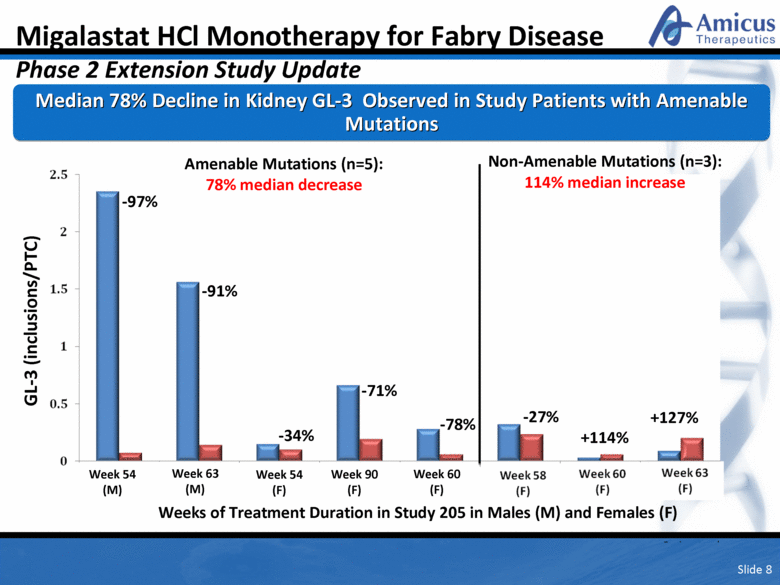
Amenable Mutations (n=5): 78% median decrease Non-Amenable Mutations (n=3): 114% median increase -71% -34% -91% -97% -78% +127% +114% -27% Week 54 (M) Weeks of Treatment Duration in Study 205 in Males (M) and Females (F) Week 54 (F) Week 63 (M) Week 60 (F) Week 90 (F) Median 78% Decline in Kidney GL-3 Observed in Study Patients with Amenable Mutations Migalastat HCl Monotherapy for Fabry Disease Phase 2 Extension Study Update GL-3 (inclusions/PTC) Slide 8 Week 60 (F) Week 58 (F) |
|
|
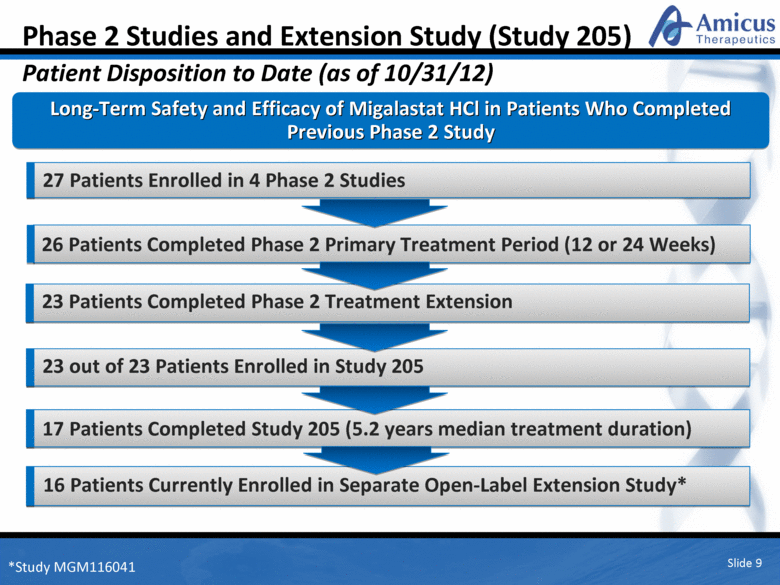
26 Patients Completed Phase 2 Primary Treatment Period (12 or 24 Weeks) Slide 9 Phase 2 Studies and Extension Study (Study 205) Patient Disposition to Date (as of 10/31/12) Long-Term Safety and Efficacy of Migalastat HCl in Patients Who Completed Previous Phase 2 Study 27 Patients Enrolled in 4 Phase 2 Studies 23 Patients Completed Phase 2 Treatment Extension 23 out of 23 Patients Enrolled in Study 205 17 Patients Completed Study 205 (5.2 years median treatment duration) 16 Patients Currently Enrolled in Separate Open-Label Extension Study* *Study MGM116041 |
|
|
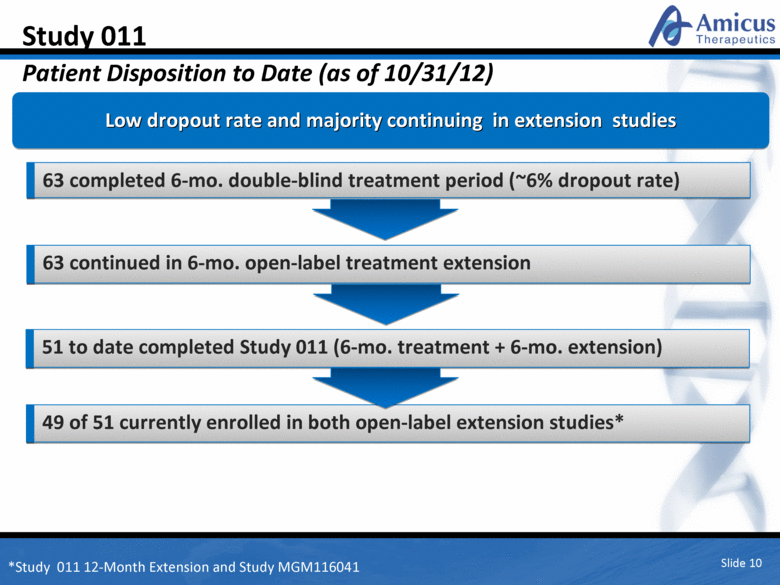
Slide 10 Study 011 Patient Disposition to Date (as of 10/31/12) Low dropout rate and majority continuing in extension studies 63 completed 6-mo. double-blind treatment period (~6% dropout rate) 63 continued in 6-mo. open-label treatment extension 51 to date completed Study 011 (6-mo. treatment + 6-mo. extension) 49 of 51 currently enrolled in both open-label extension studies* *Study 011 12-Month Extension and Study MGM116041 |
|
|
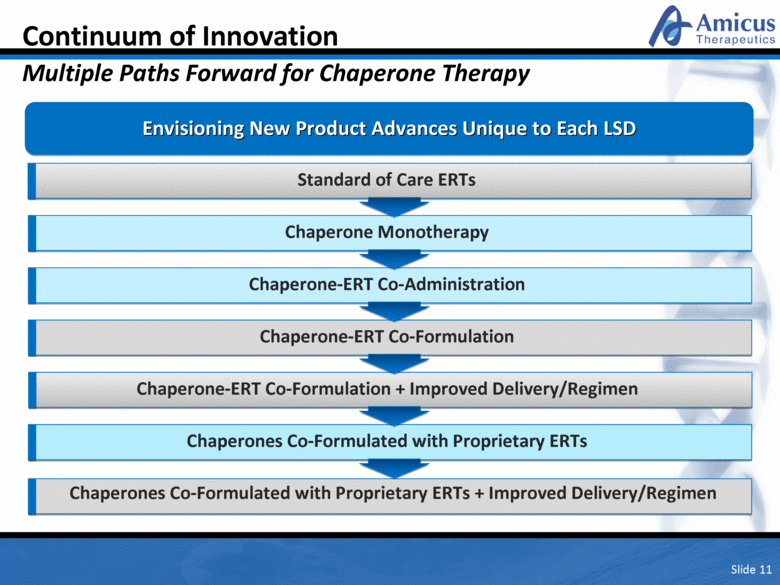
Continuum of Innovation Multiple Paths Forward for Chaperone Therapy Slide 11 Envisioning New Product Advances Unique to Each LSD Chaperone Monotherapy Chaperone-ERT Co-Administration Chaperone-ERT Co-Formulation Chaperones Co-Formulated with Proprietary ERTs Standard of Care ERTs Chaperone-ERT Co-Formulation + Improved Delivery/Regimen Chaperones Co-Formulated with Next Generation ERTs + Improved Delivery/Regimen Chaperones Co-Formulated with Proprietary ERTs |
|
|
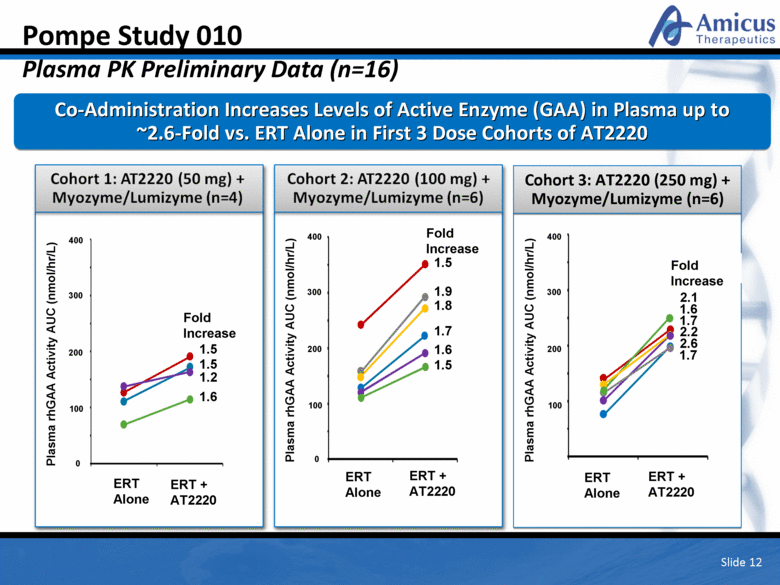
Cohort 3: AT2220 (250 mg) + Myozyme/Lumizyme (n=6) Pompe Study 010 Plasma PK Preliminary Data (n=16) Co-Administration Increases Levels of Active Enzyme (GAA) in Plasma up to ~2.6-Fold vs. ERT Alone in First 3 Dose Cohorts of AT2220 Slide 12 ERT Alone ERT Alone ERT + AT2220 ERT + AT2220 Plasma rhGAA Activity AUC (nmol/hr/L) 400 200 300 100 0 1.5 1.5 1.6 1.2 0 Fold Increase 1.9 1.5 1.7 1.8 1.6 Fold Increase ERT Alone ERT + AT2220 2.6 1.6 2.1 1.7 2.2 Plasma rhGAA Activity AUC (nmol/hr/L) 400 200 300 100 Plasma rhGAA Activity AUC (nmol/hr/L) 400 200 300 100 Fold Increase 1.7 1.5 |
|
|
Pompe Study 010 Needle Core Muscle Biopsies – Preliminary Data (n = 12) Slide 13 *Ratios Relative to ERT Alone **ERT Sample Insufficient for Determining Fold-Increase 2 1 3 5 GAA Activity in Muscle (pmol/mg/hr) ERT + AT2220 (100 mg) ERT Alone ERT + AT2220 (250 mg) 1.6 1.1 1.0 0.8 1.6 1.4 Cohort 2-3 Muscle Biopsies Suggest Co-Administration Increases Enzyme Uptake into Muscle vs. ERT Alone Muscle GAA Activity on Days 3 and 7* Day 7 (n=6) Day 3 (n=6) 5 4 6 8 7 9 11 10 12 ** 1.0 1.9 0.8 1.0 1.4 |
|
|
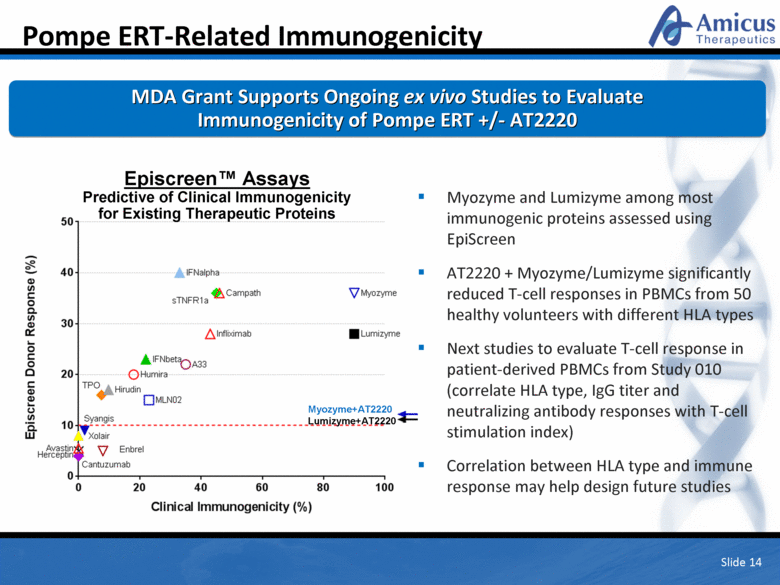
Pompe ERT-Related Immunogenicity Slide 14 MDA Grant Supports Ongoing ex vivo Studies to Evaluate Immunogenicity of Pompe ERT +/- AT2220 Episcreen™ Assays Predictive of Clinical Immunogenicity for Existing Therapeutic Proteins Myozyme and Lumizyme among most immunogenic proteins assessed using EpiScreen AT2220 + Myozyme/Lumizyme significantly reduced T-cell responses in PBMCs from 50 healthy volunteers with different HLA types Next studies to evaluate T-cell response in patient-derived PBMCs from Study 010 (correlate HLA type, IgG titer and neutralizing antibody responses with T-cell stimulation index) Correlation between HLA type and immune response may help design future studies Myozyme+AT2220 Lumizyme+AT2220 |
|
|
Slide 15 Pompe ERT-Related Immunogenicity Preliminary T-Cell Proliferation Results for Myozyme/Lumizyme +/- AT2220 AT2220 Mitigates Pompe ERT-Related Immunogenicity ex vivo PBMCs from 50 Healthy Volunteers PBMCs from 50 Healthy Volunteers 0 10 20 30 40 50 Myozyme lumizyme lumizyme +50 m M AT2220 lumizyme 27 ° C lumizyme 27 ° C +50 m M AT2220 lumizyme 37 ° C A33 A33 + 50 m AT2220 N=18 N=7 % # o f r e s p o n d e r s N=14 N=6 N=19 N=5 N=21 N=14 N=13 N=2 50 m AT2220 Myozyme + 50 m M AT2220 |
|
|
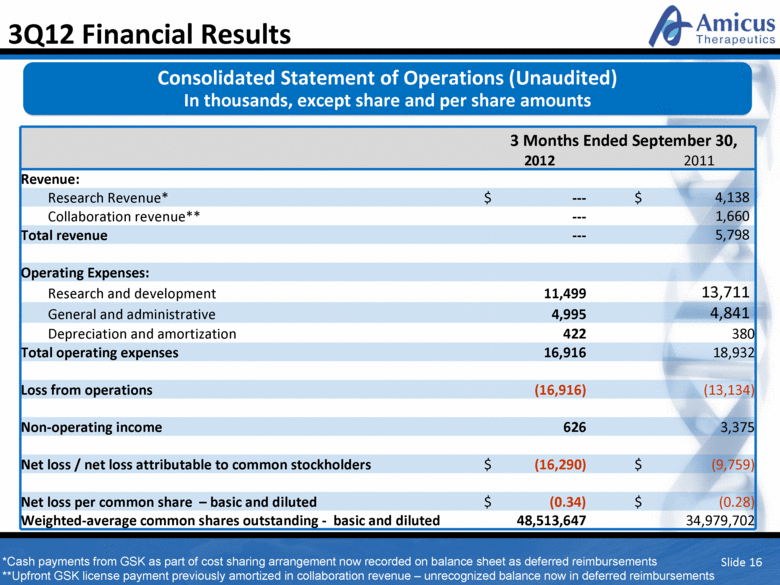
Slide 16 3Q12 Financial Results 3 Months Ended September 30, 2012 2011 Revenue: Research Revenue* $ --- $ 4,138 Collaboration revenue** --- 1,660 Total revenue --- 5,798 Operating Expenses: Research and development 11,499 13,711 General and administrative 4,995 4,841 Depreciation and amortization 422 380 Total operating expenses 16,916 18,932 Loss from operations (16,916) (13,134) Non-operating income 626 3,375 Net loss / net loss attributable to common stockholders $ (16,290) $ (9,759) Net loss per common share – basic and diluted $ (0.34) $ (0.28) Weighted-average common shares outstanding - basic and diluted 48,513,647 34,979,702 Consolidated Statement of Operations (Unaudited) In thousands, except share and per share amounts *Cash payments from GSK as part of cost sharing arrangement now recorded on balance sheet as deferred reimbursements **Upfront GSK license payment previously amortized in collaboration revenue – unrecognized balance now in deferred reimbursements |
|
|
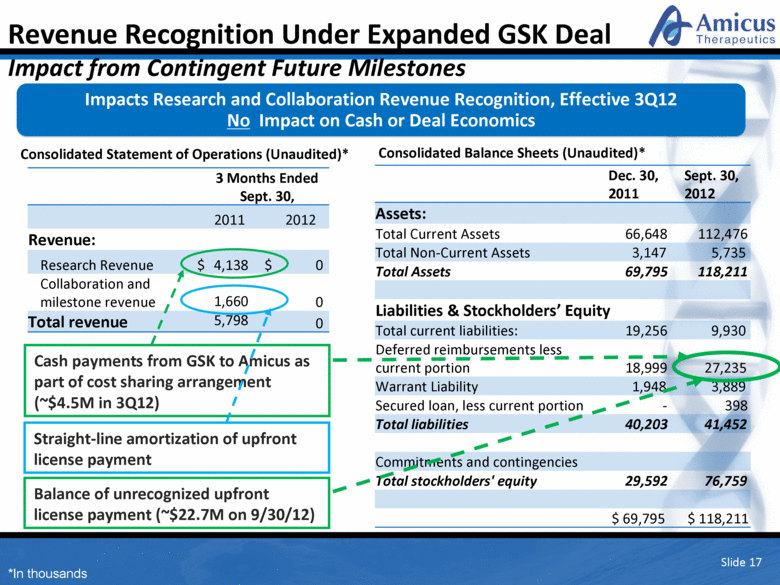
Slide 17 Dec. 30, 2011 Sept. 30, 2012 Assets: Total Current Assets 66,648 112,476 Total Non-Current Assets 3,147 5,735 Total Assets 69,795 118,211 Liabilities & Stockholders’ Equity Total current liabilities: 19,256 9,930 Deferred reimbursements less current portion 18,999 27,235 Warrant Liability 1,948 3,889 Secured loan, less current portion - 398 Total liabilities 40,203 41,452 Commitments and contingencies Total stockholders' equity 29,592 76,759 $ 69,795 $ 118,211 3 Months Ended Sept. 30, 2011 2012 Revenue: Research Revenue $ 4,138 $ 0 Collaboration and milestone revenue 1,660 0 Total revenue 5,798 0 Cash payments from GSK to Amicus as part of cost sharing arrangement (~$4.5M in 3Q12) Balance of unrecognized upfront license payment (~$22.7M on 9/30/12) Straight-line amortization of upfront license payment Impacts Research and Collaboration Revenue Recognition, Effective 3Q12 No Impact on Cash or Deal Economics Revenue Recognition Under Expanded GSK Deal Impact from Contingent Future Milestones Consolidated Statement of Operations (Unaudited)* Consolidated Balance Sheets (Unaudited)* *In thousands |
|
|
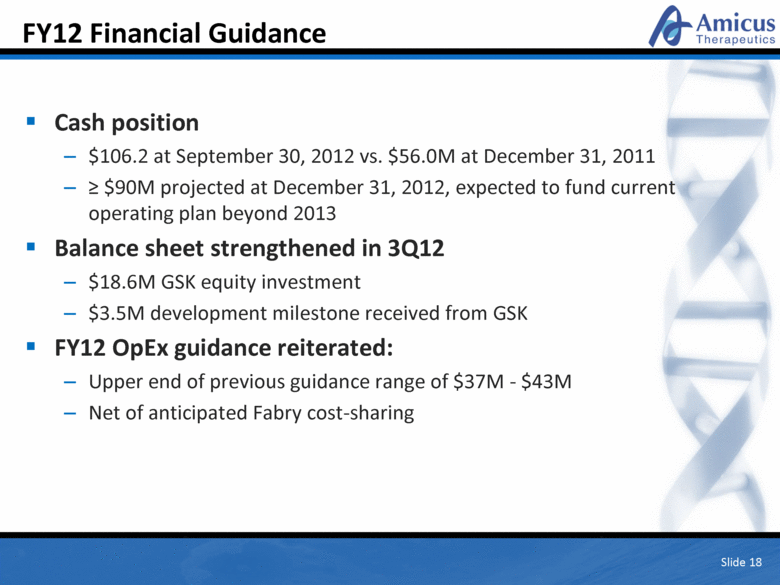
FY12 Financial Guidance Cash position $106.2 at September 30, 2012 vs. $56.0M at December 31, 2011 > $90M projected at December 31, 2012, expected to fund current operating plan beyond 2013 Balance sheet strengthened in 3Q12 $18.6M GSK equity investment $3.5M development milestone received from GSK FY12 OpEx guidance reiterated: Upper end of previous guidance range of $37M - $43M Net of anticipated Fabry cost-sharing Slide 18 |
|
|
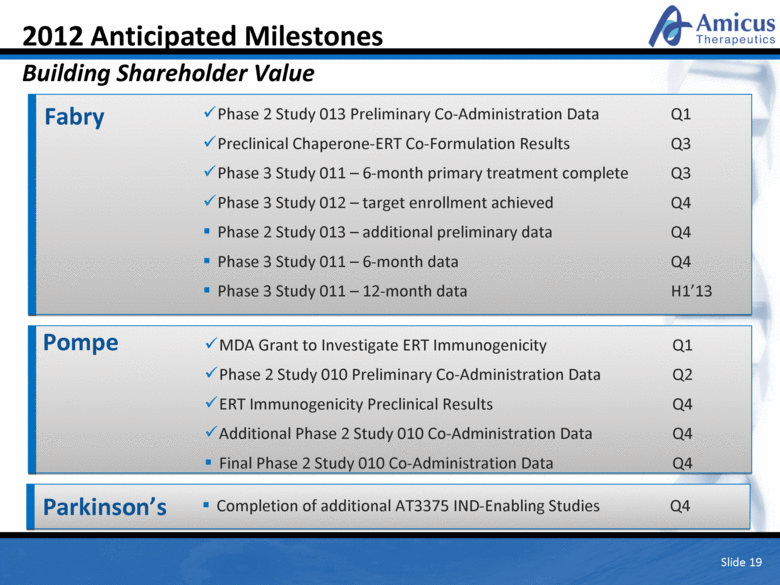
Slide 19 2012 Anticipated Milestones Building Shareholder Value Fabry Phase 2 Study 013 Preliminary Co-Administration Data Q1 Preclinical Chaperone-ERT Co-Formulation Results Q3 Phase 3 Study 011 – 6-month primary treatment complete Q3 Phase 3 Study 012 – target enrollment achieved Q4 Phase 2 Study 013 – additional preliminary data Q4 Phase 3 Study 011 – 6-month data Q4 Phase 3 Study 011 – 12-month data H1’13 Pompe MDA Grant to Investigate ERT Immunogenicity Q1 Phase 2 Study 010 Preliminary Co-Administration Data Q2 ERT Immunogenicity Preclinical Results Q4 Additional Phase 2 Study 010 Co-Administration Data Q4 Final Phase 2 Study 010 Co-Administration Data Q4 Parkinson’s Completion of additional AT3375 IND-Enabling Studies Q4 |
|
|
Q&A Slide 20 John F. Crowley, Chairman & CEO Bradley L. Campbell, Chief Business Officer Chip D. Baird, Chief Financial Officer Pol F. Boudes, MD, Chief Medical Officer David J. Lockhart, PhD, Chief Scientific Officer |

