Attached files
| file | filename |
|---|---|
| 8-K - 8-K - Polypore International, Inc. | a12-25181_58k.htm |
Exhibit 99.1
|
|
1 (NYSE Listed: PPO) Robert W. Baird Industrial Conference November 2012 |
|
|
2 These materials include "forward-looking statements". In these materials, the words “Polypore,” “Polypore International,” “Company,” “we,” “us” and “our” refer to Polypore International, Inc. together with its subsidiaries, unless the context indicates otherwise. All statements other than statements of historical facts included in these materials that address activities, events or developments that we expect, believe or anticipate will or may occur in the future are forward-looking statements, including, in particular, the statements about Polypore International's plans, objectives, strategies and prospects regarding, among other things, the financial condition, results of operations and business of Polypore International and its subsidiaries. We have identified some of these forward-looking statements with words like "believe," "may," "will," "should," "expect," "intend," "plan," "predict," "anticipate," "estimate" or "continue" and other words and terms of similar meaning. These forward-looking statements are based on current expectations about future events affecting us and are subject to uncertainties and factors relating to our operations and business environment, all of which are difficult to predict and many of which are beyond our control. Many factors mentioned in our discussion in these materials will be important in determining future results. Although we believe that the expectations reflected in our forward-looking statements are reasonable, we do not know whether our expectations will prove correct. They can be affected by inaccurate assumptions we might make or by known or unknown risks and uncertainties, including with respect to Polypore International, the following, among other things: the highly competitive nature of the markets in which we sell our products; the failure to continue to develop innovative products; the loss of our customers; the vertical integration by our customers of the production of our products into their own manufacturing process; increases in prices for raw materials or the loss of key supplier contracts; our substantial indebtedness; interest rate risk related to our variable rate indebtedness; our inability to generate cash; restrictions related to the senior secured credit agreement; employee slowdowns, strikes or similar actions; product liability claims exposure; risks in connection with our operations outside the United States, including compliance with applicable anti-corruption laws; the incurrence of substantial costs to comply with, or as a result of violations of, or liabilities under environmental laws; the failure to protect our intellectual property; the loss of senior management; the incurrence of additional debt, contingent liabilities and expenses in connection with future acquisitions; the failure to effectively integrate newly acquired operations; absence of expected returns from intangible assets we have recorded; the adverse impact from legal proceedings on our financial condition; and natural disasters, epidemics, terrorist acts and other events beyond our control. Because our actual results, performance or achievements could differ materially from those expressed in, or implied by, the forward looking statements, we cannot give any assurance that any of the events anticipated by the forward looking statements will occur or, if any of them do, what impact they will have on Polypore International's results of operations and financial condition. You are cautioned not to place undue reliance on these forward looking statements, which speak only as of the date of these materials. We do not undertake any obligation to update these forward looking statements in these materials or the risk factors set forth above to reflect new information, future events or otherwise, except as may be required under federal securities laws. This presentation contains certain non-GAAP financial measures, including Adjusted EBITDA. For more information regarding the computation of Adjusted EBITDA and reconciliation to the most directly comparable GAAP measure, see the information and table at the end of the presentation. Safe Harbor Statement |
|
|
Polypore Overview LYNN AMOS Chief Financial Officer 3 |
|
|
4 Polypore is a leading global high technology filtration company specializing in microporous membranes |
|
|
Investment Highlights World Leader in microporous membrane technology Strong foundation of four core growing businesses High recurring revenue Positive long-term trends and leading market positions Businesses have high operating leverage, and substantial capacity investments will drive earnings growth Broad global footprint with large presence in rapid growth Asia region Significant growth opportunity in electric drive vehicles (EDVs), where Polypore has preferred technology and early leadership position 5 Growth driven by positive, long-term demand trends in mobile and portable energy as well as high-performance filtration © 2012 Polypore International, Inc. |
|
|
6 Leading Positions in Our Business Segments Lead acid battery separators for Auto/truck/bus Forklifts Backup power Lithium battery separators for Portable hand-held devices Power tools Electric drive vehicles (EDVs) Membranes used in blood filtration applications Hemodialysis Blood oxygenation Plasmapheresis Membranes and devices used for Liquid filtration Degasification/ gasification Water treatment, microelectronics, pharmaceutical, food & beverage, etc. Energy Storage LTM Q3-2012 Sales $547mm TRANSPORTATION & INDUSTRIAL LTM Sales $362mm ELECTRONICS & EDVs LTM Sales $185mm Separations Media LTM Q3-2012 Sales $181mm HEALTHCARE LTM Sales $114mm INDUSTRIAL & SPECIALTY LTM Sales $67mm LTM Q3-2012 Sales $728mm LTM Q3-2012 Adjusted EBITDA* $223mm * As defined in Polypore’s senior secured credit agreement © 2012 Polypore International, Inc........ |
|
|
7 Differentiation in High Performance Filtration Increasingly Depends on Membrane Technology Water & beverage filtration Semiconductor and flat panel display manufacturing Lithium batteries Open heart surgery kidney dialysis Pharmaceutical manufacturing Applications Polypore has a breadth of proprietary process and product technologies Polypore products Flat sheet Hollow fiber Tubular Modules Polypore processes Phase separation Dry stretch Multi-layer Multiple polymers |
|
|
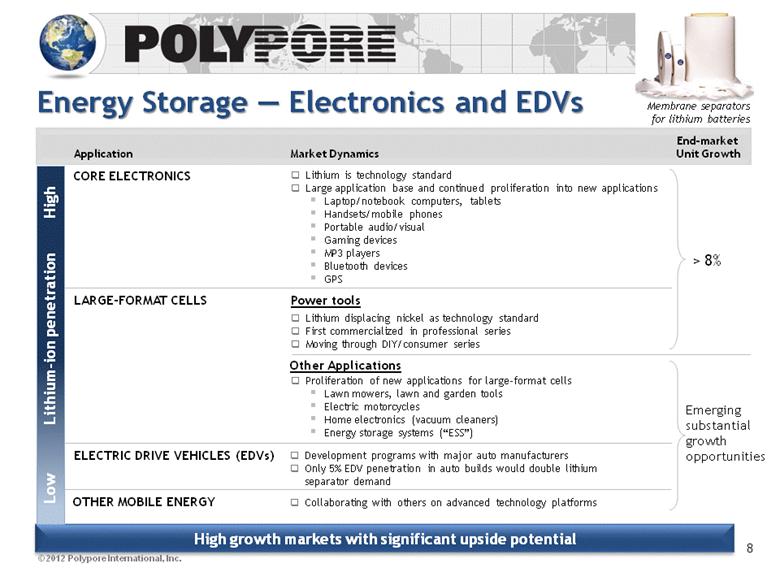
8 Energy Storage — Electronics and EDVs Membrane separators for lithium batteries High growth markets with significant upside potential Emerging substantial growth opportunities > 8% Application Market Dynamics Other Applications CORE ELECTRONICS Lithium is technology standard Large application base and continued proliferation into new applications Laptop/notebook computers, tablets Handsets/mobile phones Portable audio/visual Gaming devices MP3 players Bluetooth devices GPS LARGE-FORMAT CELLS Lithium displacing nickel as technology standard First commercialized in professional series Moving through DIY/consumer series Proliferation of new applications for large-format cells Lawn mowers, lawn and garden tools Electric motorcycles Home electronics (vacuum cleaners) Energy storage systems (“ESS”) ELECTRIC DRIVE VEHICLES (EDVs) Development programs with major auto manufacturers Only 5% EDV penetration in auto builds would double lithium separator demand OTHER MOBILE ENERGY Collaborating with others on advanced technology platforms End-market Unit Growth Low Lithium-ion penetration High Power tools © 2012 Polypore International, Inc. |
|
|
9 Capacity Investments Made Provide Substantial Earnings Growth Potential in Lithium Battery Separators Charlotte, NC Capacity expansions complete Concord, NC (new facility) First phase complete Second and third phase equipment installed and capacity will be ramped up consistent with demand growth Capacity investments will drive substantial long-term growth |
|
|
10 Replacement batteries are 80% of global vehicle battery sales Number of vehicles in operation worldwide* * Source: WardsAuto.com and Wards Motor Vehicle Facts & Figures (2007-2012 data) 1982-2010 CAGR = 3% Energy Storage — Transportation & Industrial Well positioned in high-growth Asian region. High recurring revenue business due to large replacement market. millions Membrane separators for lead-acid batteries Global leader in lead-acid battery separators Product breadth, scale and global supply capability lead the industry Well-positioned to take advantage of high-growth Asian market Production in Thailand, China, and India Majority-owned JV with leading Chinese lead-acid battery producer (Camel) Thailand facility is the largest lead-acid battery separator producer in the region Multi-year sales growth has exceeded 20% per annum Asia is largest separator consuming region in the world Flexible capacity in US and Europe to supply growth in Asia High replacement rate Transportation - Approximately 80% of total market Estimated 80% replacement and 20% OEM Industrial - Approximately 20% of total market Estimated 50%/50% replacement and OEM © 2012 Polypore International, Inc. 0 100 200 300 400 500 600 700 800 900 1,000 1982 1987 1992 1997 2002 2007 2010 |
|
|
11 Separations Media — Healthcare Membranes for medical applications Clinically demonstrated best-in-class PUREMA® membrane. Unique position as leading independent producer with broad product line World’s leading supplier High switching costs Plasmapheresis New treatment methodologies Technology driven growth opportunities 6% growth Modest growth 8% growth Blood Oxygenation Hemodialysis Other Medical Applications © 2012 Polypore International, Inc. Polypore has leading expertise in blood/membrane interaction — Polypore leverages its healthcare membrane technologies to serve broader filtration applications |
|
|
12 Separations Media — Industrial & Specialty Filtration Membranes & modules for industrial & specialty applications Technology driven growth opportunities New applications for gas transfer technologies Forward integrating into hollow fiber-based modules for MF and UF markets Extending membrane technology to new polymers and configurations End markets Semiconductor and flat panel display manufacturing Ink deaeration Municipal water treatment Desalination prefiltration Wine clarification Ultrapure water for microelectronics and pharmaceutical manufacturing Serum and blood purification Venting applications in pharmaceutical manufacturing Growing End Markets Pharmaceutical/ biotechnology 7–10% growth* Potable water 5–8% growth* Desalination prefiltration 20–25% growth* Source: Frost & Sullivan; Company management. * Based on U.S. markets. OEM Membranes Liqui-Flux® Modules Liqui-Cel® Contactors Polypore is well positioned to serve high-growth and high growth and high-value value membrane filtration opportunities |
|
|
13 Polypore Serves Attractive End Markets ELECTRONICS & EDVs Laptops, tablets, mobile phones and other handheld devices, portable audio/visual devices, power tools, EDVs High growth, short customer product life cycles >8% + EDV growth TRANSPORTATION & INDUSTRIAL Worldwide fleet of motor vehicles Conversion to high-performance polyethylene separators Major growth region is Asia High replacement market >GDP HEALTHCARE Hemodialysis Blood Oxygenation Plasmapheresis >6% Modest 8% End-stage renal disease patient population Conversion to single-use dialyzers Aging population Incidence of heart disease New treatment technologies 100% recurring revenue High switching costs Small base, growth through new adoption INDUSTRIAL & SPECIALTY FILTRATION >8% Global demand for clean water Increasing need for purity in industrial and pharmaceutical processes Multiple fast growing, high-value applications © 2012 Polypore International, Inc. ENERGY STORAGE Primary Revenue Drivers Market Dynamics Long-Term End-market Unit growth SEPARATIONS MEDIA |
|
|
14 Global Infrastructure and Customer Base * Indicates technical center in addition to manufacturing facility Piney Flats, TN Corydon, IN Charlotte, NC* Owensboro, KY* Sélestat, France* Wuppertal, Germany* Tokyo, Japan Shanghai, China Prachinburi, Thailand* Sao Paulo, Brazil Obernburg, Germany Tianjin, China Norderstedt, Germany Ochang, Korea Feistritz, Austria Shenzhen, China Bangalore, India Xiangyang, China 2011 Net Sales by Geography** ** Net sales by customer location Manufacturing facility Sales office Operating headquarters Operations |
|
|
Where Are We Today? Overall performance in 4Q’12 expected to improve over 3Q’12 Lithium business remains challenging in the short-term Macroeconomic factors (e.g., cyclical consumer electronics demand) Sales rates of a few high-content EDVs Long-term drivers in Lithium business remain positive Growing number of vehicle programs using some level of electrification (hybrid, plug-in, pure battery-driven) Key macro drivers of vehicle electrification trends remain intact (CO2 rules, growing Asian middle class, etc.) Committed to managing cost structure of the Lithium business and scaling capacity with demand growth Transitioning to strong cash generation mode in 2013 as major capital investment programs are completed 15 |
|
|
Financials 16 |
|
|
17 Revenue and Adjusted EBITDA Net sales ($ millions) Adjusted EBITDA ($ millions) |
|
|
18 Capital Structure in Place to Support Growth ($ in Millions) Maturity Debt Balance As of 9/29/12 2012 2013 2014 2015 2016 2017 Term Loan $296.3 $3.8 $15.0 $18.8 $26.2 $37.5 $195.0 7.5% Senior Notes 365.0 -- -- -- -- -- 365.0 $150 Million Revolver 50.0 -- -- -- -- -- 50.0 Total Debt $711.3 $3.8 $15.0 $18.8 $26.2 $37.5 $610.0 Cash on Hand $52.6 Net Debt $658.7 Net Leverage Ratio 2.96x |
|
|
19 Cash & Liquidity Summary Strengthened capital structure and increased liquidity over the last 5 years Total net leverage improved from 5X in 2007 to below 3X in Q3-2012 Cash generating businesses Generated cash from operations of $87 million through Q3-2012 Funded all announced growth projects with cash from operations Transitioning to substantial cash generating mode in 2013 Majority of $375 million in growth projects initiated since August 2009 are complete: Lithium separator expansions in U.S. Capacity may be used for consumer electronics (CE), electric drive vehicles (EDV), or energy storage systems (ESS) Lithium separator expansion in Korea for CE applications Hemodialysis membrane (PUREMA®) expansion in Germany Lead-acid separator expansions in China and Thailand |
|
|
Takeaways World Leader in microporous membrane technology Strong foundation of four core growing businesses High recurring revenue Positive long-term trends and leading market positions Businesses have high operating leverage, and substantial capacity investments will drive long-term earnings growth Broad global footprint with large presence in rapid growth Asia region Significant growth opportunity in electric drive vehicles (EDVs), where Polypore has preferred technology and early leadership position 20 Growth driven by positive, long-term demand trends in mobile and portable energy as well as high-performance filtration © 2012 Polypore International, Inc. |
|
|
APPENDIX 21 |
|
|
22 Non-GAAP Supplemental Information Adjusted EBITDA is a non-GAAP financial measure presented herein as a supplemental disclosure to net income and reported results. Adjusted EBITDA is defined in our credit agreement and represents earnings before interest, taxes, depreciation and amortization and certain non-operating items, business restructuring costs and other non-cash or non-recurring charges. For more information regarding the computation of Adjusted EBITDA and the reconciliation of Adjusted EBITDA to net income, please see the attached financial table. We present Adjusted EBITDA because we believe that it is a useful indicator of our operating performance. Adjusted EBITDA is a measure used in our credit agreement to determine the availability of borrowings under our revolving credit facility. We also use Adjusted EBITDA to review and assess operating performance in connection with employee incentive programs and the preparation of our annual budget and financial projections. We believe that the use of Adjusted EBITDA also facilitates the comparison of results between periods. |
|
|
23 Appendix A Adjusted EBITDA Twelve Months Ended September 29, 2012 Net income $ 79.9 Add/Subtract: Depreciation and amortization expense 55.0 Interest expense, net 35.0 Income taxes 34.5 EBITDA 204.4 Stock-based compensation 17.1 Foreign currency gain (2.5) Loss on disposal of property, plant and equipment 1.1 Costs related to the FTC litigation 0.2 Write-off of loan acquisition cost associated with refinancing of senior credit agreement 2.5 Adjusted EBITDA $ 222.8 |