Attached files
| file | filename |
|---|---|
| 8-K - FORM 8-K - REDWOOD TRUST INC | d429272d8k.htm |
| EX-99.1 - PRESS RELEASE - REDWOOD TRUST INC | d429272dex991.htm |
Exhibit 99.2

|
|

| |
|
TABLE OF CONTENTS
|

| Introduction |
4 | |||
| Shareholder Letter |
5 | |||
| Quarterly Overview |
9 | |||
| Financial Insights |
14 | |||
| u Balance Sheet |
14 | |||
| u GAAP Income |
18 | |||
| u REIT Taxable Income and Dividends |
22 | |||
| u Cash Flow |
23 | |||
| Sequoia Residential Mortgage Loan Business |
25 | |||
| Residential Real Estate Securities |
26 | |||
| Commercial Real Estate Business |
29 | |||
| Investments in Consolidated Entities |
31 | |||
| Appendix |
33 | |||
| Accounting Discussion |
34 | |||
| Glossary |
35 | |||
| Financial Tables |
42 | |||
| THE REDWOOD REVIEW | 3RD QUARTER 2012 | 1 |
|
|
| |
|
CAUTIONARY STATEMENT
|
This Redwood Review contains forward-looking statements within the meaning of the safe harbor provisions of the Private Securities Litigation Reform Act of 1995. Forward-looking statements involve numerous risks and uncertainties. Our actual results may differ from our expectations, estimates, and projections and, consequently, you should not rely on these forward-looking statements as predictions of future events. Forward-looking statements are not historical in nature and can be identified by words such as “anticipate,” “estimate,” “will,” “should,” “expect,” “believe,” “intend,” “seek,” “plan,” and similar expressions or their negative forms, or by references to strategy, plans, or intentions. These forward-looking statements are subject to risks and uncertainties, including, among other things, those described in our Annual Report on Form 10-K for the year ended December 31, 2011 under the caption “Risk Factors.” Other risks, uncertainties, and factors that could cause actual results to differ materially from those projected are described below and may be described from time to time in reports we file with the Securities and Exchange Commission, including reports on Forms 10-K, 10-Q, and 8-K. We undertake no obligation to update or revise forward-looking statements, whether as a result of new information, future events, or otherwise.
Statements regarding the following subjects, among others, are forward-looking by their nature: (i) our statements relating to our overall outlook for Redwood and its businesses in the future (including our statement that the flexibility we have built into our operating platforms should enable us to react quickly as lenders, borrowers, and regulators converge toward an accepted mortgage financing framework) and our statements regarding the impact of Federal Reserve policies and plans on the value of our portfolio and volume of future business; (ii) any statements relating to future activities we may engage in, including sales of residential loans to the Agencies and any statements relating to our future level of investment in mortgage servicing rights and the profitability of such investments, future sales of whole loans (other than through securitization transactions) and the profitability of such sales; (iii) any statements relating to our competitive position and our ability to compete in the future; (iv) any statements relating to our future investment strategy and future investment activity, including, without limitation, that over time we expect the senior securities in our investment portfolio to pay down or be sold and replaced with investments created through our mortgage banking activities and from the purchase of subordinate securities from other securitization sponsors; (v) our statement that we are on track to reach our goal of investing $400 million or more of equity capital during 2012; (vi) our statement that we expect to have 55 active loan sellers in our residential loan conduit by the end of 2012 and that we expect most of the 46 potential sellers who are in various stages of review and implementation to become active sellers to our residential conduit in the near-term; (vii) our statement that our goal over the next 12-to-18 months is to ramp up our non-Agency loan production so we are able to securitize $300 million or more of residential loans each month in the future and our statements relating to acquiring residential mortgage loans included in our pipeline of residential mortgage loans that we have identified for purchase or plan to purchase, including the amount of such loans that we planned to purchase or have identified for purchase during the third quarter of 2012, at September 30, 2012, in October 2012, and at the end of October 2012; (viii) statements relating to future residential loan securitization and sale transactions, the timing of the completion of those future transactions, and the number and size of those transactions we expect to complete in 2012 and future periods, which future transactions may not be completed when planned or at all, and, more generally, statements regarding the likelihood and timing of, and our participation in, future transactions of these types and our ability to finance residential loan acquisitions through the execution of these types of transactions, and the profitability of these transactions; (ix) our statement that we expect to recover an aggregate of $5 million of loan loss reserves that relate to nine Sequoia securitization entities in future periods; (x) any statements relating to the cash flows we expect to receive from our investments; (xi) our statements relating to our estimate of our investment capacity
| 2 | THE REDWOOD REVIEW | 3RD QUARTER 2012 |
|
|
| |
|
CAUTIONARY STATEMENT
|
(including that we estimate our investment capacity was $141 million at September 30, 2012) and our statement that we believe this level of investment capacity should sustain our capital needs well into the first quarter of 2013; (xii) any statements relating to future market and economic conditions and the future volume of transactions in those markets, including, without limitation, future conditions in the residential and commercial real estate markets and related financing markets, and the related potential opportunities for our residential and commercial businesses; (xiii) our beliefs about, and our outlook for, the future direction of housing market fundamentals, including, without limitation, home prices, household formation and demand for housing, delinquency rates, foreclosure rates, prepayment rates, inventory of homes for sale, and mortgage interest rates and their potential impact on our business and results of operations and our beliefs that certain delinquency trends should eventually cause total mortgage delinquencies to fall, that, absent a second recession, low interest rates should protect from additional downside movement in home prices, that we believe housing prices are in the process of stabilizing, and that we do not expect housing, in general, to be a significantly appreciating asset class for several years; (xiv) our statements that we currently anticipate investing $40 to $60 million in commercial mezzanine debt in the fourth quarter, that we plan to continue to generate fees by originating senior commercial loans and selling them to third parties that intend to securitize them, that the use of a warehouse facility to finance out mezzanine investments will potentially enhance the yield on these investments and free up equity capital for reinvestment, and that we continue to focus on establishing a more permanent financing source for our existing portfolio of mezzanine investments; (xv) our expectations regarding credit reserves, credit losses, the adequacy of credit support, and impairments and their impact on our investments (including as compared to our original expectations and credit reserve levels) and the timing of losses and impairments, and statements that the amount of credit reserves we designate are adequate or may require changes in the future; (xvi) any statements relating to our expectations regarding future interest income and net interest income, future earnings, future gains, future earnings volatility, and future trends in operating expenses and the factors that may affect those trends; and (xvii) our expectations and estimates relating to the characterization for income tax purposes of our dividend distributions (including, without limitation, that we expect a significant portion of the dividends we distribute in 2012 to be taxable to shareholders) and our expectations and estimates relating to tax accounting and our anticipation of additional credit losses for tax purposes in future periods (and, in particular, our statement that, for tax purposes, we expect an additional $123 million of credit losses on residential securities to be realized over an estimated three-to-five year period).
| THE REDWOOD REVIEW | 3RD QUARTER 2012 | 3 |
|
|
| |
|
INTRODUCTION
|
Note to Readers:
We file annual reports (on Form 10-K) and quarterly reports (on Form 10-Q) with the Securities and Exchange Commission. These filings and our earnings press releases provide information about Redwood and our financial results in accordance with generally accepted accounting principles (GAAP). We urge you to review these documents, which are available through our web site, www.redwoodtrust.com.
This document, called The Redwood Review, is an additional format for providing information about Redwood through a discussion of many GAAP as well as non-GAAP metrics, such as taxable income and economic book value. Supplemental information is also provided in the Financial Tables in this Review to facilitate more detailed understanding and analysis of Redwood. When we use non-GAAP metrics it is because we believe that these figures provide additional insight into Redwood’s business. In each case in which we discuss a non-GAAP metric you will find an explanation of how it has been calculated, why we think the figure is important, and a reconciliation between the GAAP and non-GAAP figures.
References herein to “Redwood,” the “company,” “we,” “us,” and “our” include Redwood Trust, Inc. and its consolidated subsidiaries. References to “at Redwood” exclude all consolidated securitization entities (with the exception of the resecuritization we completed in the third quarter of 2011) in order to present our operations in the way management analyzes them. Note that because we round numbers in the tables to millions, except per share amounts, some numbers may not foot due to rounding.
We hope you find this Review helpful to your understanding of our business. We thank you for your input and suggestions, which have resulted in our changing the form and content of The Redwood Review over time.
We welcome your continued interest and comments.
|
Selected Financial Highlights
| ||||||||||||
| Quarter: Year | GAAP Income (Loss) per Share |
REIT Taxable per Share(1) |
Annualized GAAP Return on Equity |
GAAP
Book Value per Share |
Non-GAAP Economic Value per Share (2) |
Dividends per Share | ||||||
| Q310 | $0.25 | ($0.11) | 8% | $13.02 | $13.73 | $0.25 | ||||||
| Q410 | $0.18 | ($0.01) | 6% | $13.63 | $14.31 | $0.25 | ||||||
| Q111 | $0.22 | $0.09 | 8% | $13.76 | $14.45 | $0.25 | ||||||
| Q211 | $0.11 | $0.02 | 4% | $13.04 | $13.81 | $0.25 | ||||||
| Q311 | $0.01 | $0.09 | 1% | $12.22 | $13.33 | $0.25 | ||||||
| Q411 | ($0.03) | $0.04 | (1%) | $11.36 | $12.45 | $0.25 | ||||||
| Q112 | $0.37 | $0.13 | 13% | $12.22 | $13.18 | $0.25 | ||||||
| Q212 | $0.24 | $0.22 | 8% | $12.00 | $12.87 | $0.25 | ||||||
| Q312 | $0.48 | $0.19 | 17% | $12.88 | $13.62 | $0.25 | ||||||
| (1) REIT taxable income per share for 2012 is an estimate until we file tax returns for that year. |
| (2) Non-GAAP economic value per share is calculated using estimated bid-side values (which take into account available bid-side marks) for our financial assets and estimated offer-side values (which take into account available offer-side marks) for our financial liabilities and we believe it more accurately reflects liquidation value than does GAAP book value per share. Non-GAAP economic value per share is reconciled to GAAP book value per share in the Financial Insights section and in Table 3 in the Financial Tables in this Review. |
| 4 | THE REDWOOD REVIEW | 3RD QUARTER 2012 |
|
|

| |
|
SHAREHOLDER LETTER
|
Dear Fellow Shareholders:
We are now well along with the execution of the business strategy we developed a couple of years ago. We will spare you a philosophical discussion over whether the execution phase or strategy phase is more important to our success. To us, the two are wholly interdependent and dynamic. However, we would readily confess that executing and seeing results… is a heck of a lot more fun.
As our businesses have gained momentum, we have received numerous investor inquiries asking for more color and details on the Redwood story. Accordingly, it’s a good time to take a quick look back, assess where we are, and talk a bit about what we see ahead. This quarterly letter will address all three points, but look for more “meat on the bone” regarding our plans and outlook for 2013 in our fourth quarter shareholder letter.
This letter hits on a few familiar themes in our ongoing effort to clearly define and differentiate our business model and our goals. In the simplest terms, we are an operating business that utilizes the tax advantages of a REIT structure to efficiently hold mortgage-related investments. Our loan platforms create home-grown residential and commercial mortgage investments and generate fees. Our overarching goal is to deliver a growing stream of attractive, sustainable earnings and dividends. We strive to help our shareholders recognize the broader franchise value of our businesses so they won’t categorize us with passive investment companies whose shares generally trade near book value.
A Quick Look Back
As the financial world engaged in massive deleveraging at the onset of the financial crisis, Redwood made a strategic decision to invest in and build out our residential and commercial loan platforms in order to have proprietary, steady sources of attractive investments and fee-generating opportunities. There is a commonality of themes between our residential and commercial lines of business. In both businesses, we initially established ourselves as an intermediary between lenders (who face borrowers) and senior investors in the capital markets. In addition, we believe that our biggest competitive advantage in both lines of business is our willingness to get dirty, do the hard stuff, and make life easier for the lenders and investors we work with. Our strategy syncs up well with the structure of our balance sheet and the talents and extensive relationships of the professionals who make up both our residential and commercial teams.
On the residential side, our focus over the last few years was to source prime, jumbo mortgages primarily for sale through private securitization, but also at times through bulk sales. While our initial market opportunity was very small, our confidence in the long-term was driven by three big business assumptions: the government would eventually reduce its outsized role in the mortgage market; new bank regulation, Basel III, and legacy portfolio issues would open up an opportunity for independent mortgage companies; and traditional private AAA institutional investors would return to providing attractive financing for prime residential loans through private-label mortgage-backed securitization (“PLMBS”). At times, many pundits argued that this last assumption was, well … crazy. Some even exclaimed that privately-financed mortgage rates would stay at least 2 to 3 points higher than comparable government Agency rates in this next era of private mortgage lending.
On the commercial side, we set our sights on an inevitable wave of commercial loan refinancing demand brought about by a pre-crisis era of high-leverage lending. An immediate need was identified for mezzanine capital that could bridge the gap between commercial borrowers’ funding needs and what traditional senior lenders would provide in a deleveraged world. We also began to position our platform to one day become a direct provider of senior commercial loans, offering value through greater flexibility and certainty of execution for borrowers.
| THE REDWOOD REVIEW | 3RD QUARTER 2012 | 5 |
|
|
| |
|
SHAREHOLDER LETTER
|
Where We Are
In general, we would say that our plans for both our residential and commercial businesses are coming together.
On the residential side, the build-out of our loan platform took a bit longer than anticipated and was a drag on earnings in 2011 and into 2012. We endured a few bumps along the road, but the good news is that our Sequoia loan platform is up, running, and scalable. One of the many highlights you will read about in this Redwood Review is that from a credit standpoint, we have yet to see a 60-day delinquent borrower in any of our seven Sequoia securitizations completed since April 2010. And from a liquidity standpoint, we provided credit-enhancement for 68 different AAA investors including banks, insurance companies and money managers in these transactions.
Our big business assumptions are also playing out nicely. (Maybe we weren’t crazy!) Over the past two years, the Agency loan limit for high cost areas has come down from $729,750 to $625,500, and guarantee fees charged by the Agencies have almost doubled. All four of the biggest U.S. banks have announced a significant reduction or complete elimination of their wholesale lending channels, which has opened up an opportunity for independent mortgage companies, like Redwood. And, most importantly, private AAA credit spreads continue to tighten, which improves our loan pricing and enables our sellers to offer lower mortgage rates to mortgage borrowers. How much lower? Based on the execution of our recent PLMBS transactions, we are now pricing 30-year fixed-rate jumbo loans very competitively against major portfolio lenders. And in some (albeit limited) cases, we can even price loans that conform to the government’s “Agency jumbo” criteria (e.g., loans ranging from $417,000 to $625,499) competitively against the government-backed Agencies themselves. The point is, the gap is narrowing.
As a general matter, we would also observe that the return of PLMBS for prime loans is a lot further along than market observers might think. The formula to regain the confidence of AAA investors is not that complicated. Start with well-underwritten prime loan collateral; align interests throughout the mortgage chain; and follow best practices for completing securitizations — especially for representations and warranties, for which Redwood has taken the lead. We would even add that the ratings process is now working much more smoothly than it was even a year ago.
But what is really encouraging to us are the catalysts we see coming together that we think will provide a big boost to restoring a fully functioning private market that works for home buyers and lenders alike.
| u | We believe the Federal Reserve’s plan to reduce mortgage rates and stimulate the economy known as QE3 is effectively accelerating the return of private sector mortgage financing. By our count, the Federal Reserve’s purchase plan is sufficient to absorb the net monthly supply of Agency MBS for as long as QE3 is active, which is pushing up prices and driving down yields for Agency MBS. In our opinion, investment capital in search of yield will inevitably begin to flow back to privately-financed mortgage investments. We are seeing evidence of this in our own securitizations. |
| u | The commitment by the Federal Housing Finance Agency (“FHFA”) to continue to raise guarantee |
| 6 | THE REDWOOD REVIEW | 3RD QUARTER 2012 |
|
|
| |
|
SHAREHOLDER LETTER
|
| fees for Agency conforming loans will also accelerate the return of private sector mortgage financing. The typical guarantee fee charged by the Agencies has been increased by the FHFA two times already in 2012. All else equal, as this fee goes up our loan pricing becomes more competitive with the government Agencies. |
| u | The rules of the road and standards for securitization are coming together. We would recommend reading the FHFA’s latest white paper dated October 4, 2012, which proposes a framework for a new securitization platform for the Agencies. We expect a major push to finalize this and other mortgage regulatory initiatives at some point after the November election. |
| u | Housing, by almost any measure, appears to be on the road to recovery. Transaction activity is up, home prices appear to be bottoming (or even markedly rising in many areas), and confidence seems higher than it’s been in years. |
On the commercial side, we have established ourselves as a “one-stop” financing solution for borrowers seeking to purchase or refinance stabilized, income-producing commercial real estate. We are now one of the most active providers of mezzanine loans on such properties. We achieved this status over the last two years by working together with various senior lenders in the origination process. Our portfolio of nearly $300 million of mezzanine investments was created by working with 19 different senior lenders including banks, insurance companies, CMBS conduits, and Freddie Mac. We believe that the diversification of our portfolio and the overall performance of the underlying properties since origination is a testament to our origination platform and disciplined credit process. The fact that we were able to secure warehouse financing for this portfolio late in the third quarter of 2012 is further validation of the origination platform our team has developed.
What We See Ahead
Time will tell, but we are excited about our competitive position as the mortgage market evolves. And while we are now making the shift from strategy to execution, we continue to keep our eyes on the horizon. The flexibility we have built into our operating platforms should enable us to react quickly as lenders, borrowers, and regulators slowly converge toward an accepted financing framework built on private capital.
Execution for our residential business, in the simplest terms, means that we continue to add loan sellers, loan products and senior capital sources. In the near term, we see two broad paths to realizing this goal. First, we continue to expand our footprint in the non-Agency lending space by leveraging our Sequoia platform. We expect non-Agency loan volumes to continue to rise as housing recovers and the government stands down, and we see no obvious signs (to the extent the economy cooperates) that we cannot successfully compete for this business if we maintain our commitment to providing top-notch service to our counterparties.
The other big path we are pursuing — a path that has become an option to us as a result of our conduit build-out — is sourcing agency conforming loans. We are in the midst of the approval process to reestablish Redwood as an authorized loan seller/servicer to Fannie Mae and Freddie Mac, and we are planning to begin offering our sellers conforming mortgage pricing options in early 2013. This expansion of our platform presents a significant growth opportunity for us (the annual Agency origination market
| THE REDWOOD REVIEW | 3RD QUARTER 2012 | 7 |
|
|
| |
|
SHAREHOLDER LETTER
|
is still about ten times larger than the non-Agency market) and will require some additional build-out of our infrastructure over the coming quarters will be required. But the potential benefits are significant. Not only does this present us with expanded fee-generating opportunities, but it also gives us the ability to create and retain mortgage servicing rights.
Down the road, we also see opportunity to finance prime borrowers who do not fit into today’s tight credit box, perhaps because they own a business or work for a commission rather than a salary. We believe these borrowers are being underserved by the market today. The key to a program of this type will depend on our ability to find a reliable senior capital source.
For our commercial business, the team will be increasingly focused on providing a broader product set directly to borrowers and generating fee income by selling senior loans. We anticipate that our ease of execution and our willingness and ability to take credit risk on stabilized properties in good markets will result in significant growth in our origination activity. We are now actively pursuing many such opportunities and anticipate an increase in fees generated while continuing to create attractive mezzanine investments for our portfolio. Our established and ongoing relationships within in the industry will continue to be the key to successfully executing on our strategy.
There is still a lot of work to do, and we have no illusions about the challenges we face in both of our businesses. But looking back over the past few years, we’ve come a long way. Relative to new entrants that may seek to take advantage of a rebound in housing and changing government policy and regulatory objectives, we have a big head start. You, the shareholder, have made that possible. We will continue to work hard to reward your patience, and look forward to building on the Redwood franchise.
As always, thank you for your patience and continued support.

|

| |
| Martin S. Hughes | Brett D. Nicholas | |
| CEO | President |
| 8 | THE REDWOOD REVIEW | 3RD QUARTER 2012 |
|
|

| |
|
QUARTERLY OVERVIEW
|
Third Quarter 2012 Results
Overview
We generated strong financial results for the third quarter of 2012 and continued to gain momentum in both our residential and commercial operating platforms. We feel like we got the big things right during the third quarter — we continued to add new residential loan sellers and had a record quarter for loan purchases through our residential conduit, we recognized profits and recycled capital through portfolio management while modestly growing net interest income, and we made strides in building out our commercial business’ infrastructure to increase its focus on senior loan originations. We generally feel very good about the organic growth we are seeing in our residential and commercial businesses.
Financial Results
Our third quarter 2012 earnings of $40 million, or $0.48 per share, significantly outpaced our second quarter 2012 results of $20 million, or $0.24 per share, largely as a result of higher income from mortgage banking activities and additional gains from sales of residential portfolio securities early in the third quarter. It was a good quarter and many of our business metrics are headed in the right direction, but the combination of rising prices for RMBS stemming from QE3, credit spread tightening for securities issued through our recent securitizations, and a one-time accounting change resulted in an unusual boost to third quarter earnings that may not be easily repeatable. The following table presents a high-level summary of GAAP earnings for the third and second quarters of 2012.
|
GAAP Income |
| |||||||
| ($ in millions, except per share data)
|
| |||||||
| Three Months Ended | ||||||||
| 9/30/2012 | 6/30/2012 | |||||||
| Net interest income | $ | 31 | $ | 31 | ||||
| Provision for loan losses | (1 | ) | 1 | |||||
| Other market valuation adjustments, net | (3 | ) | (5 | ) | ||||
| Net interest income after provision and other market valuation adjustments | 27 | 27 | ||||||
| Mortgage banking activities, net | 17 | 2 | ||||||
| Operating expenses | (17 | ) | (15 | ) | ||||
| Realized gains, net | 14 | 7 | ||||||
| Provision for income taxes | (1 | ) | (1 | ) | ||||
| GAAP income | $ | 40 | $ | 20 | ||||
| GAAP income per share | $ | 0.48 | $ | 0.24 | ||||
Our GAAP book value at September 30, 2012, was $12.88 per share, an increase of $0.88 from June 30, 2012. Our GAAP book value increased largely as a result of rising prices for both RMBS and residential loans held on our balance sheet. We also retained $0.23 per share of our third quarter 2012 GAAP earnings after the payment of our $0.25 per share third quarter dividend. Unlike recent quarters, we did not experience a decline in book value related to the hedges on our long-term debt as long-term interest rates were essentially unchanged at the beginning and end of the quarter.
| THE REDWOOD REVIEW | 3RD QUARTER 2012 | 9 |
|
|
| |
|
QUARTERLY OVERVIEW
|
Financial Results (continued)
The following table presents a summary of GAAP book value for the third and second quarters of 2012.
|
Changes in GAAP Book Value Per Share |
| |||||||||||
| ($ in per share)
|
| |||||||||||
| Q3 2012 | Q2 2012 | Variance | ||||||||||
| Beginning book value |
$ | 12.00 | $ | 12.22 | $ | (0.22 | ) | |||||
| Net income |
0.48 | 0.24 | 0.24 | |||||||||
| Unrealized gains on securities |
0.52 | 0.03 | 0.49 | |||||||||
| Unrealized gains (losses) on hedges |
0.04 | (0.19 | ) | 0.23 | ||||||||
| Equity issuance |
0.06 | - | 0.06 | |||||||||
| Other, net |
0.03 | (0.05 | ) | 0.08 | ||||||||
| Dividends |
(0.25 | ) | (0.25 | ) | - | |||||||
| Ending book value |
$ | 12.88 | $ | 12.00 | $ | 0.88 | ||||||
Investment and Portfolio Sales Activity
During the third quarter of 2012, our capital deployment occurred at a slower pace than the past two quarters, but remained on track to reach our goal of investing $400 million or more of equity capital during 2012. Highlights of the quarter included our September Sequoia securitization and four newly originated commercial mezzanine loans. We purchased $56 million of RMBS, and sold $62 million. These sales generated realized GAAP gains of $14 million. The following table summarizes our investment activity through the first three quarters of 2012.
|
Quarterly Investment Activity |
| |||||||||||||||
| ($ in millions)
|
| |||||||||||||||
| Q3 2012 | Q2 2012 | Q1 2012 | YTD 2012 | |||||||||||||
| Sequoia RMBS |
$ | 24 | $ | 23 | $ | 61 | $ | 108 | ||||||||
| Third-party RMBS |
33 | 103 | 223 | 359 | ||||||||||||
| Less: Short-term debt |
(9 | ) | (83 | ) | (175 | ) | (267 | ) | ||||||||
| Total residential |
48 | 43 | 109 | 200 | ||||||||||||
| Commercial loans |
40 | 69 | 27 | 136 | ||||||||||||
| Equity capital invested |
$ | 88 | $ | 112 | $ | 136 | $ | 336 | ||||||||
At September 30, 2012, we estimate our investment capacity, defined as the amount of capital we have readily available for long-term investments was $141 million, as compared to $90 million at June 30, 2012.
| 10 | THE REDWOOD REVIEW | 3RD QUARTER 2012 |
|
|
| |
|
QUARTERLY OVERVIEW
|
Residential Loan Business
Our Sequoia residential platform continues to expand. We closed SEMT 2012-4, a $313 million securitization on September 21, 2012. Subsequent to quarter end, at the end of October, we closed SEMT 2012-5, a $320 million securitization. These were our fourth and fifth securitizations in 2012, compared to two in 2011 and one in 2010. This brings us to eight securitizations totaling $2.6 billion completed in the post-crisis period. We also completed two whole loan sales totaling $53 million in the third quarter of 2012.
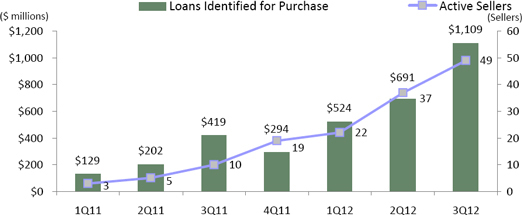
At September 30, 2012, we had 49 active residential loan sellers, up from 37 at June 30, 2012, and we expect to have 55 active loan sellers by year end. We also have 46 potential sellers who are in various stages of review and implementation, most of whom we expect will become active sellers in the near term.
Many of our sellers are regional and community banks that serve borrowers looking to lock-in long-term loans at historically low mortgage rates. Redwood, through its purchase of closed loans, provides these banks with the ability to originate competitively priced 15- and 30-year fixed-rate mortgages without having to incur the interest rate risk normally associated with holding these loans over the long term. Many of our loan sellers also appreciate that Redwood is not a bank and, therefore, not a direct competitor for their customer relationships.
In the third quarter, we identified loans for purchase totaling $1.1 billion, up from $691 million in the second quarter and $419 million in the third quarter of 2011, as shown in the chart below. In October 2012, we identified an additional $758 million of loans for purchase. While we are not certain our loan volume growth trajectory can be sustained for an extended period, we stand to benefit from these increased volumes, in part due to the fact that they generally allow us to complete securitizations more quickly. Our goal is to ramp up our non-Agency loan production over the next 12-to-18 months so we are able to securitize $300 million or more each month.
| THE REDWOOD REVIEW | 3RD QUARTER 2012 | 11 |
|
|
| |
|
QUARTERLY OVERVIEW
|
Residential Loan Business (continued)
At the end of the third quarter of 2012, we owned mortgage servicing rights (“MSRs”) on $566 million of prime-quality jumbo residential loans acquired through our conduit. The capitalized value of these MSRs was $2.65 million, or 47 basis points of the mortgage loans. We earn fees from these MSRs, but outsource the actual servicing.
Commercial Real Estate Business
In the third quarter of 2012, we funded four mezzanine investments totaling $40 million, which increased our year-to-date total to 17 investments totaling $136 million. We currently anticipate investing $40 to $60 million in mezzanine debt in the fourth quarter. At September 30, 2012, our portfolio consisted of 31 investments totaling $286 million, generated a gross yield over 10%, and was funded entirely with equity capital. As we noted last quarter, we have capped the amount of equity capital we plan to invest in our commercial business at $300 million for the foreseeable future.
During the third quarter of 2012, we obtained a $150 million three-year warehouse facility to finance our mezzanine investments, which will potentially enhance the yield on these investments and free up equity capital for reinvestment. We are continuing to focus on establishing a more permanent financing source for our existing portfolio of mezzanine investments.
Our commercial business is moving forward as anticipated and we are now channeling many of our resources toward senior loan origination and distribution channels. Early in the fourth quarter, we received a $645,000 fee associated with the third quarter sale of a $37 million senior loan to a commercial loan conduit. We plan to continue to generate additional fees by originating senior commercial loans and subsequently selling them to third parties that intend to securitize them; however, at this stage in the development of our senior lending business, it is difficult to estimate the level of fees we might generate from this activity in future quarters.
Residential Securities Portfolio
At September 30, 2012, our residential securities portfolio totaled $1 billion and was financed with a combination of $365 million of short-term debt, $179 million of non-recourse resecuritization debt, and $517 million of equity capital. Along with firming housing prices, we believe QE3 has been a net positive for our RMBS portfolio. The Fed’s aggressive purchases of Agency MBS is crowding out Agency investors, some of whom are turning to private label RMBS for higher yields while pushing prices higher. As a result, our RMBS portfolio was up over 2 points in price or $45 million in the quarter. Ample market liquidity afforded us an opportunity to rebalance our seasoned RMBS portfolio and free-up capital for new investments. Sales of securities in the third quarter of 2012 totaled $62 million for gains of $14 million, as compared to sales of $49 million for gains of $7 million in the second quarter of 2012. However, as is often the case, rising prices on securities reduced our expected returns on new acquisitions, and we reduced our acquisition activity in the third quarter of 2012.
Our business model is not dependent upon our ability to acquire seasoned senior securities in the secondary market. Our purchases of senior securities have been opportunistic investments that have allowed us to put capital to work and generate income while the residential securitization market regains
| 12 | THE REDWOOD REVIEW | 3RD QUARTER 2012 |
|
|
| |
|
QUARTERLY OVERVIEW
|
its footing. Over time, we expect that the senior securities in our investment portfolio, which currently represent about 71% of the portfolio, will pay down or be sold and replaced with investments created through our mortgage banking activities and from the purchase of subordinate securities from other securitization sponsors. In the first nine months of 2012, we have retained $91 million (net of sales) of RMBS from our own Sequoia securitizations. The net capital required to fund ongoing investments in our securitizations is generally expected to range between $15 to $20 million per $300 million securitization.
Capital
Based on our current expectation for new investment activity and our ability to free up capital from our securities portfolio, we believe our estimated investment capacity of $141 million should sustain our capital needs well into the first quarter of 2013. However, market conditions can change quickly, which could result in a desire to raise capital sooner. Our efforts to raise capital for new investments could include freeing up additional capital internally through sales or asset-specific financings, the issuance of corporate convertible debt or preferred equity, or the issuance of common equity. Our approach to raising capital will continue to be based on what we believe to be in the best long-term interest of shareholders.
A notable capital development in the third quarter relates to the use of our Direct Stock Purchase Plan (“DSPP”). We made a few changes to the DSPP in the third quarter, to better align with general market terms for overnight stock issuances. We then validated our new terms by conducting a relatively small offering of $30 million of common equity. This translated into the issuance of almost 2.1 million shares of common stock at a price of $14.41 per share on September 11, 2012. We like issuing shares through our DSPP for a couple of reasons. First, under our DSPP, we are able to efficiently issue shares directly to investors at a price (to both Redwood and the investors) that we believe is better than pricing for a similarly sized underwritten transaction. Second, the DSPP can give us the flexibility to issue equity on a “just in time” basis, rather than raising a large amount of equity capital in a single transaction and risk having too much cash sitting idle on our balance sheet. Should investment and growth opportunities arise that merit a larger capital raise, we retain the flexibility to raise capital through more traditional underwritten offerings.
| THE REDWOOD REVIEW | 3RD QUARTER 2012 | 13 |

|
| |
|
FINANCIAL INSIGHTS
|
Balance Sheet
| u | The following table shows the components of our balance sheet at September 30, 2012. |
|
Consolidating Balance Sheet |
| |||||||||||
| September 30, 2012 ($ in millions)
|
| |||||||||||
| At Redwood |
Consolidated Entities |
Redwood Consolidated |
||||||||||
| Residential loans |
$ | 418 | $ | 3,077 | $ | 3,495 | ||||||
| Commercial loans |
286 | 12 | 298 | |||||||||
| Real estate securities - Third party |
985 | 243 | 1,228 | |||||||||
| Real estate securities - Sequoia |
85 | - | 85 | |||||||||
| Cash and cash equivalents |
39 | - | 39 | |||||||||
| Total earning assets |
1,813 | 3,332 | 5,145 | |||||||||
| Other assets
|
|
93
|
|
|
60
|
|
|
152
|
| |||
| Total assets |
$ | 1,906 | $ | 3,392 | $ | 5,297 | ||||||
| Short-term debt |
$ | 522 | $ | - | $ | 522 | ||||||
| Other liabilities |
99 | 58 | 156 | |||||||||
| Asset-backed securities issued |
179 | 3,250 | 3,429 | |||||||||
| Long-term debt |
140 | - | 140 | |||||||||
| Total liabilities |
940 | 3,308 | 4,247 | |||||||||
| Stockholders’ equity
|
|
966
|
|
|
84
|
|
|
1,050
|
| |||
| Total liabilities and equity |
$ | 1,906 | $ | 3,392 | $ | 5,297 | ||||||
| u | We present this table to highlight the impact that our Consolidated Entities had on our GAAP balance sheet at September 30, 2012. As shown, Redwood’s $84 million investment in these consolidated entities increased our consolidated assets by $3.4 billion and liabilities by $3.3 billion. |
| u | We are required under GAAP to consolidate the assets and liabilities of certain Sequoia and Acacia securitizations that are treated as secured borrowing transactions. However, the securitized assets of these entities are not legally ours and we own only the securities and interests that we acquired from these securitization entities. Similarly, the liabilities of these entities are obligations payable only from the cash flow generated by their securitized assets and are not obligations of Redwood. |
| u | Included in Consolidated Entities are $3.1 billion of assets related to Sequoia securitizations (representing securitizations that were completed before 2012 and accounted for under GAAP as secured borrowings) and $0.3 billion of assets related to Acacia securitization entities. The four securitizations that we completed since the beginning of 2012 through September 30, 2012 were accounted for under GAAP as sales of assets. As a result, these securitizations were not consolidated and are not reflected in Consolidated Entities. The securities we retained from these securitizations are reflected on our balance sheet in Real Estate Securities — Sequoia. |
| u | The consolidating balance sheet also includes the assets and liabilities of the resecuritization we completed during the third quarter of 2011 at Redwood, although these assets and liabilities are owned by the resecuritization entity and are legally not ours and we own only the securities and interests that we acquired from the resecuritization entity. At September 30, 2012, the resecuritization accounted for $327 million of assets ($325 million of available-for-sale securities at fair value and $2 million of other assets) and $179 million of asset-backed securities issued (at historical cost). Our $148 million investment in this resecuritization equals the difference between these assets and liabilities. |
| 14 | THE REDWOOD REVIEW | 3RD QUARTER 2012 |
|
|
| |
|
FINANCIAL INSIGHTS
|
Balance Sheet (continued)
Real Estate Loans
| u | At September 30, 2012, at Redwood, we had $418 million of unsecuritized residential real estate loans, as compared to $256 million at June 30, 2012. The increase reflects $524 million of residential loan acquisitions and $15 million of fair value increases less $5 million of principal payments, $53 million of whole loan sales, and $319 million of sales into the September 2012 securitization. Most of our unsecuritized residential real estate loans (and others we have identified for future acquisition) are being held for future securitizations. See the Sequoia Residential Mortgage Loan Business section on page 25 for more information. |
| u | At September 30, 2012, at Redwood, we had $286 million of commercial loans, as compared to $247 million at June 30, 2012. The increase reflects the origination of four loans totaling $40 million. See the Commercial Real Estate Business section that begins on page 29 for more information. |
Real Estate Securities
| u | The following table presents the fair value of real estate securities at Redwood at September 30, 2012. We segment our securities portfolio by vintage (the year(s) the securities were issued), priority of cash flow (senior, re-REMIC, and subordinate), and by the quality of underlying loans (prime and non-prime). |
|
Real Estate Securities at Redwood (1) September 30, 2012 ($ in millions) |
| |||||||||||||||||||||||
| % of Total | ||||||||||||||||||||||||
| <=2004 | 2005 | 2006-2008 | 2012 (3) | Total | Securities | |||||||||||||||||||
| Residential |
||||||||||||||||||||||||
| Prime |
$ | 22 | $ | 190 | $ | 277 | $ | 7 | $ | 496 | 46 | % | ||||||||||||
| Non-prime (2) |
95 | 162 | 6 | - | 263 | 25 | % | |||||||||||||||||
| Total Seniors |
$ | 117 | $ | 352 | $ | 283 | $ | 7 | $ | 759 | 71 | % | ||||||||||||
| Total Re-REMIC |
$ | - | $ | 62 | $ | 88 | $ | - | $ | 150 | 14 | % | ||||||||||||
| Subordinates |
||||||||||||||||||||||||
| Prime |
$ | 56 | $ | 9 | $ | 3 | $ | 78 | $ | 146 | 13 | % | ||||||||||||
| Non-prime (2) |
6 | - | - | - | 6 | 1 | % | |||||||||||||||||
| Total Subordinates |
$ | 62 | $ | 9 | $ | 3 | $ | 78 | $ | 152 | 14 | % | ||||||||||||
| Total Residential |
$ | 179 | $ | 423 | $ | 374 | $ | 85 | $ | 1,061 | 99 | % | ||||||||||||
|
Commercial subordinates
|
$
|
7
|
|
$
|
1
|
|
$
|
-
|
|
$
|
-
|
|
$
|
8
|
|
|
1
|
%
| ||||||
| Total real estate securities |
$ | 186 | $ | 424 | $ | 374 | $ | 85 | $ | 1,069 | 100 | % | ||||||||||||
(1) Included in the residential securities table above are $325 million of senior securities that are included in a resecuritization that we completed in July 2011. Under GAAP accounting, we account for the resecuritization as a financing even though these securities are owned by the resecuritization entity and are legally not ours. We own only the securities and interests that we acquired from the resecuritization entity, which amounted to $141 million at September 30, 2012. As a result, to adjust at September 30, 2012 for the legal and economic interests that resulted from the resecuritization, Total Residential Senior Securities would be decreased by $325 million to $434 million, Total Re-REMIC Residential Securities would be increased by $141 million to $291 million, and Total Residential Securities would be reduced by $184 million to $877 million.
(2) Non-prime residential securities consist of $267 million of Alt-A senior and subordinate securities and $2 million of subprime subordinate securities.
(3) All of the securities from the 2012 vintage are from our Sequoia securitizations.
| THE REDWOOD REVIEW | 3RD QUARTER 2012 | 15 |
|
|
| |
|
FINANCIAL INSIGHTS
|
Balance Sheet (continued)
Real Estate Securities (continued)
| u | The table below details the change in fair value of securities at Redwood during the third and second quarters of 2012. |
|
Real Estate Securities at Redwood |
| |||||||
| ($ in millions)
|
| |||||||
| Three Months Ended | ||||||||
| 9/30/12 | 6/30/12 | |||||||
| Beginning fair value |
$ | 1,057 | $ | 1,009 | ||||
| Acquisitions (1) |
56 | 126 | ||||||
| Sales (1) |
(62 | ) | (49 | ) | ||||
| Gain on sale |
14 | 7 | ||||||
| Effect of principal payments |
(33 | ) | (33 | ) | ||||
| Change in fair value, net |
37 | (3 | ) | |||||
| Ending fair value |
$ | 1,069 | $ | 1,057 | ||||
(1) Included in the acquisitions and sales totals are investments in and sales of investments in Sequoia Entities. For detailed information on these acquisitions and sales, see Cash Flow discussion on pages 23 and 24.
| u | Our acquisitions in the third quarter included $17 million of prime senior securities, $20 million of Alt-A senior securities, and $19 million of prime subordinate securities that were retained from our third quarter securitization, SEMT 2012-4. The amount of equity capital deployed for these acquisitions was $48 million, net of short-term borrowings. |
Investments in the Securitization Entities
| u | Our investments in Consolidated Entities, as estimated for GAAP, totaled $84 million at September 30, 2012. This amount reflects the estimated book value of our retained investments in these entities based on the difference between the consolidated assets and liabilities of the entities in the aggregate according to their GAAP carrying amounts. Management’s estimate of the non-GAAP economic value of our investments in Consolidated Entities was $91 million. Of this amount, $43 million consisted of IOs at Sequoia entities and $48 million consisted of senior and subordinate securities we retained at Sequoia and Acacia entities. To determine this estimate of non-GAAP economic value, we used the same valuation process that we follow to fair value our other real estate securities as described in the Accounting Discussion in the Appendix. |
| 16 | THE REDWOOD REVIEW | 3RD QUARTER 2012 |
|
|
| |
|
FINANCIAL INSIGHTS
|
Balance Sheet (continued)
Debt
| u | At September 30, 2012, we had short-term mortgage warehouse debt outstanding of $157 million, which was used to finance a portion of our $416 million inventory of residential mortgage loans held for future securitization or sale. At September 30, 2012, we had three uncommitted residential mortgage warehouse facilities with an aggregate borrowing capacity of $600 million. We also had a three-year $150 million commercial warehouse facility, of which $100 million is committed. |
| u | At September 30, 2012, we had short-term debt incurred through securities repurchase facilities of $365 million secured by $471 million of our RMBS at market value, resulting in a debt-to-equity leverage ratio for these RMBS of 3.4x (excluding the portion of our cash we designate as a liquidity capital cushion related to these short-term borrowings). |
| u | At September 30, 2012, we had $179 million outstanding of asset-backed debt issued at a stated interest rate of one-month LIBOR plus 200 basis points related to our resecuritization of senior securities with a market value of $325 million. For GAAP, Redwood’s investment in the resecuritized assets is the difference between the outstanding balance of the resecuritized securities (including other assets of $2 million) and the balance of the asset-backed debt, or $148 million. We estimate the non-GAAP economic value of our investment to be $143 million, because we estimate the fair value of the $179 million of debt (at historical cost) to be $184 million using the same valuation process we used to fair value our other financial assets and liabilities. |
| u | At September 30, 2012, we had $140 million of long-term debt outstanding due in 2037 with a stated interest rate of three-month LIBOR plus 225 basis points. In 2010, we effectively fixed the interest rate on this long-term debt at a rate of approximately 6.75% (excluding deferred debt issuance costs) through interest rate swaps. Although we report our long-term debt in accordance with GAAP based on its $140 million historical cost, we estimate the non-GAAP economic value of this debt at $81 million based on its stated interest rate using the same valuation process used to fair value our other financial assets and liabilities. |
Capital and Cash
| u | At September 30, 2012, our total capital was $1.2 billion, including $1.05 billion of shareholders’ equity and $140 million of long-term debt. We use our capital to invest in earning assets, meet lender capital requirements, and to fund our operations and working capital needs. |
| u | During the third quarter, we raised $30 million of equity through the sale of common stock at a price of $14.41 per share through our Direct Stock Purchase Plan. |
| u | Our cash balance was $39 million at September 30, 2012. We hold cash for two main reasons. First, we hold cash in an amount we believe will be sufficient to comply with covenants, to fund haircuts (or the difference between the amounts advanced to us by our lenders and the value of the pledged loans and securities) on our warehouse and repo borrowing facilities, to meet potential margin calls, and to cover near-term cash operating expenses. Second, we hold cash in anticipation of having opportunities to invest at attractive yields. |
| u | We estimate that our investment capacity was $141 million at September 30, 2012. |
| THE REDWOOD REVIEW | 3RD QUARTER 2012 | 17 |
|
|
| |
|
FINANCIAL INSIGHTS
|
GAAP Income
| u | The following table provides a summary of our consolidated GAAP income for the third and second quarters of 2012. |
|
GAAP Income |
| |||||||
| ($ in millions, except per share data)
|
| |||||||
| Three Months Ended | ||||||||
| 9/30/12 | 6/30/12 | |||||||
| Interest income | $ | 60 | $ | 60 | ||||
| Interest expense | (28 | ) | (29 | ) | ||||
| Net interest income | 31 | 31 | ||||||
| (Provision for) reversal of provision for loan losses | (1 | ) | 1 | |||||
| Other market valuation adjustments, net | (3 | ) | (5 | ) | ||||
| Net interest income after provision and other market valuation adjustments | 27 | 27 | ||||||
| Mortgage banking activities, net | 17 | 2 | ||||||
| Operating expenses | (17 | ) | (15 | ) | ||||
| Realized gains, net | 14 | 7 | ||||||
| Provision for income taxes | (1 | ) | (1 | ) | ||||
| GAAP income | $ | 40 | $ | 20 | ||||
| GAAP income per share | $ | 0.48 | $ | 0.24 | ||||
| u | Our consolidated GAAP net income for the third quarter of 2012 was $40 million, or $0.48 per share, as compared to $20 million, or $0.24 per share, for the second quarter of 2012. The $20 million increase resulted from higher mortgage banking income and realized gains from the sale of securities, partially offset by a higher loan loss provision and higher operating expenses. |
| 18 | THE REDWOOD REVIEW | 3RD QUARTER 2012 |
|
|
| |
|
FINANCIAL INSIGHTS
|
GAAP Income (continued)
| u | The following tables show the estimated effect that Redwood and our Consolidated Entities had on GAAP income for the third and second quarters of 2012. |
|
Consolidating Income Statement |
| |||||||||||
| Three Months Ended September 30, 2012 | ||||||||||||
| ($ in millions)
|
| |||||||||||
| At Redwood |
Consolidated Entities |
Redwood Consolidated |
||||||||||
| Interest income | $ | 29 | $ | 25 | $ | 54 | ||||||
| Net discount (premium) amortization | 7 | (2 | ) | 6 | ||||||||
| Total interest income | 36 | 23 | 60 | |||||||||
| Interest expense | (6 | ) | (22 | ) | (28 | ) | ||||||
| Net interest income | 30 | 1 | 31 | |||||||||
| Provision for loan losses | (1 | ) | (1 | ) | (1 | ) | ||||||
| Other market valuation adjustments, net | (6 | ) | 2 | (3 | ) | |||||||
| Net interest income after provision and other market valuation adjustments | 24 | 3 | 27 | |||||||||
| Mortgage banking activities, net | 17 | - | 17 | |||||||||
| Operating expenses | (17 | ) | - | (17 | ) | |||||||
| Realized gains, net | 14 | - | 14 | |||||||||
| Provision for income taxes | (1 | ) | - | (1 | ) | |||||||
| Net income | $ | 37 | $ | 3 | $ | 40 | ||||||
|
Consolidating Income Statement |
| |||||||||||
| Three Months Ended June 30, 2012 | ||||||||||||
| ($ in millions)
|
| |||||||||||
| At Redwood |
Consolidated Entities |
Redwood Consolidated |
||||||||||
| Interest income | $ | 27 | $ | 27 | $ | 53 | ||||||
| Net discount (premium) amortization | 8 | (2 | ) | 7 | ||||||||
| Total interest income | 35 | 25 | 60 | |||||||||
| Interest expense | (6 | ) | (23 | ) | (29 | ) | ||||||
| Net interest income | 29 | 2 | 31 | |||||||||
| Provision for loan losses | - | 2 | 1 | |||||||||
| Other market valuation adjustments, net | (6 | ) | 1 | (5 | ) | |||||||
| Net interest income after provision and other market valuation adjustments | 22 | 4 | 27 | |||||||||
| Mortgage banking activities, net | 2 | - | 2 | |||||||||
| Operating expenses | (15 | ) | - | (15 | ) | |||||||
| Realized gains, net | 7 | - | 7 | |||||||||
| Provision for income taxes | (1 | ) | - | (1 | ) | |||||||
| Net income | $ | 16 | $ | 4 | $ | 20 | ||||||
| THE REDWOOD REVIEW | 3RD QUARTER 2012 | 19 |
|
|
| |
|
FINANCIAL INSIGHTS
|
GAAP Income (continued)
Redwood Parent
| u | Total interest income from our securities portfolio was $25 million for the third quarter of 2012, a decline of $1 million, as compared to $26 million in the second quarter of 2012. This decline was primarily the result of lower average balances as principal paydowns and sales outpaced new investments. |
| u | Residential loans at Redwood generated $4 million of interest income during the third quarter of 2012, a slight increase from the second quarter of 2012, as the average balance of loans rose 28% to $466 million. These loans are financed at Redwood prior to either being pooled and securitized through our Sequoia program or sold as whole loans. The amount of interest earned at Redwood is dependent upon prevailing mortgage rates and the pace of our loan purchase and sale activity. |
| u | Commercial loans at Redwood generated $7 million of interest income in the third quarter of 2012, an increase from $5 million in the second quarter of 2012, as the average portfolio increased by 34% to $267 million from the prior quarter. New loan originations totaled $40 million in the third quarter of 2012, increasing the portfolio to $286 million at September 30, 2012. |
| u | Interest expense at Redwood was $6 million in both the third and second quarters of 2012. Our debt at Redwood at September 30, 2012 consisted of our $140 million of long-term debt at an effective cost of 6.88% per annum, ABS-issued debt related to our resecuritization of certain senior residential securities at an effective cost of 2.56% per annum, and short-term securities repurchase and mortgage warehouse related debt at a cost of approximately 1.92% per annum. |
| u | Net negative market valuation adjustments on securities and derivatives were $6 million for each of the third and second quarters of 2012. These valuation decreases were primarily a result of lower market valuations on IOs retained from recent Sequoia securitizations due to a decline in interest rates and an increase in prepayment expectations over the past two quarters. These IOs help us manage risks associated with our residential loan pipeline and consequently reduce the amount of risk management derivatives we may otherwise use to manage our pipeline. |
| u | Net income from mortgage banking activities, was $17 million in the third quarter of 2012, as compared to $2 million in the second quarter of 2012. This increase resulted from rising values for loans we held on our balance sheet for securitizations during the third quarter, primarily due to strong demand for AAA-rated securities backed by those types of loans. In the third quarter of 2012, we began marking these loans to market through our income statement. This accounting change helps to further align our reported results with the economics underlying our residential loan business. Consequently, we expect gains (or losses) on the sale of residential loans during subsequent reporting periods to be smaller, all else equal, as their cost basis at the end of each quarter will already reflect the price at which we believe they could be sold. |
| u | Net income from mortgage banking activities, also included $5 million in gains from the sale of $372 million of loans through securitization and whole loan sales. These gains were partially offset by hedging expenses of $2 million. An additional benefit from our decision to adopt fair value accounting for new residential loans is the greater likelihood that hedging gains or losses will be offset by gains or losses in the value of our loans during the same quarter that the valuation changes occur, as opposed to a potential offset in a future quarter. |
| u | During the third quarter of 2012, we recognized $14 million of gains from the sale of securities, as compared to $7 million recognized in the second quarter of 2012. These gains were realized as a result of our ongoing management of our securities portfolio. Since future sale activity is uncertain, future gains or losses may be volatile. |
| 20 | THE REDWOOD REVIEW | 3RD QUARTER 2012 |
|
|
| |
|
FINANCIAL INSIGHTS
|
GAAP Income (continued)
Redwood Parent (continued)
| u | Operating expenses at Redwood increased $2 million to $17 million in the third quarter, as compared to $15 million in the second quarter, largely due to of higher variable compensation expense accruals attributable in part to higher bonus accruals related to our anticipated financial performance for 2012. |
Consolidated Entities
| u | We recognized net income of $3 million for the third quarter from our investments in Legacy Sequoia and Acacia securitization entities, as compared to net income of $4 million for the previous quarter. |
| u | Our allowance for loan losses at legacy Sequoia entities was $54 million at September 30, 2012, as compared to $55 million at June 30, 2012. While our overall credit reserving needs continue to remain flat or decline largely due to improvements in housing, we booked $1 million of provision expense during the third quarter of 2012 to replenish the reserve after recording $3 million of charge-offs during the quarter. These charge-offs relate to existing delinquent loans that have transitioned towards short-sale or foreclosure status, as opposed to an uptrend in new delinquencies. |
| u | There are currently nine Sequoia entities for which we have aggregate loan-loss reserves of $5 million in excess of our reported investment for GAAP purposes, an amount we expect to recover in future periods. We are currently exploring whether to sell our interests in certain of these Sequoia entities as early as the fourth quarter of 2012 with the intention of deconsolidating the entities and avoiding additional provision charges that have already exceeded our investments. |
| THE REDWOOD REVIEW | 3RD QUARTER 2012 | 21 |
|
|
| |
|
FINANCIAL INSIGHTS
|
REIT Taxable Income and Dividends
Summary
As a REIT, Redwood is required to distribute to shareholders at least 90% of its REIT taxable income (and meet certain other requirements), although Redwood’s Board of Directors can declare dividends in excess of this minimum requirement. REIT taxable income is defined as income calculated for tax purposes that is earned at Redwood and its qualified REIT subsidiaries. Redwood also earns taxable income at its taxable subsidiaries, which it is not required to distribute. To the extent Redwood retains taxable income that is not distributed to shareholders, it is taxed at corporate tax rates. A reconciliation of GAAP and taxable income is set forth in Table 2 in the Financial Tables in this Review.
Overview
| u | REIT taxable income continues to remain volatile and has not been the primary driver of our dividend for the past few years. While we had positive current period REIT taxable income for each quarter of 2012, any dividends we have paid or will pay in 2012 will most likely not be required distributions due to existing net operating loss and capital loss carryforwards at the REIT. However, our Board of Directors has considered other factors, including our operational results and GAAP earnings, in determining dividend policy. On August 2, 2012, the Board of Directors declared a regular dividend of $0.25 per share for the third quarter, which was paid on September 28, 2012, to shareholders of record on September 14, 2012. |
| u | Per federal income tax rules, our dividend distributions will be taxed at the shareholder level based on our 2012 tax results before application of any loss carryforwards. Therefore, we expect a significant portion of the dividends we distribute in 2012 to be taxable to shareholders. |
| u | Our estimate of REIT taxable income for the third quarter of 2012 was $15 million, or $0.19 per share, as compared to estimated REIT taxable income of $17 million, or $0.22 per share, for the second quarter of 2012. These results, which include the effect of credit losses realized from legacy investments, are used in part to determine the taxability of our 2012 dividends at the shareholder level. Additional details on our quarterly tax results can be found in the Appendix of this Redwood Review. |
| u | For the nine months ended September 30, 2012, we realized net capital losses of $4 million at the REIT for tax purposes. Net capital losses generated in 2012 by the REIT have no effect on the taxability of our dividend. However, if the REIT were to generate realized net capital gains for the entire tax year, those gains would increase the portion of our dividend that is characterized as ordinary income to our shareholders. |
| u | Our REIT taxable income will likely continue to vary from period to period due to the timing of realized credit losses from legacy investments. Based on the securities we currently own, we expect an additional $123 million of credit losses to be realized over an estimated three- to five-year period for tax purposes. This amount is down from $138 million at year-end 2011 and $208 million at year-end 2010. Given the significant (but declining) impact of legacy losses on our current period taxable income, our GAAP results — which have already provisioned for these losses in prior periods — will likely continue to outpace our tax results and be more reflective of current performance trends. |
| u | Redwood’s estimated total taxable income, defined as the sum of REIT taxable income plus the taxable income at our taxable REIT subsidiaries, was $17 million, or $0.21 per share, in the third quarter of 2012, as compared to estimated taxable income of $17 million, or $0.22 per share, in the second quarter of 2012. Year to date, our taxable REIT subsidiaries have not generated taxable income. However, we recorded a tax provision for GAAP at the taxable REIT subsidiary level in the third quarter for tax we |
| 22 | THE REDWOOD REVIEW | 3RD QUARTER 2012 |
|
|
| |
|
FINANCIAL INSIGHTS
|
| expect to pay on excess inclusion income from certain Sequoia securitization entities completed since 2010. This excess inclusion income was not earned at the REIT for tax purposes and no portion of our 2012 dividends will be characterized as excess inclusion income as a result of this Sequoia-related taxable income. |
Cash Flow
| u | The sources and uses of cash in the table below are derived from our GAAP Consolidated Statements of Cash Flow for the third and second quarters of 2012, aggregating and netting all items in a manner consistent with the way management analyzes them. This table excludes the gross cash flow generated by our Sequoia and Acacia securitization entities (cash flow that is not available to Redwood), but does include the cash flow distributed to Redwood as a result of our investments in these entities. The beginning and ending cash balances presented in the table below are GAAP amounts. |
|
Redwood Sources and Uses of Cash |
| |||||||
| ($ in millions)
|
| |||||||
| Three Months Ended | ||||||||
| 9/30/12 | 6/30/12 | |||||||
| Beginning cash balance | $ | 70 | $ | 150 | ||||
| Business cash flow (1) | ||||||||
| Loans, securities, and investments (2) |
66 | 63 | ||||||
| Operating expenses |
(11 | ) | (12 | ) | ||||
| Interest expense on other borrowed funds (3) |
(5 | ) | (5 | ) | ||||
| Dividends |
(20 | ) | (20 | ) | ||||
| Net business cash flow | 30 | 26 | ||||||
| Investment-related cash flow | ||||||||
| Acquisition of residential loans |
(524 | ) | (339 | ) | ||||
| Origination/acquisition of commercial debt investments |
(40 | ) | (69 | ) | ||||
| Acquisition of third-party securities (4) |
(12 | ) | (106 | ) | ||||
| Sale of third-party securities (5) |
52 | 49 | ||||||
| Investments in Sequoia Entities, net (6) |
(13 | ) | (17 | ) | ||||
| Total investment-related cash flow |
(537 | ) | (482 | ) | ||||
| Financing and other cash flow | ||||||||
| Proceeds from residential loan sales |
376 | 387 | ||||||
| Proceeds from repo debt, net |
5 | 56 | ||||||
| Proceeds from (repayment of) warehouse debt, net |
62 | (42 | ) | |||||
| Margin returned (posted), net |
4 | (20 | ) | |||||
| Derivative pair-off/premiums paid |
(3 | ) | (5 | ) | ||||
| Share issuance |
30 | - | ||||||
| Changes in working capital |
2 | - | ||||||
| Net financing and other cash flow
|
|
476
|
|
|
376
|
| ||
| Ending cash balance | $ | 39 | $ | 70 | ||||
| (1) | Cash flow from securities and investments can be volatile from quarter to quarter depending on the level of invested capital, the timing of credit losses, acquisitions, sales, and changes in prepayments and interest rates. Therefore, (i) cash flow generated by these investments in a given period is not necessarily reflective of the long-term economic return we will earn on these investments; and (ii) it is difficult to determine what portion of the cash received from an investment is a return “of” principal and what portion is a return “on” principal in a given period. |
| (2) | Sources of cash from residential securities include the cash received from the securities that were included in the resecuritization we engaged in during the third quarter of 2011, net of the principal and interest payments made in respect of the ABS issued in that resecuritization. |
| (3) | Other borrowed funds consist of short-term repurchase and warehouse debt and long-term debt. |
| (4) | Total acquisitions of third-party securities in the third quarter of 2012 were $33 million. Securities acquisitions of $21 million made in the third quarter that settled in October are not reflected in the third quarter under Acquisitions of third-party securities, net. Total acquisitions of securities in the second quarter of 2012 were $103 million. Securities acquisitions of $3 million made in the first quarter that settled in April are reflected in the second quarter cash flow. |
| (5) | Total sales of third-party securities in the second quarter of 2012 were $43 million. Securities sales of $6 million made in the first quarter that settled in April are reflected in the second quarter cash flow. |
| (6) | Investments in Sequoia Entities, net during the third quarter of 2012 included $24 million of securities, of which $5 million were sold in the quarter. Also included in the third quarter of 2012 are sales of $6 million of investments made in the second quarter. Investments in Sequoia Entities, net during the second quarter of 2012 included $23 million of new investments and sales of $6 million of investments made in the first quarter. |
| THE REDWOOD REVIEW | 3RD QUARTER 2012 | 23 |
|
|
| |
|
FINANCIAL INSIGHTS
|
Cash Flow (continued)
| u | Net business cash flow totaled $30 million in the third quarter of 2012, as compared to $26 million in the second quarter. Contributing to the increase was a $3 million increase in principal and interest payments from residential loans, securities and investments as a result of higher average residential and commercial loan balances. |
| u | The $66 million of cash flow from our loans, securities, and investments continued to exceed the sum of our cash operating expenses of $11 million, interest expense on borrowed funds of $5 million, and dividends paid of $20 million. |
| u | Notable sources of cash in the third quarter of 2012 included $323 million from the proceeds from a Sequoia residential mortgage securitization, $54 million from whole loan sales, $62 million from mortgage warehouse facilities used to finance a portion of our mortgage loan inventory, $52 million from the sale of RMBS, and $30 million from our common equity issuance. |
| u | One notable use of cash in the third quarter of 2012 was $524 million for the acquisition of residential loans, as compared to $339 million in the second quarter, as the pace of our acquisition activity increased. |
| u | Other notable uses of cash in the third quarter of 2012 included $40 million for commercial mezzanine loan investments and $24 million to acquire securities from the Sequoia securitization we completed in the third quarter of 2012. Cash issued to acquire third-party RMBS was only $12 million (as another $21 million of acquisitions was settled in October 2012). |
| u | Cash flow from securities and investments can be volatile from quarter to quarter depending on the level of invested capital, the timing of credit losses, acquisitions, sales, and changes in prepayment rates and interest rates. |
| 24 | THE REDWOOD REVIEW | 3RD QUARTER 2012 |
|
|

| |
|
SEQUOIA RESIDENTIAL MORTGAGE LOAN BUSINESS
|
Summary
We purchase newly originated loans (mainly prime jumbo loans) that meet our collateral criteria from third-party originators on a flow or bulk basis. Loans acquired through this process (our “conduit”) are expected to be securitized through Sequoia securitization entities, which acquire residential mortgage loans from our conduit and issue RMBS backed by these loans, or are sold as whole loans. Most of the senior or investment-grade rated RMBS issued by Sequoia Entities are sold to third-party investors. Redwood generally acquires the subordinate or non-investment grade securities but has also acquired senior securities and interest-only securities from the Sequoia Entities.
Quarterly Update
| u | On September 21, 2012, we closed SEMT 2012-4, a $313 million securitization of 372 prime jumbo mortgage loans, which marked our fourth securitization in 2012 and our seventh in the post-financial crisis period. Our initial investment in SEMT 2012-4 was $25 million. |
| u | At September 30, 2012, we held $124 million (estimated economic value) of RMBS issued from these seven new Sequoia securitizations. Included in the $124 million are $39 million of investments from the 2010 and 2011 Sequoia securitizations that we have consolidated and accounted for as financings under GAAP, and $85 million of investments we retained from the 2012 Sequoia securitizations that were accounted for as sales under GAAP. We are currently holding fewer investments than we initially retained from these seven securitizations, as after we close a transaction we may subsequently sell certain securities that we initially retained. |
| u | At September 30, 2012, there were four 30-day delinquencies among the loans underlying these seven Sequoia securitizations, all four of which were brought current by October 19, 2012. There have not been any 60-day delinquencies or credit losses relating to these securitizations. |
| u | At September 30, 2012, residential loans purchased and held on our balance sheet for future securitizations or whole loan sales totaled $416 million, and the pipeline of residential loans we have identified for purchase totaled $808 million. |
| u | At September 30, 2012, we had 49 active sellers (or loan originators) that we buy loans from, up from 37 at June 30, 2012. |
| u | At October 26, 2012, residential loans purchased and held on our balance sheet for future securitization or loan sales totaled $253 million (excluding the loans in SEMT 2012-5) and the pipeline of residential loans we have identified for purchase totaled $1.2 billion. |
| u | Subsequent to quarter end, we closed SEMT 2012-5, a $320 million securitization in late October. |
| u | We anticipate closing another securitization in the fourth quarter of 2012. |
| THE REDWOOD REVIEW | 3RD QUARTER 2012 | 25 |

|
| |
|
RESIDENTIAL REAL ESTATE SECURITIES
|
Summary
Redwood invests in securities that are backed by pools of residential loans. Some of these investments in residential securities consist of senior prime and non-prime securities and non-senior securities. Residential prime securities are mortgage-backed securities backed by prime residential mortgage loans. Residential non-prime securities are mortgage-backed securities backed by non-prime (Alt-A, Option ARM, and Subprime) residential mortgage loans. Non-senior securities include subordinate and re-REMIC securities.
Senior securities are those interests in a securitization that have the first right to cash flows and are last in line to absorb losses. Subordinate securities are those interests in a securitization that have a more junior right to cash flows and are in line to absorb losses before the senior securities A re-REMIC is a resecuritization of RMBS where the cash flow from and any credit losses absorbed by the underlying RMBS are allocated among the securities issued in the resecuritization transaction in a variety of ways.
The following discussion refers only to the residential securities owned by Redwood, excluding securities owned by Acacia entities and exclusive of Redwood’s investments in Acacia.
This discussion includes the securities that we resecuritized during the third quarter of 2011 and are presented in our consolidated balance sheet.
In the Financial Tables in the Appendix, information on the residential securities we own and underlying loan characteristics is set forth in Tables 5 through 8B.
Quarterly Update
| u | Interest income generated by our residential securities was $24 million in the third quarter of 2012, resulting in an annualized unlevered yield of 11% on the $909 million average amortized cost of these securities. |
| u | At September 30, 2012, the fair value of the residential securities we own totaled $1.1 billion, consisting of $496 million in prime senior securities, $263 million in non-prime senior securities, $150 million of re-REMIC securities, and $152 million in subordinate securities. The amortized cost of our available-for-sale securities, which accounts for all but $30 million, was 69% of face value and the fair value was 79% of face value at September 30, 2012. |
| u | We financed our holdings of residential securities with short-term debt secured by securities (repo debt), through the resecuritization transaction we completed during the third quarter of 2011 (resecuritization debt), and with equity capital. During the third quarter 2012, average repo debt amounted to $358 million and the average resecuritization debt amounted to $184 million. |
| u | At September 30, 2012, 39% of the residential securities we held were fixed-rate assets, 19% were adjustable-rate assets, 26% were hybrid assets that reset within the next year, 11% were hybrid assets that reset between 12 and 36 months, and 5% were hybrid assets that reset after 36 months. We attempt to strike a balance in the composition of the portfolio between adjustable-rate securities that have lower interest-rate risk but lower yields, and fixed-rate securities that have higher interest-rate risk but higher yields, and we make adjustments as appropriate. |
| 26 | THE REDWOOD REVIEW | 3RD QUARTER 2012 |
|
|
| |
|
RESIDENTIAL REAL ESTATE SECURITIES
|
Quarterly Update (continued)
| u | The following table presents information on residential securities at Redwood at September 30, 2012. For GAAP, we account for the large majority of these securities as available-for-sale (AFS) and others as trading securities, and in both cases the securities are reported at their fair value at the report date. |
|
Residential Securities at Redwood |
| |||||||||||||||||||
| September 30, 2012 | ||||||||||||||||||||
| ($ in millions)
|
| |||||||||||||||||||
| Senior | ||||||||||||||||||||
| Prime | Non-prime | Re-REMIC | Subordinate | Total | ||||||||||||||||
| Available-for-sale securities (1) | ||||||||||||||||||||
| Current face |
$ | 518 | $ | 288 | $ | 216 | $ | 277 | $ | 1,299 | ||||||||||
| Credit reserve |
(23 | ) | (17 | ) | (56 | ) | (104 | ) | (200 | ) | ||||||||||
| Net unamortized discount |
(60 | ) | (46 | ) | (61 | ) | (35 | ) | (202 | ) | ||||||||||
| Amortized cost |
435 | 225 | 99 | 138 | 897 | |||||||||||||||
| Unrealized gains |
56 | 17 | 51 | 16 | 140 | |||||||||||||||
| Unrealized losses |
(1 | ) | (2 | ) | - | (3 | ) | (6 | ) | |||||||||||
| Trading securities
|
|
6
|
|
|
23
|
|
|
-
|
|
|
1
|
|
|
30
|
| |||||
| Fair value of residential securities | $ | 496 | $ | 263 | $ | 150 | $ | 152 | $ | 1,061 | ||||||||||
| Fair value of AFS securities as a % of face value (2) |
95% | 83% | 69% | 54% | 79% | |||||||||||||||
| Amortized cost of AFS securities as a % of face value (2) |
84% | 78% | 46% | 50% | 69% | |||||||||||||||
(1) Included in the residential securities table above are $325 million of senior securities that are included in a resecuritization that we completed in July 2011. Under GAAP accounting, we account for the resecuritization as a financing even though these securities are owned by the resecuritization entity and are legally not ours. We own only the securities and interests that we acquired from the resecuritization entity, which amounted to $141 million at September 30, 2012. As a result, to adjust at September 30, 2012 for the legal and economic interests that resulted from the resecuritization, Total Residential Senior Securities would be decreased by $325 million to $434 million, Total Re-REMIC Residential Securities would be increased by $141 million to $291 million, and Total Residential Securities would be reduced by $184 million to $877 million.
(2) Does not include $30 million of trading securities.
| u | Securities are acquired assuming a range of outcomes based on modeling of expected performance at the individual loan level for both delinquent and current loans. Over time, the performance of these securities may require a change in the amount of credit reserves we designate. |
| u | In the third quarter of 2012, realized credit losses on our residential securities at Redwood totaled $11 million, as compared to credit losses of $12 million in the second quarter of 2012. In each quarter of 2012, all of the losses came from our subordinate securities. We expect future losses to extinguish a percentage of the subordinate securities as reflected by the $104 million of credit reserves we have allocated for the $277 million face value of those securities. Until the losses occur, we will generally continue to earn interest, to varying degrees, on the face value of those securities. |
| u | Additional information on interest income and yields for our securities portfolio is reported in the Financial Tables in the Appendix. |
| THE REDWOOD REVIEW | 3RD QUARTER 2012 | 27 |
|
|
| |
|
RESIDENTIAL REAL ESTATE SECURITIES
|
Housing Prices
| u | Our outlook for housing is unchanged from three months ago. If you compare house prices to local incomes, housing is inexpensive by historical standards in most of the country. Record low interest rates are providing an additional boost to home affordability, which should protect against declining price declines, absent a second recession. There is still an overhang of supply, especially from “shadow” inventory not listed on the market, but the situation is improving: the National Association of Realtors reported that existing home inventories declined 18% year-over-year in August 2012. We believe housing is in the process of stabilizing (with rising prices in some areas), but we do not expect housing, in general, to be a significantly appreciating asset class for several years. |
Delinquencies
| u | Industry-wide delinquencies fell in the third quarter of 2012, but remain at historically elevated levels. According to LoanPerformance data, serious (90+ day) delinquencies fell by 0.23% quarter-over-quarter to 10.69% for prime loans and fell 0.82% quarter-over-quarter to 27.67% for Alt-A loans. The loans underlying Redwood’s portfolio of RMBS that were issued prior to 2008 have, on average, lower delinquency rates than the market as a whole: 7.66% of our prime loans, and 13.57% of Alt-A loans, are 90+ days delinquent. |
| u | Industry-wide early-stage roll rates (from loans “always current” to 30 days delinquent) improved in the third quarter. Of previously “always current” prime loans, 0.44% missed their first payment in September 2012, down from 0.49% in June 2012, while the same metric for Alt-A also fell 0.05% to 0.82%. These roll rates are high by historical standards but well below 2008 — 2011 levels, and are showing no sign of a “double dip” in mortgage performance. This trend should eventually cause total delinquencies to fall, but for now the slowdown in new defaults is being offset by an extension in liquidation timelines. |
Prepayments
| u | Industry-wide prepayment speeds were stable during the third quarter. Prime borrowers with loan-to-value (LTV) ratios below 100% prepaid at 18% CPR in September 2012 (down from 19% in June 2012), while Alt-A borrowers with equity prepaid at 8% CPR, in line with June 2012. Prepayment rates continue to remain high — according to Freddie Mac, the monthly average rate for new loans fell from 3.68% in March 2012 to an all time low of 3.47% in September 2012. Borrowers without equity prepaid very slowly regardless of credit quality, with prime and Alt-A loans with above 100% LTV prepaying at only 6% and 1% CPR, respectively. |
| 28 | THE REDWOOD REVIEW | 3RD QUARTER 2012 |
|
|

| |
|
COMMERCIAL REAL ESTATE BUSINESS
|
Summary
Redwood’s commercial origination platform provides debt solutions for borrowers on commercial properties. Redwood originates loans on stabilized commercial properties, creating and retaining the subordinate investments for its portfolio and selling the senior loans to others. Redwood also collaborates with various lending institutions (including major banks, life insurance companies, commercial mortgage-backed securities (“CMBS”) issuers, and the GSEs) to originate subordinate debt investments (typically mezzanine loans or other forms of subordinated financing such as preferred equity or B-Notes, referred to as “loans”) for its portfolio. Redwood also owns a small balance of legacy commercial securities that were acquired prior to 2008. This discussion is exclusive of commercial securities and loans owned by Acacia entities.
Quarterly Update
| u | During the third quarter of 2012, we closed four loans for $40 million, including two with new senior lending partners. To date, we have closed our loans in collaboration with 19 different senior lenders, including seven banks, an insurance company, a GSE, and ten CMBS conduits. Our ability to work with multiple capital sources is central to our commercial lending strategy. |
| u | At September 30, 2012, our commercial loan portfolio totaled $286 million. On average, these investments have a weighted average maturity of nearly six years, an unlevered annual yield of 10.54%, a loan-to-value ratio of 73% at origination, and a debt service coverage ratio at origination of 1.24x based on our underwritten cash flows. |
| u | During the third quarter of 2012, our commercial loan portfolio generated interest income of $7 million, compared to $5 million in the second quarter. |
| u | At September 30, 2012, all of these loans continue to be current and most of the underlying properties are generally performing as expected or better than at origination. |
| u | In October 2012, we received a fee from selling a loan that was subsequently contributed to a CMBS pool. This loan was originated in the second quarter of 2012 and we earned a $645,000 fee on this $37 million loan. We plan to continue to generate additional fees by originating senior commercial loans with the intent to sell these to third parties that intend to securitize them. |
| u | On the financing side, we closed on a three-year $150 million warehouse facility to finance our portfolio of commercial loans. |
| THE REDWOOD REVIEW | 3RD QUARTER 2012 | 29 |
|
|
| |
|
COMMERCIAL REAL ESTATE BUSINESS
|
Quarterly Update (continued)
| u | The following table and charts provide information on the commercial mezzanine loan portfolio as of September 30, 2012. |
| Property Type | Number Of Loans | Weighted Average DSCR(1) |
Weighted Average LTV(2) |
Average Loan Size ($ in millions) | ||||
|
Multifamily
|
12 | 1.20X | 80% | $6.5 | ||||
|
Office
|
8 | 1.22X | 71% | $11.1 | ||||
|
Retail
|
3 | 1.17X | 76% | $15.4 | ||||
|
Hospitality
|
4 | 1.33X | 62% | $14.6 | ||||
|
Self Storage
|
3 | 1.34X | 79% | $6.0 | ||||
|
Total
|
30(3) | 1.24X | 73% | $9.6 |
(1) The debt service coverage ratio (DSCR) is defined as the property’s annual net operating income divided by the annual principal and interest payments. A DSCR of less than 1.00x would mean there was insufficient cash flow to make principal and interest payments, while a DSCR of more than 1.00x would mean there was positive cash flow after payment of principal and interest. The weighted average DSCRs in this table are based on the ratios at the time the loans were originated and are not based on subsequent time periods during which there may have been increases or decreases in each property’s operating income.
(2) The loan-to-value calculation is defined as the sum of the senior and all subordinate loan amounts divided by the value of the property. The weighted average LTV ratios in this table are based on the ratios at the time the loans were originated and are not based on subsequent time periods during which there may have been increases or decreases in each property’s value.
(3) Does not include one commercial loan acquired in 2005.
| Property Type(1) |
Geography(1) | |
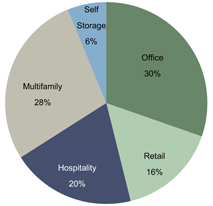
|
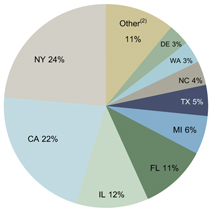
| |
| (1) Percentages based on outstanding loan balances. |
(1) Percentages based on outstanding loan balances. | |
|
(2) Other includes TN, NJ, KY, PA, SC, MS, MN, MA, GA, each with 3.2% or less. |
| 30 | THE REDWOOD REVIEW | 3RD QUARTER 2012 |
|
|

| |
|
INVESTMENTS IN CONSOLIDATED ENTITIES
|
Summary
Prior to 2012 we sponsored Sequoia securitization entities, and prior to 2008 we sponsored Acacia securitization entities, that acquired mortgage loans and securities, created and issued ABS backed by these loans and securities, and the securitizations were accounted for under GAAP as secured borrowings resulting in those entities being consolidated on our financial statements. Starting in 2012, we began to use sale accounting for our Sequoia Securitizations and as a result, we do not consolidate securitizations that are accounted for as a sale of assets. The change in accounting treatment was made to better reflect the economics of our securitizations by matching the expenses with the revenues. As a result, we expect our investment in consolidated entities to decline over time.
Quarterly Update
| u | In the third quarter of 2012, combined net income from Consolidated Entities totaled $3 million, as compared to $4 million in the second quarter of 2012. This decrease in net income reflects a combination of a decline in total interest income as the consolidated securitizations pay down, and a $1 million loan-loss provision expense in the third quarter of 2012 compared to a recovery of $2 million in the prior quarter. |
| u | At September 30, 2012, the loan-loss allowance for consolidated Sequoia securitizations totaled $54 million, or 1.74% of $3.1 billion of outstanding loans. Serious delinquencies (90+ days delinquent) totaled $115 million at September 30, 2012, compared to $116 million at June 30, 2012. Net charge-offs in the third quarter amounted to $3 million, or 0.08% of outstanding loans, compared to $2 million in the second quarter, or 0.06% of outstanding loans. |
| u | At September 30, 2012, consolidated Sequoia assets totaled $3.1 billion and Acacia assets totaled $0.3 billion. Our $84 million investment in Consolidated Entities was almost entirely attributable to Sequoia. |
| u | The consolidation of the assets and liabilities of securitization entities may lead to potentially volatile reported earnings for a variety of reasons, including the amortization of premiums on the loans and liabilities of Sequoia entities, changes in credit loss provisions for loans held by Sequoia entities, fair value adjustments for the assets and liabilities of the Acacia entities, and deconsolidation events. |
| THE REDWOOD REVIEW | 3RD QUARTER 2012 | 31 |
This Page Intentionally Left Blank
| 32 |


|
| |
|
ACCOUNTING DISCUSSION
|
Mark-to-Market Valuation Process
| u | Market values reflect an “exit price,” or the amount we believe we would realize if we sold an asset or would pay if we repurchased a liability in an orderly transaction, even though we generally have no intention — nor would we be required — to sell assets or repurchase liabilities. Establishing market values is inherently subjective and requires us to make a number of assumptions, including the future of interest rates, prepayment rates, discount rates, credit loss rates, and the timing of credit losses. The assumptions we apply are specific to each asset or liability. |
| u | We rely on our internal calculations to compute the fair value of our securities and we request and consider indications of value (marks) from third-party dealers to assist us in our mark-to-market valuation process. For September 30, 2012, we received dealer marks on 56% of our securities and 55% of our ABS issued. In the aggregate, our internal valuations of the securities on which we received dealer marks were 1% lower than the aggregate dealer marks, and our internal valuations of our ABS issued on which we received dealer marks were 8% higher (i.e., more conservative) than the aggregate dealer marks. |
Determining Other-Than-Temporary Impairments
| u | The multi-step process for determining whether an investment security has other-than-temporary impairment is presented below. |
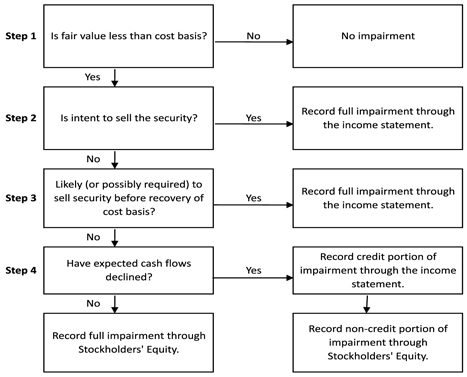
| 34 | THE REDWOOD REVIEW | 3RD QUARTER 2012 |
|
|

| |
|
GLOSSARY
|
ACACIA
Acacia is the brand name for the collateralized debt obligation (“CDO”) securitizations Redwood sponsored.
ADJUSTABLE-RATE MORTGAGES (ARM)
Adjustable-rate mortgages (“ARMs”) are loans that have coupons that adjust at least once per year. We make a distinction between ARMs (loans with a rate adjustment at least annually) and hybrids (loans that have a fixed-rate period of 2-10 years and then become adjustable-rate).
AGENCY
Agency refers to government-sponsored enterprises (“GSEs”), including Federal National Mortgage Association (“Fannie Mae”), Federal Home Loan Mortgage Corporation (“Freddie Mac”), and Government National Mortgage Association (“Ginnie Mae”).
ALT-A SECURITIES and ALT-A LOANS
Alt-A securities are residential mortgage-backed securities backed by loans that have higher credit quality than subprime and lower credit quality than prime. Alt-A originally represented loans with alternative documentation, but the definition has shifted over time to include loans with additional risk characteristics and in some cases investor loans. In an Alt-A loan, the borrower’s income may not be verified, and in some cases, may not be disclosed on the loan application. Alt-A loans may also have expanded criteria that allow for higher debt-to-income ratios with higher accompanying loan-to-value ratios than would otherwise be permissible for prime loans.
AMORTIZED COST
Amortized cost is the initial acquisition cost of an available-for-sale (“AFS”) security, minus principal repayments or principal reductions through credit losses, plus or minus premium or discount amortization. At the point in time an AFS security is deemed other-than-temporarily impaired, the amortized cost is adjusted (by changing the amount of unamortized premium or discount) by the amount of other-than temporary impairment taken through the income statement.
ASSET-BACKED SECURITIES (ABS)
Asset-backed securities (“ABS”) are securities backed by financial assets that generate cash flows. Each ABS issued from a securitization entity has a unique priority with respect to receiving principal and interest cash flows and absorbing any credit losses from the assets owned by the entity.
AVAILABLE-FOR-SALE (AFS)
An accounting method for debt and equity securities in which the securities are reported at their fair value. Positive changes in the fair value are accounted for as increases to stockholders’ equity and do not flow through the income statement. Negative changes in fair value may be recognized through the income statement or balance sheet, as further detailed in the Accounting Discussion section.
B-NOTES
B-Notes are subordinate interests in commercial mortgage debt which are either (i) evidenced by a subordinated promissory note secured by the same mortgage that also secures the senior debt relating to the same property or (ii) junior participation interests in mortgage debt that are subordinate to senior participation interests in the same mortgage debt. B-Notes typically provide the holder with certain rights to approve modifications to related lending agreements and to trigger foreclosure under the mortgage following an event of default. B-Notes also typically provide the holder certain limited rights to cure a borrower default under senior debt secured by the same mortgage in order to keep the senior debt current and avoid foreclosure.
| THE REDWOOD REVIEW | 3RD QUARTER 2012 | 35 |
|
|
| |
|
GLOSSARY
|
BOOK VALUE (GAAP)
Book value is the value of our common equity in accordance with GAAP.
COLLATERALIZED DEBT OBLIGATION (CDO) SECURITIZATIONS
The securitization of a diverse pool of assets.
COMMERCIAL MORTGAGE-BACKED SECURITIES (CMBS)
A type of mortgage-backed security that is secured by one or more loans on commercial properties.
CONSTANT (or CONDITIONAL) PREPAYMENT RATE (CPR)
Constant (or conditional) prepayment rate (“CPR”) is an industry-standard measure of the speed at which mortgage loans prepay. It approximates the annual percentage rate at which a pool of loans is paying down due to unscheduled principal prepayments.
CORE EQUITY
Core equity is not a measure calculated in accordance with GAAP. GAAP equity includes mark-to-market adjustments for some of our assets and interest rate agreements in “accumulated other comprehensive income (loss).” Core equity excludes accumulated other comprehensive income (loss). Core equity in some ways approximates what our equity value would be if we used historical amortized cost accounting exclusively. A reconciliation of core equity to GAAP appears in the Table 3 in the Financial Tables in this Review.
CREDIT SUPPORT
Credit support is the face amount of securities subordinate (or junior) to the applicable security that protects the security from credit losses and is generally expressed as a percentage of the securitization’s underlying pool balance.
DEBT
Debt is an obligation of Redwood. See Long-term debt and Short-term debt.
ECONOMIC VALUE (MANAGEMENT’S ESTIMATE OF ECONOMIC VALUE)
Economic value closely relates to liquidation value and is calculated using the bid-side marks (or estimated bid-side values) for all of our financial assets, and offered-side marks (or estimated offered-side values) for all of our financial liabilities. We calculate management’s estimate of economic value as a supplemental measure to book value calculated under GAAP. Our economic value estimates on a per-share basis are reconciled to GAAP book values per share in Table 3 in the Financial Tables of this Review.
FASB
Financial Accounting Standards Board.
FHFA
The FHFA refers to the Federal Housing Finance Authority.
GAAP
Generally Accepted Accounting Principles in the United States.
| 36 | THE REDWOOD REVIEW | 3RD QUARTER 2012 |
|
|
| |
|
GLOSSARY
|
GOVERNMENT SPONSORED ENTERPRISE (GSE)
A government sponsored enterprise is a financial services corporation created by the United States Congress to enhance the flow of credit to targeted sectors of the economy. Among the GSEs charted by Congress are Fannie Mae, Freddie Mac, and Ginnie Mae.
INTEREST-ONLY SECURITIES (IOs)
Interest-only securities (“IOs”) are specialized securities created by securitization entities where the projected cash flows generated by the underlying assets exceed the cash flows projected to be paid to the securities that are issued with principal balances. Typically, IOs do not have a principal balance and they will not receive principal payments. Interest payments to IOs usually equal an interest rate formula multiplied by a “notional” principal balance. The notional principal balances for IOs are typically reduced over time as the actual principal balance of the underlying pool of assets pays down, thus reducing the cash flows to the IOs over time. Cash flows on IOs are typically reduced more quickly when asset prepayments increase.
INVESTMENT CAPACITY
The amount of capacity we estimate that we have to invest in new assets. Our estimate of our investment capacity takes into account, among other things, cash on hand, cash we estimate we could raise by prudently increasing short-term borrowings, and cash needed to cover short-term operations, working capital, and a liquidity cushion.
JUMBO LOAN
A jumbo loan is a mortgage loan that generally conforms to the underwriting standards of Fannie Mae and Freddie Mac except that the dollar amount of the loan exceeds the maximum limit set by the two GSEs for loans salable to the two companies.
LEVERAGE RATIOS
When determining Redwood’s financial leverage, traditional leverage ratios may be misleading in some respects if consolidated ABS issued from securitization entities are included as part of Redwood’s obligations when calculating this or similar ratios. Because of the requirement to consolidate the independent securitization entities for GAAP accounting purposes, it appears that Redwood is highly leveraged, with total consolidated liabilities significantly greater than equity. The obligations of these securitization entities are not obligations of Redwood.
LONG-TERM DEBT
Long-term debt is debt that is an obligation of Redwood that is not payable within a year and includes junior subordinated notes and trust preferred securities. We generally treat long-term debt as part of our capital base when it is not payable in the near future.
MARK-TO-MARKET (MTM) ACCOUNTING
Mark-to-market (“MTM”) accounting uses estimated fair values of assets, liabilities, and hedges. Many assets on our consolidated balance sheet are carried at their fair value rather than amortized cost. Taxable income is generally not affected by market valuation adjustments.
MARKET VALUATION ADJUSTMENTS (MVAs)
Market valuation adjustments (“MVAs”) are changes in market values for certain assets and liabilities that are reported through our GAAP income statement. They include all changes in market values for assets and liabilities accounted for at fair value, such as trading securities and derivatives. They also include the credit portion of other-than-temporary impairments on securities available-for-sale, as well as impairments of loans held-for-sale and REO properties.
| THE REDWOOD REVIEW | 3RD QUARTER 2012 | 37 |
|
|
| |
|
GLOSSARY
|
MEZZANINE LOAN
A mezzanine loan is a loan secured by the membership interests, partnership interests, and/or stock in a single purpose entity formed to own a commercial property, for example. If the mezzanine borrower fails to make its payments or otherwise defaults under the mezzanine loan documents, the mezzanine lender may pursue its remedies, including taking control of the single purpose entity that owns the property.
MORTGAGE SERVICING RIGHT (MSR)
A mortgage servicing right (“MSR”) gives the holder the contractual right to service a mortgage loan. MSRs typically include the right to collect monthly mortgage principal and interest payments, as well as related tax and insurance payments, from borrowers, disburse funds to the mortgage debt holders and remit related insurance and tax payments, collect late payments, and process modifications and foreclosures. MSRs are created when mortgage loans are sold in a transaction in which the seller retains the right to service the loans. The holder of an MSR receives a monthly servicing fee (which generally ranges from 0.25% to 0.375% per annum of the outstanding principal balance of the related mortgage loan), which is deducted from the borrower’s monthly interest payments. For accounting purposes, MSRs are capitalized at the net present value of the servicing fee less the servicing cost. When Redwood holds MSRs relating to residential mortgage loans, it retains a sub-servicer to carry out actual servicing functions, as Redwood does not directly service residential mortgage loans.
NON-GAAP METRICS
Not all companies and analysts calculate non-GAAP metrics in the same manner. As a result, certain metrics as calculated by Redwood may not be comparable to similarly titled metrics reported by other companies. Redwood uses non-GAAP metrics such as management’s estimate of economic value and core equity to provide greater transparency for investors. Our non-GAAP metrics are reconciled to GAAP in the Financial Tables in this Review.
NON-PRIME SECURITIES
Non-prime securities are Alt-A, option ARM, and subprime securities. See definitions of Alt-A, option ARM, and subprime securities.
OPTION ARM LOAN
An option ARM loan is a residential mortgage loan that generally offers a borrower monthly payment options such as: 1) a minimum payment that results in negative amortization; 2) an interest-only payment; 3) a payment that would fully amortize the loan over an original 31-year amortization schedule; and, 4) a payment that would fully amortize the loan over a 15-year amortization schedule. To the extent the borrower has chosen an option that is not fully amortizing the loan (or negatively amortizing the loan), after a period — usually five years or once the negatively amortized loan balance reaches a certain level (generally 15% to 25% higher than the original balance) — the loan payments are recast. This recast provision resets the payment at a level that fully amortizes the loan over its remaining life and the new payment may be materially different than under the borrowers’ previous option.
PREFERRED EQUITY
A preferred equity investment is an investment in preferred equity of a special purpose entity that directly or indirectly owns a commercial property. An investor in preferred equity is typically entitled to a preferred return (relative to a holder of common equity of the same entity) and has the right, if the preferred return is not paid, to take control of the entity (and thereby control the underlying commercial property).
| 38 | THE REDWOOD REVIEW | 3RD QUARTER 2012 |
|
|
| |
|
GLOSSARY
|
PRIME RESIDENTIAL REAL ESTATE LOANS
Prime loans are residential loans with higher quality credit characteristics, such as borrowers with higher FICO credit scores, lower loan-to-value ratios, lower debt-to-income ratios, greater levels of other assets, and more documentation.
PRIME SECURITIES
Prime securities are residential mortgage-backed securities backed by prime loans, generally with balances greater than conforming loan limits. Prime securities are typically backed by loans that have relatively high weighted average FICO scores (700 or higher), low weighted average LTVs (75% or less), limited concentrations of investor properties, and low percentages of loans with low FICO scores or high loan-to-value ratios.
PROFITABILITY RATIOS
Many financial institution analysts use asset-based profitability ratios such as interest rate spread and interest rate margin when analyzing financial institutions. These are asset-based measures. Since we consolidate the assets and liabilities of securitization entities for GAAP purposes, our total GAAP assets and liabilities may vary over time, and may not be comparable to assets typically used in profitability calculations for other financial institutions. As a result, we believe equity-based profitability ratios may be more appropriate than asset-based measures for analyzing Redwood’s operations and results. We believe, for example, that net interest income as a percentage of equity is a useful measure of profitability. For operating expenses, we believe useful measures are operating efficiency ratio (operating expenses as a percentage of net interest income) and operating expenses as a percentage of equity. We provide various profitability ratios in Table 4 in the Financial Tables in this Review.
REAL ESTATE INVESTMENT TRUST (REIT)
A real estate investment trust (“REIT”) is an entity that makes a tax election to be taxed as a REIT, invests in real estate assets, and meets other REIT qualifications, including the distribution as dividends of at least 90% of REIT taxable income. A REIT’s profits are not taxed at the corporate level to the extent that these profits are distributed as dividends to stockholders, providing an operating cost savings. On the other hand, the requirement to pay out as dividends most of the REIT’s taxable profits means it can be harder for a REIT to grow using only internally-generated funds (as opposed to raising new capital).
REAL ESTATE OWNED (REO)
Real estate owned (“REO”) refers to real property owned by the lender or loan owner that has been acquired through foreclosure.
REIT SUBSIDIARY
A REIT subsidiary is a subsidiary of a REIT that is taxed as a REIT.
REIT TAXABLE INCOME
REIT taxable income is not a measure calculated in accordance with GAAP. REIT taxable income is pretax income calculated for tax purposes at Redwood including only its qualifying REIT subsidiaries (i.e., excluding its taxable subsidiaries). REIT taxable income is an important measure as it is the basis of our dividend distribution requirements. We must distribute at least 90% of REIT taxable income as dividends to shareholders over time. As a REIT, we are not subject to corporate income taxes on the REIT taxable income we distribute. We pay income tax on the REIT taxable income we retain, if any (and we are permitted to retain up to 10% of total REIT taxable income). A reconciliation of REIT taxable income to GAAP income appears in Table 2 in the Financial Tables in this Review.
| THE REDWOOD REVIEW | 3RD QUARTER 2012 | 39 |
|
|
| |
|
GLOSSARY
|
REMIC
A real estate mortgage investment conduit (“REMIC”) is a special purpose vehicle used to pool real estate mortgages and issue mortgage-backed securities. REMICs are typically exempt from tax at the entity level. REMICs may invest only in qualified mortgages and permitted investments, including single family or multifamily mortgages, commercial mortgages, second mortgages, mortgage participations, and federal agency pass-through securities.
RE-REMIC SECURITY
A re-REMIC is a re-securitization of asset-backed securities. The cash flows from and any credit losses absorbed by the underlying assets can be redirected to the resulting re-REMIC securities in a variety of ways.
RESECURITIZATION
A resecuritization is a securitization of two or more mortgage-backed securities into a new mortgage-backed security.
RESIDENTIAL MORTGAGE-BACKED SECURITIES (RMBS)
A type of mortgage-backed security that is backed by a pool of mortgages on residential properties.
RETURN ON EQUITY (ROE) and ADJUSTED RETURN ON EQUITY
ROE is the amount of profit we generate each year per dollar of equity capital and equals GAAP income divided by GAAP equity. Adjusted ROE is not a measure calculated in accordance with GAAP — it is GAAP income divided by core equity.
SENIOR SECURITIES
Generally, senior securities have the least credit risk in a securitization transaction because they are generally the last securities to absorb credit losses. In addition, the senior securities have the highest claim on the principal and interest payments (after the fees to servicers and trustees are paid.) To further reduce credit risk, most if not all, principal collected from the underlying asset pool is used to pay down the senior securities until certain performance tests are satisfied. If certain performance tests are satisfied, principal payments are shared between the senior securities and the subordinate securities, generally on a pro rata basis. At issuance, senior securities are generally triple A-rated.
SEQUOIA
Sequoia is the brand name for securitizations of residential real estate loans Redwood sponsors. Sequoia entities are independent securitization entities that acquire residential mortgage loans and create and issue asset-backed securities (“ABS”) backed by these loans. Most of the loans that Sequoia entities acquire are prime-quality loans. Most of the senior ABS created by Sequoia are sold to third-party investors. Redwood usually acquires most of the subordinated ABS and occasionally acquires the interest-only securities (“IOs”).
SHORT-TERM DEBT
Short-term debt is debt that is an obligation of Redwood and payable within a year. We may obtain this debt from a variety of Wall Street firms, banks, and other institutions. In the past, as another form of short term debt, we have issued collateralized commercial paper. We may issue these or other forms of short term debt in the future. We may use short-term debt to finance the accumulation of assets prior to sale to a securitization entity and to finance investments in loans and securities.
| 40 | THE REDWOOD REVIEW | 3RD QUARTER 2012 |
|
|
| |
|
GLOSSARY
|
SUBORDINATE DEBT INVESTMENTS
Subordinate Debt Investments mean Mezzanine Loans, Preferred Equity, and B-Notes.
SUBORDINATE SECURITIES (JUNIOR SECURITIES or NON-SENIOR SECURITIES)
Subordinate securities absorb the initial credit losses from a securitization structure, thus protecting the senior securities. Subordinate securities have a lower priority to receive principal and interest payments than the senior securities. Subordinate securities receive little, if any, principal payments until certain performance tests are satisfied. If certain performance tests are satisfied, principal payments are shared between the senior securities and the subordinate securities, generally on a pro rata basis. Subordinate securities generally receive interest payments even if they do not receive principal payments. At issuance, subordinate securities are generally rated double-A or below.
SUBPRIME SECURITIES
Subprime securities are residential mortgage-backed securities backed by loans to borrowers who typically have lower credit scores and/or other credit deficiencies that prevent them from qualifying for prime or Alt-A mortgages and may have experienced credit problems in the past, such as late payments or bankruptcies. To compensate for the greater risks and higher costs to service the loans, subprime borrowers pay higher interest rates, points, and origination fees.
TAXABLE INCOME
Taxable income is not a measure calculated in accordance with GAAP. Taxable income is pre-tax income for Redwood and all its subsidiaries as calculated for tax purposes. Taxable income calculations differ significantly from GAAP income calculations. A reconciliation of taxable income to GAAP income appears in Table 2 in the Financial Tables in this Review.
TAXABLE SUBSIDIARY
A taxable subsidiary is a subsidiary of a REIT that is not taxed as a REIT and thus pays taxes on its income. A taxable subsidiary is not limited to investing in real estate and it can choose to retain all of its after-tax profits.
| THE REDWOOD REVIEW | 3RD QUARTER 2012 | 41 |


|
Table 1: GAAP Earnings ($ in thousands, except per share data) | |||
| 2012 Q3 |
2012 Q2 |
2012 Q1 |
2011 Q4 |
2011 Q3 |
2011 Q2 |
2011 Q1 |
2010 Q4 |
2010 Q3 |
Nine Months 2012 |
Nine Months 2011 |
||||||||||||||||||||||||||||||||||
| Interest income |
$ | 54,001 | $ | 52,630 | $ | 51,355 | $ | 48,512 | $ | 45,096 | $ | 44,126 | $ | 44,025 | $ | 44,956 | $ | 49,249 | $ | 157,986 | $ | 133,247 | ||||||||||||||||||||||
| Discount amortization on securities, net |
7,317 | 8,318 | 8,258 | 9,339 | 10,179 | 10,513 | 12,104 | 12,671 | 10,991 | 23,893 | 32,796 | |||||||||||||||||||||||||||||||||
| Other investment interest income |
- | - | - | - | - | - | - | - | 2 | - | - | |||||||||||||||||||||||||||||||||
| Premium amortization expense on loans |
(1,595 | ) | (1,424 | ) | (872 | ) | (1,356 | ) | (1,879 | ) | (1,684 | ) | (1,796 | ) | (1,874 | ) | (1,227 | ) | (3,891 | ) | (5,359 | ) | ||||||||||||||||||||||
| Total interest income |
59,723 | 59,524 | 58,741 | 56,495 | 53,396 | 52,955 | 54,333 | 55,753 | 59,015 | 177,988 | 160,684 | |||||||||||||||||||||||||||||||||
| Interest expense on short-term debt |
(2,737 | ) | (2,299 | ) | (1,827 | ) | (764 | ) | (78 | ) | (7 | ) | (182 | ) | (43 | ) | (2 | ) | (6,863 | ) | (267 | ) | ||||||||||||||||||||||
| Interest expense on ABS |
(21,379 | ) | (22,351 | ) | (24,564 | ) | (24,030 | ) | (19,907 | ) | (19,509 | ) | (17,823 | ) | (17,800 | ) | (19,582 | ) | (68,294 | ) | (57,239 | ) | ||||||||||||||||||||||
| ABS issuance expense amortization |
(552 | ) | (602 | ) | (569 | ) | (630 | ) | (545 | ) | (568 | ) | (559 | ) | (370 | ) | (575 | ) | (1,723 | ) | (1,672 | ) | ||||||||||||||||||||||
| ABS interest rate agreement expense |
(1,127 | ) | (1,136 | ) | (1,204 | ) | (1,171 | ) | (1,233 | ) | (1,252 | ) | (1,134 | ) | (1,189 | ) | (1,104 | ) | (3,467 | ) | (3,619 | ) | ||||||||||||||||||||||
| ABS issuance premium amortization (expense) income |
(113 | ) | (115 | ) | (115 | ) | (136 | ) | (170 | ) | 78 | 96 | 168 | 187 | (343 | ) | 4 | |||||||||||||||||||||||||||
| Total ABS expense consolidated from trusts |
(23,171 | ) | (24,204 | ) | (26,452 | ) | (25,967 | ) | (21,855 | ) | (21,251 | ) | (19,420 | ) | (19,191 | ) | (21,074 | ) | (73,827 | ) | (62,526 | ) | ||||||||||||||||||||||
| Interest expense on long-term debt |
(2,377 | ) | (2,379 | ) | (2,376 | ) | (2,384 | ) | (2,384 | ) | (2,375 | ) | (2,371 | ) | (2,390 | ) | (2,619 | ) | (7,132 | ) | (7,130 | ) | ||||||||||||||||||||||
| Net interest income |
31,438 | 30,642 | 28,086 | 27,380 | 29,079 | 29,322 | 32,360 | 34,129 | 35,320 | 90,166 | 90,761 | |||||||||||||||||||||||||||||||||
| (Provision for) reversal of provision for loan losses |
(1,319 | ) | 1,340 | (275 | ) | (7,784 | ) | (3,978 | ) | (1,581 | ) | (2,808 | ) | (7,902 | ) | (2,436 | ) | (254 | ) | (8,367 | ) | |||||||||||||||||||||||
| Other market valuation adjustments, net |
(3,470 | ) | (5,465 | ) | (568 | ) | (9,682 | ) | (13,448 | ) | (11,147 | ) | (5,740 | ) | 380 | (1,573 | ) | (9,503 | ) | (30,335 | ) | |||||||||||||||||||||||
| Net interest income after provision and other market valuation adjustments |
26,649 | 26,517 | 27,243 | 9,914 | 11,653 | 16,594 | 23,812 | 26,607 | 31,311 | 80,409 | 52,059 | |||||||||||||||||||||||||||||||||
| Mortgage banking activities, net |
16,730 | 1,771 | 4,242 | - | - | - | - | - | - | 22,743 | - | |||||||||||||||||||||||||||||||||
| Fixed compensation expense |
(4,412 | ) | (4,373 | ) | (5,035 | ) | (3,799 | ) | (3,702 | ) | (3,797 | ) | (4,144 | ) | (3,402 | ) | (3,314 | ) | (13,820 | ) | (11,643 | ) | ||||||||||||||||||||||
| Variable compensation expense |
(5,593 | ) | (3,024 | ) | (2,594 | ) | (721 | ) | (863 | ) | (646 | ) | (600 | ) | (2,152 | ) | (2,206 | ) | (11,211 | ) | (2,109 | ) | ||||||||||||||||||||||
| Equity compensation expense |
(2,151 | ) | (2,958 | ) | (2,176 | ) | (2,371 | ) | (1,929 | ) | (2,707 | ) | (2,060 | ) | (1,710 | ) | (1,507 | ) | (7,285 | ) | (6,696 | ) | ||||||||||||||||||||||
| Other operating expense |
(4,946 | ) | (4,809 | ) | (4,829 | ) | (5,683 | ) | (5,013 | ) | (4,937 | ) | (4,709 | ) | (5,673 | ) | (5,218 | ) | (14,584 | ) | (14,659 | ) | ||||||||||||||||||||||
| Total operating expenses |
(17,102 | ) | (15,164 | ) | (14,634 | ) | (12,574 | ) | (11,507 | ) | (12,087 | ) | (11,513 | ) | (12,937 | ) | (12,245 | ) | (46,900 | ) | (35,107 | ) | ||||||||||||||||||||||
| Realized gains on sales, net |
13,940 | 6,995 | 13,507 | - | 313 | 5,433 | 3,956 | 786 | 72 | 34,442 | 9,702 | |||||||||||||||||||||||||||||||||
| Realized gains (losses) on calls, net |
- | - | 113 | 102 | 832 | 401 | (91 | ) | 726 | 1,494 | 113 | 1,142 | ||||||||||||||||||||||||||||||||
| Realized gains, net |
13,940 | 6,995 | 13,620 | 102 | 1,145 | 5,834 | 3,865 | 1,512 | 1,566 | 34,555 | 10,844 | |||||||||||||||||||||||||||||||||
| Noncontrolling interest |
- | - | - | - | 20 | (888 | ) | 2,015 | (447 | ) | (532 | ) | - | 1,147 | ||||||||||||||||||||||||||||||
| Provision for income taxes |
(516 | ) | (592 | ) | (8 | ) | - | (14 | ) | (14 | ) | (14 | ) | (26 | ) | (202 | ) | (1,116 | ) | (42 | ) | |||||||||||||||||||||||
| Net income (loss) |
$ | 39,701 | $ | 19,527 | $ | 30,463 | $ | (2,558 | ) | $ | 1,297 | $ | 9,439 | $ | 18,165 | $ | 14,709 | $ | 19,898 | $ | 89,691 | $ | 28,901 | |||||||||||||||||||||
| Diluted average shares |
80,764 | 78,815 | 79,892 | 78,370 | 78,471 | 79,478 | 79,372 | 78,944 | 78,961 | 80,176 | 78,276 | |||||||||||||||||||||||||||||||||
| Net income (loss) per share |
$ | 0.48 | $ | 0.24 | $ | 0.37 | $ | (0.03 | ) | $ | 0.01 | $ | 0.11 | $ | 0.22 | $ | 0.18 | $ | 0.25 | $ | 1.09 | $ | 0.35 | |||||||||||||||||||||
| THE REDWOOD REVIEW 3RD QUARTER 2012
|
Table 1: GAAP Earnings |
43
| ||
|
|
Table 2: Taxable and GAAP (Loss) Income (1) Differences and Dividends ($ in thousands, except per share data) | 44 | ||
| Estimated Nine Months 2012 (2) | Actual Twelve Months 2011 | Actual Twelve Months 2010 | ||||||||||||||||||||||||||||||||||
| Taxable Income |
GAAP Income |
Differences | Taxable Income |
GAAP Income |
Differences | Taxable (Loss) Income |
GAAP Income |
Differences | ||||||||||||||||||||||||||||
| Taxable and GAAP Income (Loss) Differences |
||||||||||||||||||||||||||||||||||||
| Interest income |
$ | 122,973 | $ | 177,988 | $ | (55,015 | ) | $ | 128,334 | $ | 217,179 | $ | (88,845 | ) | $ | 136,750 | $ | 230,054 | $ | (93,304 | ) | |||||||||||||||
| Interest expense |
(18,072 | ) | (87,822 | ) | 69,750 | (15,804 | ) | (99,037 | ) | 83,233 | (8,545 | ) | (84,664 | ) | 76,119 | |||||||||||||||||||||
| Net interest income |
104,901 | 90,166 | 14,735 | 112,530 | 118,142 | (5,612 | ) | 128,205 | 145,390 | (17,185 | ) | |||||||||||||||||||||||||
| Provision for loan losses |
- | (254 | ) | 254 | - | (16,151 | ) | 16,151 | - | (24,135 | ) | 24,135 | ||||||||||||||||||||||||
| Realized credit losses |
(21,408 | ) | - | (21,408 | ) | (57,526 | ) | - | (57,526 | ) | (99,586 | ) | - | (99,586 | ) | |||||||||||||||||||||
| Other market valuation adjustments, net |
- | (9,503 | ) | 9,503 | - | (40,017 | ) | 40,017 | - | (19,554 | ) | 19,554 | ||||||||||||||||||||||||
| Mortgage banking activities, net |
(470 | ) | 22,743 | (23,213 | ) | - | - | - | - | - | - | |||||||||||||||||||||||||
| Operating expenses |
(40,553 | ) | (46,900 | ) | 6,347 | (45,166 | ) | (47,682 | ) | 2,516 | (44,804 | ) | (53,715 | ) | 8,911 | |||||||||||||||||||||
| Realized gains, net |
- | 34,555 | (34,555 | ) | - | 10,946 | (10,946 | ) | 230 | 63,496 | (63,266 | ) | ||||||||||||||||||||||||
| Provision for income taxes |
(14 | ) | (1,116 | ) | 1,102 | (16 | ) | (42 | ) | 26 | (8 | ) | (280 | ) | 272 | |||||||||||||||||||||
| Less: Net (loss) income attributable to noncontrolling interest
|
- | - | - | - | (1,147 | ) | 1,147 | - | 1,150 | (1,150 | ) | |||||||||||||||||||||||||
| Income (Loss) |
$ | 42,456 | $ | 89,691 | $ | (47,235 | ) | $ | 9,822 | $ | 26,343 | $ | (16,521 | ) | $ | (15,963 | ) | $ | 110,052 | $ | (126,015 | ) | ||||||||||||||
| REIT taxable income |
$ | 43,247 | $ | 19,543 | $ | 3,383 | ||||||||||||||||||||||||||||||
| Taxable loss at taxable subsidiaries |
(791 | ) | (9,721 | ) | (19,346 | ) | ||||||||||||||||||||||||||||||
| Taxable income (loss) |
$ | 42,456 | $ | 9,822 | $ | (15,963 | ) | |||||||||||||||||||||||||||||
| Shares used for taxable EPS calculation |
81,526 | 78,556 | 78,041 | |||||||||||||||||||||||||||||||||
| REIT taxable income per share (3) |
$ | 0.54 | $ | 0.24 | $ | 0.05 | ||||||||||||||||||||||||||||||
| Taxable loss income at taxable subsidiaries per share |
$ | (0.01 | ) | $ | (0.12 | ) | $ | (0.25 | ) | |||||||||||||||||||||||||||
| Taxable income (loss) per share (3) |
$ | 0.53 | $ | 0.12 | $ | (0.20 | ) | |||||||||||||||||||||||||||||
| Dividends |
||||||||||||||||||||||||||||||||||||
| Dividends declared |
$ | 59,743 | $ | 78,382 | $ | 77,942 | ||||||||||||||||||||||||||||||
| Regular dividend per share (4)
|
$ | 0.75 | $ | 1.00 | $ | 1.00 | ||||||||||||||||||||||||||||||
(1) Taxable income (loss) for 2012 is an estimate until we file our tax returns.
(2) Reconciliation of GAAP income to taxable income (loss) for prior quarters is provided in the respective Redwood Reviews for those quarters.
(3) REIT taxable income (loss) per share and taxable income (loss) per share are based on the number of shares outstanding at the end of each quarter. The annual REIT taxable income (loss) per share and taxable income (loss) per share are the sum of the four quarterly per share estimates.
(4) The characteristics of our 2012 dividend will be determined after the completion of our 2012 tax year. To the extent the REIT has taxable income or net capital gains in 2012, these amounts will be characterized as ordinary income. Dividends in 2011 were characterized as 25% ordinary income, or $19 million, and 75% return of capital, or $59 million. The 2010 dividends were characterized as 62% ordinary income, or $48 million, and 38% return of capital, or $30 million. The portion of Redwood’s dividends characterized as a return of capital are not taxable to a shareholder and reduces a shareholder’s basis for shares held at each quarterly distribution date.
| THE REDWOOD REVIEW 3RD QUARTER 2012
|
Table 2: Taxable and GAAP (Loss) Income Differences and Dividends | |||
|
|
Table 3: Book Value and Financial Ratios ($ in millions, except per share data) | |||
| 2012 Q3 |
2012 Q2 |
2012 Q1 |
2011 Q4 |
2011 Q3 |
2011 Q2 |
2011 Q1 |
2010 Q4 |
2010 Q3 |
||||||||||||||||||||||||||||
| Short-term debt |
$ | 522 | $ | 455 | $ | 441 | $ | 428 | $ | - | $ | 41 | $ | - | $ | 44 | $ | - | ||||||||||||||||||
| Long-term debt |
140 | 140 | 140 | 140 | 140 | 140 | 140 | 140 | 140 | |||||||||||||||||||||||||||
| Redwood debt (1) |
$ | 662 | $ | 595 | $ | 581 | $ | 568 | $ | 140 | $ | 181 | $ | 140 | $ | 184 | $ | 140 | ||||||||||||||||||
| Redwood debt |
$ | 662 | $ | 595 | $ | 581 | $ | 568 | $ | 140 | $ | 181 | $ | 140 | $ | 184 | $ | 140 | ||||||||||||||||||
| ABS obligations of consolidated securitization entities and resecuritization |
3,429 | 3,564 | 3,704 | 4,139 | 4,293 | 3,839 | 3,957 | 3,943 | 3,832 | |||||||||||||||||||||||||||
| Consolidated GAAP Debt |
$ | 4,091 | $ | 4,159 | $ | 4,285 | $ | 4,707 | $ | 4,433 | $ | 4,020 | $ | 4,097 | $ | 4,127 | $ | 3,972 | ||||||||||||||||||
| GAAP stockholders’ equity |
$ | 1,050 | $ | 951 | $ | 962 | $ | 893 | $ | 959 | $ | 1,025 | $ | 1,075 | $ | 1,065 | $ | 1,016 | ||||||||||||||||||
| Redwood debt to equity |
0.6x | 0.6x | 0.6x | 0.6x | 0.1x | 0.2x | 0.1x | 0.2x | 0.1x | |||||||||||||||||||||||||||
| Redwood debt to (equity + debt) |
39% | 38% | 38% | 39% | 13% | 15% | 12% | 15% | 12% | |||||||||||||||||||||||||||
| Consolidated GAAP Debt to equity |
3.9x | 4.4x | 4.5x | 5.3x | 4.6x | 3.9x | 3.8x | 3.7x | 3.9x | |||||||||||||||||||||||||||
| Consolidated GAAP Debt to (equity + GAAP debt) |
80% | 81% | 82% | 84% | 82% | 80% | 79% | 79% | 80% | |||||||||||||||||||||||||||
| GAAP stockholders’ equity |
$ | 1,050 | $ | 951 | $ | 962 | $ | 893 | $ | 959 | $ | 1,025 | $ | 1,075 | $ | 1,065 | $ | 1,016 | ||||||||||||||||||
| Balance sheet mark-to-market adjustments |
45 | 24 | 12 | (13 | ) | 32 | 81 | 122 | 112 | 61 | ||||||||||||||||||||||||||
| Core equity (non-GAAP) |
$ | 1,005 | $ | 927 | $ | 950 | $ | 906 | $ | 927 | $ | 944 | $ | 953 | $ | 953 | $ | 955 | ||||||||||||||||||
| Shares outstanding at period end (in thousands) |
81,526 | 79,263 | 78,756 | 78,556 | 78,495 | 78,555 | 78,139 | 78,125 | 77,984 | |||||||||||||||||||||||||||
| GAAP equity per share |
$ | 12.88 | $ | 12.00 | $ | 12.22 | $ | 11.36 | $ | 12.22 | $ | 13.04 | $ | 13.76 | $ | 13.63 | $ | 13.02 | ||||||||||||||||||
| Adjustments: GAAP equity to estimated economic value (2) |
||||||||||||||||||||||||||||||||||||
| Investments in Consolidated Entities |
0.08 | 0.09 | 0.10 | 0.07 | 0.06 | (0.01 | ) | (0.06 | ) | (0.16 | ) | (0.28 | ) | |||||||||||||||||||||||
| Long-term debt |
0.72 | 0.85 | 0.93 | 1.06 | 1.06 | 0.78 | 0.75 | 0.84 | 0.99 | |||||||||||||||||||||||||||
| ABS issued - Resecuritization |
(0.06 | ) | (0.07 | ) | (0.07 | ) | (0.04 | ) | (0.01 | ) | - | - | - | - | ||||||||||||||||||||||
| Estimate of economic value per share (non-GAAP) | $ | 13.62 | $ | 12.87 | $ | 13.18 | $ | 12.45 | $ | 13.33 | $ | 13.81 | $ | 14.45 | $ | 14.31 | $ | 13.73 | ||||||||||||||||||
(1) Excludes obligations of consolidated securitization entities and the resecuritization we engaged in during the third quarter of 2011.
(2) Differences between GAAP and economic value per share reflect our estimate of the economic value of investments in Consolidated Entitie, our long-term debt, and ABS issued - Resecuritization. See pages 16 and 17 for an explanation of these adjustments. In reviewing the components of book value and economic value, there are a number of important factors and limitations to consider. Book value and economic value are calculated as of particular points in time based on our existing assets and liabilities and do not incorporate other factors that may have a significant impact on that value, most notably the impact of future business activities. As a result, these values do not necessarily represent an estimate of our net realizable value, liquidation value, or our market value as a whole. Amounts we ultimately realize from the disposition of assets or settlement of liabilities may vary significantly from these values. Because temporary changes in market conditions can substantially affect value, we do not believe that short-term fluctuations in the value of our assets and liabilities are necessarily representative of the effectiveness of our investment strategy or the long-term underlying value of our business. When quoted market prices or observable market data are not available to estimate fair value, we rely on unobservable inputs, which are generally more subjective and involve a high degree of management judgment and assumptions. These assumptions may have a significant effect on our estimates of value, and the use of different assumptions as well as changes in market conditions could have a material effect on our results of operations or financial condition.
| THE REDWOOD REVIEW 3RD QUARTER 2012
|
Table 3: Book Value and Financial Ratios |
45
| ||
|
|
Table 4: Yields and Profitability Ratios (1) ($ in thousands) | 46 | ||
| 2012 Q3 |
2012 Q2 |
2012 Q1 |
2011 Q4 |
2011 Q3 |
2011 Q2 |
2011 Q1 |
2010 Q4 |
2010 Q3 |
Nine Months |
Nine Months |
||||||||||||||||||||||||||||||||||
| Interest income |
$ | 59,723 | $ | 59,524 | $ | 58,741 | $ | 56,495 | $ | 53,396 | $ | 52,955 | $ | 54,333 | $ | 55,753 | $ | 59,015 | $ | 177,988 | $ | 160,684 | ||||||||||||||||||||||
| Average consolidated earning assets |
$ | 5,176,791 | $ | 5,144,382 | $ | 5,351,918 | $ | 5,419,721 | $ | 5,143,814 | $ | 5,080,343 | $ | 5,107,979 | $ | 4,980,935 | $ | 5,030,680 | $ | 5,224,191 | $ | 5,110,939 | ||||||||||||||||||||||
| Asset yield |
4.61% | 4.63% | 4.39% | 4.17% | 4.15% | 4.17% | 4.25% | 4.48% | 4.69% | 4.54% | 4.19% | |||||||||||||||||||||||||||||||||
| Interest expense |
$ | (28,285 | ) | $ | (28,882 | ) | $ | (30,655 | ) | $ | (29,115 | ) | $ | (24,317 | ) | $ | (23,633 | ) | $ | (21,973 | ) | $ | (21,624 | ) | $ | (23,695 | ) | $ | (87,822 | ) | $ | (69,923 | ) | |||||||||||
| Average consolidated interest-bearing liabilities |
$ | 4,167,694 | $ | 4,208,287 | $ | 4,424,247 | $ | 4,481,303 | $ | 4,105,088 | $ | 4,025,216 | $ | 3,977,010 | $ | 3,937,895 | $ | 4,016,680 | $ | 4,266,382 | $ | 4,036,241 | ||||||||||||||||||||||
| Cost of funds |
2.71% | 2.75% | 2.77% | 2.60% | 2.37% | 2.35% | 2.21% | 2.20% | 2.36% | 2.74% | 2.31% | |||||||||||||||||||||||||||||||||
| Asset yield |
4.61% | 4.63% | 4.39% | 4.17% | 4.15% | 4.17% | 4.25% | 4.48% | 4.69% | 4.54% | 4.19% | |||||||||||||||||||||||||||||||||
| Cost of funds |
(2.71% | ) | (2.75% | ) | (2.77% | ) | (2.60% | ) | (2.37% | ) | (2.35% | ) | (2.21% | ) | (2.20% | ) | (2.36% | ) | (2.74% | ) | (2.31% | ) | ||||||||||||||||||||||
| Interest rate spread |
1.90% | 1.88% | 1.62% | 1.57% | 1.78% | 1.82% | 2.04% | 2.28% | 2.33% | 1.80% | 1.88% | |||||||||||||||||||||||||||||||||
| Net interest income |
$ | 31,438 | $ | 30,642 | $ | 28,086 | $ | 27,380 | $ | 29,079 | $ | 29,322 | $ | 32,360 | $ | 34,129 | $ | 35,320 | $ | 90,166 | $ | 90,761 | ||||||||||||||||||||||
| Average consolidated earning assets |
$ | 5,176,791 | $ | 5,144,382 | $ | 5,351,918 | $ | 5,419,721 | $ | 5,143,814 | $ | 5,080,343 | $ | 5,107,979 | $ | 4,980,935 | $ | 5,030,680 | $ | 5,224,191 | $ | 5,110,939 | ||||||||||||||||||||||
| Net interest margin |
2.43% | 2.38% | 2.10% | 2.02% | 2.26% | 2.31% | 2.53% | 2.74% | 2.81% | 2.30% | 2.37% | |||||||||||||||||||||||||||||||||
| Net interest income |
$ | 31,438 | $ | 30,642 | $ | 28,086 | $ | 27,380 | $ | 29,079 | $ | 29,322 | $ | 32,360 | $ | 34,129 | $ | 35,320 | $ | 90,166 | $ | 90,761 | ||||||||||||||||||||||
| Net interest income / average core equity |
13.34% | 13.30% | 12.29% | 12.05% | 12.63% | 12.55% | 13.42% | 14.25% | 14.65% | 12.98% | 12.88% | |||||||||||||||||||||||||||||||||
| Operating expenses |
$ | (17,102 | ) | $ | (15,164 | ) | $ | (14,634 | ) | $ | (12,574 | ) | $ | (11,507 | ) | $ | (12,087 | ) | $ | (11,513 | ) | $ | (12,937 | ) | $ | (12,245 | ) | $ | (46,900 | ) | $ | (35,107 | ) | |||||||||||
| Average total assets |
$ | 5,371,679 | $ | 5,307,961 | $ | 5,505,797 | $ | 5,577,206 | $ | 5,303,614 | $ | 5,263,529 | $ | 5,310,376 | $ | 5,141,550 | $ | 5,161,498 | $ | 5,395,061 | $ | 5,292,577 | ||||||||||||||||||||||
| Average total equity |
$ | 987,692 | $ | 945,805 | $ | 926,138 | $ | 912,051 | $ | 976,676 | $ | 1,035,063 | $ | 1,092,580 | $ | 1,038,045 | $ | 1,003,372 | $ | 953,338 | $ | 1,034,348 | ||||||||||||||||||||||
| Operating expenses / net interest income |
54.40% | 49.49% | 52.10% | 45.92% | 39.57% | 41.22% | 35.58% | 37.91% | 34.67% | 52.02% | 38.68% | |||||||||||||||||||||||||||||||||
| Operating expenses / average total assets |
1.27% | 1.14% | 1.06% | 0.90% | 0.87% | 0.92% | 0.87% | 1.01% | 0.95% | 1.16% | 0.88% | |||||||||||||||||||||||||||||||||
| Operating expenses / average total equity |
6.93% | 6.41% | 6.32% | 5.51% | 4.71% | 4.67% | 4.21% | 4.99% | 4.88% | 6.56% | 4.53% | |||||||||||||||||||||||||||||||||
| GAAP net income (loss) |
$ | 39,701 | $ | 19,527 | $ | 30,463 | $ | (2,558 | ) | $ | 1,297 | $ | 9,439 | $ | 18,165 | $ | 14,709 | $ | 19,898 | $ | 89,691 | $ | 28,901 | |||||||||||||||||||||
| GAAP net income (loss) / average total assets |
2.96% | 1.47% | 2.21% | (0.18% | ) | 0.10% | 0.72% | 1.37% | 1.14% | 1.54% | 2.22% | 0.73% | ||||||||||||||||||||||||||||||||
| GAAP net income (loss) / average equity (GAAP ROE) |
16.08% | 8.26% | 13.16% | (1.12% | ) | 0.53% | 3.65% | 6.65% | 5.67% | 7.93% | 12.54% | 3.73% | ||||||||||||||||||||||||||||||||
| GAAP net income (loss) / average core equity (adjusted ROE) (2) |
16.84% | 8.47% | 13.33% | (1.13% | ) | 0.56% | 4.04% | 7.53% | 6.14% | 8.25% | 12.91% | 4.10% | ||||||||||||||||||||||||||||||||
| Average core equity (2) |
$ | 942,846 | $ | 921,663 | $ | 914,052 | $ | 908,915 | $ | 921,048 | $ | 934,205 | $ | 964,554 | $ | 958,194 | $ | 964,249 | $ | 926,248 | $ | 939,776 | ||||||||||||||||||||||
(1) All percentages in this table are shown on an annualized basis.
(2) Core equity is a non-GAAP metric and is equal to GAAP equity excluding accumulated other comprehensive income (loss).
| THE REDWOOD REVIEW 3RD QUARTER 2012
|
Table 4: Yields and Profitability Ratios | |||
|
|
Table 5: Average Balance Sheet ($ in thousands) | |||
| 2012 Q3 |
2012 Q2 |
2012 Q1 |
2011 Q4 |
2011 Q3 |
2011 Q2 |
2011 Q1 |
2010 Q4 |
2010 Q3 |
Nine Months 2012 |
Nine Months 2011 |
||||||||||||||||||||||||||||||||||
| Real estate assets at Redwood |
||||||||||||||||||||||||||||||||||||||||||||
| Commercial loans |
$ | 267,032 | $ | 199,440 | $ | 169,432 | $ | 123,367 | $ | 79,445 | $ | 59,545 | $ | 36,434 | $ | 14,095 | $ | 242 | $ | 212,169 | $ | 58,632 | ||||||||||||||||||||||
| Residential loans |
466,246 | 363,882 | 319,353 | 306,869 | 313,763 | 123,914 | 204,847 | 169,691 | 16,463 | 383,464 | 214,574 | |||||||||||||||||||||||||||||||||
| Senior residential securities |
||||||||||||||||||||||||||||||||||||||||||||
| Prime |
465,760 | 457,549 | 325,619 | 248,211 | 244,502 | 246,957 | 255,884 | 262,048 | 270,286 | 416,490 | 249,073 | |||||||||||||||||||||||||||||||||
| Non-prime |
236,006 | 262,084 | 280,970 | 280,066 | 283,043 | 283,784 | 307,253 | 321,655 | 316,089 | 259,600 | 291,271 | |||||||||||||||||||||||||||||||||
| Total senior residential securities |
701,766 | 719,633 | 606,589 | 528,277 | 527,545 | 530,741 | 563,137 | 583,703 | 586,375 | 676,090 | 540,344 | |||||||||||||||||||||||||||||||||
| Residential Re-REMIC securities |
82,124 | 105,281 | 87,001 | 74,560 | 41,598 | 30,447 | 32,648 | 32,917 | 33,250 | 91,434 | 34,930 | |||||||||||||||||||||||||||||||||
| Subordinate residential securities |
||||||||||||||||||||||||||||||||||||||||||||
| Prime |
118,549 | 104,078 | 81,253 | 69,477 | 72,199 | 63,141 | 53,046 | 45,914 | 35,794 | 101,356 | 62,866 | |||||||||||||||||||||||||||||||||
| Non-prime |
6,669 | 8,325 | 9,721 | 11,433 | 10,885 | 11,183 | 12,140 | 11,890 | 9,181 | 8,233 | 11,398 | |||||||||||||||||||||||||||||||||
| Total subordinate residential securities |
125,218 | 112,403 | 90,974 | 80,910 | 83,084 | 74,324 | 65,186 | 57,804 | 44,975 | 109,589 | 74,264 | |||||||||||||||||||||||||||||||||
| Commercial subordinate securities |
4,047 | 3,980 | 3,946 | 4,272 | 4,720 | 5,200 | 6,288 | 6,948 | 7,274 | 3,991 | 5,397 | |||||||||||||||||||||||||||||||||
| CDO |
14 | 14 | 762 | 960 | 1,247 | 1,297 | 1,252 | 973 | 1,103 | 263 | 1,265 | |||||||||||||||||||||||||||||||||
| Total real estate assets at Redwood |
1,646,447 | 1,504,633 | 1,278,057 | 1,119,215 | 1,051,402 | 825,468 | 909,792 | 866,131 | 689,682 | 1,477,000 | 929,406 | |||||||||||||||||||||||||||||||||
| Earning assets at Acacia |
270,891 | 262,959 | 252,907 | 255,801 | 285,985 | 315,039 | 347,786 | 311,949 | 292,468 | 262,284 | 316,139 | |||||||||||||||||||||||||||||||||
| Earning assets at Consolidated Sequoia |
3,128,076 | 3,258,137 | 3,597,081 | 3,838,327 | 3,600,122 | 3,684,680 | 3,576,778 | 3,587,904 | 3,710,002 | 3,327,036 | 3,620,613 | |||||||||||||||||||||||||||||||||
| Earning assets at the Fund (2) |
- | - | - | - | - | 4,948 | 22,280 | 33,001 | 34,334 | - | 8,994 | |||||||||||||||||||||||||||||||||
| Total earning assets at Other Consolidated Entities |
3,398,967 | 3,521,096 | 3,849,988 | 4,094,128 | 3,886,107 | 4,004,667 | 3,946,844 | 3,932,854 | 4,036,804 | 3,589,320 | 3,945,746 | |||||||||||||||||||||||||||||||||
| Cash and cash equivalents |
86,531 | 94,511 | 211,786 | 203,242 | 150,677 | 149,350 | 123,317 | 102,099 | 265,071 | 130,781 | 141,215 | |||||||||||||||||||||||||||||||||
| Earning assets |
5,131,945 | 5,120,240 | 5,339,831 | 5,416,585 | 5,088,186 | 4,979,485 | 4,979,953 | 4,901,084 | 4,991,557 | 5,197,101 | 5,016,367 | |||||||||||||||||||||||||||||||||
| Balance sheet mark-to-market adjustments |
44,846 | 24,142 | 12,087 | 3,136 | 55,628 | 100,858 | 128,026 | 79,851 | 39,123 | 27,090 | 94,572 | |||||||||||||||||||||||||||||||||
| Earning assets - reported value |
5,176,791 | 5,144,382 | 5,351,918 | 5,419,721 | 5,143,814 | 5,080,343 | 5,107,979 | 4,980,935 | 5,030,680 | 5,224,191 | 5,110,939 | |||||||||||||||||||||||||||||||||
| Other assets |
194,888 | 163,579 | 153,879 | 157,485 | 159,800 | 183,186 | 202,397 | 160,615 | 130,818 | 170,870 | 181,638 | |||||||||||||||||||||||||||||||||
| Total assets |
$ | 5,371,679 | $ | 5,307,961 | $ | 5,505,797 | $ | 5,577,206 | $ | 5,303,614 | $ | 5,263,529 | $ | 5,310,376 | $ | 5,141,550 | $ | 5,161,498 | $ | 5,395,061 | $ | 5,292,577 | ||||||||||||||||||||||
| Short-term debt |
$ | 570,775 | $ | 474,053 | $ | 362,107 | $ | 157,992 | $ | 18,116 | $ | 1,797 | $ | 47,976 | $ | 11,265 | $ | - | $ | 469,350 | $ | 22,520 | ||||||||||||||||||||||
| Consolidated Sequoia ABS issued |
3,039,273 | 3,166,476 | 3,504,155 | 3,738,132 | 3,510,089 | 3,589,286 | 3,487,214 | 3,513,293 | 3,623,816 | 3,235,915 | 3,528,947 | |||||||||||||||||||||||||||||||||
| Resecuritization ABS issued |
183,568 | 197,808 | 211,440 | 222,652 | 180,769 | - | - | - | - | 197,554 | 60,919 | |||||||||||||||||||||||||||||||||
| Acacia ABS issued |
235,789 | 231,673 | 208,281 | 224,273 | 257,872 | 295,902 | 303,601 | 274,630 | 254,244 | 225,286 | 285,624 | |||||||||||||||||||||||||||||||||
| Other liabilities |
216,293 | 153,869 | 155,412 | 183,852 | 221,592 | 200,708 | 232,062 | 151,332 | 126,428 | 175,341 | 218,178 | |||||||||||||||||||||||||||||||||
| Long-term debt |
138,289 | 138,277 | 138,264 | 138,254 | 138,242 | 138,231 | 138,219 | 138,707 | 138,620 | 138,277 | 138,231 | |||||||||||||||||||||||||||||||||
| Total liabilities |
4,383,987 | 4,362,156 | 4,579,659 | 4,665,155 | 4,326,680 | 4,225,924 | 4,209,072 | 4,089,227 | 4,143,108 | 4,441,723 | 4,254,419 | |||||||||||||||||||||||||||||||||
| Noncontrolling interest |
- | - | - | - | 258 | 2,542 | 8,724 | 14,278 | 15,018 | - | 3,810 | |||||||||||||||||||||||||||||||||
| Core equity (1) |
942,846 | 921,663 | 914,052 | 908,915 | 921,048 | 934,205 | 964,554 | 958,194 | 964,249 | 926,248 | 939,776 | |||||||||||||||||||||||||||||||||
| Accumulated other comprehensive income (loss) |
44,846 | 24,142 | 12,086 | 3,136 | 55,628 | 100,858 | 128,026 | 79,851 | 39,123 | 27,090 | 94,572 | |||||||||||||||||||||||||||||||||
| Total equity
|
987,692 | 945,805 | 926,138 | 912,051 | 976,676 | 1,035,063 | 1,092,580 | 1,038,045 | 1,003,372 | 953,338 | 1,034,348 | |||||||||||||||||||||||||||||||||
| Total liabilities and equity |
$ | 5,371,679 | $ | 5,307,961 | $ | 5,505,797 | $ | 5,577,206 | $ | 5,303,614 | $ | 5,263,529 | $ | 5,310,376 | $ | 5,141,550 | $ | 5,161,498 | $ | 5,395,061 | $ | 5,292,577 | ||||||||||||||||||||||
(1) Core equity is a non-GAAP metric and is equal to GAAP equity excluding accumulated other comprehensive income (loss).
(2) Refers to the Redwood Opportunity Fund, which liquidated in the third quarter of 2011.
| THE REDWOOD REVIEW 3RD QUARTER 2012
|
Table 5: Average Balance Sheet ($ in thousands) |
47
| ||
|
|
Table 6: Balances & Yields by Securities Portfolio at Redwood(1) ($ in thousands) | 48 | ||
| 2012 Q3 |
2012 Q2 |
2012 Q1 |
2011 Q4 |
2011 Q3 |
2011 Q2 |
2012 Q3 |
2012 Q2 |
2012 Q1 |
2011 Q4 |
2011 Q3 |
2011 Q2 |
|||||||||||||||||||||||||||||||||||||||||
| Residential Prime Senior AFS |
|
Residential Non-Prime Subordinate AFS |
|
|||||||||||||||||||||||||||||||||||||||||||||||||
| Principal balance |
$ | 517,737 | $ | 540,032 | $ | 490,141 | $ | 341,780 | $ | 329,466 | $ | 336,876 | Principal balance |
$ | 18,161 | $ | 21,123 | $ | 22,342 | $ | 29,864 | $ | 26,063 | $ | 26,940 | |||||||||||||||||||||||||||
| Unamortized discount |
(59,832 | ) | (52,686 | ) | (57,193 | ) | (58,424 | ) | (59,415 | ) | (71,985 | ) | Unamortized discount |
(7,400 | ) | (7,682 | ) | (7,403 | ) | (9,495 | ) | (7,783 | ) | (8,196 | ) | |||||||||||||||||||||||||||
| Credit reserve |
(22,657 | ) | (34,990 | ) | (31,011 | ) | (27,806 | ) | (28,330 | ) | (18,433 | ) | Credit reserve |
(4,582 | ) | (5,299 | ) | (6,566 | ) | (8,477 | ) | (7,639 | ) | (7,913 | ) | |||||||||||||||||||||||||||
| Unrealized gains, net |
55,161 | 38,446 | 34,846 | 22,690 | 35,204 | 39,488 | Unrealized (losses) gains, net |
225 | (275 | ) | (231 | ) | (739 | ) | (180 | ) | 46 | |||||||||||||||||||||||||||||||||||
| Fair value |
$ | 490,409 | $ | 490,802 | $ | 436,783 | $ | 278,240 | $ | 276,925 | $ | 285,946 | Fair value |
$ | 6,404 | $ | 7,867 | $ | 8,142 | $ | 11,153 | $ | 10,461 | $ | 10,877 | |||||||||||||||||||||||||||
| Average amortized cost |
$ | 455,646 | $ | 442,296 | $ | 316,505 | $ | 248,211 | $ | 244,502 | $ | 246,957 | Average amortized cost |
$ | 6,559 | $ | 8,237 | $ | 9,599 | $ | 11,283 | $ | 10,727 | $ | 11,017 | |||||||||||||||||||||||||||
| Interest income |
$ | 8,408 | $ | 9,006 | $ | 7,161 | $ | 6,651 | $ | 6,894 | $ | 7,099 | Interest income |
$ | 441 | $ | 419 | $ | 489 | $ | 509 | $ | 502 | $ | 531 | |||||||||||||||||||||||||||
| Annualized yield |
7.38% | 8.14% | 9.05% | 10.72% | 11.28% | 11.50% | Annualized yield |
26.89% | 20.35% | 20.38% | 18.04% | 18.73% | 19.27% | |||||||||||||||||||||||||||||||||||||||
| Residential Non-Prime Senior AFS |
|
Commercial Subordinate AFS |
|
|||||||||||||||||||||||||||||||||||||||||||||||||
| Principal balance |
$ | 287,877 | $ | 312,897 | $ | 329,182 | $ | 349,385 | $ | 357,809 | $ | 367,209 | Principal balance |
$ | 40,342 | $ | 42,602 | $ | 43,226 | $ | 50,499 | $ | 54,061 | $ | 58,127 | |||||||||||||||||||||||||||
| Unamortized discount |
(46,330 | ) | (60,341 | ) | (68,101 | ) | (75,661 | ) | (71,365 | ) | (81,672 | ) | Unamortized discount |
(3,509 | ) | (5,532 | ) | (5,651 | ) | (3,554 | ) | (2,551 | ) | (4,361 | ) | |||||||||||||||||||||||||||
| Credit reserve |
(17,046 | ) | (18,891 | ) | (15,829 | ) | (16,536 | ) | (24,663 | ) | (19,129 | ) | Credit reserve |
(33,206 | ) | (33,013 | ) | (33,668 | ) | (43,012 | ) | (47,197 | ) | (48,987 | ) | |||||||||||||||||||||||||||
| Unrealized (losses) gains, net |
15,370 | 8,342 | 10,027 | (1,464 | ) | 16,380 | 22,310 | Unrealized gains, net |
3,992 | 1,704 | 1,931 | 1,512 | 1,574 | 1,086 | ||||||||||||||||||||||||||||||||||||||
| Fair value |
$ | 239,871 | $ | 242,007 | $ | 255,279 | $ | 255,724 | $ | 278,161 | $ | 288,718 | Fair value |
$ | 7,619 | $ | 5,761 | $ | 5,838 | $ | 5,445 | $ | 5,887 | $ | 5,865 | |||||||||||||||||||||||||||
| Average amortized cost |
$ | 213,116 | $ | 239,711 | $ | 260,546 | $ | 259,281 | $ | 263,760 | $ | 265,130 | Average amortized cost |
$ | 4,047 | $ | 3,980 | $ | 3,946 | $ | 4,272 | $ | 4,720 | $ | 5,199 | |||||||||||||||||||||||||||
| Interest income |
$ | 4,436 | $ | 5,402 | $ | 5,984 | $ | 6,436 | $ | 7,199 | $ | 7,418 | Interest income |
$ | 643 | $ | 605 | $ | 480 | $ | 377 | $ | 553 | $ | 558 | |||||||||||||||||||||||||||
| Annualized yield |
8.33% | 9.01% | 9.19% | 9.93% | 10.92% | 11.19% | Annualized yield |
63.55% | 60.80% | 48.65% | 35.33% | 46.87% | 42.95% | |||||||||||||||||||||||||||||||||||||||
| Residential Re-REMIC AFS |
|
CDO Subordinate AFS |
|
|||||||||||||||||||||||||||||||||||||||||||||||||
| Principal balance |
$ | 216,159 | $ | 236,470 | $ | 252,941 | $ | 220,697 | $ | 194,245 | $ | 131,860 | Principal balance |
$ | 7,303 | $ | 7,275 | $ | 7,244 | $ | 10,717 | $ | 10,689 | $ | 11,863 | |||||||||||||||||||||||||||
| Unamortized discount |
(61,123 | ) | (73,438 | ) | (81,817 | ) | (78,226 | ) | (68,861 | ) | (52,375 | ) | Unamortized discount |
- | - | - | - | (1,082 | ) | (1,083 | ) | |||||||||||||||||||||||||||||||
| Credit reserve |
(56,158 | ) | (58,618 | ) | (63,702 | ) | (60,563 | ) | (58,106 | ) | (49,033 | ) | Credit reserve |
(7,303 | ) | (7,275 | ) | (7,244 | ) | (10,717 | ) | (9,607 | ) | (10,780 | ) | |||||||||||||||||||||||||||
| Unrealized gains, net |
51,095 | 43,023 | 47,239 | 37,458 | 45,822 | 47,123 | Unrealized gains, net |
50 | 50 | 50 | 50 | 50 | 100 | |||||||||||||||||||||||||||||||||||||||
| Fair value |
$ | 149,973 | $ | 147,437 | $ | 154,661 | $ | 119,366 | $ | 113,100 | $ | 77,575 | Fair value |
$ | 50 | $ | 50 | $ | 50 | $ | 50 | $ | 50 | $ | 100 | |||||||||||||||||||||||||||
| Average amortized cost |
$ | 82,124 | $ | 105,281 | $ | 87,001 | $ | 74,560 | $ | 41,598 | $ | 30,447 | Average amortized cost |
$ | - | $ | - | $ | - | $ | - | $ | - | $ | - | |||||||||||||||||||||||||||
| Interest income |
$ | 3,282 | $ | 3,184 | $ | 2,823 | $ | 2,473 | $ | 1,675 | $ | 1,437 | Interest income |
$ | - | $ | - | $ | - | $ | - | $ | - | $ | - | |||||||||||||||||||||||||||
| Annualized yield |
15.99% | 12.10% | 12.98% | 13.27% | 16.11% | 18.87% | Annualized yield |
N/A | N/A | N/A | N/A | N/A | N/A | |||||||||||||||||||||||||||||||||||||||
| Residential Prime Subordinate AFS |
|
Trading Securities |
|
|||||||||||||||||||||||||||||||||||||||||||||||||
| Principal balance |
$ | 258,961 | $ | 252,207 | $ | 247,498 | $ | 207,226 | $ | 227,562 | $ | 248,331 | ||||||||||||||||||||||||||||||||||||||||
| Unamortized discount |
(27,344 | ) | (30,677 | ) | (24,019 | ) | (14,027 | ) | (22,097 | ) | (29,434 | ) | Residential Senior |
$ | 29,242 | $ | 39,263 | $ | 41,540 | $ | 20,608 | $ | 20,756 | $ | 18,686 | |||||||||||||||||||||||||||
| Credit reserve |
(99,209 | ) | (103,628 | ) | (118,510 | ) | (128,879 | ) | (134,116 | ) | (146,391 | ) | Residential Subordinate |
597 | 571 | 488 | 473 | 483 | 462 | |||||||||||||||||||||||||||||||||
| Unrealized (losses) gains, net |
12,688 | 5,103 | 819 | (5,603 | ) | (1,071 | ) | (963 | ) | CDO Subordinate |
14 | 14 | 14 | 960 | 960 | 1,303 | ||||||||||||||||||||||||||||||||||||
| Fair value |
$ | 145,096 | $ | 123,005 | $ | 105,788 | $ | 58,717 | $ | 70,278 | $ | 71,543 | Fair value |
$ | 29,853 | $ | 39,848 | $ | 42,042 | $ | 22,041 | $ | 22,199 | $ | 20,451 | |||||||||||||||||||||||||||
| Average amortized cost |
$ | 118,085 | $ | 103,635 | $ | 80,903 | $ | 69,148 | $ | 71,873 | $ | 62,786 | Average fair value |
$ | 33,592 | $ | 38,171 | $ | 30,773 | $ | 22,223 | $ | 21,014 | $ | 20,472 | |||||||||||||||||||||||||||
| Interest income |
$ | 4,378 | $ | 4,106 | $ | 3,709 | $ | 3,709 | $ | 3,618 | $ | 3,582 | Interest income |
$ | 3,135 | $ | 3,099 | $ | 2,534 | $ | 1,883 | $ | 2,032 | $ | 2,008 | |||||||||||||||||||||||||||
| Annualized yield |
14.83% | 15.85% | 18.34% | 21.46% | 20.14% | 22.82% | Annualized yield |
37.33% | 32.47% | 32.94% | 33.89% | 38.68% | 39.24% | |||||||||||||||||||||||||||||||||||||||
(1) Annualized yields for AFS portfolios are based on average amortized cost. Cash flows from many of our subordinate securities can be volatile and in certain cases (e.g., when the fair value of certain securities are close to zero) any interest income earned can result in unusually high reported yields that are not sustainable and not necessarily meaningful.
| THE REDWOOD REVIEW 3RD QUARTER 2012
|
Table 6: Balances & Yields by Securities Portfolio at Redwood | |||
|
|
Table 7: Securities and Loans Portfolio Activity at Redwood ($ in thousands) | |||
|
2012 Q3 |
2012 Q2 |
2012 Q1 |
2011 Q4 |
2011 Q3 |
2011 Q2 |
2012 Q3 |
2012 Q2 |
2012 Q1 |
2011 Q4 |
2011 Q3 |
2011 Q2 |
|||||||||||||||||||||||||||||||||||||||||
| Residential Prime Senior |
|
Commercial Subordinate |
|
|||||||||||||||||||||||||||||||||||||||||||||||||
| Beginning fair value |
$ | 507,103 | $ | 458,648 | $ | 278,240 | $ | 276,925 | $ | 285,946 | $ | 306,192 | Beginning fair value |
$ | 5,761 | $ | 5,838 | $ | 5,445 | $ | 5,887 | $ | 5,865 | $ | 6,362 | |||||||||||||||||||||||||||
| Acquisitions |
16,913 | 94,702 | 193,837 | 20,373 | 2,433 | 8,844 | Acquisitions |
- | - | - | - | - | - | |||||||||||||||||||||||||||||||||||||||
| Sales |
(18,160 | ) | (24,775 | ) | (20,954 | ) | - | - | (8,554 | ) | Sales |
- | - | - | - | - | - | |||||||||||||||||||||||||||||||||||
| Effect of principal payments |
(21,983 | ) | (20,623 | ) | (10,550 | ) | (8,411 | ) | (9,235 | ) | (11,019 | ) | Effect of principal payments |
- | - | - | - | - | - | |||||||||||||||||||||||||||||||||
| Change in fair value, net |
12,837 | (849 | ) | 18,075 | (10,647 | ) | (2,219 | ) | (9,517 | ) | Change in fair value, net |
1,858 | (77 | ) | 393 | (442 | ) | 22 | (497 | ) | ||||||||||||||||||||||||||||||||
| Ending fair value |
$ | 496,710 | $ | 507,103 | $ | 458,648 | $ | 278,240 | $ | 276,925 | $ | 285,946 | Ending fair value |
$ | 7,619 | $ | 5,761 | $ | 5,838 | $ | 5,445 | $ | 5,887 | $ | 5,865 | |||||||||||||||||||||||||||
| Residential Non-Prime Senior |
|
CDO Subordinate |
|
|||||||||||||||||||||||||||||||||||||||||||||||||
| Beginning fair value |
$ | 264,970 | $ | 274,954 | $ | 276,332 | $ | 298,917 | $ | 307,404 | $ | 316,626 | Beginning fair value |
$ | 64 | $ | 64 | $ | 1,010 | $ | 1,010 | $ | 1,403 | $ | 1,296 | |||||||||||||||||||||||||||
| Acquisitions |
20,850 | 13,783 | 19,521 | 1,299 | 1,202 | 3,154 | Acquisitions |
- | - | - | - | - | - | |||||||||||||||||||||||||||||||||||||||
| Sales |
(23,004 | ) | (14,018 | ) | (25,408 | ) | - | - | - | Sales |
- | - | (859 | ) | - | - | - | |||||||||||||||||||||||||||||||||||
| Effect of principal payments |
(7,505 | ) | (8,607 | ) | (7,164 | ) | (7,880 | ) | (8,509 | ) | (7,613 | ) | Effect of principal payments |
- | - | - | - | - | - | |||||||||||||||||||||||||||||||||
| Change in fair value, net |
7,501 | (1,142 | ) | 11,673 | (16,004 | ) | (1,180 | ) | (4,763 | ) | Change in fair value, net |
- | - | (87 | ) | - | (393 | ) | 107 | |||||||||||||||||||||||||||||||||
| Ending fair value |
$ | 262,812 | $ | 264,970 | $ | 274,954 | $ | 276,332 | $ | 298,917 | $ | 307,404 | Ending fair value |
$ | 64 | $ | 64 | $ | 64 | $ | 1,010 | $ | 1,010 | $ | 1,403 | |||||||||||||||||||||||||||
| Residential Re-REMIC |
|
Residential Loans |
|
|||||||||||||||||||||||||||||||||||||||||||||||||
| Beginning fair value |
$ | 147,437 | $ | 154,661 | $ | 119,366 | $ | 113,100 | $ | 77,575 | $ | 85,497 | Beginning carrying value |
$ | 256,077 | $ | 303,106 | $ | 395,237 | $ | 228,906 | $ | 205,301 | $ | 54,870 | |||||||||||||||||||||||||||
| Acquisitions |
- | - | 26,135 | 14,800 | 36,888 | - | Acquisitions |
524,043 | 338,898 | 660,008 | 174,767 | 404,597 | 152,042 | |||||||||||||||||||||||||||||||||||||||
| Sales |
(5,376 | ) | (2,983 | ) | (2,527 | ) | - | - | - | Sales |
(372,362 | ) | (381,808 | ) | (745,262 | ) | (235 | ) | - | - | ||||||||||||||||||||||||||||||||
| Effect of principal payments |
- | - | - | - | - | - | Transfers to Securitization Entities |
- | - | - | - | (376,226 | ) | - | ||||||||||||||||||||||||||||||||||||||
| Change in fair value, net |
7,912 | (4,241 | ) | 11,687 | (8,534 | ) | (1,363 | ) | (7,922 | ) | Principal repayments |
(4,842 | ) | (4,524 | ) | (6,970 | ) | (8,189 | ) | (5,115 | ) | (1,616 | ) | |||||||||||||||||||||||||||||
| Ending fair value |
$ | 149,973 | $ | 147,437 | $ | 154,661 | $ | 119,366 | $ | 113,100 | $ | 77,575 | Transfers to REO |
- | - | - | - | - | - | |||||||||||||||||||||||||||||||||
| Changes in fair value, net |
15,066 | 405 | 93 | (12 | ) | 349 | 5 | |||||||||||||||||||||||||||||||||||||||||||||
| Residential Prime Subordinate |
|
Ending carrying value |
$ | 417,982 | $ | 256,077 | $ | 303,106 | $ | 395,237 | $ | 228,906 | $ | 205,301 | ||||||||||||||||||||||||||||||||||||||
| Beginning fair value |
$ | 123,472 | $ | 106,189 | $ | 59,060 | $ | 70,606 | $ | 71,845 | $ | 59,239 | ||||||||||||||||||||||||||||||||||||||||
| Acquisitions |
18,576 | 17,267 | 44,543 | - | 3,491 | 21,277 | Commercial Loans |
|
||||||||||||||||||||||||||||||||||||||||||||
| Sales |
- | - | - | - | - | - | Beginning carrying value |
$ | 246,783 | $ | 178,415 | $ | 157,726 | $ | 98,060 | $ | 71,168 | $ | 42,483 | |||||||||||||||||||||||||||||||||
| Effect of principal payments |
(3,072 | ) | (3,211 | ) | (2,386 | ) | (2,301 | ) | (1,995 | ) | (1,743 | ) | Originations |
40,154 | 68,620 | 26,888 | 60,297 | 26,908 | 28,660 | |||||||||||||||||||||||||||||||||
| Change in fair value, net |
6,566 | 3,227 | 4,972 | (9,245 | ) | (2,735 | ) | (6,928 | ) | Principal repayments |
(491 | ) | (87 | ) | (6,091 | ) | (59 | ) | (25 | ) | (2 | ) | ||||||||||||||||||||||||||||||
| Ending fair value |
$ | 145,542 | $ | 123,472 | $ | 106,189 | $ | 59,060 | $ | 70,606 | $ | 71,845 | Provision for loan losses |
(506 | ) | (376 | ) | (274 | ) | (608 | ) | - | - | |||||||||||||||||||||||||||||
| Discount/fee amortization |
130 | 211 | 166 | 36 | 9 | 27 | ||||||||||||||||||||||||||||||||||||||||||||||
| Residential Non-Prime Subordinate |
|
Ending carrying value |
$ | 286,070 | $ | 246,783 | $ | 178,415 | $ | 157,726 | $ | 98,060 | $ | 71,168 | ||||||||||||||||||||||||||||||||||||||
| Beginning fair value |
$ | 7,970 | $ | 8,229 | $ | 11,283 | $ | 10,616 | $ | 11,036 | $ | 12,196 | ||||||||||||||||||||||||||||||||||||||||
| Acquisitions |
- | - | - | 1,582 | - | - | ||||||||||||||||||||||||||||||||||||||||||||||
| Sales |
(1,868 | ) | - | (3,149 | ) | - | - | - | ||||||||||||||||||||||||||||||||||||||||||||
| Effect of principal payments |
(143 | ) | (260 | ) | (229 | ) | (364 | ) | (287 | ) | (336 | ) | ||||||||||||||||||||||||||||||||||||||||
| Change in fair value, net |
596 | 1 | 324 | (551 | ) | (133 | ) | (824 | ) | |||||||||||||||||||||||||||||||||||||||||||
| Ending fair value |
$ | 6,555 | $ | 7,970 | $ | 8,229 | $ | 11,283 | $ | 10,616 | $ | 11,036 | ||||||||||||||||||||||||||||||||||||||||
| THE REDWOOD REVIEW 3RD QUARTER 2012
|
Table 7: Securities and Loans Portfolio Activity at Redwood |
49
| ||
|
|
Table 8A: Residential Prime Securities at Redwood and Underlying Loan Characteristics(1) ($ in thousands) |
50
| ||
| 2012 Q3 |
2012 Q2 |
2012 Q1 |
2011 Q4 |
2011 Q3 |
2011 Q2 |
2011 Q1 |
2010 Q4 |
|||||||||||||||||||||||||
| Senior AFS |
$ | 490,409 | $ | 490,802 | $ | 436,783 | $ | 278,240 | $ | 276,925 | $ | 285,946 | $ | 306,192 | $ | 315,891 | ||||||||||||||||
| Subordinate AFS |
145,096 | 123,005 | 105,788 | 58,717 | 70,278 | 71,543 | 58,870 | 53,846 | ||||||||||||||||||||||||
| Fair value |
6,747 | 16,768 | 22,266 | 343 | 328 | 302 | 369 | 386 | ||||||||||||||||||||||||
| Total Residential Prime Securities |
$ | 642,252 | $ | 630,575 | $ | 564,837 | $ | 337,300 | $ | 347,531 | $ | 357,791 | $ | 365,431 | $ | 370,123 | ||||||||||||||||
| Number of loans |
60,584 | 63,986 | 81,085 | 85,702 | 92,071 | 101,149 | 109,221 | 121,173 | ||||||||||||||||||||||||
| Total loan face |
$ | 26,183,495 | $ | 27,988,787 | $ | 30,222,071 | $ | 31,848,071 | $ | 34,816,750 | $ | 39,160,316 | $ | 43,242,656 | $ | 49,071,513 | ||||||||||||||||
| Average loan size |
$ | 432 | $ | 437 | $ | 373 | $ | 372 | $ | 378 | $ | 387 | $ | 396 | $ | 405 | ||||||||||||||||
| Year 2012 origination |
1% | 1% | 0% | 0% | 0% | 0% | 0% | 0% | ||||||||||||||||||||||||
| Year 2011 origination |
2% | 2% | 2% | 0% | 0% | 0% | 0% | 0% | ||||||||||||||||||||||||
| Year 2010 origination |
0% | 0% | 0% | 0% | 0% | 0% | 0% | 0% | ||||||||||||||||||||||||
| Year 2009 origination |
0% | 0% | 0% | 0% | 0% | 0% | 0% | 0% | ||||||||||||||||||||||||
| Year 2008 origination |
0% | 0% | 0% | 0% | 0% | 0% | 0% | 0% | ||||||||||||||||||||||||
| Year 2007 origination |
12% | 12% | 11% | 10% | 10% | 9% | 10% | 9% | ||||||||||||||||||||||||
| Year 2006 origination |
3% | 3% | 3% | 1% | 1% | 1% | 11% | 11% | ||||||||||||||||||||||||
| Year 2005 origination |
17% | 17% | 17% | 19% | 19% | 18% | 17% | 17% | ||||||||||||||||||||||||
| Year 2004 origination and earlier |
65% | 65% | 67% | 70% | 70% | 72% | 62% | 63% | ||||||||||||||||||||||||
| Geographic concentration |
||||||||||||||||||||||||||||||||
| Southern CA |
23% | 23% | 23% | 23% | 23% | 24% | 24% | 24% | ||||||||||||||||||||||||
| Northern CA |
21% | 21% | 21% | 21% | 21% | 21% | 22% | 22% | ||||||||||||||||||||||||
| New York |
7% | 7% | 7% | 6% | 6% | 6% | 6% | 7% | ||||||||||||||||||||||||
| Florida |
6% | 6% | 6% | 6% | 6% | 6% | 6% | 6% | ||||||||||||||||||||||||
| Virginia |
3% | 3% | 3% | 4% | 4% | 4% | 4% | 4% | ||||||||||||||||||||||||
| New Jersey |
3% | 3% | 3% | 3% | 3% | 3% | 3% | 3% | ||||||||||||||||||||||||
| Illinois |
3% | 3% | 3% | 3% | 3% | 3% | 3% | 3% | ||||||||||||||||||||||||
| Other states |
34% | 34% | 34% | 34% | 34% | 33% | 32% | 31% | ||||||||||||||||||||||||
| Wtd Avg Original LTV |
69% | 69% | 68% | 68% | 68% | 68% | 68% | 68% | ||||||||||||||||||||||||
| Original LTV: 0 - 50 |
11% | 11% | 12% | 12% | 12% | 13% | 12% | 13% | ||||||||||||||||||||||||
| Original LTV: 50.01 - 60 |
11% | 11% | 11% | 11% | 11% | 12% | 11% | 12% | ||||||||||||||||||||||||
| Original LTV: 60.01 - 70 |
23% | 23% | 23% | 23% | 23% | 23% | 22% | 22% | ||||||||||||||||||||||||
| Original LTV: 70.01 - 80 |
51% | 51% | 50% | 49% | 49% | 48% | 50% | 49% | ||||||||||||||||||||||||
| Original LTV: 80.01 - 90 |
3% | 3% | 3% | 3% | 3% | 3% | 3% | 3% | ||||||||||||||||||||||||
| Original LTV: 90.01 - 100 |
1% | 1% | 1% | 2% | 2% | 1% | 2% | 1% | ||||||||||||||||||||||||
| Unknown |
0% | 0% | 0% | 0% | 0% | 0% | 0% | 0% | ||||||||||||||||||||||||
| Wtd Avg Original FICO |
735 | 735 | 735 | 735 | 735 | 735 | 736 | 737 | ||||||||||||||||||||||||
| Original FICO: <= 680 |
11% | 11% | 11% | 11% | 11% | 11% | 10% | 10% | ||||||||||||||||||||||||
| Original FICO: 681 - 700 |
11% | 11% | 10% | 10% | 10% | 10% | 10% | 10% | ||||||||||||||||||||||||
| Original FICO: 701 - 720 |
14% | 14% | 14% | 14% | 14% | 14% | 14% | 14% | ||||||||||||||||||||||||
| Original FICO: 721 - 740 |
15% | 15% | 15% | 15% | 15% | 15% | 14% | 14% | ||||||||||||||||||||||||
| Original FICO: 741 - 760 |
16% | 16% | 16% | 16% | 16% | 16% | 16% | 16% | ||||||||||||||||||||||||
| Original FICO: 761 - 780 |
17% | 17% | 17% | 17% | 17% | 17% | 18% | 18% | ||||||||||||||||||||||||
| Original FICO: 781 - 800 |
12% | 12% | 12% | 12% | 12% | 12% | 13% | 13% | ||||||||||||||||||||||||
| Original FICO: >= 801 |
3% | 3% | 3% | 3% | 3% | 3% | 3% | 3% | ||||||||||||||||||||||||
| Original Unknown |
1% | 1% | 2% | 2% | 2% | 2% | 2% | 2% | ||||||||||||||||||||||||
| Conforming balance % (2) |
53% | 52% | 54% | 55% | 54% | 60% | 59% | 59% | ||||||||||||||||||||||||
| > $1 MM % |
9% | 9% | 9% | 8% | 8% | 8% | 8% | 9% | ||||||||||||||||||||||||
| 2nd Home % |
7% | 7% | 7% | 7% | 7% | 7% | 7% | 7% | ||||||||||||||||||||||||
| Investment Home % |
2% | 2% | 2% | 2% | 2% | 2% | 2% | 2% | ||||||||||||||||||||||||
| Purchase |
41% | 41% | 40% | 40% | 39% | 39% | 42% | 42% | ||||||||||||||||||||||||
| Cash Out Refi |
23% | 23% | 23% | 23% | 23% | 23% | 23% | 23% | ||||||||||||||||||||||||
| Rate-Term Refi |
36% | 36% | 36% | 36% | 37% | 37% | 34% | 34% | ||||||||||||||||||||||||
| Other |
0% | 0% | 1% | 1% | 1% | 1% | 1% | 1% | ||||||||||||||||||||||||
| Full Doc |
55% | 55% | 53% | 51% | 51% | 51% | 50% | 50% | ||||||||||||||||||||||||
| No Doc |
4% | 4% | 6% | 6% | 6% | 6% | 5% | 6% | ||||||||||||||||||||||||
| Other Doc (Lim, Red, Stated, etc) |
38% | 38% | 38% | 40% | 40% | 40% | 42% | 41% | ||||||||||||||||||||||||
| Unknown/Not Categorized |
3% | 3% | 3% | 3% | 3% | 3% | 3% | 3% | ||||||||||||||||||||||||
| 2-4 Family |
2% | 2% | 2% | 1% | 1% | 1% | 1% | 2% | ||||||||||||||||||||||||
| Condo |
9% | 9% | 9% | 9% | 9% | 9% | 10% | 10% | ||||||||||||||||||||||||
| Single Family |
88% | 88% | 88% | 89% | 89% | 89% | 88% | 87% | ||||||||||||||||||||||||
| Other
|
1% | 1% | 1% | 1% | 1% | 1% | 1% | 1% | ||||||||||||||||||||||||
(1) Only the loan groups providing direct cash flow to securities we own are included.
(2) The definition of a conforming loan has significantly changed over time. For Q3 2011 and subsequent periods, the conforming balance definition that went into effect on October 1, 2011 was used (which had a maximum loan balance of $625,500). For all periods prior to Q3 2011, the conforming balance definition available in June 2011 was used (which had a maximum loan balance of $729,750).
| THE REDWOOD REVIEW 3RD QUARTER 2012
|
Table 8A: Residential Prime Securities at Redwood and Underlying Loan Characteristics | |||
|
|
Table 8B: Residential Non-Prime Securities at Redwood and Underlying Loan Characteristics(1) ($ in thousands) | |||
| 2012 Q3 |
2012 Q2 |
2012 Q1 |
2011 Q4 |
2011 Q3 |
2011 Q2 |
2011 Q1 |
2010 Q4 |
|||||||||||||||||||||||||
| Senior AFS |
$ | 239,871 | $ | 242,007 | $ | 255,279 | $ | 255,724 | $ | 278,161 | $ | 288,718 | $ | 297,758 | $ | 326,365 | ||||||||||||||||
| Subordinate AFS |
6,404 | 7,867 | 8,142 | 11,153 | 10,461 | 10,877 | 12,028 | 13,188 | ||||||||||||||||||||||||
| Fair value |
23,092 | 23,066 | 19,762 | 20,738 | 20,911 | 18,845 | 19,036 | 19,930 | ||||||||||||||||||||||||
| Total Residential Non-prime Securities |
$ | 269,367 | $ | 272,940 | $ | 283,183 | $ | 287,615 | $ | 309,533 | $ | 318,440 | $ | 328,822 | $ | 359,483 | ||||||||||||||||
| Number of loans |
33,775 | 34,815 | 35,452 | 54,717 | 54,538 | 55,830 | 57,542 | 65,949 | ||||||||||||||||||||||||
| Total loan face |
$ | 6,760,747 | $ | 7,019,443 | $ | 7,241,685 | $ | 11,730,410 | $ | 11,878,085 | $ | 12,250,760 | $ | 12,723,531 | $ | 14,615,940 | ||||||||||||||||
| Average loan size |
$ | 200 | $ | 202 | $ | 204 | $ | 214 | $ | 218 | $ | 219 | $ | 221 | $ | 222 | ||||||||||||||||
| Year 2008 origination |
0% | 0% | 0% | 0% | 0% | 0% | 0% | 0% | ||||||||||||||||||||||||
| Year 2007 origination |
0% | 0% | 0% | 0% | 0% | 0% | 0% | 0% | ||||||||||||||||||||||||
| Year 2006 origination |
1% | 1% | 1% | 14% | 14% | 15% | 15% | 18% | ||||||||||||||||||||||||
| Year 2005 origination |
54% | 54% | 54% | 50% | 51% | 50% | 50% | 49% | ||||||||||||||||||||||||
| Year 2004 origination and earlier |
45% | 45% | 45% | 36% | 35% | 35% | 35% | 33% | ||||||||||||||||||||||||
| Geographic concentration |
||||||||||||||||||||||||||||||||
| Southern CA |
22% | 22% | 22% | 21% | 21% | 21% | 21% | 20% | ||||||||||||||||||||||||
| Northern CA |
16% | 16% | 16% | 15% | 15% | 15% | 14% | 14% | ||||||||||||||||||||||||
| Florida |
8% | 8% | 9% | 9% | 9% | 9% | 9% | 9% | ||||||||||||||||||||||||
| New York |
6% | 6% | 5% | 5% | 5% | 5% | 5% | 5% | ||||||||||||||||||||||||
| Virginia |
2% | 2% | 2% | 3% | 3% | 3% | 3% | 4% | ||||||||||||||||||||||||
| New Jersey |
3% | 3% | 3% | 3% | 3% | 3% | 3% | 3% | ||||||||||||||||||||||||
| Illinois |
3% | 3% | 3% | 3% | 3% | 3% | 3% | 3% | ||||||||||||||||||||||||
| Other states |
40% | 40% | 40% | 41% | 41% | 41% | 42% | 42% | ||||||||||||||||||||||||
| Wtd Avg Original LTV |
73% | 72% | 72% | 73% | 73% | 73% | 73% | 73% | ||||||||||||||||||||||||
| Original LTV: 0 - 50 |
7% | 7% | 7% | 6% | 7% | 7% | 6% | 7% | ||||||||||||||||||||||||
| Original LTV: 50.01 - 60 |
9% | 9% | 9% | 8% | 8% | 8% | 8% | 8% | ||||||||||||||||||||||||
| Original LTV: 60.01 - 70 |
19% | 19% | 19% | 18% | 18% | 18% | 18% | 18% | ||||||||||||||||||||||||
| Original LTV: 70.01 - 80 |
57% | 57% | 57% | 58% | 58% | 58% | 58% | 58% | ||||||||||||||||||||||||
| Original LTV: 80.01 - 90 |
6% | 6% | 6% | 7% | 6% | 6% | 7% | 6% | ||||||||||||||||||||||||
| Original LTV: 90.01 - 100 |
2% | 2% | 2% | 3% | 3% | 3% | 3% | 3% | ||||||||||||||||||||||||
| Unknown |
0% | 0% | 0% | 0% | 0% | 0% | 0% | 0% | ||||||||||||||||||||||||
| Wtd Avg Original FICO |
713 | 713 | 714 | 710 | 710 | 710 | 711 | 711 | ||||||||||||||||||||||||
| Original FICO: <= 680 |
25% | 25% | 25% | 27% | 27% | 27% | 27% | 28% | ||||||||||||||||||||||||
| Original FICO: 681 - 700 |
14% | 14% | 14% | 14% | 14% | 14% | 14% | 14% | ||||||||||||||||||||||||
| Original FICO: 701 - 720 |
15% | 15% | 15% | 14% | 14% | 14% | 14% | 14% | ||||||||||||||||||||||||
| Original FICO: 721 - 740 |
12% | 12% | 12% | 12% | 12% | 12% | 12% | 12% | ||||||||||||||||||||||||
| Original FICO: 741 - 760 |
12% | 12% | 12% | 12% | 12% | 12% | 12% | 11% | ||||||||||||||||||||||||
| Original FICO: 761 - 780 |
10% | 10% | 10% | 10% | 10% | 10% | 10% | 10% | ||||||||||||||||||||||||
| Original FICO: 781 - 800 |
7% | 7% | 7% | 7% | 7% | 7% | 7% | 7% | ||||||||||||||||||||||||
| Original FICO: >= 801 |
2% | 2% | 2% | 2% | 2% | 2% | 2% | 2% | ||||||||||||||||||||||||
| Original Unknown |
3% | 3% | 3% | 2% | 2% | 2% | 2% | 2% | ||||||||||||||||||||||||
|
Conforming balance % (2) |
86% | 86% | 86% | 83% | 82% | 86% | 86% | 86% | ||||||||||||||||||||||||
| > $1 MM % |
2% | 2% | 3% | 3% | 3% | 3% | 3% | 3% | ||||||||||||||||||||||||
|
2nd Home % |
4% | 4% | 4% | 4% | 4% | 4% | 4% | 4% | ||||||||||||||||||||||||
| Investment Home % |
15% | 15% | 15% | 14% | 14% | 13% | 13% | 13% | ||||||||||||||||||||||||
|
Purchase |
41% | 42% | 41% | 41% | 41% | 41% | 42% | 42% | ||||||||||||||||||||||||
| Cash Out Refi |
43% | 42% | 42% | 42% | 42% | 42% | 41% | 41% | ||||||||||||||||||||||||
| Rate-Term Refi |
15% | 15% | 16% | 16% | 16% | 16% | 16% | 16% | ||||||||||||||||||||||||
| Other |
1% | 1% | 1% | 1% | 1% | 1% | 1% | 1% | ||||||||||||||||||||||||
|
Full Doc |
39% | 39% | 38% | 38% | 39% | 38% | 39% | 38% | ||||||||||||||||||||||||
| No Doc |
6% | 6% | 6% | 5% | 4% | 4% | 4% | 3% | ||||||||||||||||||||||||
| Other Doc (Lim, Red, Stated, etc) |
53% | 53% | 54% | 56% | 56% | 56% | 56% | 57% | ||||||||||||||||||||||||
| Unknown/Not Categorized |
2% | 2% | 2% | 1% | 1% | 2% | 1% | 2% | ||||||||||||||||||||||||
|
2-4 Family |
8% | 8% | 8% | 8% | 8% | 8% | 8% | 8% | ||||||||||||||||||||||||
| Condo |
8% | 8% | 8% | 8% | 8% | 8% | 8% | 8% | ||||||||||||||||||||||||
| Single Family |
84% | 84% | 84% | 84% | 84% | 84% | 84% | 84% | ||||||||||||||||||||||||
| Other
|
0% | 0% | 0% | 0% | 0% | 0% | 0% | 0% | ||||||||||||||||||||||||
(1) Only the loan groups providing direct cash flow to securities we own are included.
(2) The definition of a conforming loan has significantly changed over time. For Q3 2011 and subsequent periods, the conforming balance definition that went into effect on October 1, 2011 was used (which had a maximum loan balance of $625,500). For all periods prior to Q3 2011, the conforming balance definition available in June 2011 was used (which had a maximum loan balance of $729,750).
| THE REDWOOD REVIEW 3RD QUARTER 2012
|
Table 8B: Residential Non-Prime Securities at Redwood and Underlying Loan Characteristics |
51
| ||
|
|
Table 9: Residential Loan Characteristics(1) ($ in thousands) |
52
| ||
| 2012 Q3 |
2012 Q2 |
2012 Q1 |
2011 Q4 |
2011 Q3 |
2011 Q2 |
2011 Q1 |
2010 Q4 |
|||||||||||||||||||||||||
| Residential loans principal balance |
$ | 3,502,775 | $ | 3,493,755 | $ | 3,682,379 | $ | 4,231,324 | $ | 4,190,773 | $ | 3,892,161 | $ | 3,819,692 | $ | 3,818,659 | ||||||||||||||||
| Number of loans |
10,697 | 10,773 | 11,079 | 12,490 | 12,526 | 12,258 | 12,301 | 12,413 | ||||||||||||||||||||||||
| Average loan balance |
$ | 327 | $ | 324 | $ | 332 | $ | 339 | $ | 335 | $ | 318 | $ | 311 | $ | 308 | ||||||||||||||||
| Adjustable % |
73% | 75% | 73% | 72% | 74% | 81% | 84% | 86% | ||||||||||||||||||||||||
| Hybrid % |
6% | 8% | 9% | 9% | 10% | 10% | 11% | 10% | ||||||||||||||||||||||||
| Fixed % |
21% | 18% | 18% | 19% | 16% | 9% | 5% | 4% | ||||||||||||||||||||||||
| Amortizing % |
23% | 20% | 21% | 22% | 19% | 11% | 8% | 7% | ||||||||||||||||||||||||
| Interest-only % |
77% | 80% | 79% | 78% | 81% | 89% | 92% | 93% | ||||||||||||||||||||||||
| Northern California |
15% | 15% | 16% | 14% | 14% | 12% | 11% | 11% | ||||||||||||||||||||||||
| Florida |
11% | 12% | 11% | 11% | 12% | 12% | 13% | 13% | ||||||||||||||||||||||||
| Southern California |
11% | 11% | 12% | 12% | 12% | 12% | 11% | 11% | ||||||||||||||||||||||||
| New York |
7% | 7% | 7% | 7% | 8% | 8% | 8% | 7% | ||||||||||||||||||||||||
| Texas |
6% | 5% | 5% | 6% | 5% | 5% | 5% | 5% | ||||||||||||||||||||||||
| Georgia |
5% | 4% | 4% | 4% | 5% | 5% | 5% | 5% | ||||||||||||||||||||||||
| New Jersey |
4% | 4% | 4% | 4% | 4% | 4% | 4% | 4% | ||||||||||||||||||||||||
| Colorado |
4% | 3% | 3% | 3% | 3% | 3% | 4% | 4% | ||||||||||||||||||||||||
| Virginia |
3% | 3% | 3% | 3% | 2% | 3% | 3% | 3% | ||||||||||||||||||||||||
| Arizona |
2% | 2% | 2% | 2% | 2% | 2% | 2% | 2% | ||||||||||||||||||||||||
| Illinois |
2% | 2% | 2% | 3% | 2% | 2% | 2% | 2% | ||||||||||||||||||||||||
| Other states |
31% | 30% | 31% | 31% | 31% | 32% | 32% | 33% | ||||||||||||||||||||||||
| Year 2012 origination |
11% | 6% | 4% | 0% | 0% | 0% | 0% | 0% | ||||||||||||||||||||||||
| Year 2011 origination |
4% | 5% | 9% | 13% | 9% | 3% | 0% | 0% | ||||||||||||||||||||||||
| Year 2010 origination |
7% | 8% | 8% | 9% | 10% | 8% | 7% | 5% | ||||||||||||||||||||||||
| Year 2009 origination |
2% | 3% | 3% | 3% | 4% | 4% | 5% | 5% | ||||||||||||||||||||||||
| Year 2008 origination |
0% | 0% | 0% | 0% | 0% | 0% | 0% | 0% | ||||||||||||||||||||||||
| Year 2007 origination |
2% | 2% | 2% | 2% | 2% | 2% | 2% | 2% | ||||||||||||||||||||||||
| Year 2006 origination |
5% | 5% | 5% | 4% | 4% | 5% | 5% | 5% | ||||||||||||||||||||||||
| Year 2005 origination |
4% | 4% | 3% | 3% | 3% | 3% | 4% | 4% | ||||||||||||||||||||||||
| Year 2004 origination or earlier |
66% | 68% | 66% | 66% | 68% | 75% | 77% | 79% | ||||||||||||||||||||||||
| Wtd Avg Original LTV |
66% | 66% | 66% | 66% | 66% | 66% | 66% | 66% | ||||||||||||||||||||||||
| Original LTV: 0 - 50 |
18% | 19% | 19% | 19% | 20% | 19% | 19% | 19% | ||||||||||||||||||||||||
| Original LTV: 50 - 60 |
12% | 13% | 13% | 13% | 13% | 13% | 13% | 12% | ||||||||||||||||||||||||
| Original LTV: 60 - 70 |
22% | 22% | 22% | 22% | 21% | 21% | 21% | 21% | ||||||||||||||||||||||||
| Original LTV: 70 - 80 |
42% | 41% | 41% | 40% | 40% | 40% | 40% | 41% | ||||||||||||||||||||||||
| Original LTV: 80 - 90 |
2% | 2% | 2% | 2% | 2% | 2% | 2% | 2% | ||||||||||||||||||||||||
| Original LTV: 90 - 100 |
4% | 4% | 4% | 4% | 4% | 5% | 5% | 5% | ||||||||||||||||||||||||
| Wtd Avg FICO |
740 | 739 | 740 | 740 | 739 | 736 | 735 | 734 | ||||||||||||||||||||||||
| FICO: <= 600 |
0% | 0% | 0% | 0% | 1% | 1% | 1% | 1% | ||||||||||||||||||||||||
| FICO: 601 - 620 |
1% | 1% | 1% | 1% | 1% | 1% | 1% | 1% | ||||||||||||||||||||||||
| FICO: 621 - 640 |
1% | 1% | 1% | 1% | 2% | 2% | 2% | 2% | ||||||||||||||||||||||||
| FICO: 641 -660 |
3% | 3% | 3% | 3% | 3% | 3% | 3% | 3% | ||||||||||||||||||||||||
| FICO: 661 - 680 |
6% | 6% | 6% | 6% | 6% | 7% | 7% | 7% | ||||||||||||||||||||||||
| FICO: 681 - 700 |
9% | 10% | 9% | 9% | 9% | 10% | 10% | 11% | ||||||||||||||||||||||||
| FICO: 701 - 720 |
12% | 12% | 12% | 12% | 12% | 12% | 13% | 13% | ||||||||||||||||||||||||
| FICO: 721 - 740 |
12% | 13% | 12% | 12% | 12% | 13% | 13% | 13% | ||||||||||||||||||||||||
| FICO: 741 - 760 |
14% | 14% | 14% | 14% | 14% | 14% | 14% | 14% | ||||||||||||||||||||||||
| FICO: 761 - 780 |
18% | 18% | 18% | 19% | 18% | 18% | 17% | 17% | ||||||||||||||||||||||||
| FICO: 781 - 800 |
18% | 17% | 17% | 18% | 17% | 15% | 15% | 14% | ||||||||||||||||||||||||
| FICO: >= 801 |
5% | 5% | 6% | 5% | 5% | 4% | 4% | 4% | ||||||||||||||||||||||||
| Conforming balance % (2) |
42% | 43% | 42% | 41% | 42% | 49% | 50% | 51% | ||||||||||||||||||||||||
| % balance in loans > $1mm per loan |
19% | 20% | 22% | 22% | 22% | 20% | 20% | 20% | ||||||||||||||||||||||||
| 2nd home % |
10% | 11% | 10% | 11% | 11% | 11% | 11% | 12% | ||||||||||||||||||||||||
| Investment home % |
3% | 3% | 3% | 3% | 3% | 3% | 3% | 4% | ||||||||||||||||||||||||
| Purchase |
34% | 33% | 33% | 33% | 33% | 32% | 31% | 31% | ||||||||||||||||||||||||
| Cash out refinance |
28% | 28% | 28% | 28% | 29% | 31% | 33% | 33% | ||||||||||||||||||||||||
| Rate-term refinance |
37% | 37% | 38% | 38% | 37% | 36% | 35% | 35% | ||||||||||||||||||||||||
| Other
|
1% | 1% | 1% | 1% | 1% | 1% | 1% | 1% | ||||||||||||||||||||||||
(1) This table presents characteristics of residential loans held by consolidated Sequoia entities and residential loans held by Redwood and intended to be securitized by future Sequoia entities or sold to third parties.
(2) The definition of a conforming loan has significantly changed over time. For Q3 2011 and subsequent periods, the conforming balance definition that went into effect on October 1, 2011 was used (which had a maximum loan balance of $625,500). For all periods prior to Q3 2011, the conforming balance definition available in June 2011 was used (which had a maximum loan balance of $729,750).
| THE REDWOOD REVIEW 3RD QUARTER 2012
|
Table 9: Residential Loan Characteristics | |||
|
|
Table 10: Commercial Loan Characteristics(1) ($ in thousands) | |||
| 2012 Q3 |
2012 Q2 |
2012 Q1 |
2011 Q4 |
2011 Q3 |
2011 Q2 | 2011 Q1 | 2010 Q4 | |||||||||||||||||||||||||
| Commercial loans principal balance |
$ | 291,595 | $ | 251,686 | $ | 182,803 | $ | 158,847 | $ | 158,846 | $ | 98,600 | $ | 71,651 | $ | 42,953 | ||||||||||||||||
| Number of loans |
31 | 27 | 19 | 15 | 16 | 12 | 9 | 6 | ||||||||||||||||||||||||
| Average loan balance |
$ | 9,406 | $ | 9,322 | $ | 9,621 | $ | 9,928 | $ | 9,928 | $ | 8,217 | $ | 7,961 | $ | 7,159 | ||||||||||||||||
| Fixed % |
87% | 94% | 92% | 91% | 91% | 100% | 100% | 100% | ||||||||||||||||||||||||
| Hybrid % |
13% | 6% | 8% | 9% | 9% | 0% | 0% | 0% | ||||||||||||||||||||||||
| Amortizing % |
10% | 16% | 16% | 19% | 19% | 14% | 1% | 1% | ||||||||||||||||||||||||
| Interest-only % |
90% | 84% | 84% | 81% | 81% | 86% | 99% | 99% | ||||||||||||||||||||||||
| New York |
24% | 25% | 17% | 16% | 16% | 19% | 26% | 43% | ||||||||||||||||||||||||
| California |
22% | 18% | 20% | 21% | 21% | 18% | 10% | 1% | ||||||||||||||||||||||||
| Illinois |
11% | 13% | 18% | 21% | 21% | 12% | 17% | 28% | ||||||||||||||||||||||||
| Florida |
11% | 12% | 13% | 4% | 4% | 6% | 8% | 14% | ||||||||||||||||||||||||
| Michigan |
6% | 7% | 7% | 8% | 8% | 13% | 0% | 0% | ||||||||||||||||||||||||
| Texas |
5% | 6% | 5% | 2% | 2% | 4% | 0% | 0% | ||||||||||||||||||||||||
| North Carolina |
4% | 4% | 0% | 0% | 0% | 0% | 0% | 0% | ||||||||||||||||||||||||
| Delaware |
3% | 4% | 0% | 0% | 0% | 0% | 0% | 0% | ||||||||||||||||||||||||
| Washington |
3% | 0% | 0% | 0% | 0% | 0% | 0% | 0% | ||||||||||||||||||||||||
| Other |
11% | 11% | 20% | 28% | 28% | 28% | 39% | 14% | ||||||||||||||||||||||||
| Year 2012 origination |
48% | 38% | 15% | 0% | 0% | 0% | 0% | 0% | ||||||||||||||||||||||||
| Year 2011 origination |
42% | 50% | 68% | 81% | 81% | 69% | 57% | 28% | ||||||||||||||||||||||||
| Year 2010 origination |
10% | 12% | 17% | 19% | 19% | 31% | 43% | 71% | ||||||||||||||||||||||||
| Year 2004 origination |
<1% | <1% | <1% | <1% | <1% | <1% | <1% | 1% | ||||||||||||||||||||||||
| Office |
30% | 32% | 32% | 37% | 37% | 38% | 51% | 86% | ||||||||||||||||||||||||
| Multi-family |
28% | 22% | 23% | 14% | 14% | 14% | 14% | 14% | ||||||||||||||||||||||||
| Hospitality |
20% | 21% | 18% | 20% | 20% | 18% | 25% | 0% | ||||||||||||||||||||||||
| Retail |
16% | 18% | 25% | 29% | 29% | 30% | 10% | 0% | ||||||||||||||||||||||||
|
Self-storage
|
6% | 7% | 2% | 0% | 0% | 0% | 0% | 0% | ||||||||||||||||||||||||
(1) This table presents characteristics of commercial loans held-for-investment by Redwood.
| THE REDWOOD REVIEW 3RD QUARTER 2012
|
Table 10: Commercial Loan Characteristics |
53
| ||
REDWOOD TRUST CORPORATE INFORMATION
For more information about Redwood Trust, please visit our website at: www.redwoodtrust.com