Attached files
| file | filename |
|---|---|
| 8-K - FORM 8-K - Kraton Corp | v327121_8k.htm |

KRATON PERFORMANCE POLYMERS, INC. THIRD QUARTER 2012 EARNINGS CONFERENCE CALL November 1, 2012

KRATON Third Quarter 2012 Earnings Call This presentation includes forward-looking statements that reflect our plans, beliefs, expectations and current views with respect to, among other things, future events and financial performance. Forward-looking statements are often characterized by the use of words such as “outlook,”“believes,”“estimates,”“expects,”“projects,”“may,”“intends,”“plans”or “anticipates,”or by discussions of strategy, plans or intentions, including statements regarding our plans and ability to expand HSBC capacity in Asia, projected gross profit impact and FIFO to ECRC spreads and expectations regarding monomer pricing. All forward-looking statements in this presentation are made based on management's current expectations and estimates, which involve known and unknown risks, uncertainties and other important factors that could cause actual results to differ materially from those expressed in forward-looking statements. These risks and uncertainties are more fullydescribed in in our latest Annual Report on Form 10-K, as subsequently amended on March 8, 2012, including but not limited to “Part I, Item 1A. Risk Factors”and “Part I, Item 7. Management’s Discussion and Analysis of Financial Condition and Results of Operations”therein, and in our other filings with the Securities and Exchange Commission, and include, but are not limited to, risks related to: conditions in the global economy and capital markets; declines in raw material costs; our reliance on LyondellBasell Industries for the provision of significant operating and other services; the failure of our raw materials suppliers to perform their obligations under long-term supply agreements, or our inability to replace or renew these agreements when they expire; limitations in the availability of raw materials we need to produce our products in the amounts or at the prices necessary for us to effectively and profitably operate our business; competition in our end-use markets, from other producers of SBCs and from producers of products that can be substituted for our products; our ability to produce and commercialize technological innovations; our ability to protect our intellectual property, on which our business is substantially dependent; the possibility that our products infringe on the intellectual property rights of others; significant fluctuation in raw material costs may result in volatility in our quarterlyresults; seasonality in our business, particularly for Paving and Roofing end uses; our substantial indebtedness, which could adversely affect our financial condition and prevent us from fulfilling our obligations under the senior secured credit agreement and the senior notes; financial and operating constraints related to our indebtedness; the inherently hazardous nature of chemical manufacturing; product liability claims and other lawsuits arising from environmental damage, personal injuries or other damage associated with chemical manufacturing; political, economic and local business risks in the various countries in which we operate; health, safety and environmental laws, including laws that govern our employees’exposure to chemicals deemed harmful to humans; regulation of our company or our customers, which could affect the demand for our products or result in increased compliance costs; customs, international trade, export control, antitrust, zoning and occupancy and labor and employment laws that could require us to modify our current business practices and incur increased costs; fluctuations in currency exchange rates; our plan to expand hydrogenated styrenic block copolymer capacity in Asia on a stand-alone basis; our relationship with our employees; loss of key personnel or our inability to attract and retain new qualified personnel; the fact that we typically do not enter into long-term contracts with our customers; a decrease in the fair value of our pension assets, which could require us to materially increase future funding of the pension plan; Delaware law and some provisions of our organizational documents makea takeover of our company more difficult; our expectation that we will not pay dividends for the foreseeable future; our status as a holding company dependent on dividends from our subsidiaries; other risks, factors and uncertainties described in this press release and our other reports and documents; and other factors of which we are currently unaware or deem immaterial. Readers are cautioned not to place undue reliance on forward-looking statements. Forward-looking statements speak only as of the date they are made, and we assume no obligation to update such information in light of new information or future events. Further information concerning issues that could materially affect financial performance related to forward-looking statements can be found in Kraton’s periodic filings with the Securities and Exchange Commission. Forward-Looking Statement Disclaimer 2
KRATON Third Quarter 2012 Earnings Call GAAP Disclaimer This presentation includes the use of both GAAP and non-GAAP financial measures. The non-GAAP financial measures are EBITDA, Adjusted EBITDA, and Adjusted EBITDA at ECRC and Gross Profit at ECRC. A table included in this presentation reconciles each of these non-GAAP financial measures with the most directly comparable GAAP financial measure. We consider these non-GAAP financial measures important supplemental measures of our performance and believe they are frequently used by investors, securities analysts and other interested parties in the evaluation of our performance and/or that of other companies in our industry. Further, management uses these measures to evaluate operating performance, and; our executive compensation plan bases incentive compensation payments on our Adjusted EBITDA performance. These non-GAAP financial measures have limitations as analytical tools, and youshould not consider them in isolation, or as a substitute for analysis of our results under GAAP in the United States. For EBIDTA, these limitations include: EBITDA does not reflect our cash expenditures, or future requirements for capital expenditures or contractual commitments; EBITDA does not reflect changes in, or cash requirements for, our working capital needs;EBITDA does not reflect the significant interest expense, or the cash requirements necessary to service interest or principalpayments, on our debt; although depreciation and amortization are non-cash charges, the assets being depreciated and amortized will often have to be replaced in the future, and EBITDA does not reflect any cash requirements for such replacements; EBITDA calculations under the terms of our debt agreements may vary from EBITDA presented herein, and our presentation of EBITDA herein is not for purposes of assessing compliance or non-compliance with financial covenants under our credit agreement; and other companies in our industry may calculate EBITDA differently from how we do, limiting its usefulness as a comparative measure. As an analytical tool, Adjusted EBITDA is subject to all the limitations applicable to EBITDA. In addition, we prepare Adjusted EBITDA by adjusting EBITDA to eliminate the impact of a number of items we do not consider indicative of our on-going performance, but you should be aware that in the future we may incur expenses similar to the adjustments in this presentation. Our presentation of Adjusted EBITDA should not be construed as an inference that our future results will be unaffected by unusual or non-recurring items. As an analytical tool, Adjusted EBITDA at ECRC is subject to all the limitations applicable to EBITDA, as well as the following limitations: due to volatility in raw material prices, Adjusted EBITDA at ECRC may, and often does, vary substantially from EBITDA and other performance measures, including net income calculated in accordance with GAAP; and Adjusted EBITDA at ECRC may, and often will, vary significantly from EBITDA calculations under the terms of our debt agreements and should not be used for assessing compliance or non-compliance with financial covenants under our credit agreement. Because of these and other limitations, EBITDA, Adjusted EBITDA and ECRC AdjustedEBITDA should not be considered as a measure of discretionary cash available to us to invest in the growth of our business. Finally, as a measure of our performance, Gross Profit at ECRC is limited because it often varies substantially from gross profit calculated in accordance with GAAP because of volatility in raw material prices. 3

KRATON Third Quarter 2012 Earnings Call Third Quarter 2012 Financial Summary ($ thousands, except volume and per share data) Q3’12 Q3’11 Change Sales volume (kT) 79 78 2% Sales revenue $ 342,635 $ 401,993 $ (59,358) Net income (loss) $ (15,499) $ 43,093 $ (58,592) Diluted EPS $ (0.48) $ 1.33 $ (1.81) Adjusted EBITDA (1) $ 13,210 $ 71,063 $ (57,853) Adjusted EBITDA at ECRC (1) $ 50,846 $ 38,975 $ 11,871 Net cash provided by (used in) operating activities $ 33,450 $ (10,693) $ 44,143 4 (1) See reconciliation of Net Income to EBITDA, Adjusted EBITDA andAdjusted EBITDA at ECRC in the attached appendix.

KRATON Third Quarter 2012 Earnings Call $102 $102 $94 Q3'11 Q2'12 Q3'12 Sales Revenue ($ Millions) End Use Review 5 Advanced Materials Q3’12 vs. Q3’11 Q3’12 vs. Q3’11 Q3’12 vs. Q2’12 Q3’12 vs. Q3’11 - 8% - 8% Change in Sales Revenue Q3’12 vs. Q2’12 Q3’12 vs. Q3’11 $142 $135 $117 Q3'11 Q2'12 Q3'12 Sales Revenue ($ Millions) - 18% - 13% Change in Sales Revenue Adhesives, Sealants & Coatings ▪ Sales volume increased ▪ Average selling price declined, driven by reductions in monomer pricing, primarily butadiene ▪ Negative impact of currency movements ▪ Sales volume decreased, primarily due to timing of lubricant additive sales ▪ Negative impact of currency movements ▪ Average selling price declined, driven by reductions in monomer pricing, primarily butadiene
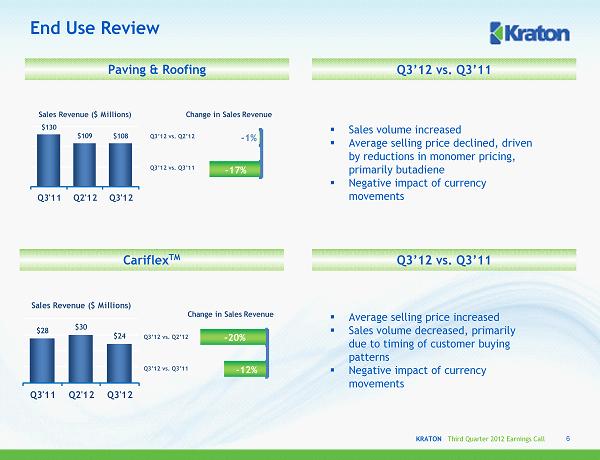
KRATON Third Quarter 2012 Earnings Call End Use Review 6 Q3’12 vs. Q3’11 Paving & Roofing Q3’12 vs. Q3’11 Q3’12 vs. Q2’12 Q3’12 vs. Q3’11 $130 $109 $108 Q3'11 Q2'12 Q3'12 Sales Revenue ($ Millions) - 17% - 1% Change in Sales Revenue Cariflex TM Q3’12 vs. Q2’12 Q3’12 vs. Q3’11 $28 $30 $24 Q3'11 Q2'12 Q3'12 Sales Revenue ($ Millions) - 12% - 20% Change in Sales Revenue ▪ Sales volume increased ▪ Average selling price declined, driven by reductions in monomer pricing, primarily butadiene ▪ Negative impact of currency movements ▪ Average selling price increased ▪ Sales volume decreased, primarily due to timing of customer buying patterns ▪ Negative impact of currency movements
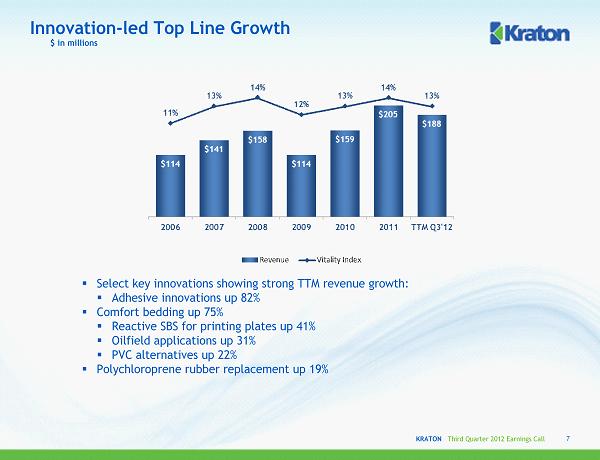
KRATON Third Quarter 2012 Earnings Call Innovation-led Top Line Growth ▪ Select key innovations showing strong TTM revenue growth: ▪ Adhesive innovations up 82% ▪ Comfort bedding up 75% ▪ Reactive SBS for printing plates up 41% ▪ Oilfield applications up 31% ▪ PVC alternatives up 22% ▪ Polychloroprene rubber replacement up 19% 7 $ in millions
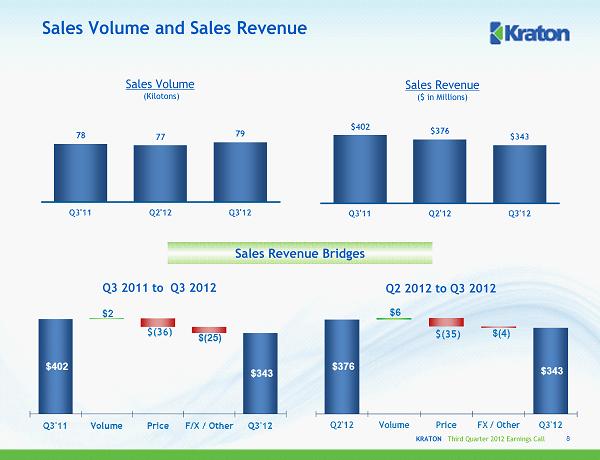
KRATON Third Quarter 2012 Earnings Call Sales Volume (Kilotons) Sales Volume and Sales Revenue Sales Revenue ($ in Millions) 8 Q3 2011 to Q3 2012 Q2 2012 to Q3 2012 Sales Revenue Bridges
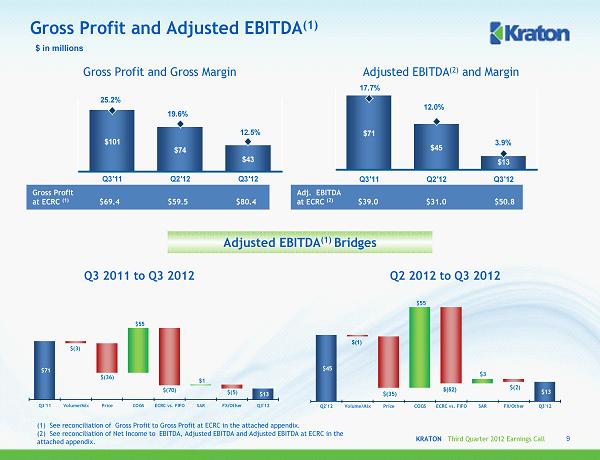
KRATON Third Quarter 2012 Earnings Call $71 $45 $13 17.7% 12.0% 3.9% 0 10 20 30 40 50 60 70 80 Q3'11 Q2'12 Q3'12 $101 $74 $43 25.2% 19.6% 12.5% 0 20 40 60 80 100 120 Q3'11 Q2'12 Q3'12 $71 $13 $(3) $(36) $55 $(70) $1 $(5) Q3'11 Volume/Mix Price COGS ECRC vs. FIFO SAR FX/Other Q3'12 Gross Profit and Adjusted EBITDA (1) Q2 2012 to Q3 2012 $ in millions Q3 2011 to Q3 2012 9 $45 $13 $3 $(1) $(35) $55 $(52) $(2) Q2'12 Volume/Mix Price COGS ECRC vs. FIFO SAR FX/Other Q3'12 Gross Profit and Gross Margin Adjusted EBITDA (2) and Margin Adjusted EBITDA (1) Bridges Gross Profit at ECRC (1) $69.4 $59.5 $80.4 Adj. EBITDA at ECRC (2) $39.0 $31.0 $50.8 (1) See reconciliation of Gross Profit to Gross Profit at ECRCin the attached appendix. (2) See reconciliation of Net Income to EBITDA, Adjusted EBITDA and Adjusted EBITDA at ECRC in the attached appendix.
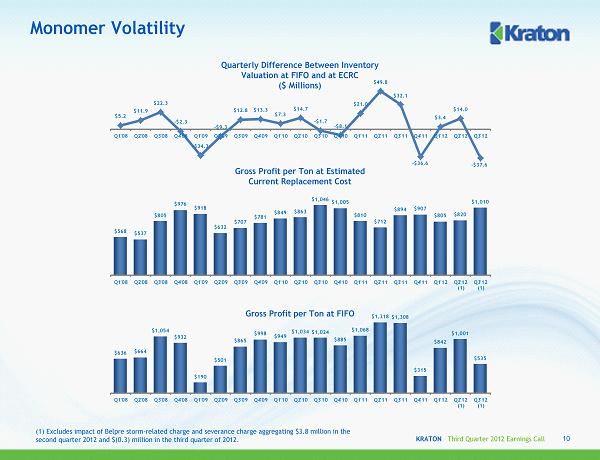
KRATON Third Quarter 2012 Earnings Call Monomer Volatility Quarterly Difference Between Inventory Valuation at FIFO and at ECRC ($ Millions) Gross Profit per Ton at Estimated Current Replacement Cost Gross Profit per Ton at FIFO 10 (1) Excludes impact of Belpre storm-related charge and severance charge aggregating $3.8 million in the second quarter 2012 and $(0.3) million in the third quarter of 2012. $5.2 $11.9 $22.3 - $2.3 - $34.3 - $9.3 $12.8 $13.3 $7.3 $14.7 - $1.7 - $8.1 $21.0 $49.8 $32.1 - $36.6 $3.4 $14.0 - $37.6 Q1'08 Q2'08 Q3'08 Q4'08 Q1'09 Q2'09 Q3'09 Q4'09 Q1'10 Q2'10 Q3'10 Q4'10 Q1'11 Q2'11 Q3'11 Q4'11 Q1'12 Q2'12 Q3'12 $568 $537 $805 $976 $918 $632 $707 $781 $849 $863 $1,046 $1,005 $810 $712 $894 $907 $805 $820 $1,010 Q1'08 Q2'08 Q3'08 Q4'08 Q1'09 Q2'09 Q3'09 Q4'09 Q1'10 Q2'10 Q3'10 Q4'10 Q1'11 Q2'11 Q3'11 Q4'11 Q1'12 Q2'12 (1) Q3'12 (1) $636 $664 $1,054 $932 $190 $501 $865 $998 $949 $1,034 $1,024 $885 $1,068 $1,318 $1,308 $315 $842 $1,001 $535 Q1'08 Q2'08 Q3'08 Q4'08 Q1'09 Q2'09 Q3'09 Q4'09 Q1'10 Q2'10 Q3'10 Q4'10 Q1'11 Q2'11 Q3'11 Q4'11 Q1'12 Q2'12 (1) Q3'12 (1)
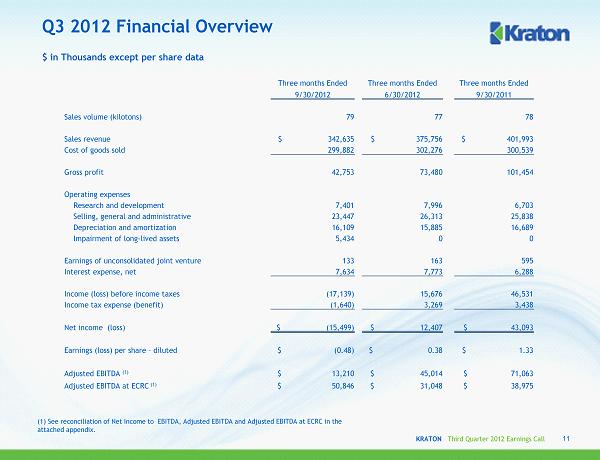
KRATON Third Quarter 2012 Earnings Call Q3 2012 Financial Overview $ in Thousands except per share data Three months Ended Three months Ended Three months Ended 9/30/2012 6/30/2012 9/30/2011 Sales volume (kilotons) 79 77 78 Sales revenue $ 342,635 $ 375,756 $ 401,993 Cost of goods sold 299,882 302,276 300,539 Gross profit 42,753 73,480 101,454 Operating expenses Research and development 7,401 7,996 6,703 Selling, general and administrative 23,447 26,313 25,838 Depreciation and amortization 16,109 15,885 16,689 Impairment of long-lived assets 5,434 0 0 Earnings of unconsolidated joint venture 133 163 595 Interest expense, net 7,634 7,773 6,288 Income (loss) before income taxes (17,139) 15,676 46,531 Income tax expense (benefit) (1,640) 3,269 3,438 Net income (loss) $ (15,499) $ 12,407 $ 43,093 Earnings (loss) per share –diluted $ (0.48) $ 0.38 $ 1.33 Adjusted EBITDA (1) $ 13,210 $ 45,014 $ 71,063 Adjusted EBITDA at ECRC (1) $ 50,846 $ 31,048 $ 38,975 11 (1) See reconciliation of Net Income to EBITDA, Adjusted EBITDA andAdjusted EBITDA at ECRC in the attached appendix.
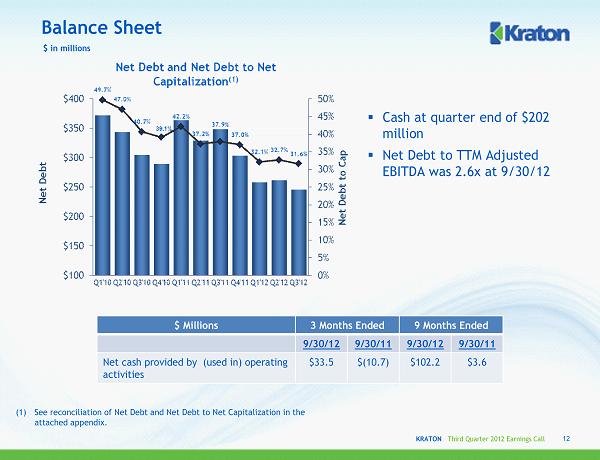
KRATON Third Quarter 2012 Earnings Call $ in millions ▪ Cash at quarter end of $202 million ▪ Net Debt to TTM Adjusted EBITDA was 2.6x at 9/30/12 (1) See reconciliation of Net Debt and Net Debt to Net Capitalization in the attached appendix. Balance Sheet 12 $ Millions 3 Months Ended 9 Months Ended 9/30/12 9/30/11 9/30/12 9/30/11 Net cash provided by (used in) operating activities $33.5 $(10.7) $102.2 $3.6
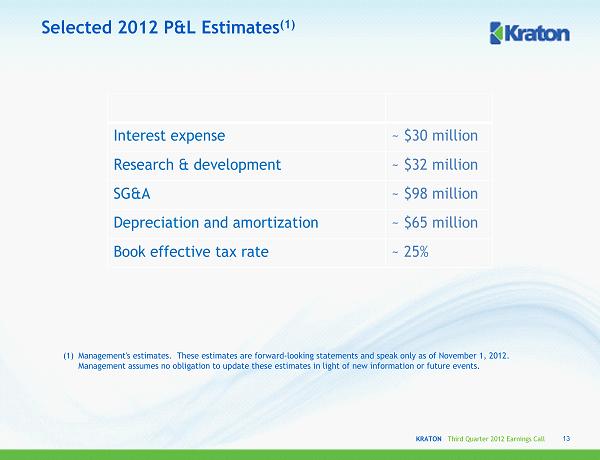
KRATON Third Quarter 2012 Earnings Call Selected 2012 P&L Estimates (1) (1) Management's estimates. These estimates are forward-looking statements and speak only as of November 1, 2012. Management assumes no obligation to update these estimates in light of new information or future events. 13 Interest expense ~ $30 million Research & development ~ $32 million SG&A ~ $98 million Depreciation and amortization ~ $65 million Book effective tax rate ~ 25%
APPENDIX November 1, 2012
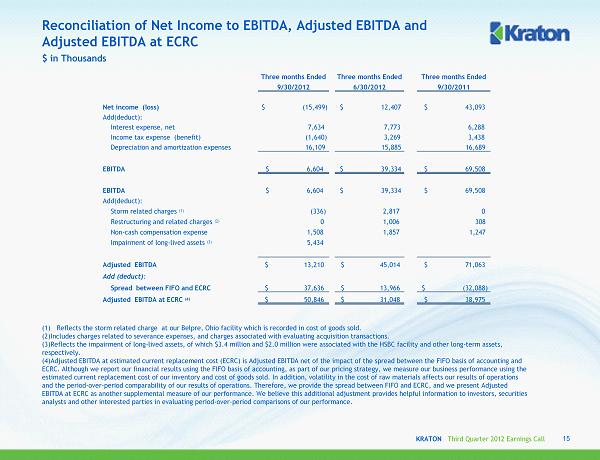
KRATON Third Quarter 2012 Earnings Call Reconciliation of Net Income to EBITDA, Adjusted EBITDA and Adjusted EBITDA at ECRC (1) Reflects the storm related charge at our Belpre, Ohio facility which is recorded in cost of goods sold. (2)Includes charges related to severance expenses, and charges associated with evaluating acquisition transactions. (3)Reflects the impairment of long-lived assets, of which $3.4 million and $2.0 million were associated with the HSBC facility and other long-term assets, respectively. (4)Adjusted EBITDA at estimated current replacement cost (ECRC) is Adjusted EBITDA net of the impact of the spread between the FIFObasis of accounting and ECRC. Although we report our financial results using the FIFO basis ofaccounting, as part of our pricing strategy, we measure our business performance using the estimated current replacement cost of our inventory and cost of goods sold. In addition, volatility in the cost of raw materialsaffects our results of operations and the period-over-period comparability of our results of operations. Therefore, weprovide the spread between FIFO and ECRC, and we present Adjusted EBITDA at ECRC as another supplemental measure of our performance. We believe this additional adjustment provides helpful information to investors, securities analysts and other interested parties in evaluating period-over-period comparisons of our performance. $ in Thousands 15 Three months Ended Three months Ended Three months Ended 9/30/2012 6/30/2012 9/30/2011 Net income (loss) $ (15,499) $ 12,407 $ 43,093 Add(deduct): Interest expense, net 7,634 7,773 6,288 Income tax expense (benefit) (1,640) 3,269 3,438 Depreciation and amortization expenses 16,109 15,885 16,689 EBITDA $ 6,604 $ 39,334 $ 69,508 EBITDA $ 6,604 $ 39,334 $ 69,508 Add(deduct): Storm related charges (1) (336) 2,817 0 Restructuring and related charges (2) 0 1,006 308 Non-cash compensation expense 1,508 1,857 1,247 Impairment of long-lived assets (3) 5,434 Adjusted EBITDA $ 13,210 $ 45,014 $ 71,063 Add (deduct): Spread between FIFO and ECRC $ 37,636 $ 13,966 $ (32,088) Adjusted EBITDA at ECRC (4) $ 50,846 $ 31,048 $ 38,975
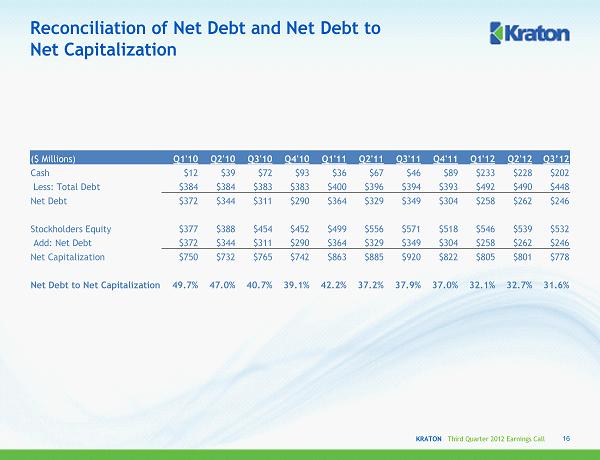
KRATON Third Quarter 2012 Earnings Call Reconciliation of Net Debt and Net Debt to Net Capitalization 16 ($ Millions) Q1'10 Q2'10 Q3'10 Q4'10 Q1'11 Q2'11 Q3'11 Q4'11 Q1'12 Q2'12 Q3’12 Cash $12 $39 $72 $93 $36 $67 $46 $89 $233 $228 $202 Less: Total Debt $384 $384 $383 $383 $400 $396 $394 $393 $492 $490 $448 Net Debt $372 $344 $311 $290 $364 $329 $349 $304 $258 $262 $246 Stockholders Equity $377 $388 $454 $452 $499 $556 $571 $518 $546 $539 $532 Add: Net Debt $372 $344 $311 $290 $364 $329 $349 $304 $258 $262 $246 Net Capitalization $750 $732 $765 $742 $863 $885 $920 $822 $805 $801 $778 Net Debt to Net Capitalization 49.7% 47.0% 40.7% 39.1% 42.2% 37.2% 37.9% 37.0% 32.1% 32.7% 31.6%
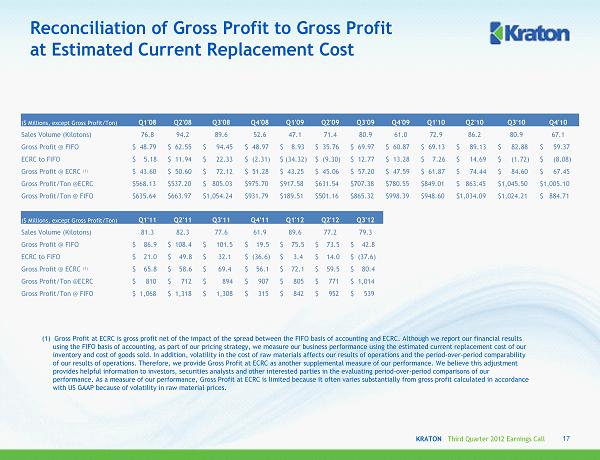
KRATON Third Quarter 2012 Earnings Call Reconciliation of Gross Profit to Gross Profit at Estimated Current Replacement Cost 17 ($ Millions, except Gross Profit/Ton) Q1'08 Q2'08 Q3'08 Q4'08 Q1'09 Q2'09 Q3'09 Q4'09 Q1'10 Q2'10 Q3'10 Q4'10 Sales Volume (Kilotons) 76.8 94.2 89.6 52.6 47.1 71.4 80.9 61.0 72.9 86.2 80.9 67.1 Gross Profit @ FIFO $ 48.79 $ 62.55 $ 94.45 $ 48.97 $ 8.93 $ 35.76 $ 69.97 $ 60.87 $ 69.13 $ 89.13 $ 82.88 $ 59.37 ECRC to FIFO $ 5.18 $ 11.94 $ 22.33 $ (2.31) $ (34.32) $ (9.30) $ 12.77 $ 13.28 $ 7.26 $ 14.69 $ (1.72) $ (8.08) Gross Profit @ ECRC (1) $ 43.60 $ 50.60 $ 72.12 $ 51.28 $ 43.25 $ 45.06 $ 57.20 $ 47.59 $ 61.87 $ 74.44 $ 84.60 $ 67.45 Gross Profit/Ton @ECRC $568.13 $537.20 $ 805.03 $975.70 $917.58 $631.54 $707.38 $780.55 $849.01 $ 863.45 $1,045.50 $1,005.10 Gross Profit/Ton @ FIFO $635.64 $663.97 $1,054.24 $931.79 $189.51 $501.16 $865.32 $998.39 $948.60 $1,034.09 $1,024.21 $ 884.71 ($ Millions, except Gross Profit/Ton) Q1'11 Q2'11 Q3'11 Q4'11 Q1'12 Q2'12 Q3'12 Sales Volume (Kilotons) 81.3 82.3 77.6 61.9 89.6 77.2 79.3 Gross Profit @ FIFO $ 86.9 $ 108.4 $ 101.5 $ 19.5 $ 75.5 $ 73.5 $ 42.8 ECRC to FIFO $ 21.0 $ 49.8 $ 32.1 $ (36.6) $ 3.4 $ 14.0 $ (37.6) Gross Profit @ ECRC (1) $ 65.8 $ 58.6 $ 69.4 $ 56.1 $ 72.1 $ 59.5 $ 80.4 Gross Profit/Ton @ECRC $ 810 $ 712 $ 894 $ 907 $ 805 $ 771 $ 1,014 Gross Profit/Ton @ FIFO $ 1,068 $ 1,318 $ 1,308 $ 315 $ 842 $ 952 $ 539 (1) Gross Profit at ECRC is gross profit net of the impact of the spread between the FIFO basis of accounting and ECRC. Although we report our financial results using the FIFO basis of accounting, as part of our pricing strategy, we measure our business performance using the estimated current replacement cost of our inventory and cost of goods sold. In addition, volatility in thecost of raw materials affects our results of operations and theperiod-over-period comparability of our results of operations. Therefore, we provide Gross Profitat ECRC as another supplemental measure of our performance. We believe this adjustment provides helpful information to investors, securities analysts and other interested parties in the evaluating period-over-period comparisons of our performance. As a measure of our performance, Gross Profit at ECRC is limited because it often varies substantially from gross profit calculated in accordance with US GAAP because of volatility in raw material prices.
KRATON PERFORMANCE POLYMERS, INC. THIRD QUARTER 2012 EARNINGS CONFERENCE CALL November 1, 2012