Attached files
| file | filename |
|---|---|
| EX-99.01 - EXHIBIT 99.01 - GLU MOBILE INC | a50462228ex99-01.htm |
| 8-K - GLU MOBILE INC. 8-K - GLU MOBILE INC | a50462228.htm |
Exhibit 99.02

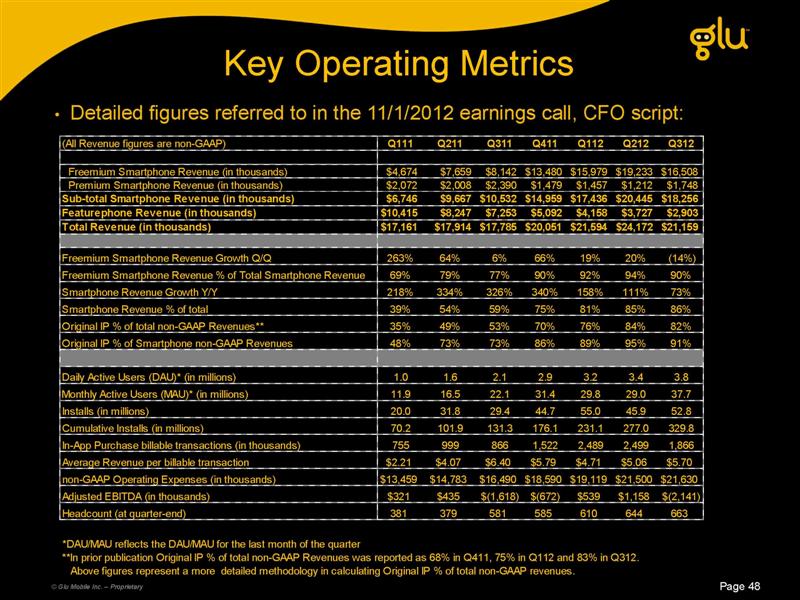
Glu Mobile Q312 Earnings Call November 1, 2012
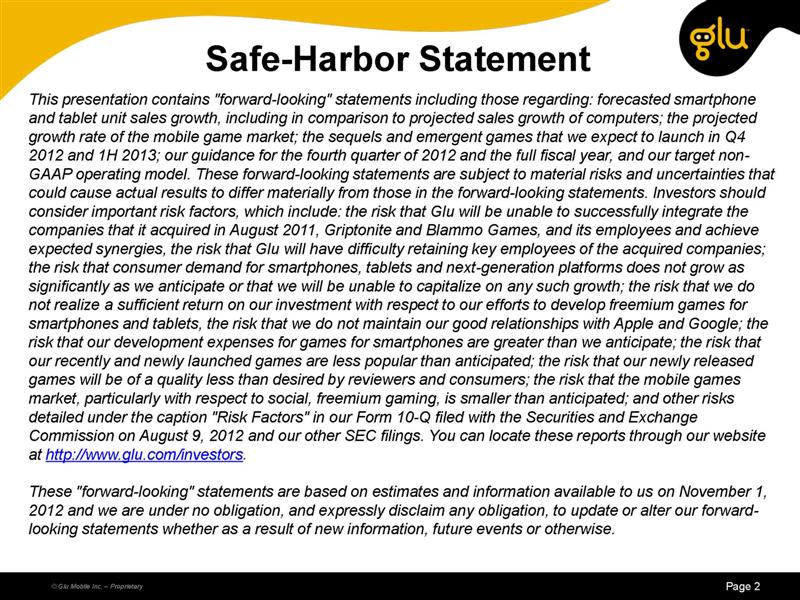
Safe-Harbor Statement This presentation contains "forward-looking" statements including those regarding: forecasted smartphone and tablet unit sales growth, including in comparison to projected sales growth of computers; the projected growth rate of the mobile game market; the sequels and emergent games that we expect to launch in Q4 2012 and 1H 2013; our guidance for the fourth quarter of 2012 and the full fiscal year, and our target non-GAAP operating model. These forward-looking statements are subject to material risks and uncertainties that could cause actual results to differ materially from those in the forward-looking statements. Investors should consider important risk factors, which include: the risk that Glu will be unable to successfully integrate the companies that it acquired in August 2011, Griptonite and Blammo Games, and its employees and achieve expected synergies, the risk that Glu will have difficulty retaining key employees of the acquired companies; the risk that consumer demand for smartphones, tablets and next-generation platforms does not grow as significantly as we anticipate or that we will be unable to capitalize on any such growth; the risk that we do not realize a sufficient return on our investment with respect to our efforts to develop freemium games for smartphones and tablets, the risk that we do not maintain our good relationships with Apple and Google; the risk that our development expenses for games for smartphones are greater than we anticipate; the risk that our recently and newly launched games are less popular than anticipated; the risk that our newly released games will be of a quality less than desired by reviewers and consumers; the risk that the mobile games market, particularly with respect to social, freemium gaming, is smaller than anticipated; and other risks detailed under the caption "Risk Factors" in our Form 10-Q filed with the Securities and Exchange Commission on August 9, 2012 and our other SEC filings. You can locate these reports through our website at http://www.glu.com/investors. These "forward-looking" statements are based on estimates and information available to us on November 1, 2012 and we are under no obligation, and expressly disclaim any obligation, to update or alter our forward-looking statements whether as a result of new information, future events or otherwise.
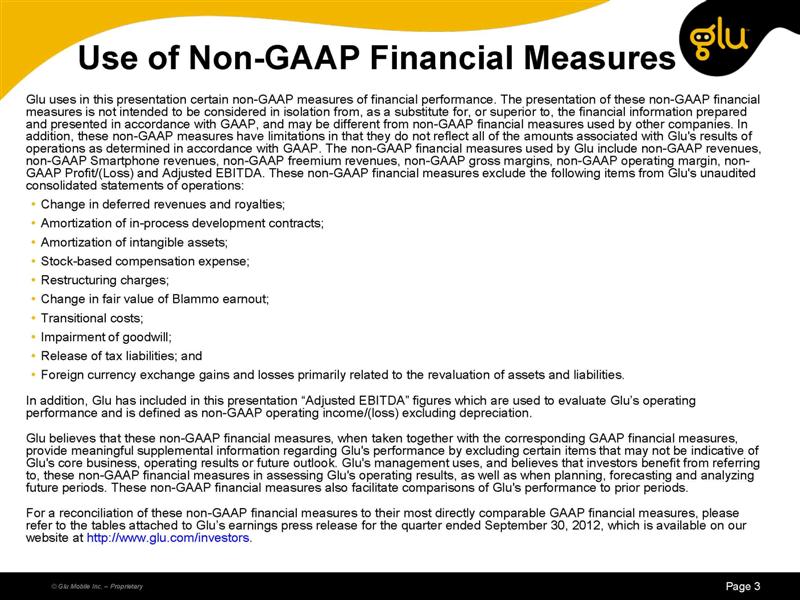
Use of Non-GAAP Financial Measures Glu uses in this presentation certain non-GAAP measures of financial performance. The presentation of these non-GAAP financial measures is not intended to be considered in isolation from, as a substitute for, or superior to, the financial information prepared and presented in accordance with GAAP, and may be different from non-GAAP financial measures used by other companies. In addition, these non-GAAP measures have limitations in that they do not reflect all of the amounts associated with Glu's results of operations as determined in accordance with GAAP. The non-GAAP financial measures used by Glu include non-GAAP revenues, non-GAAP Smartphone revenues, non-GAAP freemium revenues, non-GAAP gross margins, non-GAAP operating margin, non-GAAP Profit/(Loss) and Adjusted EBITDA. These non-GAAP financial measures exclude the following items from Glu's unaudited consolidated statements of operations: Change in deferred revenues and royalties; Amortization of in-process development contracts; Amortization of intangible assets; Stock-based compensation expense; Restructuring charges; Change in fair value of Blammo earnout; Transitional costs; Impairment of goodwill; Release of tax liabilities; and Foreign currency exchange gains and losses primarily related to the revaluation of assets and liabilities. In addition, Glu has included in this presentation “Adjusted EBITDA” figures which are used to evaluate Glu’s operating performance and is defined as non-GAAP operating income/(loss) excluding depreciation. Glu believes that these non-GAAP financial measures, when taken together with the corresponding GAAP financial measures, provide meaningful supplemental information regarding Glu's performance by excluding certain items that may not be indicative of Glu's core business, operating results or future outlook. Glu's management uses, and believes that investors benefit from referring to, these non-GAAP financial measures in assessing Glu's operating results, as well as when planning, forecasting and analyzing future periods. These non-GAAP financial measures also facilitate comparisons of Glu's performance to prior periods. For a reconciliation of these non-GAAP financial measures to their most directly comparable GAAP financial measures, please refer to the tables attached to Glu’s earnings press release for the quarter ended September 30, 2012, which is available on our website at http://www.glu.com/investors.

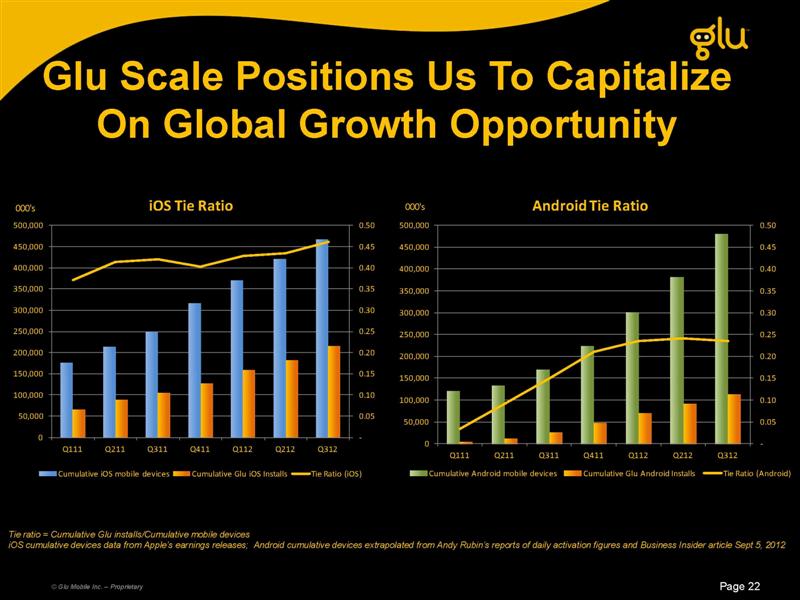
Growth Opportunity
Leading Freemium Social Mobile Gaming Company Intersection of Two Rising Tides: 1) Growth in gaming on mobile devices 2) Growth in freemium gaming
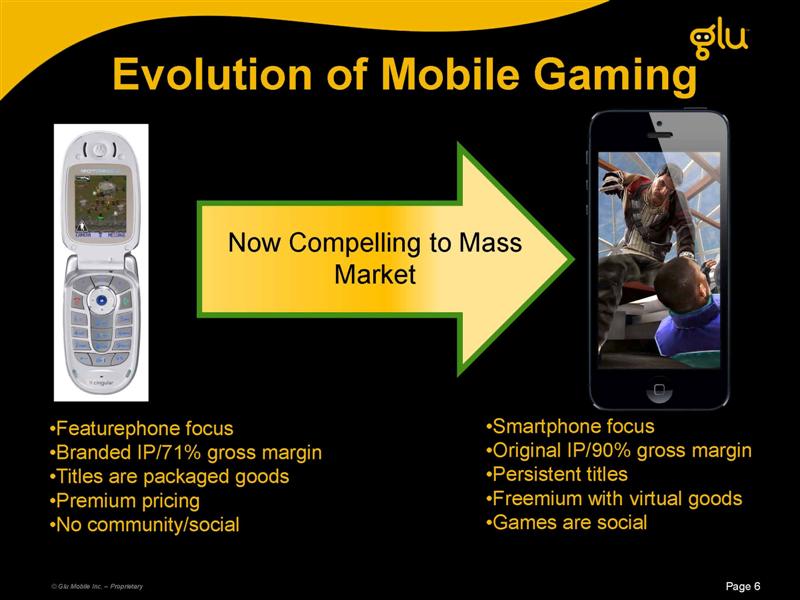
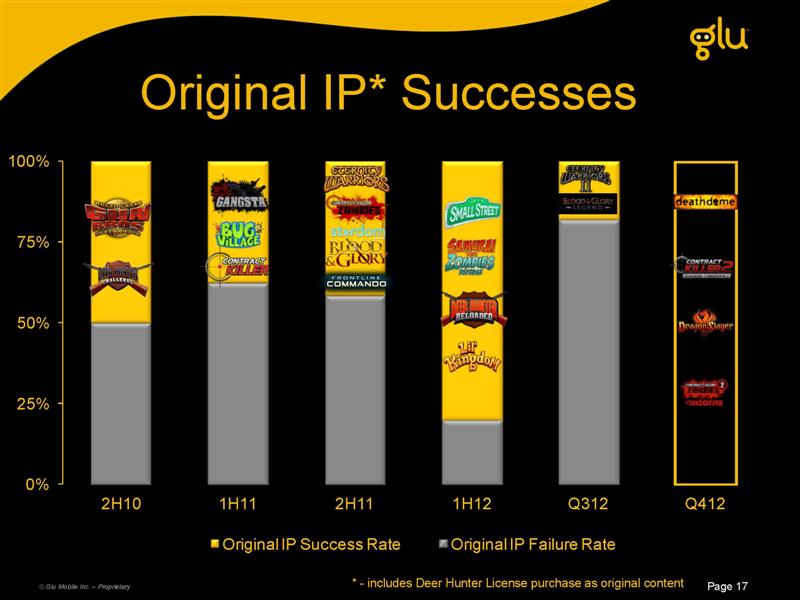
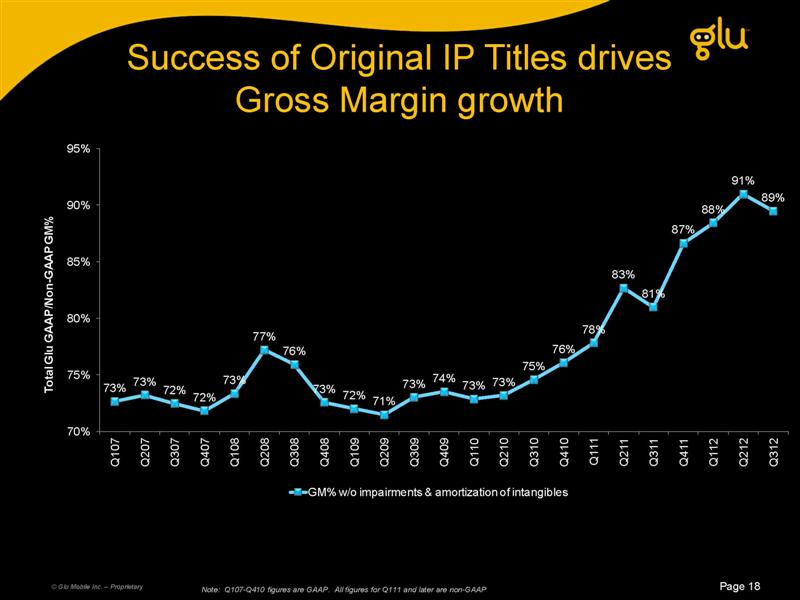
Evolution of Mobile Gaming Now Compelling to Mass Market Featurephone focus Branded IP/71% gross margin Titles are packaged goods Premium pricing No community/social Smartphone focus Original IP/90% gross margin Persistent titles Freemium with virtual goods Games are social
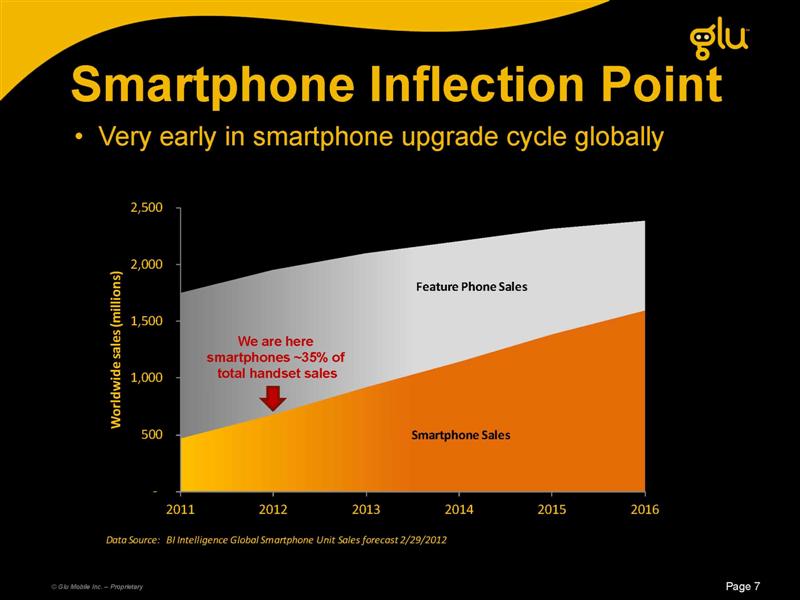
Smartphone Inflection Point Very early in smartphone upgrade cycle globally 500 1,000 1,500 2,000 2,500 2011 2012 2013 2014 2015 2016 Worldwide sales (millions) We are here smartphones ~35% of total handset sales Smartphone Sales Feature Phone Sales Data Source:BI Intelligence Global Smartphone Unit Sales forecast 2/29/2012
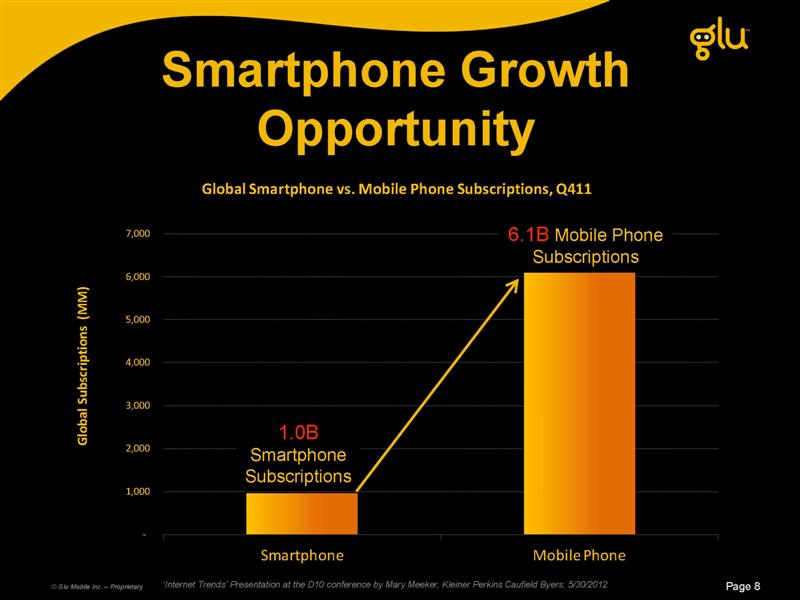
Smartphone Growth Opportunity ‘Internet Trends’ Presentation at the D10 conference by Mary Meeker, Kleiner Perkins Caufield Byers; 5/30/2012 1,000 2,000 3,000 4,000 5,000 6,000 7,000 Smartphone Mobile Phone Global Subscriptions (MM) Global Smartphone vs. Mobile Phone Subscriptions, Q411 1.0B Smartphone Subscriptions 6.1B Mobile Phone Subscriptions
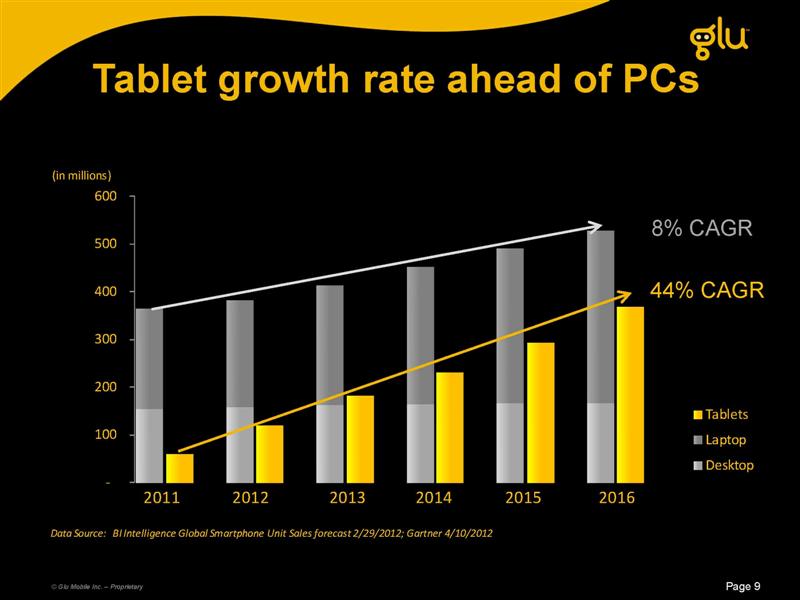
Tablet growth rate ahead of PCs (in millions) Data Source: BI Intelligence Global Smartphone Unit Sales forecast 2/29/2012; Gartner 4/10/2012 Tablets Laptop Desktop 8% CAGR 44% CAGR 100 200 300 400 500 600 2011 2012 2013 2014 2015 2016
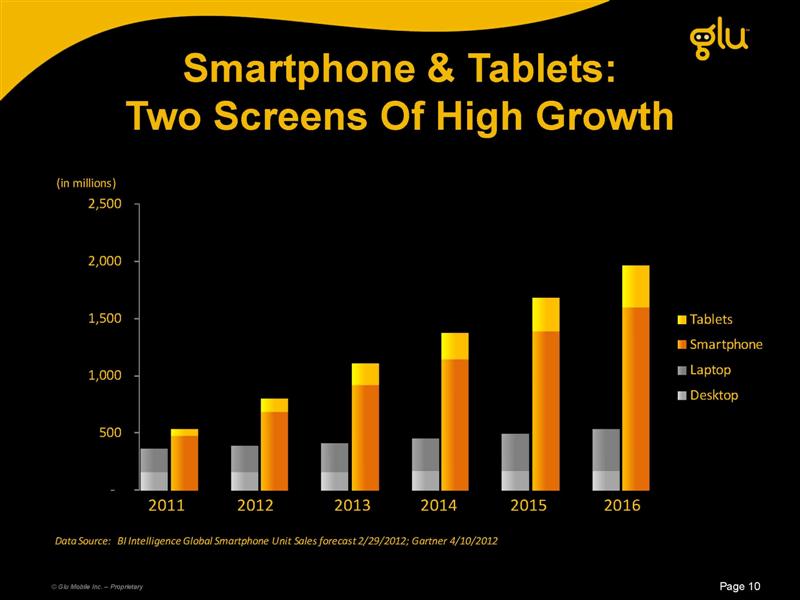
Smartphone & Tablets: Two Screens Of High Growth (in millions) 500 1,000 1,500 2,000 2,500 2011 2012 2013 2014 2015 2016 Tablets Laptop Desktop Smartphone Data Source: BI Intelligence Global Smartphone Unit Sales forecast 2/29/2012; Gartner 4/10/2012
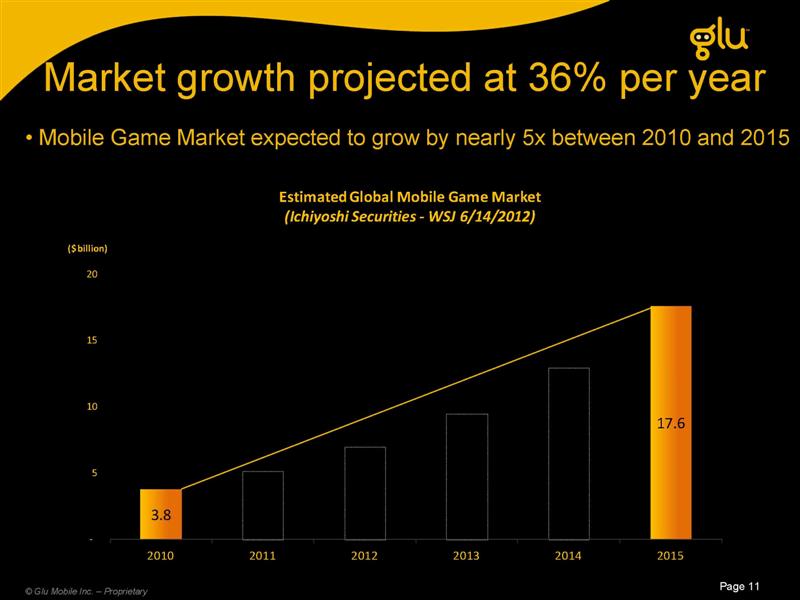
Market growth projected at 36% per year Mobile Game Market expected to grow by nearly 5x between 2010 and 2015 Estimated Global Mobile Game Market (Ichiyoshi Securities -WSJ 6/14/2012) 5 10 15 20 ($billion) 2010 2011 2012 2013 2014 2015 3.8 17.6