Attached files
| file | filename |
|---|---|
| 8-K - 8-K - CoreSite Realty Corp | a12-25095_18k.htm |
| EX-99.1 - EX-99.1 - CoreSite Realty Corp | a12-25095_1ex99d1.htm |
Exhibit 99.2
|
|
Quarter Ended September 30, 2012 |
|
|
Table of Contents Overview: Earnings Release Company Profile Summary of Financial Data Financial Statements: Consolidated Balance Sheets Consolidated Statements of Operations Reconciliations of Net Income to FFO, AFFO and EBITDA Operating Portfolio: Operating Properties Leasing Statistics Geographic Diversification and 10 Largest Customers Development Summary and Capital Expenditures Capital Structure: Market Capitalization and Debt Summary Interest Summary and Debt Covenants 2012 Guidance Appendix 1 6 7 8 9 10 11 12 14 15 16 17 18 19 |
|
|
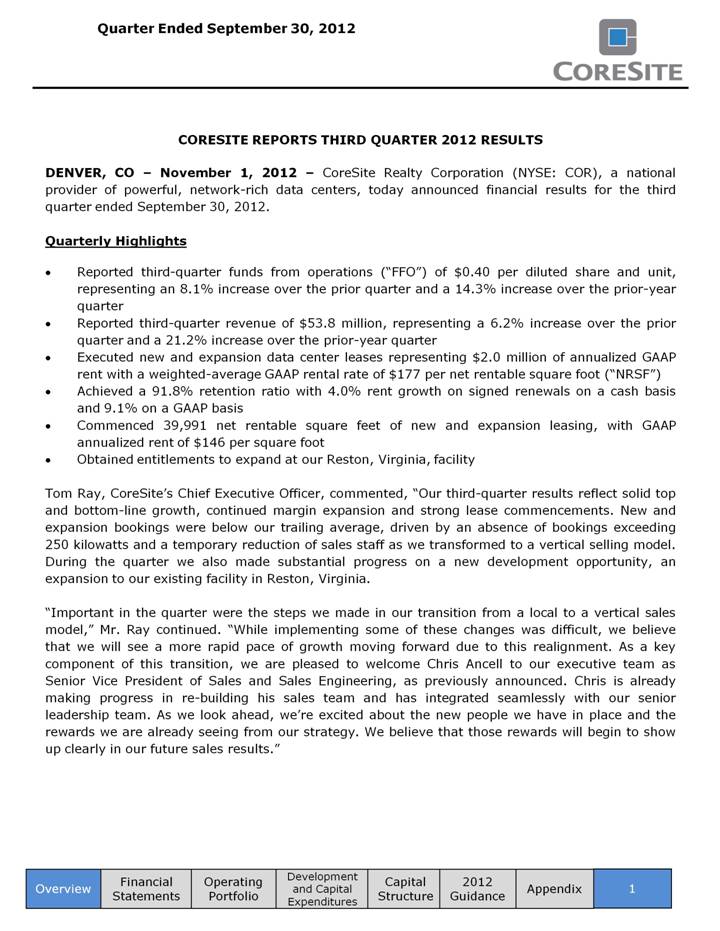
CORESITE REPORTS THIRD QUARTER 2012 RESULTS DENVER, CO – November 1, 2012 – CoreSite Realty Corporation (NYSE: COR), a national provider of powerful, network-rich data centers, today announced financial results for the third quarter ended September 30, 2012. Quarterly Highlights Reported third-quarter funds from operations (“FFO”) of $0.40 per diluted share and unit, representing an 8.1% increase over the prior quarter and a 14.3% increase over the prior-year quarter Reported third-quarter revenue of $53.8 million, representing a 6.2% increase over the prior quarter and a 21.2% increase over the prior-year quarter Executed new and expansion data center leases representing $2.0 million of annualized GAAP rent with a weighted-average GAAP rental rate of $177 per net rentable square foot (“NRSF”) Achieved a 91.8% retention ratio with 4.0% rent growth on signed renewals on a cash basis and 9.1% on a GAAP basis Commenced 39,991 net rentable square feet of new and expansion leasing, with GAAP annualized rent of $146 per square foot Obtained entitlements to expand at our Reston, Virginia, facility Tom Ray, CoreSite’s Chief Executive Officer, commented, “Our third-quarter results reflect solid top and bottom-line growth, continued margin expansion and strong lease commencements. New and expansion bookings were below our trailing average, driven by an absence of bookings exceeding 250 kilowatts and a temporary reduction of sales staff as we transformed to a vertical selling model. During the quarter we also made substantial progress on a new development opportunity, an expansion to our existing facility in Reston, Virginia. “Important in the quarter were the steps we made in our transition from a local to a vertical sales model,” Mr. Ray continued. “While implementing some of these changes was difficult, we believe that we will see a more rapid pace of growth moving forward due to this realignment. As a key component of this transition, we are pleased to welcome Chris Ancell to our executive team as Senior Vice President of Sales and Sales Engineering, as previously announced. Chris is already making progress in re-building his sales team and has integrated seamlessly with our senior leadership team. As we look ahead, we’re excited about the new people we have in place and the rewards we are already seeing from our strategy. We believe that those rewards will begin to show up clearly in our future sales results.” Overview Financial Statements Operating Portfolio Development and Capital Expenditures 1 Appendix Capital Structure 2012 Guidance |
|
|
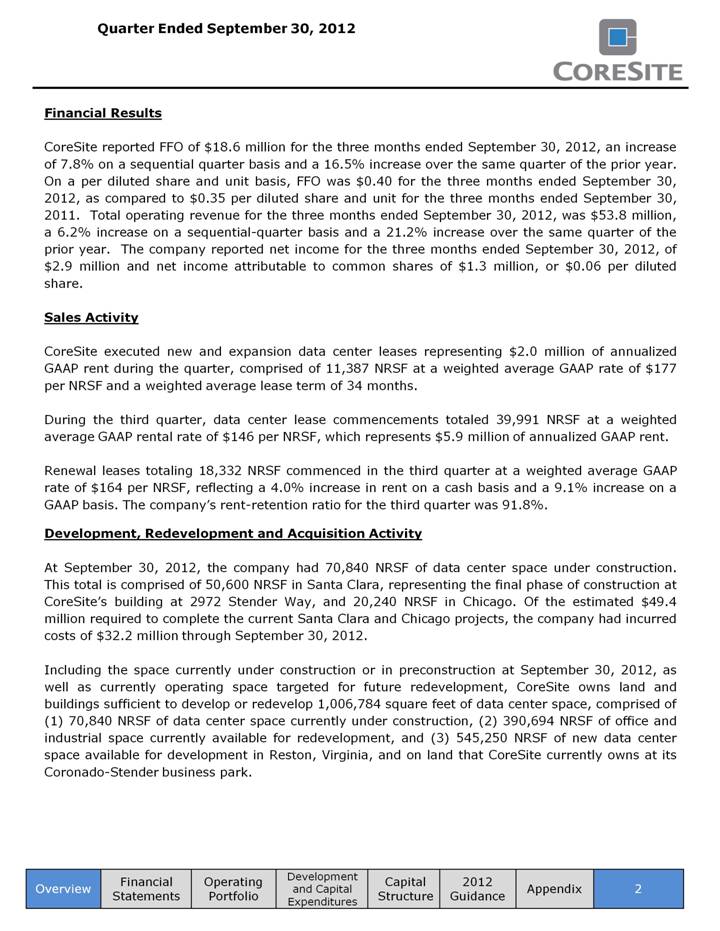
Financial Results CoreSite reported FFO of $18.6 million for the three months ended September 30, 2012, an increase of 7.8% on a sequential quarter basis and a 16.5% increase over the same quarter of the prior year. On a per diluted share and unit basis, FFO was $0.40 for the three months ended September 30, 2012, as compared to $0.35 per diluted share and unit for the three months ended September 30, 2011. Total operating revenue for the three months ended September 30, 2012, was $53.8 million, a 6.2% increase on a sequential-quarter basis and a 21.2% increase over the same quarter of the prior year. The company reported net income for the three months ended September 30, 2012, of $2.9 million and net income attributable to common shares of $1.3 million, or $0.06 per diluted share. Sales Activity CoreSite executed new and expansion data center leases representing $2.0 million of annualized GAAP rent during the quarter, comprised of 11,387 NRSF at a weighted average GAAP rate of $177 per NRSF and a weighted average lease term of 34 months. During the third quarter, data center lease commencements totaled 39,991 NRSF at a weighted average GAAP rental rate of $146 per NRSF, which represents $5.9 million of annualized GAAP rent. Renewal leases totaling 18,332 NRSF commenced in the third quarter at a weighted average GAAP rate of $164 per NRSF, reflecting a 4.0% increase in rent on a cash basis and a 9.1% increase on a GAAP basis. The company’s rent-retention ratio for the third quarter was 91.8%. Development, Redevelopment and Acquisition Activity At September 30, 2012, the company had 70,840 NRSF of data center space under construction. This total is comprised of 50,600 NRSF in Santa Clara, representing the final phase of construction at CoreSite’s building at 2972 Stender Way, and 20,240 NRSF in Chicago. Of the estimated $49.4 million required to complete the current Santa Clara and Chicago projects, the company had incurred costs of $32.2 million through September 30, 2012. Including the space currently under construction or in preconstruction at September 30, 2012, as well as currently operating space targeted for future redevelopment, CoreSite owns land and buildings sufficient to develop or redevelop 1,006,784 square feet of data center space, comprised of (1) 70,840 NRSF of data center space currently under construction, (2) 390,694 NRSF of office and industrial space currently available for redevelopment, and (3) 545,250 NRSF of new data center space available for development in Reston, Virginia, and on land that CoreSite currently owns at its Coronado-Stender business park. Overview Financial Statements Operating Portfolio Development and Capital Expenditures 2 Appendix Capital Structure 2012 Guidance |
|
|
During the third quarter, CoreSite took steps to expand its platform by advancing expansion capability in Reston, Virginia. The company received entitlements to expand its facility in Reston, Virginia, by approximately 200,000 useable square feet, comprised of data center, supporting infrastructure and general building support space. CoreSite plans to commence construction on this project in the first half of 2013. The company estimates that construction costs to complete the first phase of development will total $60.0 million and anticipates delivering salable capacity by the beginning of 2014. Balance Sheet and Liquidity As of September 30, 2012, CoreSite had $154.4 million of total long-term debt equal to 11.0% of total enterprise value and equal to 1.6x annualized adjusted EBITDA for the quarter ended September 30, 2012. CoreSite exercised its option to extend the maturity of the loan on its 55 S. Market property to October 9, 2014, and has no further debt maturities until 2014 assuming other extension options are exercised. At quarter end, the company had $13.4 million of cash available on its balance sheet and $131.1 million of available capacity under its revolving credit facility. Dividend On September 10, 2012, the company announced a dividend of $0.18 per share of common stock and common stock equivalents for the third quarter of 2012. The dividend was paid on October 15, 2012, to shareholders of record on September 28, 2012. 2012 Guidance The company is increasing and tightening its 2012 guidance of FFO per diluted share and unit to a range of $1.50 to $1.54 from its prior range of $1.42 to $1.52. This outlook is predicated on current economic conditions, internal assumptions about its customer base, and the supply and demand dynamics of the markets in which it operates. Further, the company’s guidance does not include the impact of any additional acquisitions or capital markets transactions that may become available. In addition, the company’s estimate of the net income attributable to common shares is $0.17 to $0.21 per diluted share with the difference between FFO and net income being real estate depreciation and amortization. Upcoming Conferences and Events CoreSite will participate in NAREIT’s REITWorld conference from November 13 through November 14 at the Manchester Grand Hyatt in San Diego, CA. Overview Financial Statements Operating Portfolio Development and Capital Expenditures Capital Structure Appendix 3 2012 Guidance |
|
|
Conference Call Details The company will host a conference call November 1 at 12:00 p.m. (Eastern Time) to discuss its financial results, current business trends and market conditions. The call can be accessed live over the phone by dialing 877-941-1429 for domestic callers or 480-629-9857 for international callers. A replay will be available shortly after the call and can be accessed by dialing 877-870-5176 for domestic callers, or for international callers, 858-384-5517. The passcode for the replay is 4573751. The replay will be available until November 8, 2012. Interested parties may also listen to a simultaneous webcast of the conference call by logging on to the company’s website at www.CoreSite.com and clicking on the “Investors” tab. The on-line replay will be available for a limited time beginning immediately following the call. About CoreSite CoreSite Realty Corporation (NYSE: COR) is a national provider of data center products and interconnection services. More than 750 customers, such as Global 1000 enterprises, communications providers, cloud and content companies, financial firms, media and entertainment, healthcare, and government agencies choose CoreSite for the confidence that comes with customer-focused data center products, service and support systems, and scalability. CoreSite’s network centric computing platform is a business catalyst, featuring the Any2 Internet exchange and network ecosystems, which include access to 225+ carriers and service providers and a growing mesh of more than 15,000 interconnections. The company features a diverse colocation offering from individual cabinets to custom cages and private suites, with 14 data center locations in nine major U.S. markets. For more information, visit www.CoreSite.com. CoreSite Investor Relations Contact +1 303.222.7276 InvestorRelations@CoreSite.com CoreSite Media Contact Jeannie Zaemes | CoreSite Marketing Senior Director +1 720.446.2006 | +1 866.777.CORE Jeannie.Zaemes@CoreSite.com Overview Financial Statements Operating Portfolio Development and Capital Expenditures Capital Structure 4 Appendix 2012 Guidance |
|
|
Forward Looking Statements This earnings release and accompanying supplemental information may contain forward-looking statements within the meaning of the federal securities laws. Forward-looking statements relate to expectations, beliefs, projections, future plans and strategies, anticipated events or trends and similar expressions concerning matters that are not historical facts. In some cases, you can identify forward-looking statements by the use of forward-looking terminology such as “believes,” “expects,” “may,” “will,” “should,” “seeks,” “approximately,” “intends,” “plans,” “pro forma,” “estimates” or “anticipates” or the negative of these words and phrases or similar words or phrases that are predictions of or indicate future events or trends and that do not relate solely to historical matters. Forward-looking statements involve known and unknown risks, uncertainties, assumptions and contingencies, many of which are beyond CoreSite’s control, that may cause actual results to differ significantly from those expressed in any forward-looking statement. These risks include, without limitation: the geographic concentration of the company’s data centers in certain markets and any adverse developments in local economic conditions or the demand for data center space in these markets; fluctuations in interest rates and increased operating costs; difficulties in identifying properties to acquire and completing acquisitions; significant industry competition; the company’s failure to obtain necessary outside financing; the company’s failure to qualify or maintain its status as a REIT; financial market fluctuations; changes in real estate and zoning laws and increases in real property tax rates; and other factors affecting the real estate industry generally. All forward-looking statements reflect the company’s good faith beliefs, assumptions and expectations, but they are not guarantees of future performance. Furthermore, the company disclaims any obligation to publicly update or revise any forward-looking statement to reflect changes in underlying assumptions or factors, of new information, data or methods, future events or other changes. For a further discussion of these and other factors that could cause the company’s future results to differ materially from any forward-looking statements, see the section entitled “Risk Factors” in the company’s most recent annual report on Form 10-K, and other risks described in documents subsequently filed by the company from time to time with the Securities and Exchange Commission. Overview Financial Statements Operating Portfolio Development and Capital Expenditures Capital Structure 5 Appendix 2012 Guidance |
|
|
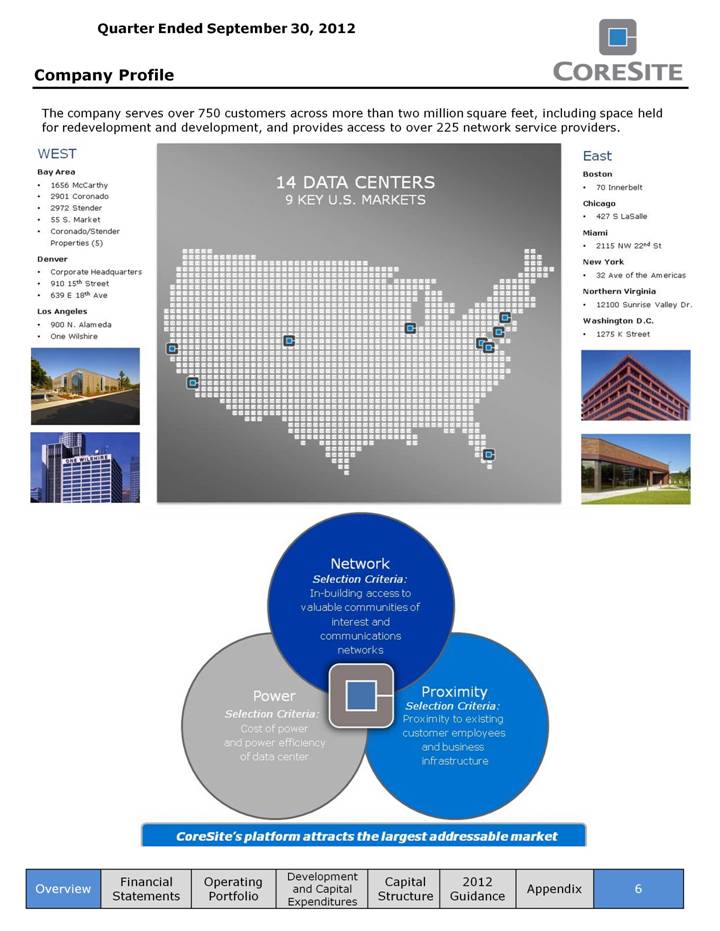
Company Profile The company serves over 750 customers across more than two million square feet, including space held for redevelopment and development, and provides access to over 225 network service providers. Overview Financial Statements Operating Portfolio Development and Capital Expenditures Capital Structure 6 Appendix 2012 Guidance |
|
|
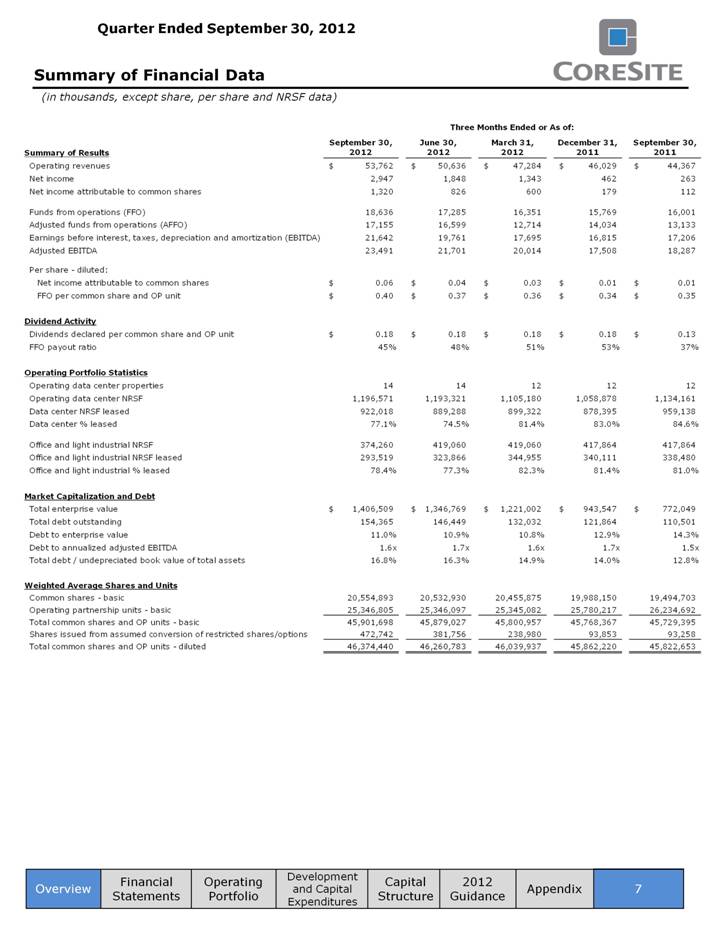
Summary of Financial Data (in thousands, except share, per share and NRSF data) Overview Financial Statements Operating Portfolio Development and Capital Expenditures Capital Structure 7 Appendix 2012 Guidance Three Months Ended or As of: September 30, June 30, March 31, December 31, September 30, Summary of Results 2012 2012 2012 2011 2011 Operating revenues $ 53,762 $ 50,636 $ 47,284 $ 46,029 $ 44,367 Net income 2,947 1,848 1,343 462 263 Net income attributable to common shares 1,320 826 600 179 112 Funds from operations (FFO) 18,636 17,285 16,351 15,769 16,001 Adjusted funds from operations (AFFO) 17,155 16,599 12,714 14,034 13,133 Earnings before interest, taxes, depreciation and amortization (EBITDA) 21,642 19,761 17,695 16,815 17,206 Adjusted EBITDA 23,491 21,701 20,014 17,508 18,287 Per share - diluted: Net income attributable to common shares $ 0.06 $ 0.04 $ 0.03 $ 0.01 $ 0.01 FFO per common share and OP unit $ 0.40 $ 0.37 $ 0.36 $ 0.34 $ 0.35 Dividend Activity Dividends declared per common share and OP unit $ 0.18 $ 0.18 $ 0.18 $ 0.18 $ 0.13 FFO payout ratio 45% 48% 51% 53% 37% Operating Portfolio Statistics Operating data center properties 14 14 12 12 12 Operating data center NRSF 1,196,571 1,193,321 1,105,180 1,058,878 1,134,161 Data center NRSF leased 922,018 889,288 899,322 878,395 959,138 Data center % leased 77.1% 74.5% 81.4% 83.0% 84.6% Office and light industrial NRSF 374,260 419,060 419,060 417,864 417,864 Office and light industrial NRSF leased 293,519 323,866 344,955 340,111 338,480 Office and light industrial % leased 78.4% 77.3% 82.3% 81.4% 81.0% Market Capitalization and Debt Total enterprise value $ 1,406,509 $ 1,346,769 $ 1,221,002 $ 943,547 $ 772,049 Total debt outstanding 154,365 146,449 132,032 121,864 110,501 Debt to enterprise value 11.0% 10.9% 10.8% 12.9% 14.3% Debt to annualized adjusted EBITDA 1.6x 1.7x 1.6x 1.7x 1.5x Total debt / undepreciated book value of total assets 16.8% 16.3% 14.9% 14.0% 12.8% Weighted Average Shares and Units Common shares - basic 20,554,893 20,532,930 20,455,875 19,988,150 19,494,703 Operating partnership units - basic 25,346,805 25,346,097 25,345,082 25,780,217 26,234,692 Total common shares and OP units - basic 45,901,698 45,879,027 45,800,957 45,768,367 45,729,395 Shares issued from assumed conversion of restricted shares/options 472,742 381,756 238,980 93,853 93,258 Total common shares and OP units - diluted 46,374,440 46,260,783 46,039,937 45,862,220 45,822,653 |
|
|
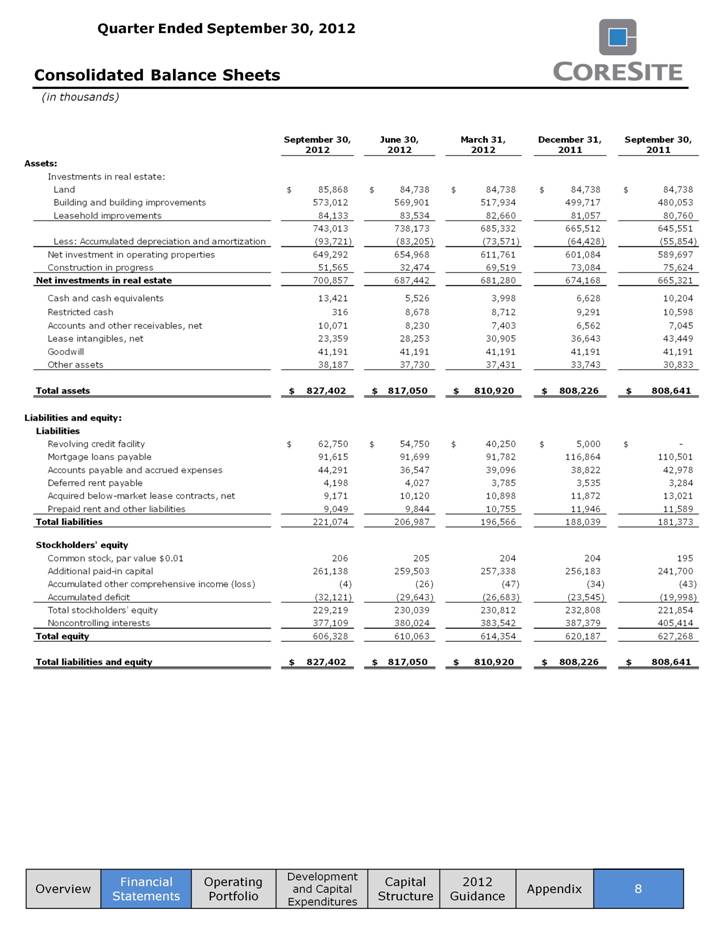
Consolidated Balance Sheets (in thousands) Financial Statements Operating Portfolio Development and Capital Expenditures Capital Structure 8 Appendix Overview 2012 Guidance September 30, June 30, March 31, December 31, September 30, 2012 2012 2012 2011 2011 Assets: Investments in real estate: Land $ 85,868 $ 84,738 $ 84,738 $ 84,738 $ 84,738 Building and building improvements 573,012 569,901 517,934 499,717 480,053 Leasehold improvements 84,133 83,534 82,660 81,057 80,760 743,013 738,173 685,332 665,512 645,551 Less: Accumulated depreciation and amortization (93,721) (83,205) (73,571) (64,428) (55,854) Net investment in operating properties 649,292 654,968 611,761 601,084 589,697 Construction in progress 51,565 32,474 69,519 73,084 75,624 Net investments in real estate 700,857 687,442 681,280 674,168 665,321 Cash and cash equivalents 13,421 5,526 3,998 6,628 10,204 Restricted cash 316 8,678 8,712 9,291 10,598 Accounts and other receivables, net 10,071 8,230 7,403 6,562 7,045 Lease intangibles, net 23,359 28,253 30,905 36,643 43,449 Goodwill 41,191 41,191 41,191 41,191 41,191 Other assets 38,187 37,730 37,431 33,743 30,833 Total assets $ 827,402 $ 817,050 $ 810,920 $ 808,226 $ 808,641 Liabilities and equity: Liabilities Revolving credit facility $ 62,750 $ 54,750 $ 40,250 $ 5,000 $ - Mortgage loans payable 91,615 91,699 91,782 116,864 110,501 Accounts payable and accrued expenses 44,291 36,547 39,096 38,822 42,978 Deferred rent payable 4,198 4,027 3,785 3,535 3,284 Acquired below-market lease contracts, net 9,171 10,120 10,898 11,872 13,021 Prepaid rent and other liabilities 9,049 9,844 10,755 11,946 11,589 Total liabilities 221,074 206,987 196,566 188,039 181,373 Stockholders' equity Common stock, par value $0.01 206 205 204 204 195 Additional paid-in capital 261,138 259,503 257,338 256,183 241,700 Accumulated other comprehensive income (loss) (4) (26) (47) (34) (43) Accumulated deficit (32,121) (29,643) (26,683) (23,545) (19,998) Total stockholders' equity 229,219 230,039 230,812 232,808 221,854 Noncontrolling interests 377,109 380,024 383,542 387,379 405,414 Total equity 606,328 610,063 614,354 620,187 627,268 Total liabilities and equity $ 827,402 $ 817,050 $ 810,920 $ 808,226 $ 808,641 |
|
|
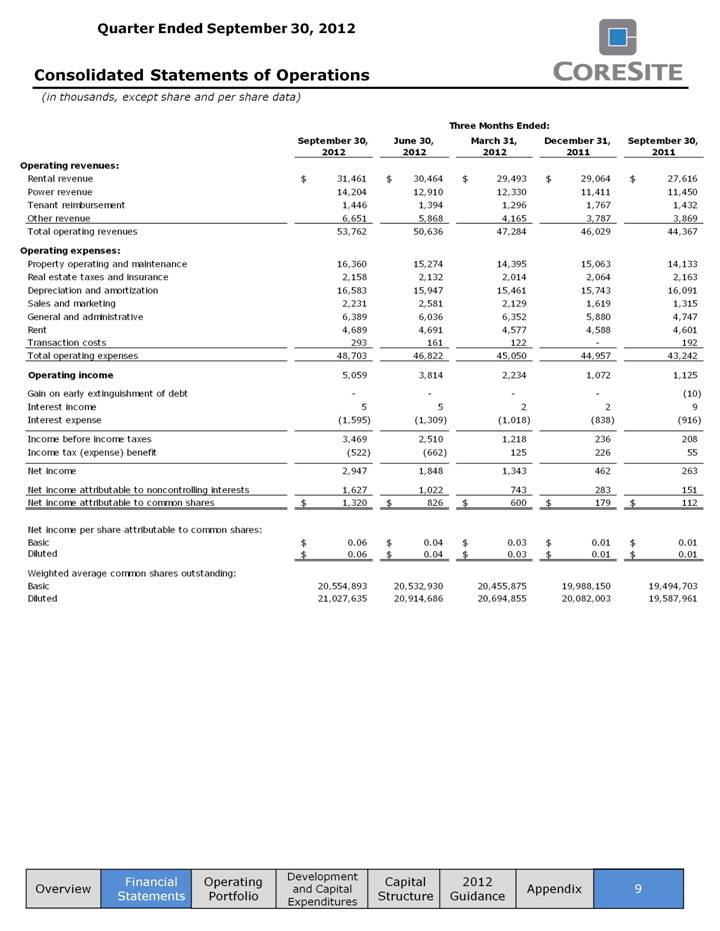
Consolidated Statements of Operations (in thousands, except share and per share data) Operating Portfolio Development and Capital Expenditures Capital Structure 9 Appendix Overview Financial Statements 2012 Guidance Three Months Ended: September 30, June 30, March 31, December 31, September 30, 2012 2012 2012 2011 2011 Operating revenues: Rental revenue $ 31,461 $ 30,464 $ 29,493 $ 29,064 $ 27,616 Power revenue 14,204 12,910 12,330 11,411 11,450 Tenant reimbursement 1,446 1,394 1,296 1,767 1,432 Other revenue 6,651 5,868 4,165 3,787 3,869 Total operating revenues 53,762 50,636 47,284 46,029 44,367 Operating expenses: Property operating and maintenance 16,360 15,274 14,395 15,063 14,133 Real estate taxes and insurance 2,158 2,132 2,014 2,064 2,163 Depreciation and amortization 16,583 15,947 15,461 15,743 16,091 Sales and marketing 2,231 2,581 2,129 1,619 1,315 General and administrative 6,389 6,036 6,352 5,880 4,747 Rent 4,689 4,691 4,577 4,588 4,601 Transaction costs 293 161 122 - 192 Total operating expenses 48,703 46,822 45,050 44,957 43,242 Operating income 5,059 3,814 2,234 1,072 1,125 Gain on early extinguishment of debt - - - - (10) Interest income 5 5 2 2 9 Interest expense (1,595) (1,309) (1,018) (838) (916) Income before income taxes 3,469 2,510 1,218 236 208 Income tax (expense) benefit (522) (662) 125 226 55 Net income 2,947 1,848 1,343 462 263 Net income attributable to noncontrolling interests 1,627 1,022 743 283 151 Net income attributable to common shares $ 1,320 $ 826 $ 600 $ 179 $ 112 Net income per share attributable to common shares: Basic $ 0.06 $ 0.04 $ 0.03 $ 0.01 $ 0.01 Diluted $ 0.06 $ 0.04 $ 0.03 $ 0.01 $ 0.01 Weighted average common shares outstanding: Basic 20,554,893 20,532,930 20,455,875 19,988,150 19,494,703 Diluted 21,027,635 20,914,686 20,694,855 20,082,003 19,587,961 |
|
|
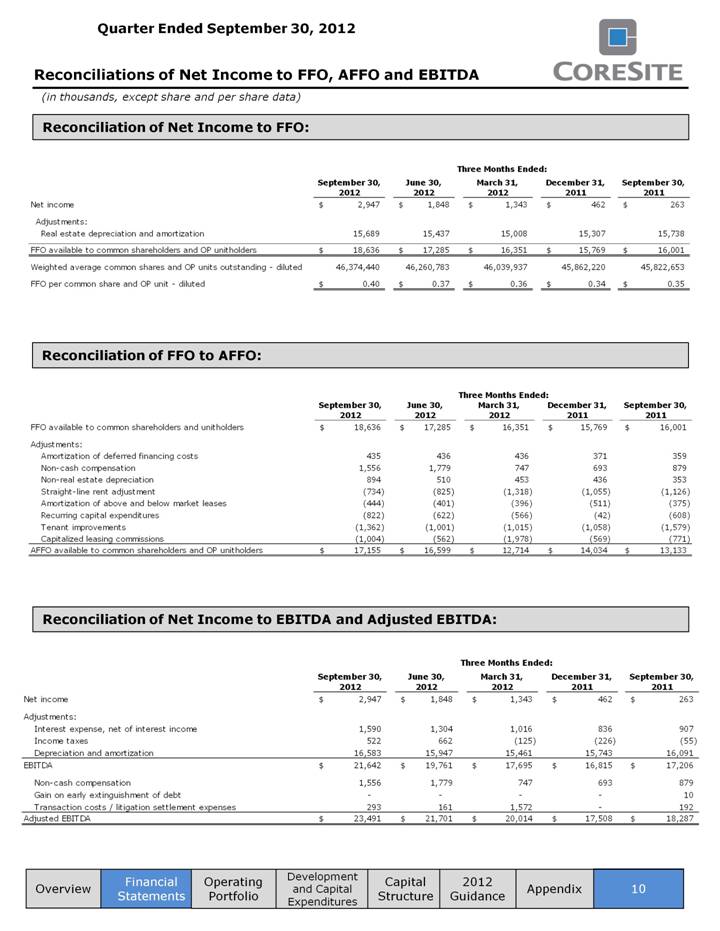
Reconciliations of Net Income to FFO, AFFO and EBITDA (in thousands, except share and per share data) Reconciliation of Net Income to FFO: Reconciliation of FFO to AFFO: Reconciliation of Net Income to EBITDA and Adjusted EBITDA: Operating Portfolio Development and Capital Expenditures Capital Structure 10 Appendix Overview Financial Statements 2012 Guidance Three Months Ended: September 30, June 30, March 31, December 31, September 30, 2012 2012 2012 2011 2011 Net income $ 2,947 $ 1,848 $ 1,343 $ 462 $ 263 Adjustments: Real estate depreciation and amortization 15,689 15,437 15,008 15,307 15,738 FFO available to common shareholders and OP unitholders $ 18,636 $ 17,285 $ 16,351 $ 15,769 $ 16,001 Weighted average common shares and OP units outstanding - diluted 46,374,440 46,260,783 46,039,937 45,862,220 45,822,653 FFO per common share and OP unit - diluted $ 0.40 $ 0.37 $ 0.36 $ 0.34 $ 0.35 Three Months Ended: September 30, June 30, March 31, December 31, September 30, 2012 2012 2012 2011 2011 FFO available to common shareholders and unitholders $ 18,636 $ 17,285 $ 16,351 $ 15,769 $ 16,001 Adjustments: Amortization of deferred financing costs 435 436 436 371 359 Non-cash compensation 1,556 1,779 747 693 879 Non-real estate depreciation 894 510 453 436 353 Straight-line rent adjustment (734) (825) (1,318) (1,055) (1,126) Amortization of above and below market leases (444) (401) (396) (511) (375) Recurring capital expenditures (822) (622) (566) (42) (608) Tenant improvements (1,362) (1,001) (1,015) (1,058) (1,579) Capitalized leasing commissions (1,004) (562) (1,978) (569) (771) AFFO available to common shareholders and OP unitholders $ 17,155 $ 16,599 $ 12,714 $ 14,034 $ 13,133 Three Months Ended: September 30, June 30, March 31, December 31, September 30, 2012 2012 2012 2011 2011 Net income $ 2,947 $ 1,848 $ 1,343 $ 462 $ 263 Adjustments: Interest expense, net of interest income 1,590 1,304 1,016 836 907 Income taxes 522 662 (125) (226) (55) Depreciation and amortization 16,583 15,947 15,461 15,743 16,091 EBITDA $ 21,642 $ 19,761 $ 17,695 $ 16,815 $ 17,206 Non-cash compensation 1,556 1,779 747 693 879 Gain on early extinguishment of debt - - - - 10 Transaction costs / litigation settlement expenses 293 161 1,572 - 192 Adjusted EBITDA $ 23,491 $ 21,701 $ 20,014 $ 17,508 $ 18,287 |
|
|
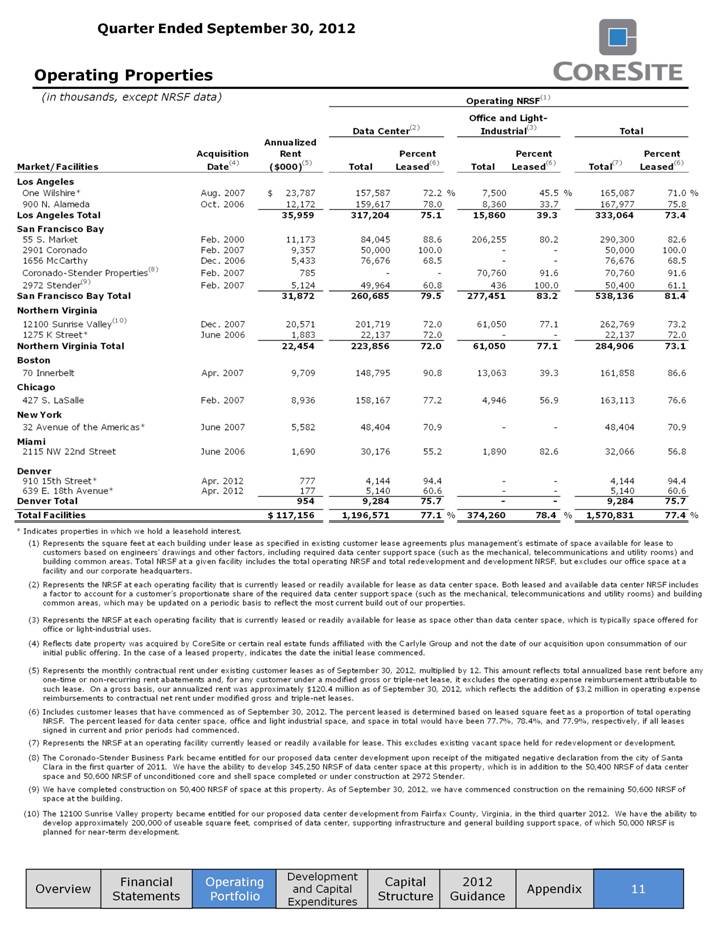
Operating Properties (in thousands, except NRSF data) Financial Statements Development and Capital Expenditures Capital Structure 11 Appendix Operating Portfolio Overview 2012 Guidance Operating NRSF (1) Office and Light- Data Center(2) Industrial(3) Total Annualized Acquisition Rent Percent Percent Percent Market/Facilities Date(4) ($000)(5) Total Leased(6) Total Leased(6) Total(7) Leased(6) Los Angeles One Wilshire* Aug. 2007 $ 23,787 157,587 72.2 % 7,500 45.5 % 165,087 71.0 % 900 N. Alameda Oct. 2006 12,172 159,617 78.0 8,360 33.7 167,977 75.8 Los Angeles Total 35,959 317,204 75.1 15,860 39.3 333,064 73.4 55 S. Market Feb. 2000 11,173 84,045 88.6 206,255 80.2 290,300 82.6 2901 Coronado Feb. 2007 9,357 50,000 100.0 - - 50,000 100.0 1656 McCarthy Dec. 2006 5,433 76,676 68.5 - - 76,676 68.5 Coronado-Stender Properties(8) Feb. 2007 785 - - 70,760 91.6 70,760 91.6 2972 Stender(9) Feb. 2007 5,124 49,964 60.8 436 100.0 50,400 61.1 San Francisco Bay Total 31,872 260,685 79.5 277,451 83.2 538,136 81.4 Northern Virginia 12100 Sunrise Valley(10) Dec. 2007 20,571 201,719 72.0 61,050 77.1 262,769 73.2 1275 K Street* June 2006 1,883 22,137 72.0 - - 22,137 72.0 Northern Virginia Total 22,454 223,856 72.0 61,050 77.1 284,906 73.1 Boston 70 Innerbelt Apr. 2007 9,709 148,795 90.8 13,063 39.3 161,858 86.6 Chicago 427 S. LaSalle Feb. 2007 8,936 158,167 77.2 4,946 56.9 163,113 76.6 New York 32 Avenue of the Americas* June 2007 5,582 48,404 70.9 - - 48,404 70.9 Miami 2115 NW 22nd Street June 2006 1,690 30,176 55.2 1,890 82.6 32,066 56.8 Denver 910 15th Street* Apr. 2012 777 4,144 94.4 - - 4,144 94.4 639 E. 18th Avenue* Apr. 2012 177 5,140 60.6 - - 5,140 60.6 Denver Total 954 9,284 75.7 - - 9,284 75.7 Total Facilities $ 117,156 1,196,571 77.1 % 374,260 78.4 % 1,570,831 77.4 % * Indicates properties in which we hold a leasehold interest. (1) Represents the square feet at each building under lease as specified in existing customer lease agreements plus management’s estimate of space available for lease to customers based on engineers’ drawings and other factors, including required data center support space (such as the mechanical, telecommunications and utility rooms) and building common areas. Total NRSF at a given facility includes the total operating NRSF and total redevelopment and development NRSF, but excludes our office space at a facility and our corporate headquarters. (2) Represents the NRSF at each operating facility that is currently leased or readily available for lease as data center space. Both leased and available data center NRSF includes a factor to account for a customer’s proportionate share of the required data center support space (such as the mechanical, telecommunications and utility rooms) and building common areas, which may be updated on a periodic basis to reflect the most current build out of our properties. (3) Represents the NRSF at each operating facility that is currently leased or readily available for lease as space other than data center space, which is typically space offered for office or light-industrial uses. (4) Reflects date property was acquired by CoreSite or certain real estate funds affiliated with the Carlyle Group and not the date of our acquisition upon consummation of our initial public offering. In the case of a leased property, indicates the date the initial lease commenced. (5) Represents the monthly contractual rent under existing customer leases as of September 30, 2012, multiplied by 12. This amount reflects total annualized base rent before any one-time or non-recurring rent abatements and, for any customer under a modified gross or triple-net lease, it excludes the operating expense reimbursement attributable to such lease. On a gross basis, our annualized rent was approximately $120.4 million as of September 30, 2012, which reflects the addition of $3.2 million in operating expense reimbursements to contractual net rent under modified gross and triple-net leases. (6) Includes customer leases that have commenced as of September 30, 2012. The percent leased is determined based on leased square feet as a proportion of total operating NRSF. The percent leased for data center space, office and light industrial space, and space in total would have been 77.7%, 78.4%, and 77.9%, respectively, if all leases signed in current and prior periods had commenced. (7) Represents the NRSF at an operating facility currently leased or readily available for lease. This excludes existing vacant space held for redevelopment or development. (8) The Coronado-Stender Business Park became entitled for our proposed data center development upon receipt of the mitigated negative declaration from the city of Santa Clara in the first quarter of 2011. We have the ability to develop 345,250 NRSF of data center space at this property, which is in addition to the 50,400 NRSF of data center space and 50,600 NRSF of unconditioned core and shell space completed or under construction at 2972 Stender. (9) We have completed construction on 50,400 NRSF of space at this property. As of September 30, 2012, we have commenced construction on the remaining 50,600 NRSF of space at the building. (10) The 12100 Sunrise Valley property became entitled for our proposed data center development from Fairfax County, Virginia, in the third quarter 2012. We have the ability to develop approximately 200,000 useable square feet, comprised of data center, supporting infrastructure and general building support space, of which 50,000 NRSF is planned for near-term development. |
|
|
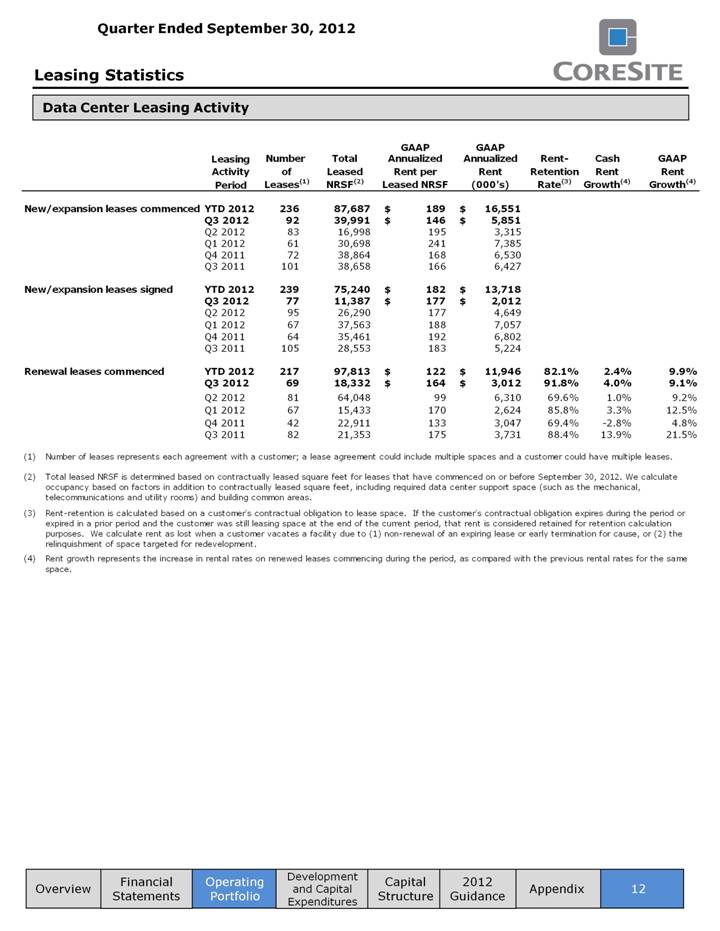
Leasing Statistics Data Center Leasing Activity Financial Statements Development and Capital Expenditures Capital Structure 12 Appendix Operating Portfolio Overview 2012 Guidance GAAP GAAP Leasing Number Total Annualized Annualized Rent- Cash GAAP Activity of Leased Rent per Rent Retention Rent Rent Period Leases(1) NRSF(2) Leased NRSF (000's) Rate(3) Growth(4) Growth(4) New/expansion leases commenced YTD 2012 236 87,687 $ 189 $ 16,551 Q3 2012 92 39,991 $ 146 $ 5,851 Q2 2012 83 16,998 195 3,315 Q1 2012 61 30,698 241 7,385 Q4 2011 72 38,864 168 6,530 Q3 2011 101 38,658 166 6,427 New/expansion leases signed YTD 2012 239 75,240 $ 182 $ 13,718 Q3 2012 77 11,387 $ 177 $ 2,012 Q2 2012 95 26,290 177 4,649 Q1 2012 67 37,563 188 7,057 Q4 2011 64 35,461 192 6,802 Q3 2011 105 28,553 183 5,224 Renewal leases commenced YTD 2012 217 97,813 $ 122 $ 11,946 82.1% 2.4% 9.9% Q3 2012 69 18,332 $ 164 $ 3,012 91.8% 4.0% 9.1% Q2 2012 81 64,048 99 6,310 69.6% 1.0% 9.2% Q1 2012 67 15,433 170 2,624 85.8% 3.3% 12.5% Q4 2011 42 22,911 133 3,047 69.4% -2.8% 4.8% Q3 2011 82 21,353 175 3,731 88.4% 13.9% 21.5% (1) Number of leases represents each agreement with a customer; a lease agreement could include multiple spaces and a customer could have multiple leases. (2) Total leased NRSF is determined based on contractually leased square feet for leases that have commenced on or before September 30, 2012. We calculate occupancy based on factors in addition to contractually leased square feet, including required data center support space (such as the mechanical, telecommunications and utility rooms) and building common areas. (3) Rent-retention is calculated based on a customer's contractual obligation to lease space. If the customer's contractual obligation expires during the period or expired in a prior period and the customer was still leasing space at the end of the current period, that rent is considered retained for retention calculation purposes. We calculate rent as lost when a customer vacates a facility due to (1) non-renewal of an expiring lease or early termination for cause, or (2) the relinquishment of space targeted for redevelopment. (4) Rent growth represents the increase in rental rates on renewed leases commencing during the period, as compared with the previous rental rates for the same space. |
|
|
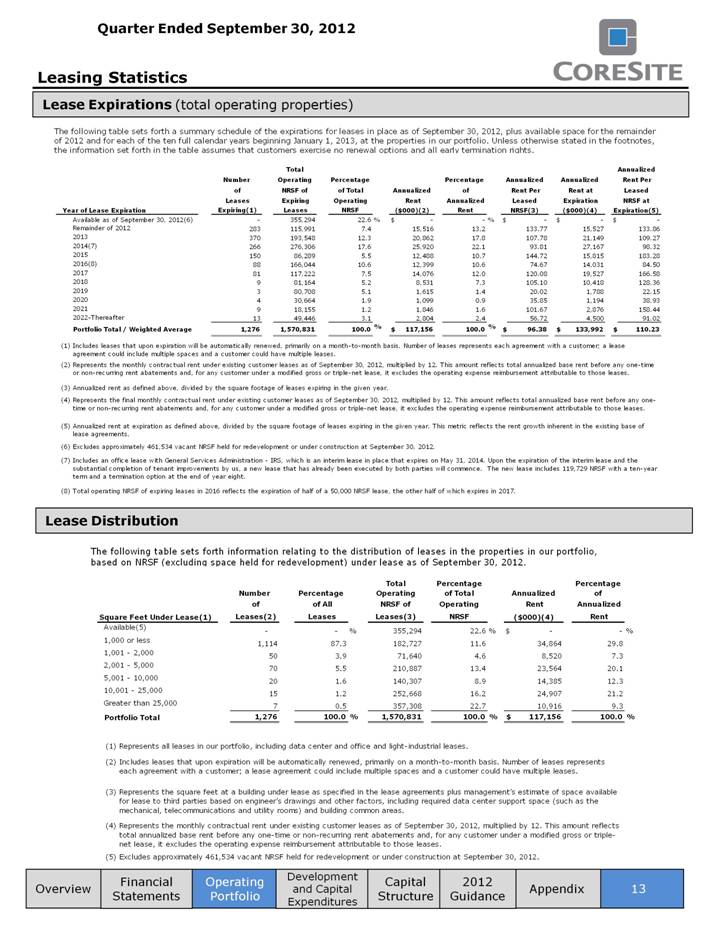
Leasing Statistics Lease Expirations (total operating properties) Lease Distribution 13 Appendix Operating Portfolio Overview Financial Statements Development and Capital Expenditures Capital Structure 2012 Guidance The following table sets forth a summary schedule of the expirations for leases in place as of September 30, 2012, plus available space for the remainder of 2012 and for each of the ten full calendar years beginning January 1, 2013, at the properties in our portfolio. Unless otherwise stated in the footnotes, the information set forth in the table assumes that customers exercise no renewal options and all early termination rights. Total Annualized Number Operating Percentage Percentage Annualized Annualized Rent Per of NRSF of of Total Annualized of Rent Per Rent at Leased Leases Expiring Operating Rent Annualized Leased Expiration NRSF at Year of Lease Expiration Expiring(1) Leases NRSF ($000)(2) Rent NRSF(3) ($000)(4) Expiration(5) Available as of September 30, 2012(6) - 355,294 22.6 % $ - - % $ - $ - $ - Remainder of 2012 283 115,991 7.4 15,516 13.2 133.77 15,527 133.86 2013 370 193,548 12.3 20,862 17.8 107.78 21,149 109.27 2014(7) 266 276,306 17.6 25,920 22.1 93.81 27,167 98.32 2015 150 86,289 5.5 12,488 10.7 144.72 15,815 183.28 2016(8) 88 166,044 10.6 12,399 10.6 74.67 14,031 84.50 2017 81 117,222 7.5 14,076 12.0 120.08 19,527 166.58 2018 9 81,164 5.2 8,531 7.3 105.10 10,418 128.36 2019 3 80,708 5.1 1,615 1.4 20.02 1,788 22.15 2020 4 30,664 1.9 1,099 0.9 35.85 1,194 38.93 2021 9 18,155 1.2 1,846 1.6 101.67 2,876 158.44 2022-Thereafter 13 49,446 3.1 2,804 2.4 56.72 4,500 91.02 Portfolio Total / Weighted Average 1,276 1,570,831 100.0 % $ 117,156 100.0 % $ 96.38 $ 133,992 $ 110.23 (1) Includes leases that upon expiration will be automatically renewed, primarily on a month-to-month basis. Number of leases represents each agreement with a customer; a lease agreement could include multiple spaces and a customer could have multiple leases. (2) Represents the monthly contractual rent under existing customer leases as of September 30, 2012, multiplied by 12. This amount reflects total annualized base rent before any one-time or non-recurring rent abatements and, for any customer under a modified gross or triple-net lease, it excludes the operating expense reimbursement attributable to those leases. (3) Annualized rent as defined above, divided by the square footage of leases expiring in the given year. (4) Represents the final monthly contractual rent under existing customer leases as of September 30, 2012, multiplied by 12. This amount reflects total annualized base rent before any one- time or non-recurring rent abatements and, for any customer under a modified gross or triple-net lease, it excludes the operating expense reimbursement attributable to those leases. (5) Annualized rent at expiration as defined above, divided by the square footage of leases expiring in the given year. This metric reflects the rent growth inherent in the existing base of lease agreements. (6) Excludes approximately 461,534 vacant NRSF held for redevelopment or under construction at September 30, 2012. (7) Includes an office lease with General Services Administration - IRS, which is an interim lease in place that expires on May 31, 2014. Upon the expiration of the interim lease and the substantial completion of tenant improvements by us, a new lease that has already been executed by both parties will commence. The new lease includes 119,729 NRSF with a ten-year term and a termination option at the end of year eight. (8) Total operating NRSF of expiring leases in 2016 reflects the expiration of half of a 50,000 NRSF lease, the other half of which expires in 2017. The following table sets forth information relating to the distribution of leases in the properties in our portfolio, based on NRSF (excluding space held for redevelopment) under lease as of September 30, 2012. Total Percentage Percentage Number Percentage Operating of Total Annualized of of of All NRSF of Operating Rent Annualized Square Feet Under Lease(1) Leases(2) Leases Leases(3) NRSF ($000)(4) Rent Available(5) - - % 355,294 22.6 % $ - - % 1,000 or less 1,114 87.3 182,727 11.6 34,864 29.8 1,001 - 2,000 50 3.9 71,640 4.6 8,520 7.3 2,001 - 5,000 70 5.5 210,887 13.4 23,564 20.1 5,001 - 10,000 20 1.6 140,307 8.9 14,385 12.3 10,001 - 25,000 15 1.2 252,668 16.2 24,907 21.2 Greater than 25,000 7 0.5 357,308 22.7 10,916 9.3 Portfolio Total 1,276 100.0 % 1,570,831 100.0 % $ 117,156 100.0 % (1) Represents all leases in our portfolio, including data center and office and light-industrial leases. (2) Includes leases that upon expiration will be automatically renewed, primarily on a month-to-month basis. Number of leases represents each agreement with a customer; a lease agreement could include multiple spaces and a customer could have multiple leases. (3) Represents the square feet at a building under lease as specified in the lease agreements plus management’s estimate of space available for lease to third parties based on engineer’s drawings and other factors, including required data center support space (such as the mechanical, telecommunications and utility rooms) and building common areas. (4) Represents the monthly contractual rent under existing customer leases as of September 30, 2012, multiplied by 12. This amount reflects total annualized base rent before any one-time or non-recurring rent abatements and, for any customer under a modified gross or triple- net lease, it excludes the operating expense reimbursement attributable to those leases. (5) Excludes approximately 461,534 vacant NRSF held for redevelopment or under construction at September 30, 2012. |
|
|
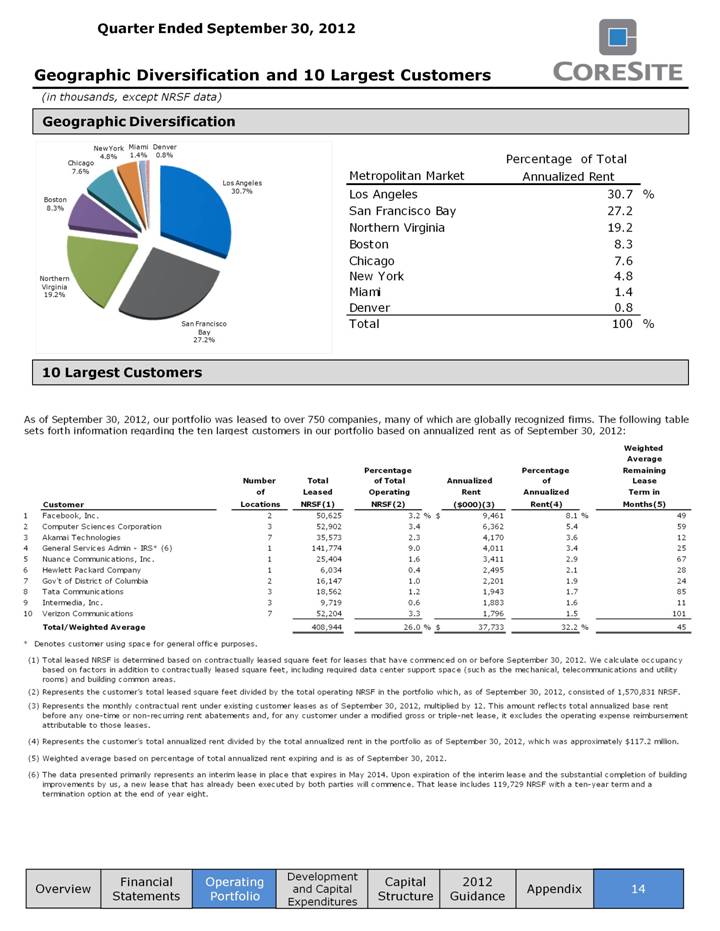
Geographic Diversification and 10 Largest Customers Geographic Diversification 10 Largest Customers (in thousands, except NRSF data) Financial Statements Operating Portfolio Development and Capital Expenditures Capital Structure 14 Appendix Overview 2012 Guidance New York Miami Denver 4.8% 1.4% 0.8% Percentage of Total Chicago 7.6% Metropolitan Market Annualized Rent Los Angeles 30.7% Los Angeles 30.7 % Boston 8.3% San Francisco Bay 27.2 Northern Virginia 19.2 Boston 8.3 Chicago 7.6 Northern New York 4.8 Virginia Miami 1.4 19.2% Denver 0.8 San Francisco Total 100 % Bay 27.2% As of September 30, 2012, our portfolio was leased to over 750 companies, many of which are globally recognized firms. The following table sets forth information regarding the ten largest customers in our portfolio based on annualized rent as of September 30, 2012: Weighted Average Percentage Percentage Remaining Number Total of Total Annualized of Lease of Leased Operating Rent Annualized Term in Customer Locations NRSF(1) NRSF(2) ($000)(3) Rent(4) Months(5) 1 Facebook, Inc. 2 50,625 3.2 % $ 9,461 8.1 % 49 2 Computer Sciences Corporation 3 52,902 3.4 6,362 5.4 59 3 Akamai Technologies 7 35,573 2.3 4,170 3.6 12 4 General Services Admin - IRS* (6) 1 141,774 9.0 4,011 3.4 25 5 Nuance Communications, Inc. 1 25,404 1.6 3,411 2.9 67 6 Hewlett Packard Company 1 6,034 0.4 2,495 2.1 28 7 Gov't of District of Columbia 2 16,147 1.0 2,201 1.9 24 8 Tata Communications 3 18,562 1.2 1,943 1.7 85 9 Intermedia, Inc. 3 9,719 0.6 1,883 1.6 11 10 Verizon Communications 7 52,204 3.3 1,796 1.5 101 Total/Weighted Average 408,944 26.0 % $ 37,733 32.2 % 45 * Denotes customer using space for general office purposes. (1) Total leased NRSF is determined based on contractually leased square feet for leases that have commenced on or before September 30, 2012. We calculate occupancy based on factors in addition to contractually leased square feet, including required data center support space (such as the mechanical, telecommunications and utility rooms) and building common areas. (2) Represents the customer’s total leased square feet divided by the total operating NRSF in the portfolio which, as of September 30, 2012, consisted of 1,570,831 NRSF. (3) Represents the monthly contractual rent under existing customer leases as of September 30, 2012, multiplied by 12. This amount reflects total annualized base rent before any one-time or non-recurring rent abatements and, for any customer under a modified gross or triple-net lease, it excludes the operating expense reimbursement attributable to those leases. (4) Represents the customer’s total annualized rent divided by the total annualized rent in the portfolio as of September 30, 2012, which was approximately $117.2 million. (5) Weighted average based on percentage of total annualized rent expiring and is as of September 30, 2012. (6) The data presented primarily represents an interim lease in place that expires in May 2014. Upon expiration of the interim lease and the substantial completion of building improvements by us, a new lease that has already been executed by both parties will commence. That lease includes 119,729 NRSF with a ten-year term and a termination option at the end of year eight. |
|
|
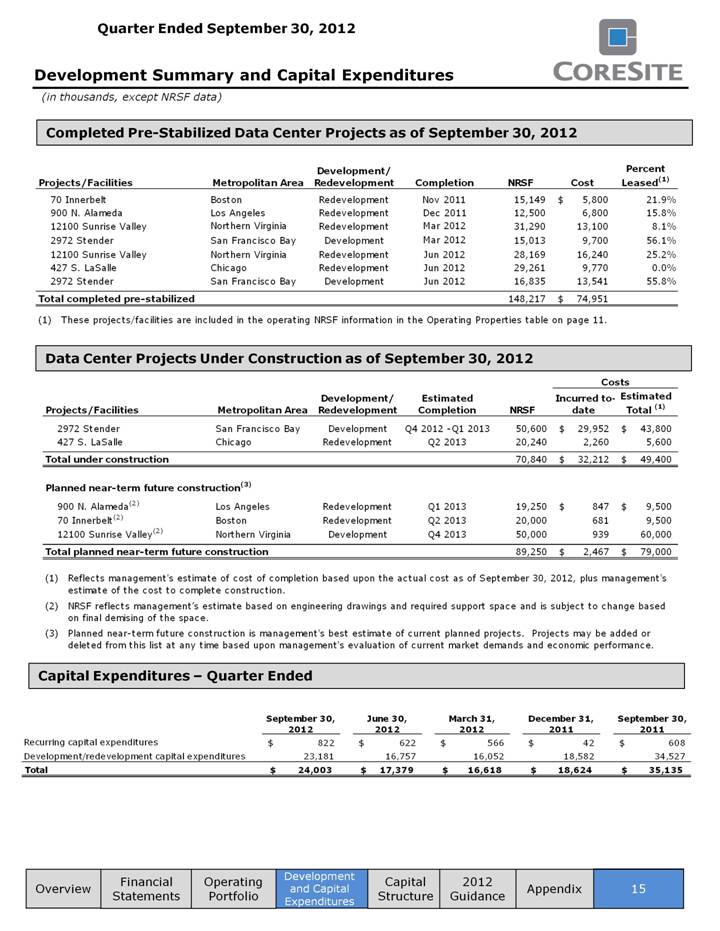
Development Summary and Capital Expenditures (in thousands, except NRSF data) Completed Pre-Stabilized Data Center Projects as of September 30, 2012 Capital Expenditures – Quarter Ended Data Center Projects Under Construction as of September 30, 2012 Financial Statements Operating Portfolio Development and Capital Expenditures Capital Structure 15 Appendix Overview 2012 Guidance Development/ Percent Projects/Facilities Metropolitan Area Redevelopment Completion NRSF Cost Leased(1) 70 Innerbelt Boston Redevelopment Nov 2011 15,149 $ 5,800 21.9% 900 N. Alameda Los Angeles Redevelopment Dec 2011 12,500 6,800 15.8% 12100 Sunrise Valley Northern Virginia Redevelopment Mar 2012 31,290 13,100 8.1% 2972 Stender San Francisco Bay Development Mar 2012 15,013 9,700 56.1% 12100 Sunrise Valley Northern Virginia Redevelopment Jun 2012 28,169 16,240 25.2% 427 S. LaSalle Chicago Redevelopment Jun 2012 29,261 9,770 0.0% 2972 Stender San Francisco Bay Development Jun 2012 16,835 13,541 55.8% Total completed pre-stabilized 148,217 $ 74,951 (1) These projects/facilities are included in the operating NRSF information in the Operating Properties table on page 11. Costs Development/ Estimated Incurred to- Estimated Projects/Facilities Metropolitan Area Redevelopment Completion NRSF date Total (1) 2972 Stender San Francisco Bay Development Q4 2012 -Q1 2013 50,600 $ 29,952 $ 43,800 427 S. LaSalle Chicago Redevelopment Q2 2013 20,240 2,260 5,600 Total under construction 70,840 $ 32,212 $ 49,400 Planned near-term future construction(3) 900 N. Alameda(2) Los Angeles Redevelopment Q1 2013 19,250 $ 847 $ 9,500 70 Innerbelt(2) Boston Redevelopment Q2 2013 20,000 681 9,500 12100 Sunrise Valley(2 ) Northern Virginia Development Q4 2013 50,000 939 60,000 Total planned near-term future construction 89,250 $ 2,467 $ 79,000 (1) Reflects management's estimate of cost of completion based upon the actual cost as of September 30, 2012, plus management's estimate of the cost to complete construction. (2) NRSF reflects management’s estimate based on engineering drawings and required support space and is subject to change based on final demising of the space. (3) Planned near-term future construction is management's best estimate of current planned projects. Projects may be added or deleted from this list at any time based upon management's evaluation of current market demands and economic performance. September 30, June 30, March 31, December 31, September 30, 2012 2012 2012 2011 2011 Recurring capital expenditures $ 822 $ 622 $ 566 $ 42 $ 608 Development/redevelopment capital expenditures 23,181 16,757 16,052 18,582 34,527 Total $ 24,003 $ 17,379 $ 16,618 $ 18,624 $ 35,135 |
|
|
Quarter Ended September 30, 2012 Market Capitalization and Debt Summary (in thousands, except per share data) Market Capitalization Shares or Equivalents Market Price as of Market Value Outstanding September 30, 2012 Equivalents Common shares 21,118 $26.94 $ 568,919 Operating partnership units 25,361 $26.94 683,225 Total equity 1,252,144 Total debt 154,365 Total enterprise value $ 1,406,509 Total debt to total enterprise value 11.0% Debt Summary (1) Outstanding as of: Maturity Interest Maturity Date with September 30, June 30, March 31, December 31, September 30, Instrument Rate(2) Date Extension 2012 2012 2012 2011 2011 12100 Sunrise Valley mortgage loan 3.00% 6/1/2013 6/1/2014 $ 31,615 $ 31,699 $ 31,782 $ 31,864 $ 25,501 55 S. Market mortgage loan(3) 4.01% 10/9/2014 60,000 60,000 60,000 60,000 60,000 Senior secured credit facility 2.49% 12/15/2014 12/15/2015 62,750 54,750 40,250 5,000 - 427 S. LaSalle mortgage loan - - - 25,000 25,000 Total Consolidated Debt $ 154,365 $ 146,449 $ 132,032 $ 121,864 $ 110,501 Weighted average interest rate 3.19% Floating rate vs. fixed rate debt 61% / 39% 59% / 41% 55% / 45% 51% / 49% 46% / 54% (1) See the 10-Q for information on specific debt instruments. (2) Each debt instrument's interest rate is based on LIBOR at September 30, 2012, plus applicable spread. (3) Represents the effective interest rate for secured debt at 55 S. Market which was is fixed by an interest rate swap at September 30, 2012. The interest rate swap matured on October 9, 2012, and was not extended. On October 9, 2012, the Company exercised our two-year extension option to extend the maturity date to October 9, 2014. Debt Maturities(1) $100,000 $80,000 $60,000 $40,000 $20,000 $- 2012 2013 2014 2015 2016 (1) Assumes all extensions are available and exercised. Overview Financial Statements Operating Portfolio Development and Capital Expenditures Capital Structure 2012 Guidance Appendix 16 |

|
|
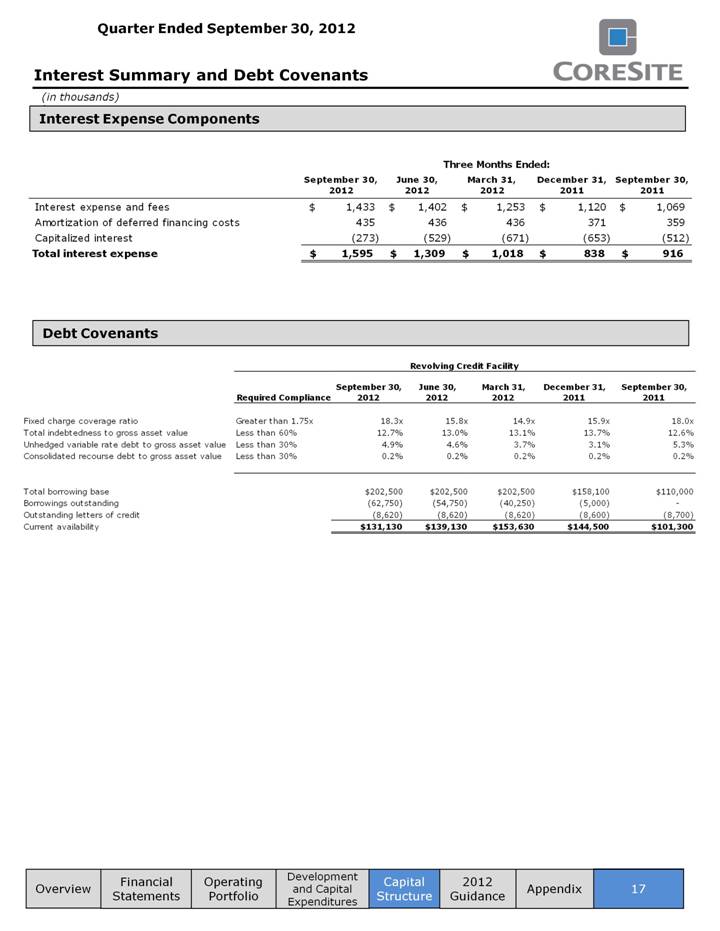
Interest Summary and Debt Covenants Debt Covenants (in thousands) ) Interest Expense Components Financial Statements Operating Portfolio Development and Capital Expenditures Capital Structure 17 Appendix Overview 2012 Guidance Three Months Ended: September 30, June 30, March 31, December 31, September 30, 2012 2012 2012 2011 2011 Interest expense and fees $ 1,433 $ 1,402 $ 1,253 $ 1,120 $ 1,069 Amortization of deferred financing costs 435 436 436 371 359 Capitalized interest (273) (529) (671) (653) (512) Total interest expense $ 1,595 $ 1,309 $ 1,018 $ 838 $ 916 Revolving Credit Facility September 30, June 30, March 31, December 31, September 30, Required Compliance 2012 2012 2012 2011 2011 Fixed charge coverage ratio Greater than 1.75x 18.3x 15.8x 14.9x 15.9x 18.0x Total indebtedness to gross asset value Less than 60% 12.7% 13.0% 13.1% 13.7% 12.6% Unhedged variable rate debt to gross asset value Less than 30% 4.9% 4.6% 3.7% 3.1% 5.3% Consolidated recourse debt to gross asset value Less than 30% 0.2% 0.2% 0.2% 0.2% 0.2% Total borrowing base $202,500 $202,500 $202,500 $158,100 $110,000 Borrowings outstanding (62,750) (54,750) (40,250) (5,000) - Outstanding letters of credit (8,620) (8,620) (8,620) (8,600) (8,700) Current availability $131,130 $139,130 $153,630 $144,500 $101,300 |
|
|
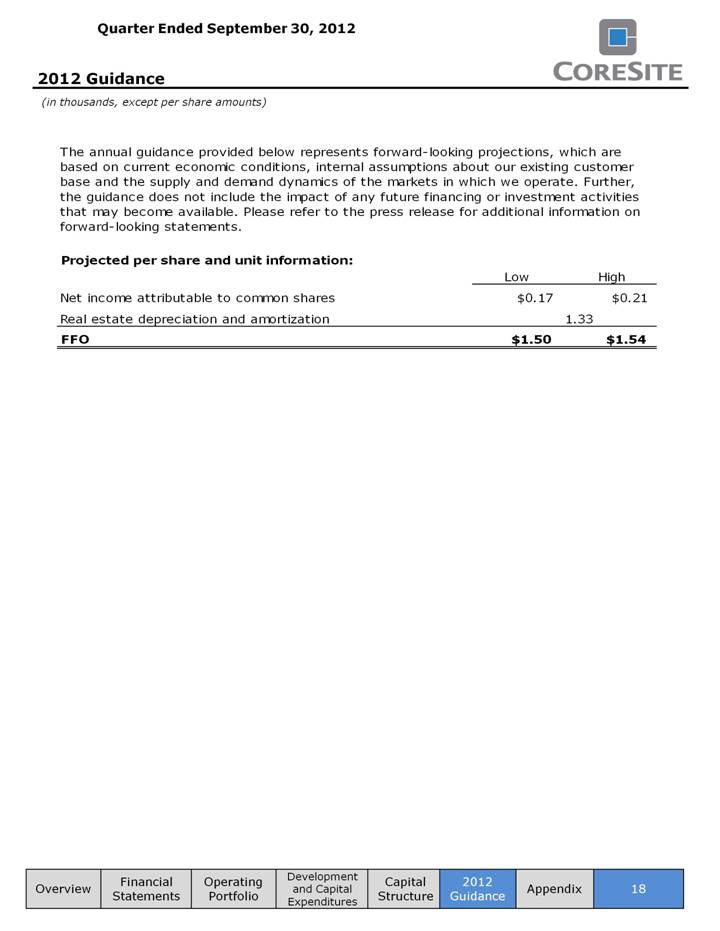
2012 Guidance (in thousands, except per share amounts) Overview Financial Statements Operating Portfolio Development and Capital Expenditures 18 Appendix Capital Structure 2012 Guidance The annual guidance provided below represents forward-looking projections, which are based on current economic conditions, internal assumptions about our existing customer base and the supply and demand dynamics of the markets in which we operate. Further, the guidance does not include the impact of any future financing or investment activities that may become available. Please refer to the press release for additional information on forward-looking statements. Projected per share and unit information: Low High Net income attributable to common shares $0.17 $0.21 Real estate depreciation and amortization 1.33 FFO $1.50 $1.54 |
|
|
Appendix This document includes certain non-GAAP financial measures that management believes are helpful in understanding our business, as further described below. Our definition and calculation of non-GAAP financial measures may differ from those of other REITs, and therefore, may not be comparable. The non-GAAP measures should not be considered an alternative to net income as an indicator of our performance and should be considered only a supplement to net income, cash flows from operating, investing or financing activities as a measure of profitability and/or liquidity, computed in accordance with GAAP. Definitions Funds From Operations “FFO” – is a supplemental measure of our performance which should be considered along with, but not as an alternative to, net income and cash provided by operating activities as a measure of operating performance and liquidity. We calculate FFO in accordance with the standards established by the National Association of Real Estate Investment Trusts (“NAREIT”). FFO represents net income (loss) (computed in accordance with GAAP), excluding gains (or losses) from sales of property and impairment write-downs of depreciable real estate, plus real estate related depreciation and amortization (excluding amortization of deferred financing costs) and after adjustments for unconsolidated partnerships and joint ventures. Our management uses FFO as a supplemental performance measure because, in excluding real estate related depreciation and amortization and gains and losses from property dispositions, it provides a performance measure that, when compared year over year, captures trends in occupancy rates, rental rates and operating costs. We offer this measure because we recognize that FFO will be used by investors as a basis to compare our operating performance with that of other REITs. However, because FFO excludes depreciation and amortization and captures neither the changes in the value of our properties that result from use or market conditions, nor the level of capital expenditures and capitalized leasing commissions necessary to maintain the operating performance of our properties, all of which have real economic effect and could materially impact our financial condition and results from operations, the utility of FFO as a measure of our performance is limited. FFO is a non-GAAP measure and should not be considered a measure of liquidity, an alternative to net income, cash provided by operating activities or any other performance measure determined in accordance with GAAP, nor is it indicative of funds available to fund our cash needs, including our ability to pay dividends or make distributions. In addition, our calculations of FFO are not necessarily comparable to FFO as calculated by other REITs that do not use the same definition or implementation guidelines or interpret the standards differently from us. Investors in our securities should not rely on these measures as a substitute for any GAAP measure, including net income. Adjusted Funds From Operations “AFFO” – is a non-GAAP measure that is used as a supplemental operating measure specifically for comparing year over year ability to fund dividend distribution from operating activities. AFFO is used by us as a basis to address our ability to fund our dividend payments. We calculate adjusted funds from operations by adding to or subtracting from FFO: Plus: Amortization of deferred financing costs Plus: Non-cash compensation Plus: Non-real estate depreciation Plus: Below market debt amortization Less: Straight line rents adjustments Less: Above and below market leases Less: Maintenance capital investment Less: Tenant improvement capital investment Less: Capitalized leasing commissions Financial Statements Operating Portfolio Development and Capital Expenditures Capital Structure 19 Appendix Overview 2012 Guidance |

|
|
Appendix AFFO is not intended to represent cash flow from operations for the period, and is only intended to provide an additional measure of performance by adjusting the effect of certain items noted above included in FFO. AFFO is a widely reported measure by other REITs, however, other REITs may use different methodologies for calculating AFFO and, accordingly, our AFFO may not be comparable to other REITs. Earnings before Interest, Taxes, Depreciation and Amortization (EBITDA) and Adjusted EBITDA - EBITDA is defined as earnings before interest, taxes, depreciation and amortization. We calculate adjusted EBITDA by adding our non-cash compensation expense, transaction costs and litigation settlement expense to EBITDA as well as adjusting for the impact of gains or losses on early extinguishment of debt. Management uses EBITDA and adjusted EBITDA as indicators of our ability to incur and service debt. In addition, we consider EBITDA and adjusted EBITDA to be appropriate supplemental measures of our performance because they eliminate depreciation and interest, which permits investors to view income from operations without the impact of non-cash depreciation or the cost of debt. However, because EBITDA and adjusted EBITDA are calculated before recurring cash charges including interest expense and taxes, and are not adjusted for capital expenditures or other recurring cash requirements of our business, their utilization as a cash flow measurement is limited. Overview 20 Appendix 2012 Guidance |
