Attached files
| file | filename |
|---|---|
| EX-21.1 - SUBSIDIARIES OF THE REGISTRANT - Artisan Partners Asset Management Inc. | d429881dex211.htm |
| EX-10.20 - INVESTMENT ADVISORY AGREEMENT - Artisan Partners Asset Management Inc. | d429881dex1020.htm |
| EX-10.19 - INVESTMENT ADVISORY AGREEMENT - Artisan Partners Asset Management Inc. | d429881dex1019.htm |
| EX-10.21 - INVESTMENT ADVISORY AGREEMENT - Artisan Partners Asset Management Inc. | d429881dex1021.htm |
| EX-23.3 - CONSENT OF MATTHEW R. BARGER - Artisan Partners Asset Management Inc. | d429881dex233.htm |
| EX-23.5 - CONSENT OF ALLEN R. THORPE - Artisan Partners Asset Management Inc. | d429881dex235.htm |
| EX-23.1 - CONSENT OF PRICEWATERHOUSECOOPERS LLP - Artisan Partners Asset Management Inc. | d429881dex231.htm |
| EX-23.4 - CONSENT OF TENCH COXE - Artisan Partners Asset Management Inc. | d429881dex234.htm |
Table of Contents
As filed with the Securities and Exchange Commission on November 1, 2012
Registration No.
UNITED STATES
SECURITIES AND EXCHANGE COMMISSION
Washington, D.C. 20549
FORM S-1
REGISTRATION STATEMENT
UNDER
THE SECURITIES ACT OF 1933
Artisan Partners Asset Management Inc.
(Exact Name of Registrant as Specified in Its Charter)
| Delaware | 6282 | 45-0969585 | ||
| (State or Other Jurisdiction of Incorporation or Organization) |
(Primary Standard Industrial Classification Code Number) |
(IRS Employer Identification Number) |
875 E. Wisconsin Avenue, Suite 800
Milwaukee, WI 53202
(414) 390-6100
(Address, Including Zip Code, and Telephone Number, Including Area Code, of Registrant’s Principal Executive Offices)
JANET D. OLSEN
Chief Legal Officer
Artisan Partners Asset Management Inc.
875 E. Wisconsin Ave., Suite 800
Milwaukee, WI 53202
(414) 390-6100
(Name, Address, Including Zip Code, and Telephone Number, Including Area Code, of Agent for Service)
Copies to:
| MARK J. MENTING CATHERINE M. CLARKIN Sullivan & Cromwell LLP 125 Broad Street New York, NY 10004 (212) 558-4000 |
VINCENT PAGANO JR. JOSHUA FORD BONNIE Simpson Thacher & Bartlett LLP 425 Lexington Avenue New York, NY 10017 (212) 455-2000 |
Approximate date of commencement of proposed sale to the public: As soon as practicable after the effective date of this Registration Statement.
If any of the securities being registered on this form are to be offered on a delayed or continuous basis pursuant to Rule 415 under the Securities Act of 1933, check the following box. ¨
If this form is filed to register additional securities for an offering pursuant to Rule 462(b) under the Securities Act, check the following box and list the Securities Act registration statement number of the earlier effective registration statement for the same offering. ¨
If this form is a post-effective amendment filed pursuant to Rule 462(c) under the Securities Act, check the following box and list the Securities Act registration statement number of the earlier effective registration statement for the same offering. ¨
If this form is a post-effective amendment filed pursuant to Rule 462(d) under the Securities Act, check the following box and list the Securities Act registration statement number of the earlier effective registration statement for the same offering. ¨
Indicate by check mark whether the registrant is a large accelerated filer, an accelerated filer, a non-accelerated filer, or a smaller reporting company. See the definitions of “large accelerated filer”, “accelerated filer” and “smaller reporting company” in Rule 12b-2 of the Securities Exchange Act of 1934. (Check one):
| Large accelerated filer | ¨ | Accelerated filer | ¨ | |||
| Non-accelerated filer | x (Do not check if a smaller reporting company) | Smaller reporting company | ¨ |
CALCULATION OF REGISTRATION FEE
|
| ||||
| Title of each class of securities to be registered | Proposed maximum offering price(1)(2) |
Amount of registration fee(3) | ||
| Class A common stock, par value $0.01 per share |
$250,000,000 | $34,100 | ||
|
| ||||
|
| ||||
| (1) | Includes additional shares of Class A common stock that the underwriters have the option to purchase. |
| (2) | Estimated solely for purposes of computing the amount of the registration fee pursuant to Rule 457(o) under the Securities Act of 1933. |
| (3) | Pursuant to Rule 457(p) under the Securities Act of 1933, the registration fee is offset by $29,025 previously paid in connection with the Registrant’s Registration Statement on Form S-1 (File No. 333-173324, filed with the Commission on April 6, 2011 and subsequently withdrawn on December 29, 2011). |
The Registrant hereby amends this Registration Statement on such date or dates as may be necessary to delay its effective date until the Registrant shall file a further amendment which specifically states that this Registration Statement shall thereafter become effective in accordance with Section 8(a) of the Securities Act of 1933 or until the Registration Statement shall become effective on such date as the Commission, acting pursuant to said Section 8(a), may determine.
Table of Contents
The Information in this preliminary prospectus is not complete and may be changed. These securities may not be sold until the registration statement filed with the Securities and Exchange Commission is effective. This preliminary prospectus is not an offer to sell nor does it seek an offer to buy these securities in any jurisdiction where the offer or sale is not permitted.
Subject to Completion. Dated November 1, 2012.
Shares

Class A Common Stock
This is an initial public offering of shares of Class A common stock of Artisan Partners Asset Management Inc. All of the shares of Class A common stock included in this offering are being sold by Artisan Partners Asset Management Inc.
Prior to this offering, there has been no public market for our Class A common stock. We expect the initial public offering price per share to be between $ and $ . We have applied to list our Class A common stock on the New York Stock Exchange under the symbol “APAM”.
In connection with this offering and the related reorganization transactions, each of our employee-partners and our current general partner will enter into a stockholders agreement pursuant to which they will grant to a stockholders committee the right to vote all of their shares of our common stock they hold at such time or may acquire from us in the future. Following the consummation of this offering, Andrew A. Ziegler, our Executive Chairman, will have the sole right, in consultation with the other members of the stockholders committee, to determine how to vote all such shares. As a result, the stockholders committee, and initially solely Mr. Ziegler, will be able to elect all of the members of our board of directors (subject to the obligation of the stockholders committee under the terms of the stockholders agreement to vote in support of certain nominees) and thereby effectively control our management and affairs for so long as the stockholder group holds at least a majority of the combined voting power of our capital stock. The stockholders committee may control our management and affairs even if the shares subject to the stockholders agreement represent less than a majority of the number of outstanding shares of our capital stock. The purchasers of the shares of Class A common stock included in this offering will not be invited to enter and will never be a party to the stockholders agreement.
We are an “emerging growth company” under the federal securities laws and, as such, are eligible for reduced public company reporting and other requirements. See “Risk Factors” beginning on page 22 to read about factors you should consider before buying shares of the Class A common stock.
Neither the Securities and Exchange Commission nor any other regulatory body has approved or disapproved of these securities or passed upon the accuracy or adequacy of this prospectus. Any representation to the contrary is a criminal offense.
| Per Share | Total | |||||||
| Initial public offering price |
$ | $ | ||||||
| Underwriting discount |
$ | $ | ||||||
|
|
|
|
|
|||||
| Proceeds, before expenses, to Artisan Partners Asset Management Inc. |
$ | $ | ||||||
|
|
|
|
|
|||||
To the extent that the underwriters sell more than shares of Class A common stock, the underwriters have the option to purchase up to an additional shares from Artisan Partners Asset Management Inc. at the initial public offering price less the underwriting discount.
The underwriters expect to deliver the shares of Class A common stock against payment in New York, New York on , 2013.
| Citigroup | Goldman, Sachs & Co. |
| BofA Merrill Lynch | Morgan Stanley | |||
| Scotiabank |
Prospectus dated , 2013.
Table of Contents
DIVERSIFIED BUSINESS BY INVESTMENT TEAM AND DISTRIBUTION CHANNEL

WITH STRONG LONG-TERM PERFORMANCE ACROSS ALL STRATEGIES(2)
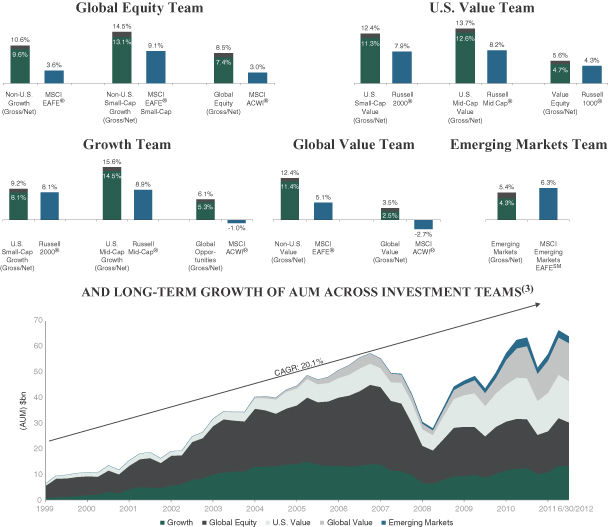
| (1) | The allocation of assets under management, or AUM, by distribution channel involves the use of estimates and the exercise of judgment. See “Performance and Assets Under Management Information Used in this Prospectus” for more information. |
| (2) | Our average annual returns presented above are gross and net of our advisory fees, for the period from composite inception to June 30, 2012. Each MSCI Index and Russell Index presented above is the index we use in assessing the returns of our composites. Historical returns are not necessarily indicative of future performance of our current or future investment strategies. For additional details on investment performance, please see pages 136 to 149 of this prospectus. See also “Performance and Assets Under Management Information Used in this Prospectus”. |
| (3) | At December 31st of each year, unless otherwise specified. |
Table of Contents
| Page | ||||
| 1 | ||||
| 15 | ||||
| Summary Selected Historical and Pro Forma Consolidated Financial Data |
19 | |||
| 22 | ||||
| 47 | ||||
| 48 | ||||
| 75 | ||||
| 76 | ||||
| 78 | ||||
| 79 | ||||
| 81 | ||||
| 91 | ||||
| Management’s Discussion and Analysis of Financial Condition and Results of Operations |
94 | |||
| 130 | ||||
| 154 | ||||
| 157 | ||||
| 179 | ||||
| 181 | ||||
| 184 | ||||
| 192 | ||||
| Material U.S. Federal Tax Considerations for Non-U.S. Holders of our Class A Common Stock |
195 | |||
| 198 | ||||
| 203 | ||||
| F-1 |
Through and including , 2013 (the 25th day after the date of this prospectus), all dealers effecting transactions in these securities, whether or not participating in this offering, may be required to deliver a prospectus. This is in addition to a dealer’s obligation to deliver a prospectus when acting as an underwriter and with respect to unsold allotments or subscriptions.
We are responsible for the information contained in this prospectus and in any free writing prospectus we may authorize to be delivered to you. We have not authorized anyone to give you any other information, and take no responsibility for any other information that others may give you. This prospectus is an offer to sell only the shares offered hereby, but only under circumstances and in jurisdictions where it is lawful to do so. The information contained in this prospectus is current only as of its date.
Except where the context requires otherwise, in this prospectus:
| • | “AIC” refers to Artisan Investment Corporation, an entity controlled by Andrew A. Ziegler and Carlene M. Ziegler, who are married to each other, and through which Mr. Ziegler and Mrs. Ziegler maintain their ownership interests in Artisan Partners Holdings; |
| • | “Artisan Funds” refers to Artisan Partners Funds, Inc., a family of Securities and Exchange Commission registered mutual funds; |
| • | “Artisan Global Funds” refers to Artisan Partners Global Funds Public Limited Company, a family of Ireland-domiciled funds organized pursuant to the European Union’s Undertaking for Collective Investment in Transferable Securities; |
Table of Contents
| • | “Artisan Partners Asset Management Inc.”, “Artisan”, “Artisan Partners Asset Management”, the “company”, “we”, “us” and “our” refer to Artisan Partners Asset Management Inc., a Delaware corporation, and, unless the context otherwise requires, its direct and indirect subsidiaries, and, for periods prior to this offering, “Artisan,” the “company,” “we,” “us” and “our” refer to Artisan Partners Holdings LP and, unless the context otherwise requires, its direct and indirect subsidiaries; |
| • | “Artisan Partners Holdings” refers to Artisan Partners Holdings LP, a limited partnership organized under the laws of the State of Delaware, and, unless the context otherwise requires, its direct and indirect subsidiaries; |
| • | “client” and “clients” refer to investors who access our investment management services by engaging us to manage a separate account in one of our investment strategies or by investing in mutual funds, including the funds of Artisan Funds or Artisan Global Funds, collective investment trusts (which are pools of retirement plan assets maintained by a bank or trust company that we manage on a separate account basis), or other pooled investment vehicles for which we are investment adviser; and |
| • | “employee” includes members of Artisan Partners UK LLP and limited partners of Artisan Partners Holdings whose full-time professional efforts are devoted to providing services to us. |
-ii-
Table of Contents
Performance and Assets Under Management Information Used in this Prospectus
We manage investments primarily through mutual funds and separate accounts. We serve as investment adviser to Artisan Funds, a family of Securities and Exchange Commission, or the SEC, registered mutual funds, and as investment manager and promoter of Artisan Global Funds, a family of Ireland-domiciled funds organized pursuant to the European Union’s Undertaking for Collective Investment in Transferable Securities, or UCITS. We refer to funds and other accounts that are managed by us with a broadly common investment objective and substantially in accordance with a single model account as being part of the same “strategy”. We measure the results both of our individual funds and of our “composites”, which represent the aggregate performance of all discretionary client accounts, including mutual funds, invested in the same strategy, except those accounts with respect to which we believe client-imposed socially-based restrictions may have a material impact on portfolio construction and those accounts managed in a currency other than U.S. dollars (the results of these accounts, which represented approximately 7% of our assets under management at June 30, 2012, are maintained in separate composites, which are not presented in this prospectus).
Results for any investment strategy described herein, and for different investment products within a strategy, are affected by numerous factors, including: different material market or economic conditions; different investment management fee rates, brokerage commissions and other expenses; and the reinvestment of dividends or other earnings. The returns for any strategy may be positive or negative, and past performance does not guarantee future results.
Throughout this prospectus, we present the average annual returns and annual returns of our composites on a “gross” and “net” basis, which represent average annual returns and annual returns before and after payment of the highest fee payable to us by any portfolio in the composite, respectively, and in each case are net of commissions and transaction costs. In this prospectus, we also present the average annual returns and annual returns of certain market indices or “benchmarks” for the comparable period. Indices that are used for these performance comparisons are broad-based market indices that we believe are appropriate comparisons of our investment performance over a full market cycle and, for some of our strategies, style-based indices that we believe may be useful in evaluating our performance over shorter periods. The indices are unmanaged and have differing volatility, credit and other characteristics. You should not assume that there is any material overlap between the securities included in the portfolios of our investment strategies during these periods and those that comprise any MSCI Index or any Russell Index referred to in this prospectus. It is not possible to invest directly in any of the indices described above or listed below. The returns of these indices, as presented in this prospectus, have not been reduced by fees and expenses associated with investing in securities, but do include the reinvestment of dividends. In this prospectus, we refer to the date on which we began tracking the performance of an investment strategy as that strategy’s “inception date”.
The MSCI EAFE® Index, the MSCI EAFE® Growth Index, the MSCI EAFE® Small Cap Index, the MSCI EAFE® Value Index, the MSCI ACWI® Index and the MSCI Emerging Markets IndexSM are trademarks of MSCI Inc. MSCI Inc. is the owner of all copyrights relating to these indices and is the source of the performance statistics of these indices that are referred to in this prospectus.
The Russell 2000® Index, the Russell 2000® Value Index, the Russell Midcap® Index, the Russell Midcap® Value Index, the Russell 1000® Index, the Russell 1000® Value Index, the Russell Midcap® Growth Index, the Russell 1000® Growth Index and the Russell 2000® Growth Index are trademarks of Russell Investment Group. Russell Investment Group is the owner of all copyrights relating to these indices and is the source of the performance statistics that are referred to in this prospectus.
In this prospectus, we present Morningstar, Inc., or Morningstar, ratings for series of Artisan Funds. The Morningstar ratings refer to the ratings by Morningstar of the Investor Class and Advisor Class shares of the series of Artisan Funds and are based on a 5-star scale. Morningstar data contained herein (1) is proprietary to Morningstar and/or its content providers, (2) may not be copied or distributed and (3) is not warranted to be
-iii-
Table of Contents
accurate, complete or timely. Neither Morningstar nor its content providers are responsible for any damages or losses arising from any use of this information. For each fund with at least a three-year history, Morningstar calculates a Morningstar Rating™, which is based on a Morningstar Risk-Adjusted Return measure that accounts for variation in a fund’s monthly performance, including the effects of sales charges, loads, and redemption fees, placing more emphasis on downward variations and rewarding consistent performance. The top 10% of funds in each category receive 5 stars, the next 22.5% receive 4 stars, the next 35% receive 3 stars, the next 22.5% receive 2 stars and the bottom 10% receive 1 star. The Overall Morningstar RatingTM is derived from a weighted average of the performance figures associated with the rated fund’s three-, five- and 10-year Morningstar Rating metrics.
We also present Lipper rankings for series of Artisan Funds. Lipper rankings are based on total return, are historical and do not represent future results. The number of funds in a category may include multiple share classes of the same fund, which may have a material impact on a fund’s ranking within a category. Lipper, a Thomson Reuters company, is the owner of all trademarks and copyrights relating to Lipper rankings.
Throughout this prospectus, we present historical information about our assets under management, including information about changes in our assets under management due to gross client cash inflows and outflows, market appreciation and depreciation and transfers between investment vehicles (i.e., Artisan Funds and separate accounts). Gross client cash inflows and outflows represent client fundings, terminations and client initiated contributions and withdrawals (which could be in cash or in securities). Market appreciation (depreciation) represents realized gains and losses, the change in unrealized gains and losses, net income and certain miscellaneous items, immaterial in the aggregate, which may include payment of Artisan’s management fees or payment of custody expenses to the extent a client causes these fees to be paid from the account we manage. We also present information about our average assets under management for certain periods. We use our information management systems to track our assets under management, the components of market appreciation and depreciation, and client inflows and outflows, and we believe the information set forth in this prospectus regarding our assets under management, market appreciation and depreciation, and client inflows and outflows is accurate in all material respects. We also present in this prospectus information regarding the amount of our assets under management and client inflows and outflows sourced through particular investment vehicles and distribution channels. The allocation of assets under management and client flows sourced through particular distribution channels involves estimates because precise information on the sourcing of assets invested in Artisan Funds through intermediaries is not available on a complete or timely basis and involves the exercise of judgment because the same assets, in some cases, might fairly be said to have been sourced from more than one distribution channel. We have presented the information on our assets under management and client inflows and outflows sourced by distribution channel in the way in which we prepare and use that information in the management of our business. Data on our assets under management sourced by distribution channel and client inflows and outflows are not subject to our internal controls over financial reporting.
Any discrepancies included in this prospectus between totals and the sums of the amounts listed are due to rounding.
None of the information in this prospectus or the registration statement constitutes either an offer or a solicitation to buy or sell any fund securities, nor is any such information a recommendation for any fund security or investment service.
-iv-
Table of Contents
This summary highlights information contained elsewhere in this prospectus. This summary does not contain all of the information that you should consider before deciding to invest in our Class A common stock. You should read this entire prospectus carefully, including the “Risk Factors” section, our historical consolidated financial statements and the notes thereto, and unaudited pro forma financial information, each included elsewhere in this prospectus.
Our Business
Founded in 1994, we are an independent investment management firm that provides a broad range of U.S., non-U.S. and global equity investment strategies and managed a total of $64.1 billion in assets as of June 30, 2012. We have established a record of investment excellence with attractive and consistent investment performance across multiple strategies and products. Through June 30, 2012, 11 of our 12 investment strategies (comprising 96% of our assets under management) had outperformed their respective benchmarks, on a gross and net basis, since inception, with inception dates ranging from April 1, 1995 for our U.S. Small-Cap Growth strategy to April 1, 2010 for our Global Equity strategy.
Since our founding, we have pursued a business model that is designed to maximize our ability to produce attractive investment results for our clients, and we believe this model has contributed to our success in doing so. We focus on attracting, retaining and developing talented investment professionals by creating an environment in which each investment team is provided ample resources and support, transparent, direct and predictable financial incentives, and a high degree of investment autonomy without imposing a centralized research function. We currently offer 12 actively-managed equity investment strategies, managed by five distinct investment teams. Each team is led by one or more experienced portfolio managers with a track record of investing success and is devoted to identifying long-term investment opportunities. We believe this autonomous structure promotes independent analysis and accountability among our investment professionals, which we believe promotes superior investment results.
Our 12 equity investment strategies span different market capitalization segments and investing styles in both U.S. and non-U.S. markets. Each strategy is designed to have a clearly articulated, consistent and replicable investment process that is well-understood by clients and managed to achieve superior long-term performance. Throughout our history, we have expanded our investment management capabilities in a disciplined manner that we believe is consistent with our overall philosophy of offering high value-added investment strategies in growing asset classes. Our business leaders work closely with each investment team to develop that team into an investment “franchise” with multiple investment decision-makers and the capacity to make a substantial contribution to our financial results. We have successfully expanded the range of strategies that we offer by launching new strategies managed by our existing investment teams as those teams have developed investment capacity, as well as by launching new strategies managed by new investment teams recruited to join Artisan.
In addition to our investment teams, we have a strong and seasoned management team that is focused on our business objectives of achieving profitable growth, expanding our investment capabilities, diversifying the source of our assets under management and delivering superior client service. Our management team supports our investment management capabilities and manages a centralized infrastructure, which allows our investment professionals to focus primarily on making investment decisions and generating attractive returns for our clients.
The combination of our superior investment performance and our strong business management has allowed us to attract and retain a diverse base of clients across a range of distribution channels and to increase our assets under management over time. Our assets under management have increased from $15.6 billion as of December 31, 2001 to $64.1 billion as of June 30, 2012, representing a compound annual growth rate, or CAGR, of 14.4%.
Table of Contents
We offer our investment management capabilities primarily to institutions and through intermediaries that operate with institutional-like decision-making processes and have longer-term investment horizons, by means of separate accounts and mutual funds. As of June 30, 2012, we managed separate accounts representing $29.1 billion, or 45%, of our assets under management in 173 separate accounts spanning 124 client relationships, including pension and profit sharing plans, trusts, endowments, foundations, charitable organizations, government entities, private funds and non-U.S. pooled investment vehicles that are generally comparable to U.S. mutual funds, as well as mutual funds, non-U.S. funds and collective trusts we sub-advise. We serve as the investment adviser to Artisan Funds, an SEC-registered family of mutual funds that offers shares in multiple classes designed to meet the needs of a range of institutional and other investors, and as investment manager and promoter of Artisan Global Funds, a family of Ireland-based UCITS funds that began operations in the first quarter of 2011 and offers shares to non-U.S. investors. Artisan Funds and Artisan Global Funds comprised $34.9 billion, or 55%, of our assets under management as of June 30, 2012.
We access traditional institutional clients primarily through relationships with investment consultants and access institutional-like investors primarily through consultants, alliances with major defined contribution/401(k) platforms and relationships with fee-based financial advisors and broker-dealers.
We derive essentially all of our revenues from investment management fees, which primarily are based on a specified percentage of clients’ average assets under management. Our growth in assets under management has resulted in an increase in our revenues from $101.5 million for the year ended December 31, 2001 to $462.4 million for the 12 months ended June 30, 2012. We believe our talent-focused business model, attractive range of high value-added equity investment strategies, track record of investment excellence and thoughtful approach to distribution and client service position us well for future growth.
As of June 30, 2012, we had 270 employees, including 47 employee-partners. Immediately following the completion of this offering, our investment professionals, senior management and other employees will collectively own approximately % of the economic interests in our company. Our culture of employee ownership strongly aligns our management’s and clients’ interests in our delivery of strong investment performance and growth.
Following the completion of this offering, we will conduct all of our business activities through operating subsidiaries of our direct subsidiary Artisan Partners Holdings, an intermediate holding company of which we are the general partner. Based on the ownership that will exist immediately after giving effect to the transactions described herein, net profits and net losses of Artisan Partners Holdings will be allocated, and distributions of profits will be made (subject to the H&F preference, as described under “Our Structure and Reorganization—Reorganization Transactions—Preferential Distributions to Holders of Preferred Units and Convertible Preferred Stock”), approximately % to us and % in the aggregate to Artisan Partners Holdings’ limited partners (or % and %, respectively, if the underwriters exercise their option to purchase additional shares in full). See “Our Structure and Reorganization”.
Competitive Strengths
We believe that our success as an investment manager is based on the following competitive strengths:
Talent-Focused Business Model. We believe that the success of an investment management firm depends on the talent of its professionals. As a result, we have implemented a business model that is designed to attract, develop and retain talented investment professionals by allowing them to focus on portfolio management in an environment conducive to producing their best work on a consistent, long-term basis. We have a strong philosophical belief in the autonomy of each investment team. We provide each investment team with ample resources and support, without imposing a centralized research function. We believe this structure differentiates us from those of our competitors who function with an integrated structure in which there is less investment team
-2-
Table of Contents
autonomy. At the same time, we have experienced business leadership that manages a team of dedicated client service professionals and a centralized infrastructure, and we work to reduce the demands on our investment professionals from responsibilities not directly related to managing client portfolios.
Our business leaders work closely with each Artisan investment team to develop that team into an investment franchise with multiple investment decision-makers and natural, internal succession, a solid, repeatable investment process, a strong long-term performance track record, a diversified client base, dedicated resources, and the capacity to make a significant contribution to our financial results. As a team grows into an investment franchise, the team develops the capacity to manage multiple strategies, growth opportunities for members of the team are created, and portfolio managers are encouraged by the potential evolution of their responsibilities over time to extend their careers and their contributions to our success. Developing an investment team into an investment franchise involves identifying, evaluating and developing investment professionals who are the right fit for our strategy and business model. Our rigorous standards are evidenced by the select number of senior investment professionals we have added over the years. Over our nearly 18-year history, we have had no significant turnover among our portfolio managers. Minimizing such turnover is a significant part of the responsibilities of our senior business management team.
Attractive Range of Diverse, High Value-Added Equity Investment Strategies. We have five distinct investment teams that currently manage a diverse array of 12 equity investment strategies. These U.S., non-U.S. and global equity investment strategies are diversified by market capitalization and investment style and are focused on areas that we believe provide opportunities to generate returns in excess of the relevant benchmarks. Each of our investment teams has its own dedicated research personnel and works independently from our other investment teams. We believe this investment autonomy increases the degree to which the investment performance of each of our teams is generated by independent ideas that are distinct from the investments pursued by our other teams. As of June 30, 2012, our largest strategy accounted for approximately 26% of our total assets under management and none of our investment teams managed more than approximately 27% of our total assets under management.
Track Record of Investment Excellence. Through June 30, 2012, 11 of our 12 investment strategies had outperformed their benchmarks, on a gross and net basis, since inception, with inception dates ranging from April 1, 1995 for our U.S. Small-Cap Growth strategy to April 1, 2010 for our Global Equity strategy. Nine of the 11 series of Artisan Funds eligible for Morningstar ratings, representing 95% of the assets of Artisan Funds and managed in strategies representing 94% of our total assets under management, had an Overall Morningstar Rating™ of 4 or 5 stars as of June 30, 2012. Investment performance highlights of our three largest strategies include:
| • | Non-U.S. Growth is our largest strategy and accounted for approximately 26% of our assets under management as of June 30, 2012. It is managed by our Global Equity investment team. Our Non-U.S. Growth composite has outperformed its benchmark by an average of 697 basis points annually from inception in 1996 through June 30, 2012 (calculated on an average annual gross basis before payment of fees). Artisan International Fund, which is managed in our Non-U.S. Growth strategy, is ranked as of June 30, 2012 #49 of 118 funds over the trailing 10 years, and #1 of 44 funds from inception (December 1995) in Lipper’s international large-cap growth category. See “Performance and Assets Under Management Information Used in this Prospectus”. |
| • | U.S. Mid-Cap Growth accounted for approximately 18% of our assets under management as of June 30, 2012. It is managed by our Growth investment team. Our U.S. Mid-Cap Growth composite has outperformed its benchmark by an average of 667 basis points annually from inception in 1997 through June 30, 2012 (calculated on an average annual gross basis before payment of fees). Artisan Mid Cap Fund, which is managed in our U.S. Mid-Cap Growth strategy, is ranked as of June 30, 2012 #32 of 245 funds over the trailing 10 years, and #1 of 108 funds from inception (June 1997) in Lipper’s multi-cap growth category. See “Performance and Assets Under Management Information Used in this Prospectus”. |
-3-
Table of Contents
| • | U.S. Mid-Cap Value accounted for approximately 17% of our assets under management as of June 30, 2012. It is managed by our U.S. Value investment team. Our U.S. Mid-Cap Value composite has outperformed its benchmark by an average of 629 basis points annually from inception in 1999 through June 30, 2012 (calculated on an average annual gross basis before payment of fees). Artisan Mid Cap Value Fund, which is managed in our U.S. Mid-Cap Value strategy, is ranked as of June 30, 2012 #7 of 107 funds over the trailing 10 years, and #7 of 87 funds from inception (March 2001) in Lipper’s mid-cap value category. See “Performance and Assets Under Management Information Used in this Prospectus”. |
We have been successful at generating attractive long-term investment performance on a consistent basis. Over the five-year period ended June 30, 2012, strategies representing approximately 96% of our total assets under management had outperformed their relevant benchmarks. A similar measure of trailing five-year investment performance relative to benchmarks taken at each of December 31, 2011, December 31, 2010 and December 31, 2009 indicates that strategies representing 95%, 99% and 99% of our total assets under management at each such date, respectively, were outperforming their relevant benchmarks.
Disciplined Growth—Balancing Investment Integrity, Investment Performance and Sustainable Demand. We manage our business with a long-term view. We launch a new strategy only when we believe it has the potential to achieve superior investment performance in an area that we believe will have sustained client demand at attractive fee rates over the long term. We strive to maintain the integrity of the investment process followed in each of our strategies by rigorous adherence to the investment parameters we have communicated to our clients. We also carefully monitor our investment capacity in each investment strategy. We believe that management of our investment capacity protects our ability to manage assets successfully, which protects the interests of our clients and, in the long term, protects our ability to retain client assets and maintain our fee schedules and profit margins. In order to better achieve our long-term goals, we are willing to close a strategy to new investors or otherwise take action to slow or restrict its growth when appropriate, even though our short-term results may be impacted. Currently, we have closed our Non-U.S. Small-Cap Growth, Non-U.S. Value, U.S. Mid-Cap Growth, U.S. Small-Cap Value and U.S. Mid-Cap Value strategies to most new investors and client relationships. Each of the strategies that we have offered to clients during our history continues in operation today.
Institutionally Oriented Client Base. We target discrete market segments that we believe offer attractive growth opportunities, which include institutions and intermediaries that operate with institutional-like decision-making processes and have longer-term investment horizons, and where we believe we have a well-recognized brand. Our original focus was on traditional institutional investors, including corporate and public pension plans, foundations and endowments. We believed these investors were often more focused on the integrity of the investment process and consistency of long-term investment performance than some other types of investors, which offered the potential for relationships of longer duration. As other market segments have evolved to have more institutional-like decision-making processes and longer-term investment horizons, we have expanded our distribution efforts into those areas, including defined contribution/401(k) administrators, broker-dealer fee-based programs and fee-based financial advisors. We have had significant success in attracting client assets from the defined contribution/401(k) market, and have experienced strong growth in assets through broker-dealers, where fee-based programs using centralized, institutional-like decision-making processes continue to grow.
As of June 30, 2012, we managed 173 separate accounts spanning 124 client relationships, including pension and profit sharing plans, trusts, endowments, foundations, charitable organizations, government entities, private funds and non-U.S. pooled investment vehicles that are generally comparable to U.S. mutual funds, as well as mutual funds, non-U.S. funds and collective trusts we sub-advise. Our largest client relationship, other than Artisan Funds, represented approximately 5% of our assets under management and no single consulting firm represented clients (including investors in Artisan Funds) having more than 6% of our assets under management.
-4-
Table of Contents
No single 401(k) platform, broker-dealer or financial advisor relationship represented more than 7%, 3% or 1%, respectively, of our assets under management.
Attractive Financial Model. We focus on high value-added strategies in asset classes that support fee rates that are above average for the asset management industry generally. We also have designed our expense structure to be flexible. The majority of our operating expenses, including incentive compensation and mutual fund intermediary fees, vary directly with our revenues and the amount of our assets under management. We believe that our model of relatively low fixed costs and relatively high variable costs is efficient and flexible, and historically has generated attractive adjusted operating margins and strong cash flow, even during challenging market conditions.
Ownership Culture That Aligns Interests. We believe that broad equity ownership of our business by our investment professionals and senior management is critical in aligning the interests of our clients, stockholders, investment professionals and management. Broad employee ownership helps us to attract talented investment professionals who have the ability to achieve attractive long-term investment performance. Attractive long-term investment performance benefits our clients and generally leads to growth in our assets under management. Growth in our assets under management enhances our financial results. Strong financial results drive the value of our equity, thereby helping us to attract and retain talented investment professionals. Immediately following the completion of this offering, our investment professionals, senior management and other employees will collectively own approximately % of the economic interests in our company. Following our transition to a public company, we intend to continue to promote broad and substantial equity ownership by our investment professionals and senior management through grants of equity interests and inclusion of equity interests as an element of compensation.
Strategy
Our strategy for continued success and future growth is guided by the following principles:
Execute Proven Business Model. The cornerstone of our strategy is to continue to promote our business model of attracting, developing and retaining talented investment professionals. We remain committed to investment team autonomy, to ensuring that our teams are able to focus on portfolio management and to fostering an environment that is attractive for our teams because they are able to do their best work on a consistent, long-term basis. We actively seek to identify new investment talent and teams both within and outside Artisan. Our business leaders will continue to work closely with each investment team to develop that team into an investment franchise with multiple decision-makers with natural, internal succession, a solid repeatable investment process, a strong long-term investment track record, a diversified client base, dedicated resources and the capacity to make a substantial contribution to our financial results. We are committed to the continuing development of our existing investment teams and we are open to the possibility of adding new investment teams, through hiring or acquisitions, when our rigorous standards have been met.
Deliver Profitable and Sustainable Financial Results. As a public company, we will continue to focus on delivering profitable and sustainable financial results. We are committed to managing high value-added strategies capable of supporting above-average fee rates. We intend to maintain our flexible financial profile through our highly variable expense structure with centralized infrastructure and investment team support.
Capitalize on our “Realizable Capacity” in Products with Strong Client Demand. We believe that growth in assets under management in an investment strategy requires investment capacity in the strategy (which is driven by the availability of attractive investment opportunities relative to the amount of assets under management in the strategy) at a time when the strategy has a competitive performance track record and there is stable or growing client demand for the strategy or asset class. When we believe that each of these factors is
-5-
Table of Contents
present with respect to an investment strategy, we say we have “realizable capacity” in that strategy. We believe that we currently have realizable capacity particularly in our non-U.S. and global strategies, where we believe we are well-positioned to take advantage of increasing client demand. We have leveraged our strength in these areas by launching new products from our Global Value team, which launched our Global Value strategy in July 2007, from our Growth Team, which launched our Global Opportunities strategy in February 2007, from our Emerging Markets team, which launched our Emerging Markets strategy in 2006, and from our Global Equity team, which launched our Global Equity strategy in March 2010. We also believe that we have realizable capacity in our Value Equity strategy, which is designed to appeal to client demand for strategies with greater investment flexibility. We intend to focus on attracting additional assets under management in these strategies from our current client base and through our existing intermediary relationships, as well as from the continued expansion of our distribution efforts.
Expand Distribution and Focus on Investment Strategies Generating Sustainable Demand. We will remain focused on institutional and institutional-like clients and intermediaries and will continue to offer high value-added investment strategies with market demand that we believe is sustainable, avoiding fad and niche products with limited long-term growth prospects. We expect to see growing interest among institutional investors in strategies focused on non-U.S. and global investments. We seek to further penetrate the defined contribution/401(k) market and the broker-dealer and the fee-based financial advisor markets with our style-oriented investment strategies, including our Value Equity strategy, which has an attractive performance track record and significant investment capacity. We are also expanding our distribution effort into non-U.S. markets, including the United Kingdom, other member countries of the European Union, Australia and certain Asian countries, among others, where we believe there is growing institutional demand for global and non-U.S. investment strategies, such as our Global Value, Global Equity and Global Opportunities strategies. As part of those efforts, we organized Artisan Global Funds, a family of Ireland-based UCITS funds that began operations during the first quarter of 2011 and offers shares to non-U.S. investors. We have seen strong results from these non-U.S. distribution efforts, as a significant part of our net client cash flows over the last three years through June 30, 2012 has come from clients domiciled outside the United States.
To support the consistent communication of our brand through our global distribution efforts and public relations activities, we are engaged in firm branding efforts that include the expansion and customization of our websites, increasing our use of digital media including video, targeted client events and conferences, and tactical marketing campaigns. Recent campaigns have focused on our investment culture, the experience of our investment teams, third-party awards received by the firm and our portfolio managers, and our global investment capabilities. Our branding efforts are improved by our marketing intelligence program, through which we analyze the effectiveness and reach of our branding efforts through various marketing channels. The program is designed to help us allocate marketing resources efficiently by identifying and prioritizing marketing efforts that successfully reach our target audience most efficiently.
Continue to Develop Artisan Leadership. We will continue to develop additional leaders for the company and for each investment team. We will also continue to work with each of our investment teams to develop its talent so that each team’s investment capabilities are expanded and natural internal succession continues to be developed. We believe that our culture of equity ownership has been instrumental in supporting the development of seasoned investment and business leaders. We intend to continue to promote broad and substantial equity ownership of our company by our employees.
Continue Disciplined Approach to Growth. We intend to continue to manage our business with a long-term view. We will launch a new strategy only when we believe it has the potential to achieve superior investment performance in an area that we believe will have sustained client demand at attractive fee rates over the long term. We intend to continue to actively manage our investment capacity to protect our ability to manage client assets successfully, which protects the interests of our clients and our own long-term interests, and we will seek to continue to diversify our client base to enhance the stability of our assets under management.
-6-
Table of Contents
Why We Are Going Public
We believe that becoming a public company is important to the evolution of our business for three principal reasons:
| • | to preserve our independence by establishing a process for existing owners to realize the value of their equity over a structured time frame (see “Our Structure and Reorganization—Offering Transactions—Resale and Registration Rights Agreement—Restrictions on Sale”); |
| • | to allow us to maintain our equity ownership culture and support our talent-focused business model by establishing a mechanism for sharing ownership among value-producing employees; and |
| • | to create additional financial flexibility, which we believe will allow us to continue to manage and grow our business in a disciplined way. |
Risk Factors
An investment in our Class A common stock involves substantial risks and uncertainties. These risks and uncertainties include, among others, the following:
| • | The loss of key members of our investment teams and senior management could have a material adverse effect on our business. Our ability to attract and retain qualified investment, management and marketing and client service professionals is critical to our success. |
| • | If our investment strategies perform poorly for any reason, including due to a declining stock market, general economic downturn or otherwise, clients could withdraw their funds and we could suffer a decline in our assets under management and/or become subject to litigation, which would reduce our earnings. |
| • | The historical returns of our existing investment strategies may not be indicative of their future results or of the results of investment strategies we may develop in the future. |
| • | Difficult market conditions can adversely affect our business in many ways, including by reducing the value of our assets under management and causing clients to withdraw funds, each of which could materially reduce our revenues and adversely affect our financial condition. |
| • | Several of our investment strategies invest principally in the securities of non-U.S. companies, which involve foreign currency exchange, tax, political, social and economic uncertainties and risks. |
| • | We derive a substantial portion of our revenues from a limited number of our investment strategies. |
| • | We may be unable to maintain our fee structure at current rates. |
| • | Control by AIC and our employee-partners of % of the combined voting power of our capital stock may give rise to conflicts of interest. |
| • | We must pay certain of our existing owners for certain tax benefits that we claim, and such amounts are expected to be substantial. |
The foregoing is not a comprehensive list of the risks and uncertainties we face. Investors should carefully consider all of the information in this prospectus, including information under “Risk Factors”, prior to making an investment in our Class A common stock.
-7-
Table of Contents
Our Structure and Reorganization
The diagram below depicts our organizational structure immediately after this offering and the related reorganization transactions.
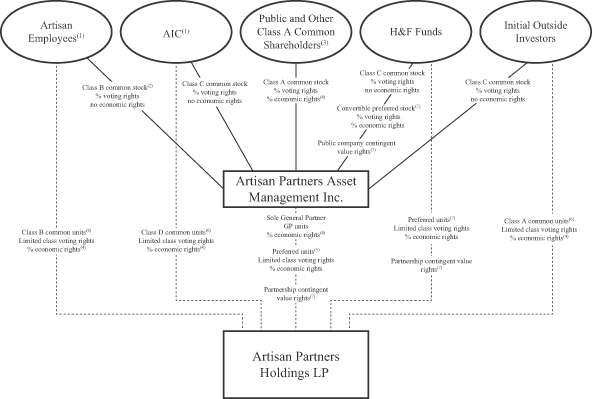
| (1) | Each of our employee-partners and AIC will enter into a stockholders agreement with respect to all shares of our common stock they hold at such time or may acquire from us in the future, pursuant to which they will grant an irrevocable voting proxy to a stockholders committee, as described under “Our Structure and Reorganization—Stockholders Agreement”. |
| (2) | Each share of Class B common stock will initially entitle its holder to five votes per share. The stockholders committee will hold an irrevocable proxy to vote the shares of common stock of Artisan Partners Asset Management held by the Class B common stockholders until the stockholders agreement terminates. |
| (3) | Includes restricted shares of our Class A common stock, representing % of the voting rights in Artisan Partners Asset Management, that we intend to grant to our non-employee directors in connection with this offering. |
| (4) | Economic rights of the Class A common stock, the common units and the GP units are subject to the H&F preference as described under “Our Structure and Reorganization—Reorganization Transactions—Preferential Distributions to Holders of Preferred Units and Convertible Preferred Stock”. |
| (5) | We will be obligated to vote the preferred units we hold at the direction of our convertible preferred stockholders as described under “Our Structure and Reorganization—Offering Transactions—Amended and Restated Limited Partnership Agreement of Artisan Partners Holdings”. |
| (6) | Each class of common units generally will entitle its holders to the same economic and voting rights in Artisan Partners Holdings as each other class of common units, as described under “Our Structure and Reorganization—Offering Transactions—Amended and Restated Limited Partnership Agreement of Artisan Partners Holdings—Economic Rights of Partners” and “Our Structure and Reorganization—Offering Transactions—Amended and Restated Limited Partnership Agreement of Artisan Partners Holdings—Voting and Class Approval Rights”, respectively. |
-8-
Table of Contents
| (7) | The preferred units of Artisan Partners Holdings, as well as our convertible preferred stock and the contingent value rights, or CVRs, each as described below, are collectively intended to provide the H&F holders with economic and voting rights following the reorganization transactions similar (although not identical) to the economic and voting rights they possessed prior to the reorganization. The CVRs may require us to make a cash payment to the holders thereof on July 11, 2016, or, if earlier, five business days after the effective date of a change of control of Artisan, unless the average of the daily volume weighted average price, or VWAP, of our Class A common stock over any period of 60 consecutive trading days, beginning no earlier than (i) the 90th day after completion of the follow-on underwritten offering we plan to conduct as soon as possible after the first anniversary of this offering or (ii) the 15-month anniversary of this offering, if we do not conduct the follow-on offering by that date, is at least $ divided by the then-applicable conversion rate, in which case the contingent value rights will be terminated. The CVRs confer no voting rights or other rights of stockholders. Artisan Partners Asset Management will always hold one partnership CVR for each outstanding CVR of Artisan Partners Asset Management. See “Our Structure and Reorganization—Offering Transactions—Contingent Value Rights” for additional information about the CVRs. |
Following the transactions described below, we will conduct all of our business activities through operating subsidiaries of our direct subsidiary Artisan Partners Holdings, an intermediate holding company of which we are the general partner. Based on the ownership that will exist immediately after giving effect to the transactions described below, net profits and net losses of Artisan Partners Holdings will be allocated, and distributions of profits will be made (subject to the H&F preference, as described under “Our Structure and Reorganization—Reorganization Transactions—Preferential Distributions to Holders of Preferred Units and Convertible Preferred Stock”), approximately % to us and % in the aggregate to Artisan Partners Holdings’ limited partners (or % and %, respectively, if the underwriters exercise their option to purchase additional shares in full). See “Our Structure and Reorganization” for additional information, including a diagram that depicts the organizational structure of our subsidiary, Artisan Partners Holdings, before giving effect to this offering and the related reorganization transactions.
Reorganization Transactions
We were incorporated in Wisconsin on March 21, 2011 and converted to a Delaware corporation on October 29, 2012. We will enter into a series of transactions to reorganize our capital structure in connection with this offering. We refer throughout this prospectus to the transactions described below as the reorganization transactions or the reorganization. The reorganization transactions are designed to create a capital structure that preserves our ability to conduct our business through Artisan Partners Holdings (a partnership), while permitting us to raise additional capital and provide access to liquidity through a public company. Multiple classes of securities at the public company level are necessary to achieve these objectives and maintain a governance structure that resembles the current structure of Artisan Partners Holdings.
Revisions to our Organization and Capitalization Structure. The outstanding equity interests in Artisan Partners Holdings currently consist of GP units, Class A common units, Class B common units and redeemable preferred units. AIC, an entity controlled by Andrew A. Ziegler and Carlene M. Ziegler and through which Mr. Ziegler and Mrs. Ziegler maintain their ownership interests in Artisan Partners Holdings, holds the GP units. Thirty-three investors hold the Class A common units. The Class A investors, who were the initial outside investors in Artisan Partners Holdings and their successors, include current and former members of Hellman & Friedman LLC, or H&F, a private equity investment firm, investing in their individual capacities, and a venture capital fund managed by Sutter Hill Ventures, a venture capital firm, and related individuals. Fifty-five Artisan employees hold the Class B common units. The holders of preferred units, the H&F funds, are private equity funds controlled in each case by a sole general partner, each of which is, in turn, controlled by H&F.
Immediately prior to the consummation of this offering, the limited partnership agreement of Artisan Partners Holdings will be amended and restated to reclassify AIC’s GP units as Class D common units of Artisan
-9-
Table of Contents
Partners Holdings. We will become the sole general partner of Artisan Partners Holdings and will control Artisan Partners Holdings’ management, subject to certain voting rights of the limited partners. Upon the consummation of this offering, Artisan Partners Asset Management will contribute all of the net proceeds it receives to Artisan Partners Holdings, and Artisan Partners Holdings will issue to Artisan Partners Asset Management a number of GP units equal to the number of shares of Class A common stock that Artisan Partners Asset Management issues in this offering. In order to make a share of Class A common stock represent the same percentage economic interest, disregarding corporate-level taxes and payments with respect to the tax receivable agreements described under “Our Structure and Reorganization—Tax Receivable Agreements”, in Artisan Partners Holdings as a common unit of Artisan Partners Holdings, Artisan Partners Asset Management will always hold a number of GP units equal to the number of shares of Class A common stock issued and outstanding. Artisan Partners Holdings will apply the net proceeds it receives as described under “Use of Proceeds”. We describe the terms of the amended and restated limited partnership agreement of Artisan Partners Holdings under “Our Structure and Reorganization—Offering Transactions—Amended and Restated Limited Partnership Agreement of Artisan Partners Holdings”. We refer in this prospectus to the holders of the preferred units of Artisan Partners Holdings (other than us) and our convertible preferred stock upon completion of this offering as the H&F holders.
Following the first anniversary of this offering, the common units will be exchangeable for shares of our Class A common stock, and the preferred units will be exchangeable for shares of our Class A common stock or convertible preferred stock, subject to certain restrictions, as described under “Our Structure and Reorganization—Offering Transactions—Exchange Agreement”.
Capital Stock. Immediately prior to the consummation of this offering, we also will amend and restate our certificate of incorporation to authorize three classes of common stock, Class A common stock, Class B common stock and Class C common stock, as well as preferred stock, including a series of convertible preferred stock. Our common stock and convertible preferred stock will have the terms described below and, in more detail, under “Description of Capital Stock”:
| • | Class A Common Stock. We will issue shares of our Class A common stock to the public in this offering. In addition, we intend to grant equity awards of or with respect to shares of our Class A common stock to our non-employee directors in connection with this offering. Each share of Class A common stock will entitle its holder to one vote and economic rights in Artisan (including rights to dividends or distributions upon liquidation), subject to the H&F preference. See “Our Structure and Reorganization—Reorganization Transactions and Post-IPO Structure—Preferential Distributions to Holders of Preferred Units and Convertible Preferred Stock”. Following the first anniversary of this offering (i) subject to certain restrictions, each common unit held by a limited partner of Artisan Partners Holdings will be exchangeable for one share of our Class A common stock and each preferred unit held by a limited partner of Artisan Partners Holdings will be exchangeable for shares of our Class A common stock at the conversion rate and (ii) each share of convertible preferred stock will be convertible into our Class A common stock at the conversion rate. |
| • | Class B Common Stock. Immediately prior to the consummation of this offering, we will issue shares of our Class B common stock to our employee-partners in amounts equal to the number of Class B common units that such employee-partners hold at such time. Each share of our Class B common stock will initially entitle its holder to five votes per share but will have no economic rights in Artisan (including no rights to dividends or distributions upon liquidation). If and when the holders of our Class B common stock collectively hold less than 20% of the number of outstanding shares of our common stock and our convertible preferred stock, taken together, each share of Class B common stock will entitle its holder to only one vote per share. In connection with this offering, we plan to adopt the 2013 Omnibus Incentive Compensation Plan, pursuant to which we expect to grant equity awards of or with respect to shares of our Class A common stock or common units of Artisan Partners Holdings. To the extent that we cause Artisan Partners Holdings to issue additional common units to |
-10-
Table of Contents
| our employees, those employees would be entitled to receive an equal number of shares of our Class B common stock (including if the common units awarded are subject to vesting). As described more fully under “Our Structure and Reorganization—Reorganization Transactions and Post-IPO Structure—Class B Common Stock”, each share of our Class B common stock held by an employee-partner will automatically be exchanged for one share of Class C common stock upon termination of such employee-partner’s employment with us. |
| • | Class C Common Stock. Immediately prior to the consummation of this offering, we will issue shares of our Class C common stock to AIC, our initial outside investors and certain H&F holders that hold preferred units of Artisan Partners Holdings in amounts equal to the number of Class D common units, Class A common units and preferred units, respectively, that such holders hold at such time. Each share of Class C common stock will entitle its holder to one vote per share but will have no economic rights (including no rights to dividends or distributions upon liquidation). |
| • | Convertible Preferred Stock. One of the H&F private investment funds that is an investor in Artisan Partners Holdings holds its preferred units through a corporation, which we refer to as H&F Corp. Immediately prior to the consummation of this offering, H&F Corp will merge with and into us and the H&F private investment fund that was the sole stockholder of H&F Corp will receive, as consideration, shares of our convertible preferred stock, CVRs of Artisan Partners Asset Management and the right to receive an amount of cash equal to H&F Corp’s share of the distribution of Artisan Partners Holdings’ retained profits to its pre-offering partners. We will be the surviving corporation in the merger, which we refer to as the H&F Corp Merger. Each share of our convertible preferred stock will entitle its holder to one vote. In the case of distributions on the preferred units of Artisan Partners Holdings, each share of convertible preferred stock will entitle its holder to preferential distributions as described in “Our Structure and Reorganization—Reorganization Transactions and Post-IPO Structure—Preferential Distributions to Holders of Preferred Units and Convertible Preferred Stock”. We are issuing the convertible preferred stock in order to provide the initial holders of such stock with economic and voting rights similar (although not identical) to the economic and voting rights such holders currently possess with respect to Artisan Partners Holdings. |
Following the first anniversary of this offering, shares of our convertible preferred stock will be convertible at the election of the holder into shares of our Class A common stock at the conversion rate, which will initially be one-for-one subject to adjustment to reflect the payment of preferential distributions made to the holders of our convertible preferred stock. In no event will a share of convertible preferred stock be convertible into more than a single share of our Class A common stock. When the holders of our convertible preferred stock are no longer entitled to preferential distributions, all shares of convertible preferred stock will automatically convert into shares of our Class A common stock at the conversion rate plus cash in lieu of fractional shares (after aggregating all shares of our Class A common stock that would otherwise be received by such holder). See “Our Structure and Reorganization—Reorganization Transactions and Post-IPO Structure—Preferential Distributions to Holders of Preferred Units and Convertible Preferred Stock—Convertible Preferred Stock Conversion Rate”.
Preferential Distributions to Holders of Preferred Units and Convertible Preferred Stock. The holders of preferred units of Artisan Partners Holdings will be entitled to preferential distributions in the case of a partial capital event or upon dissolution of Artisan Partners Holdings in proportion to their respective number of units. A “partial capital event” would include a sale or disposition of greater than 1% of our consolidated assets. In the case of any distributions on the preferred units, each share of convertible preferred stock will entitle its holder to preferential distributions equal to the distribution made on a preferred unit, net of taxes, if any, payable by us on (without duplication) (i) allocations of taxable income related to such distributions and (ii) the distributions themselves, in each case in respect of the preferred units held by us. We refer to these preference rights as the H&F preference. See “Our Structure and Reorganization—Reorganization Transactions and Post-IPO Structure—Preferential Distributions to Holders of Preferred Units and Convertible Preferred Stock”.
-11-
Table of Contents
Stockholders Agreement. Each of our employee-partners and AIC will enter into a stockholders agreement pursuant to which they will grant an irrevocable voting proxy with respect to all shares of our common stock they hold at such time or may acquire from us in the future to a stockholders committee consisting initially of (i) a designee of AIC, who initially will be Andrew A. Ziegler, our Executive Chairman, (ii) Eric R. Colson, our President and Chief Executive Officer, and (iii) James C. Kieffer, a portfolio manager of our U.S. Value strategies. The members of the stockholders committee other than the AIC designee must be Artisan employees. At the close of the reorganization, the only shares of our capital stock subject to the stockholders agreement will be the shares of our common stock held by our employee-partners and AIC. Thereafter, any shares of our common stock that we issue to our employee-partners or other employees will be subject to the stockholders agreement so long as the agreement has not been terminated.
For so long as the parties whose shares are subject to the stockholders agreement hold at least a majority of the combined voting power of our capital stock, the stockholders committee will be able to elect all of the members of our board of directors (subject to the obligation of the stockholders committee under the terms of the stockholders agreement to vote in support of certain nominees consisting of one of our initial outside investors and of individuals designated by each of AIC and the H&F holders) and thereby control our management and affairs. Because each share of our Class B common stock will initially entitle its holder to five votes, the stockholders committee will control our management and affairs even if the shares subject to the stockholders agreement represent less than a majority of the number of outstanding shares of our capital stock as long as the stockholders committee has power to vote shares having a majority of the voting power of our outstanding common and preferred stock.
AIC will have the right to designate one member of the stockholders committee until the earliest to occur of (i) Mr. Ziegler’s death or disability, (ii) the voluntary termination of Mr. Ziegler’s employment with us, including by reason of the scheduled expiration of his employment on the first anniversary of this offering, and (iii) 180 days after the effective date of Mr. Ziegler’s involuntary termination of employment with us. So long as AIC has the right to designate one member of the stockholders committee, the AIC designee, initially Mr. Ziegler, will have the sole right, in consultation with the other members of the stockholders committee, to determine how to vote all shares subject to the stockholders agreement. AIC will have the right to withdraw its shares of common stock from the stockholders agreement when Mr. Ziegler is no longer a member of the stockholders committee. Although AIC may replace Mr. Ziegler as its stockholders committee designee, Mr. Ziegler indirectly holds 50% of the voting stock of AIC and therefore could not be replaced without his consent. When AIC no longer has the right to designate a member of the stockholders committee, assuming Mr. Colson remains our Chief Executive Officer and a member of the committee at that time, he and the other member of the committee will jointly select a third member of the stockholders committee, who must be an employee-partner. We describe the terms of the stockholders agreement in more detail under “Our Structure and Reorganization—Stockholders Agreement”.
Exchange Agreement. Immediately prior to the consummation of this offering, we will enter into an exchange agreement with the holders of limited partnership units of Artisan Partners Holdings. Following the first anniversary of this offering, subject to certain restrictions set forth in the exchange agreement (including those intended to ensure that Artisan Partners Holdings is not treated as a “publicly traded partnership” for U.S. federal income tax purposes), holders of Artisan Partners Holdings units (other than us) and certain permitted transferees will have the right to exchange common units (together with an equal number of shares of Class B or Class C common stock, as applicable) for shares of our Class A common stock on a one-for-one basis and to exchange preferred units (together with an equal number of shares of Class C common stock) either for shares of our convertible preferred stock on a one-for-one basis or for shares of our Class A common stock at the conversion rate as described in “Our Structure and Reorganization—Reorganization Transactions and Post-IPO Structure—Preferential Distributions to Holders of Preferred Units and Convertible Preferred Stock—Convertible Preferred Stock Conversion Rate”. Following the automatic conversion of our convertible preferred stock into Class A common stock, preferred units will be exchangeable only for Class A common stock at the conversion rate. Employee-partners who exchange common units that are unvested will receive restricted shares
-12-
Table of Contents
of our Class A common stock that are subject to the same vesting requirements that applied to the common units exchanged. As the holders of common units or preferred units exchange their units for Class A common stock, we will receive a number of GP units of Artisan Partners Holdings equal to the number of shares of our Class A common stock that they receive, and a number of common units or preferred units, and shares of our Class B or Class C common stock, as applicable, equal to the number of units so exchanged will be cancelled. We will retain any preferred units exchanged for shares of convertible preferred stock until the subsequent conversion of such shares into shares of our Class A common stock, although a number of shares of our Class C common stock equal to the number of units so exchanged will be cancelled. Upon conversion of shares of convertible preferred stock, we will exchange a number of preferred units we hold for GP units equal to the number of shares of our Class A common stock issued upon conversion. See “Our Structure and Reorganization—Offering Transactions—Exchange Agreement” for more detailed information concerning the exchange rights, including a diagram that illustrates the exchange of units of Artisan Partners Holdings for shares of our capital stock.
Transfer Restrictions Applicable to our Employee-Partners. Subject to certain restrictions, substantially all of the Class B common units held by our employee-partners, including all of our executive officers, will be exchangeable for shares of our Class A common stock (or restricted shares of our Class A common stock, in the case of exchange of unvested common units) following the first anniversary of this offering. Shares of our Class A common stock received by our employee-partners upon exchange of their Class B common units, will be subject to limitations on resale that are described in “Our Structure and Reorganization—Offering Transactions—Resale and Registration Rights Agreement—Restrictions on Sale”.
Resale and Registration Rights Agreement. As part of the reorganization transactions, we will enter into a resale and registration rights agreement with the holders of limited partnership units of Artisan Partners Holdings and shares of our convertible preferred stock, pursuant to which the shares of our Class A common stock issued upon exchange of their limited partnership units or conversion of their shares of convertible preferred stock will be eligible for resale. See “Our Structure and Reorganization—Offering Transactions—Resale and Registration Rights Agreement—Restrictions on Sale” for a description of the timing and manner limitations on resales of these shares.
Contingent Value Rights. Immediately prior to the consummation of this offering, Artisan Partners Holdings and Artisan Partners Asset Management will issue contingent value rights, or CVRs, to the H&F holders. The CVRs may require us to make a cash payment to the holders thereof on July 11, 2016, or, if earlier, five business days after the effective date of a change of control of Artisan, unless the average of the daily VWAP of our Class A common stock over any period of 60 consecutive trading days, beginning no earlier than (i) the 90th day after completion of the follow-on underwritten offering we plan to conduct as soon as possible after the first anniversary of this offering or (ii) the 15-month anniversary of this offering, if we do not conduct the follow-on offering by that date, is at least $ divided by the then-applicable conversion rate, in which case the CVRs will be terminated. The amount of any payment we are required to make will depend on the average of the daily VWAP of our Class A common stock over the 60 consecutive trading days prior to July 3, 2016 or the effective date of an earlier change of control and any proceeds realized by the H&F holders with respect to their equity interests in us, subject to a maximum aggregate payment of $ million for all CVRs. We are issuing the CVRs in order to provide the current holders of preferred units with economic rights following the reorganization transactions that will be similar (although not identical) to the economic rights they currently possess with respect to Artisan Partners Holdings. See “Our Structure and Reorganization—Offering Transactions—Contingent Value Rights”.
Tax Receivable Agreements. The H&F Corp Merger will result in favorable tax attributes for us. In addition, the redemption of limited partnership units of Artisan Partners Holdings in connection with this offering and future exchanges of limited partnership units for shares of our Class A common stock or convertible preferred stock are expected to produce additional favorable tax attributes for us. These tax attributes would not
-13-
Table of Contents
be available to us in the absence of those transactions. Upon the closing of this offering, we will enter into two tax receivable agreements. Under the first of those agreements we generally will be required to pay to the holders of convertible preferred stock issued as consideration for the H&F Corp Merger (or our Class A common stock issued upon conversion of that convertible preferred stock) 85% of the applicable cash savings, if any, in U.S. federal and state income tax that we actually realize (or are deemed to realize in certain circumstances) as a result of (i) the tax attributes of the units we acquire in the merger, (ii) net operating losses available as a result of the H&F Corp Merger and (iii) tax benefits related to imputed interest. Under the second tax receivable agreement we generally will be required to pay to the holders of limited partnership units of Artisan Partners Holdings (or our Class A common stock or convertible preferred stock issued upon exchange of limited partnership units) 85% of the amount of cash savings, if any, in U.S. federal and state income tax that we actually realize (or are deemed to realize in certain circumstances) as a result of (i) certain tax attributes of their units redeemed or exchanged and that are created as a result of the redemptions or exchanges of their units for shares of our Class A common stock or convertible preferred stock and payments under the tax receivable agreements and (ii) tax benefits related to imputed interest. Under both agreements, we generally will retain the benefit of the remaining 15% of the applicable tax savings. See “Our Structure and Reorganization—Tax Receivable Agreements”.
Our Corporate Information
Our principal executive offices are located at 875 E. Wisconsin Avenue, Suite 800, Milwaukee, Wisconsin 53202. Our telephone number at this address is (414) 390-6100 and our website address is www.artisanpartners.com. Information contained on our website is not part of this prospectus. The company was incorporated in Wisconsin on March 21, 2011 and converted to a Delaware corporation on October 29, 2012.
-14-
Table of Contents
| Class A common stock offered by us |
shares of Class A common stock. |
Class A common stock to be outstanding
| immediately after this offering |
shares of Class A common stock. If all limited partnership units of Artisan Partners Holdings (other than those held by us) were exchanged for shares of our Class A common stock or convertible preferred stock, as applicable, and all shares of our convertible preferred stock were converted for shares of our Class A common stock immediately after the reorganization, shares of Class A common stock would be outstanding immediately after this offering. |
Class B common stock to be outstanding
| immediately after this offering |
shares of Class B common stock. Shares of our Class B common stock have voting but no economic rights (including no rights to dividends or distributions upon liquidation) and will be issued to our employee-partners in an amount equal to the number of Class B common units of Artisan Partners Holdings that our employee-partners hold following the reorganization. When a common unit is exchanged by an employee-partner for a share of Class A common stock, a share of Class B common stock held by such exchanging party will be cancelled. See “Our Structure and Reorganization—Offering Transactions—Exchange Agreement”. |
Class C common stock to be outstanding
immediately after this offering and
the application of the net proceeds as
described under “—Use of
| proceeds”(1) |
shares of Class C common stock. Shares of our Class C common stock have voting but no economic rights (including no rights to dividends or distributions upon liquidation) and will be issued to AIC, our initial outside investors and the H&F holders in an amount equal to the number of Class D common units, Class A common units and preferred units, respectively, of Artisan Partners Holdings that each of them holds following the reorganization. When a common unit or a preferred unit, as the case may be, is exchanged by its holder for a share of Class A common stock or convertible preferred stock, as applicable, a share of Class C common stock will be cancelled. See “Our Structure and Reorganization—Offering Transactions—Exchange Agreement”. |
Convertible preferred stock to be
outstanding immediately after this
| offering |
shares of our convertible preferred stock, each share of which, at the election of the holder and following the first anniversary of |
| (1) | Reflects the transfer of preferred units to us in connection with the H&F Corp Merger immediately prior to the consummation of this offering and our redemption of Class A common units (and corresponding cancellation of shares of Class C common stock) using a portion of the net proceeds of this offering. |
-15-
Table of Contents
| this offering, is convertible for a number of shares of our Class A common stock equal to the conversion rate as described in “Our Structure and Reorganization—Reorganization Transactions and Post-IPO Structure—Preferential Distributions to Holders of Preferred Units and Convertible Preferred Stock—Convertible Preferred Stock Conversion Rate”. Shares of convertible preferred stock will be issued to the sole stockholder of H&F Corp as partial consideration in the H&F Corp Merger and, from time to time in the future, upon exchange of preferred units. |
| Each share of our convertible preferred stock will entitle its holder to one vote. In the case of distributions on the preferred units of Artisan Partners Holdings, each share of convertible preferred stock will entitle its holder to preferential distributions as described in “Our Structure and Reorganization—Reorganization Transactions and Post-IPO Structure—Preferential Distributions to Holders of Preferred Units and Convertible Preferred Stock”. |
| Voting rights and stockholders agreement |
Shares of Class A common stock, Class C common stock and convertible preferred stock will entitle the holder to one vote per share. Shares of Class B common stock initially entitle the holder to five votes per share. Each of our employee-partners and AIC will enter into a stockholders agreement pursuant to which they will grant an irrevocable voting proxy with respect to all of the shares of our common stock they hold at such time or acquire from us in the future to a stockholders committee consisting initially of a designee of AIC, who initially will be Andrew A. Ziegler (our Executive Chairman), Eric R. Colson (our President and Chief Executive Officer) and James C. Kieffer (a portfolio manager of our U.S. Value strategies). The AIC designee will have the sole right, in consultation with the other members of the stockholders committee as required pursuant to the stockholders agreement, to determine how to vote all shares subject to the stockholders agreement until the earliest to occur of: (i) Mr. Ziegler’s death or disability, (ii) the voluntary termination of Mr. Ziegler’s employment with us, including by reason of the scheduled expiration of his employment on the first anniversary of this offering, and (iii) 180 days after the effective date of Mr. Ziegler’s involuntary termination of employment with us. If and when the holders of our Class B common stock collectively hold less than 20% of the number of outstanding shares of our common stock and our convertible preferred stock, taken together, each share of Class B common stock will entitle its holder to one vote per share. See “Our Structure and Reorganization—Stockholders Agreement” for additional information about the stockholders agreement. |
| Use of proceeds |
We estimate that the net proceeds from the sale of shares of our Class A common stock by us in this offering will be approximately $ million, or approximately $ million if the underwriters exercise in full their option to purchase additional shares |
-16-
Table of Contents
| of Class A common stock, based on an assumed initial public offering price of $ per share (the midpoint of the price range set forth on the cover of this prospectus), in each case after deducting assumed underwriting discounts and estimated offering expenses payable by us. We intend to use $ million of the net proceeds to repay all or a portion of the then-outstanding principal amount of any loans under our revolving credit agreement, $ million of the net proceeds to purchase an aggregate of Class A common units from certain of our initial outside investors, $ million to pay a portion of a $56 million cash incentive compensation payment due to certain of our portfolio managers, $ million to make a distribution of retained profits of Artisan Partners Holdings to its pre-offering partners and the balance for general corporate purposes, including working capital. Investors who purchase Class A common stock in this offering will not be entitled to a portion of the distribution of the retained profits. |
| Dividend policy |
Upon the completion of this offering, we will have no material assets other than our ownership of partnership units of, and CVRs issued by, Artisan Partners Holdings. Accordingly, our ability to pay dividends will depend on distributions from Artisan Partners Holdings. We intend to cause Artisan Partners Holdings to make distributions to us with available cash generated from its subsidiaries’ operations in an amount sufficient to cover dividends we may declare. If Artisan Partners Holdings makes such distributions, the holders of its limited partnership units will be entitled to receive equivalent distributions on a pro rata basis. |
| The terms of our convertible preferred stock prevent us from declaring or paying any dividend on our Class A common stock until we have paid to the convertible preferred stockholders an amount per share equal to the proceeds per preferred unit of any distributions we receive on the preferred units held by us plus the cumulative amount of any prior distributions made on the preferred units held by us which have not been paid to the convertible preferred stockholders, net of taxes, if any, payable by us on (without duplication) (i) allocations of taxable income related to such distributions and (ii) the distributions themselves, in each case in respect of the preferred units held by us. We intend to pay dividends on our convertible preferred stock promptly upon receipt of any distributions made on the preferred units of Artisan Partners Holdings that we hold in amounts sufficient to permit the declaration and payment of dividends on our Class A common stock. |
| The declaration and payment of all future dividends, if any, will be at the sole discretion of our board of directors and may be discontinued at any time. In determining the amount of any future dividends, our board of directors will take into account any legal or contractual limitations, our actual and anticipated future earnings, cash flow, debt service and capital requirements and the amount of distributions to us from Artisan Partners Holdings. |
-17-
Table of Contents
| Following this offering, we intend to pay quarterly cash dividends. We expect that our first dividend will be paid in the quarter of (in respect of the quarter of ) and will be approximately $ per share of our Class A common stock. See “Dividend Policy and Dividends”. |
| New York Stock Exchange symbol |
“APAM” |
| Risk Factors |
The “Risk Factors” section included in this prospectus contains a discussion of factors that you should carefully consider before deciding to invest in shares of our Class A common stock. |
| Conflicts of Interest |
An affiliate of Citigroup Global Markets Inc., an underwriter in this offering, is the administrative agent and a lender under our revolving credit agreement and may receive more than 5% of the net proceeds of this offering in connection with the repayment of outstanding loans under our revolving credit agreement. See “Use of Proceeds”. Accordingly, this offering is being made in compliance with the requirements of Rule 5121 of the Financial Industry Regulatory Authority, Inc. In accordance with this rule, has assumed the responsibilities of acting as a qualified independent underwriter. In its role as qualified independent underwriter, has participated in due diligence and the preparation of this prospectus and the registration statement of which this prospectus is a part. will not receive any additional fees for serving as a qualified independent underwriter in connection with this offering. Citigroup Global Markets Inc. will not confirm sales of the shares to any account over which it exercises discretionary authority without the prior written approval of the customer. |
The number of shares of our Class A common stock to be outstanding after the completion of this offering excludes:
| • | shares of Class A common stock reserved for issuance upon exchange of common or preferred units of Artisan Partners Holdings and conversion of shares of our convertible preferred stock (assuming a one-for-one conversion rate); |
| • | shares of Class A common stock reserved for issuance under the 2013 Omnibus Incentive Compensation Plan and 2013 Non-Employee Director Plan that we plan to adopt in connection with this offering (including shares of Class A common stock underlying the equity awards of or with respect to shares of our Class A common stock that we expect to grant to our non-employee directors in connection with this offering); and |
| • | shares of Class A common stock issuable upon exchange of an equal number of common units reserved for issuance under the 2013 Omnibus Incentive Compensation Plan for common unit-based awards. |
Unless otherwise indicated, all information in this prospectus assumes:
| • | no exercise of the underwriters’ option to purchase additional shares; and |
| • | that the shares of Class A common stock to be sold in this offering are sold at $ per share, which is the midpoint of the range set forth on the cover of this prospectus. |
-18-
Table of Contents
SUMMARY SELECTED HISTORICAL AND PRO FORMA CONSOLIDATED FINANCIAL DATA
The following tables set forth summary selected historical consolidated financial data of Artisan Partners Holdings as of the dates and for the periods indicated. The summary selected consolidated statements of operations data for the years ended December 31, 2011, 2010 and 2009, and the consolidated statements of financial condition data as of December 31, 2011 and 2010 have been derived from Artisan Partners Holdings’ audited consolidated financial statements included elsewhere in this prospectus. The selected consolidated statements of operations data for the six months ended June 30, 2012 and 2011 and the consolidated statement of financial condition as of June 30, 2012 have been derived from Artisan Partners Holdings’ unaudited consolidated financial statements included elsewhere in this prospectus. These unaudited consolidated financial statements have been prepared on substantially the same basis as our audited consolidated financial statements and include all adjustments that we consider necessary for a fair statement of our consolidated results of operations and financial condition for the periods and as of the dates presented therein. Our results for the six months ended June 30, 2012 are not necessarily indicative of our results for a full fiscal year.
The selected unaudited pro forma consolidated financial data give effect to the transactions described under “Unaudited Pro Forma Consolidated Financial Information”, including the reorganization transactions and this offering.
You should read the following selected historical consolidated financial data of Artisan Partners Holdings and the unaudited pro forma financial information of Artisan Partners Asset Management together with “Our Structure and Reorganization”, “Unaudited Pro Forma Consolidated Financial Information”, “Management’s Discussion and Analysis of Financial Condition and Results of Operations” and the historical consolidated financial statements and the related notes included elsewhere in this prospectus.
| Historical Artisan Partners Holdings | Unaudited Pro Forma Artisan Partners Asset Management | |||||||||||||||||||||||
| Six Months Ended June 30, (unaudited) |
Year Ended December 31, | Six Months Ended June 30, |
Year Ended December 31, | |||||||||||||||||||||
| 2012 | 2011 | 2011 | 2010 | 2009 | 2012 | 2011 | ||||||||||||||||||
| (dollars in millions except per share amounts) | ||||||||||||||||||||||||
| Statements of Operations Data: |
||||||||||||||||||||||||
| Revenues |
||||||||||||||||||||||||
| Management fees Mutual funds |
$ | 160.3 | $ | 157.3 | $ | 305.2 | $ | 261.6 | $ | 197.2 | ||||||||||||||
| Separate accounts |
79.9 | 75.3 | 145.8 | 117.8 | 95.5 | |||||||||||||||||||
| Performance fees |
0.3 | 0.6 | 4.1 | 2.9 | 3.5 | |||||||||||||||||||
|
|
|
|
|
|
|
|
|
|
|
|
| |||||||||||||
| Total revenues |
240.5 | 233.2 | 455.1 | 382.3 | 296.2 | |||||||||||||||||||
| Operating Expenses |
||||||||||||||||||||||||
| Compensation and fringe benefits |
||||||||||||||||||||||||
| Salaries, incentive compensation and benefits |
109.3 | 103.9 | 198.6 | 166.6 | 132.9 | |||||||||||||||||||
| Distributions on Class B liability awards |
21.9 | 48.0 | 55.7 | 17.6 | 2.5 | |||||||||||||||||||
| Change in value of Class B liability awards |
29.9 | (6.7 | ) | (21.1 | ) | 79.1 | 41.8 | |||||||||||||||||
|
|
|
|
|
|
|
|
|
|
|
|
| |||||||||||||
| Total compensation and benefits |
161.1 | 145.2 | 233.2 | 263.3 | 177.2 | |||||||||||||||||||
| Distribution and marketing |
14.2 | 13.4 | 26.2 | 23.0 | 17.8 | |||||||||||||||||||
| Occupancy |
4.5 | 4.4 | 9.0 | 8.1 | 8.0 | |||||||||||||||||||
| Communication and technology |
6.4 | 4.9 | 10.6 | 9.9 | 10.1 | |||||||||||||||||||
| General and administrative |
8.4 | 8.1 | 21.8 | 12.8 | 10.0 | |||||||||||||||||||
|
|
|
|
|
|
|
|
|
|
|
|
| |||||||||||||
| Total operating expenses |
194.6 | 176.0 | 300.8 | 317.1 | 223.1 | |||||||||||||||||||
|
|
|
|
|
|
|
|
|
|
|
|
| |||||||||||||
-19-
Table of Contents
| Historical Artisan Partners Holdings | Unaudited Pro Forma Artisan Partners Asset Management | |||||||||||||||||||||||
| Six
Months Ended June 30, (unaudited) |
Year Ended December 31, |
Six Months Ended June 30, |
Year Ended December 31, | |||||||||||||||||||||
| 2012 | 2011 | 2011 | 2010 | 2009 | 2012 | 2011 | ||||||||||||||||||
| (dollars in millions except per share amounts) | ||||||||||||||||||||||||
| Operating income (loss) |
45.9 | 57.2 | 154.3 | 65.2 | 73.1 | |||||||||||||||||||
| Non-operating income (loss) |
||||||||||||||||||||||||
| Interest expense |
(5.2 | ) | (12.4 | ) | (18.4 | ) | (23.0 | ) | (24.9 | ) | ||||||||||||||
| Net gain (loss) on consolidated investment products |
1.5 | — | (3.1 | ) | — | — | ||||||||||||||||||
| Other income (loss) |
(0.1 | ) | — | (1.6 | ) | 1.6 | — | |||||||||||||||||
|
|
|
|
|
|
|
|
|
|
|
|
| |||||||||||||
| Total non-operating income (loss) |
(3.8 | ) | (12.4 | ) | (23.1 | ) | (21.4 | ) | (24.9 | ) | ||||||||||||||
|
|
|
|
|
|
|
|
|
|
|
|
| |||||||||||||
| Income (loss) before income taxes |
42.1 | 44.8 | 131.2 | 43.8 | 48.2 | |||||||||||||||||||
| Provision for income taxes |
0.6 | 0.6 | 1.2 | 1.3 | — | |||||||||||||||||||
|
|
|
|
|
|
|
|
|
|
|
|
| |||||||||||||
| Net income (loss) before noncontrolling interests |
41.5 | 44.2 | 130.0 | 42.5 | 48.2 | |||||||||||||||||||
| Less: Net gain (loss) attributable to noncontrolling interests |
1.5 | — | (3.1 | ) | — | — | ||||||||||||||||||
|
|
|
|
|
|
|
|
|
|
|
|
| |||||||||||||
| Net income (loss) attributable to Artisan Partners Holdings LP |
$ | 40.0 | $ | 44.2 | $ | 133.1 | $ | 42.5 | $ | 48.2 | ||||||||||||||
|
|
|
|
|
|
|
|
|
|
|
|
| |||||||||||||
| Per Share Data: |
||||||||||||||||||||||||
| Basic and diluted net income per share |
||||||||||||||||||||||||
| Weighted average shares used in basic and diluted net income per share |
||||||||||||||||||||||||
| Historical Artisan Partners Holdings | Unaudited Pro Forma Artisan Partners Asset Management |
|||||||||||||||
| As
of June 30, 2012 (unaudited) |
As of December 31, 2011 |
As of December 31, 2010 |
As of June 30, 2012 |
|||||||||||||
| (dollars in millions) | ||||||||||||||||
| Statement of Financial Condition Data: |
||||||||||||||||
| Cash and cash equivalents |
$ | 172.1 | $ | 127.0 | $ | 159.0 | $ | |||||||||
| Total assets |
282.8 | 224.9 | 209.9 | |||||||||||||
| Note payable(1) |
289.4 | 324.8 | 380.0 | |||||||||||||
| Total liabilities |
551.5 | 508.8 | 589.3 | |||||||||||||
| Temporary equity—redeemable Class C interests(2) |
357.2 | 357.2 | 357.2 | |||||||||||||
| Total permanent equity (deficit) |
$ | (625.9 | ) | $ | (641.1 | ) | $ | (736.6 | ) | $ | ||||||
| (1) | In August 2012, we issued $200 million in unsecured notes and entered into a $100 million five-year revolving credit agreement. We used the proceeds of the notes and $90 million drawn from the revolving credit facility to prepay all of the then-outstanding principal amount of our $400 million term loan. We currently intend to repay all or a portion of the then-outstanding principal amount of any loans under our revolving credit agreement with a portion of the net proceeds of this offering. See “Management’s Discussion and Analysis of Financial Condition and Results of Operations—Liquidity and Capital Resources” and “Use of Proceeds”. |
| (2) | Under the terms of Artisan Partners Holdings’ limited partnership agreement in effect prior to the reorganization transactions, the holders of the preferred units have a right to put such units to the partnership on July 3, 2016 under certain circumstances. |
-20-
Table of Contents
One of the financial measures our management uses to evaluate the profitability and efficiency of our business model is adjusted operating margin, which is not presented in accordance with U.S. generally accepted accounting principles, or GAAP. Until we complete the reorganization transactions and this offering, the Class B common units held by our employee-partners are classified under GAAP as liability awards, and we are required to recognize as compensation expense distributions of profits to our employee-partners, amounts paid in connection with redemptions of Class B common units from former employee-partners, and marked-to-market changes in the value of Class B common units. After we complete the reorganization transactions and this offering, Class B common units of Artisan Partners Holdings will be classified as equity awards and those amounts will no longer be recognized as compensation expense. As a result of that change in accounting classification, the expense related to equity-based compensation recognized in our pre-offering periods will not be comparable to the expense related to equity-based compensation we expect to recognize after this offering.
We compute our adjusted operating margin by adding to operating income (thereby effectively excluding) the expenses we recognize for equity-based compensation, which includes distributions to the Class B partners of Artisan Partners Holdings, redemptions of Class B common units and changes in the value of Class B liability awards, and then dividing that sum by total revenues for the applicable period. Even after completion of the reorganization transactions and this offering, we will continue to calculate adjusted operating margin by excluding all expense associated with Class B common units that were granted prior to this offering. Adjusted operating margin may be different from non-GAAP measures used by other companies.
The following table shows the adjusted operating margin for Artisan Partners Holdings for the six months ended June 30, 2012 and 2011 and the years ended December 31, 2011, 2010 and 2009 as well as a reconciliation of the adjusted operating margin with GAAP operating margin for the periods presented:
| For the Six Months Ended June 30, |
For the Year Ended December 31, |
|||||||||||||||||||
| (unaudited) | ||||||||||||||||||||
| 2012 | 2011 | 2011 | 2010 | 2009 | ||||||||||||||||
| (dollars in millions) | ||||||||||||||||||||
| GAAP operating income |
$ | 45.9 | $ | 57.2 | $ | 154.3 | $ | 65.2 | $ | 73.1 | ||||||||||
| Distributions on Class B liability awards |
21.9 | 48.0 | 55.7 | 17.6 | 2.5 | |||||||||||||||
| Change in value of Class B liability awards |
29.9 | (6.7 | ) | (21.1 | ) | 79.1 | 41.8 | |||||||||||||
|
|
|
|
|
|
|
|
|
|
|
|||||||||||
| Adjusted operating income |
$ | 97.7 | $ | 98.5 | $ | 188.9 | $ | 161.9 | $ | 117.4 | ||||||||||
| Total revenues |
$ | 240.5 | $ | 233.2 | $ | 455.1 | $ | 382.3 | $ | 296.2 | ||||||||||
| GAAP operating margin |
19.1 | % | 24.5 | % | 33.9 | % | 17.1 | % | 24.7 | % | ||||||||||
| Adjusted operating margin |
40.6 | % | 42.2 | % | 41.5 | % | 42.3 | % | 39.6 | % | ||||||||||
The following table sets forth certain selected unaudited operating data of Artisan Partners Holdings as of the dates and for the periods indicated:
| As of and for the Six Months Ended June 30, |
As of and for the Year Ended December 31, |
|||||||||||||||||||||||||||
| 2012 | 2011 | 2011 | 2010 | 2009 | 2008 | 2007 | ||||||||||||||||||||||
| (dollars in millions) | ||||||||||||||||||||||||||||
| Selected Unaudited Operating Data: |
||||||||||||||||||||||||||||
| Assets under management(1) |
$ | 64,072 | $ | 63,645 | $ | 57,104 | $ | 57,459 | $ | 46,788 | $ | 30,577 | $ | 55,468 | ||||||||||||||
| Net client cash flows(2) |
2,758 | 2,012 | 1,960 | 3,410 | 2,556 | (1,783 | ) | (2,875 | ) | |||||||||||||||||||
| Market appreciation (depreciation)(3) |
$ | 4,210 | $ | 4,174 | $ | (2,315 | ) | $ | 7,261 | $ | 13,655 | $ | (23,108 | ) | $ | 7,440 | ||||||||||||
| (1) | Reflects the dollar value of assets we managed for our clients in our strategies as of the last day of the period. |
| (2) | Reflects the dollar value of assets our clients placed with us for management, and withdrew from our management, during the period, excluding appreciation (depreciation) due to market performance and fluctuations in exchange rates. |
| (3) | Represents the appreciation (depreciation) of the value of our assets under management during the period due to market performance and fluctuations in exchange rates, as well as income, such as dividends, earned on assets under management. |
-21-
Table of Contents
You should carefully consider each of the risks below, together with all of the other information contained in this prospectus, before deciding to invest in shares of our Class A common stock. If any of the following risks develops into an actual event, our business, financial condition or results of operations could be negatively affected, the market price of your shares could decline and you could lose all or part of your investment.
Risks Related to our Business
The loss of key investment professionals or members of our senior management team could have a material adverse effect on our business.
We depend on the skills and expertise of our investment professionals and our success depends on our ability to retain the key members of our investment teams, who possess substantial experience in investing and have been primarily responsible for the historically strong investment performance we have achieved. In particular, we depend on the portfolio managers. Each of our four largest investment strategies represented more than 14%, and in the aggregate those four strategies represented 74%, of our assets under management as of June 30, 2012. Each of those four strategies has been managed by its current portfolio manager or managers since the strategy’s inception at Artisan (with the exception of the U.S. Mid-Cap Value strategy, which has been managed by James C. Kieffer and Scott C. Satterwhite since 2001, along with George O. Sertl, Jr. since 2006). Mark L. Yockey is the sole portfolio manager for our largest strategy, the Non-U.S. Growth strategy, which represented $16.4 billion, or 26%, of our assets under management as of June 30, 2012. In February 2012, Charles-Henri Hamker and Andrew Euretig were appointed associate portfolio managers of the Non-U.S. Growth strategy. Andrew C. Stephens, James D. Hamel and Matthew H. Kamm are portfolio co-managers of our second largest strategy, the U.S. Mid-Cap Growth strategy, which represented $11.3 billion, or 18%, of our assets under management at June 30, 2012. Jason L. White has been associate portfolio manager of our U.S. Mid-Cap Growth strategy since January 2011. The U.S. Mid-Cap Value strategy, of which Messrs. Kieffer, Satterwhite and Sertl are co-managers, is our third largest strategy and represented $10.7 billion, or 17%, of our assets under management at June 30, 2012. In February 2012, Daniel Kane was appointed associate portfolio manager of the U.S. Mid-Cap Value strategy. Our Non-U.S. Value strategy, which is our fourth largest strategy and represented $9.3 billion, or 15%, of our assets under management at June 30, 2012, is managed by co-managers N. David Samra (lead manager) and Daniel J. O’Keefe.
Because of the long tenure and stability of our portfolio managers, our clients generally attribute the investment performance we have achieved to these individuals. While we have experienced very few departures among our portfolio managers, there can be no assurance that this stability will continue in the future. The departure of a strategy’s portfolio manager, especially for strategies with only one portfolio manager, could cause clients to withdraw funds from the strategy which would reduce our assets under management, investment management fees and, if we were not able to reduce our expenses sufficiently, our net income, and these reductions could be material. The departure of a strategy’s portfolio manager also could cause consultants and intermediaries to stop recommending a strategy, and clients to refrain from allocating additional funds to the strategy or delay such additional funds until a sufficient track record under a new portfolio manager or managers has been established. This would have a negative effect on the future growth of our assets under management.
We also depend on the contributions of our senior management team led by Eric R. Colson. In addition, our senior marketing and client service personnel have direct contact with our institutional clients and consultants and other key individuals within each of our distribution channels. The loss of any of these key professionals could limit our ability to successfully execute our business strategy and may prevent us from sustaining the historically strong investment performance we have achieved or adversely affect our ability to retain existing and attract new client assets and related revenues. The employment of Andrew A. Ziegler, our Executive Chairman, is expected to terminate approximately one year from the consummation of this offering in accordance with the terms of his employment agreement. However, Mr. Ziegler is expected to continue to provide strategic leadership and advice as a director of the company.
-22-
Table of Contents
Any of our investment or management professionals may resign at any time, join our competitors or form a competing company. Although each of our portfolio managers (not including associate portfolio managers) is, and Mr. Ziegler will be, subject to a non-compete obligation that extends for two years after his or her departure from Artisan, these non-competition provisions may not be enforceable or may not be enforceable to their full extent. We do not carry “key man” insurance that would provide us with proceeds in the event of the death or disability of any of the key members of our investment or management teams.
Competition for qualified investment, management and marketing and client service professionals is intense and we may fail to successfully attract and retain qualified personnel in the future. Our ability to attract and retain these personnel will depend heavily on the amount and structure of compensation and opportunities for equity ownership we offer. Historically we have offered key employees equity ownership through interests in Artisan Partners Holdings that entitle the holder to participate in profits and share in appreciation or depreciation in the value of the firm from and after the date of grant. Those key employees who are currently limited partners of Artisan Partners Holdings will continue to hold their common units immediately following this offering. In connection with our transition to a public company, we intend to implement a new compensation structure that uses a combination of cash and equity-based incentives as appropriate. Although we intend for overall compensation levels to remain commensurate with amounts paid to our key employees in the past, we may not be successful in designing and implementing an attractive compensation model. Any cost-reduction initiative or adjustments or reductions to compensation could negatively impact our ability to retain key personnel. In addition, changes to our management structure, corporate culture and corporate governance arrangements, including the changes associated with, and resulting from, our reorganization and this offering, could negatively impact our ability to retain key personnel.
If our investment strategies perform poorly, clients could withdraw their funds and we could suffer a decline in our assets under management and/or become subject to litigation, which would reduce our earnings.
The performance of our investment strategies is critical in retaining existing client assets as well as attracting new client assets. If our investment strategies perform poorly for any reason, our earnings could decline because:
| • | our existing clients may withdraw funds from our investment strategies or terminate their relationships with us, which would cause the revenues that we generate from investment management fees to decline; |
| • | the Morningstar and Lipper ratings and rankings of mutual funds we manage may decline, which may adversely affect the ability of those funds to attract new or retain existing assets; or |
| • | third-party financial intermediaries, advisors or consultants may rate our investment products poorly, which may lead our existing clients to withdraw funds from our investment strategies or reduce asset inflows from these third parties or their clients. |
Our investment strategies can perform poorly for a number of reasons, including general market conditions, investor sentiment about market and economic conditions, investment styles, investment decisions that we make and the performance of the companies in which our investment strategies invest. In addition, while we seek to deliver long-term value to our clients, volatility may lead to under-performance in the near term, which could adversely affect our results of operations. The global economic environment deteriorated sharply in 2008, particularly in the third and fourth quarters, and in the first quarter of 2009, with virtually every class of financial asset and geographic market experiencing significant price declines and volatility as a result of the global financial crisis. In the period from June 30, 2008 through March 31, 2009, our assets under management decreased by approximately 43%, primarily as a result of general market conditions. Although market conditions have improved since 2008-2009, actively-managed U.S. mutual funds investing in equity securities have generally continued to see net reductions in assets.
In contrast, when our strategies experience strong results relative to the market, clients’ allocations to our strategies may increase relative to their other investments and we could suffer withdrawals as our clients rebalance their investments to fit their asset allocation preferences.
-23-
Table of Contents
While clients do not have legal recourse against us solely on the basis of poor investment results, if our investment strategies perform poorly, we are more likely to become subject to litigation brought by dissatisfied clients. In addition, to the extent clients are successful in claiming that their losses resulted from fraud, negligence, willful misconduct, breach of contract or other similar misconduct, these clients may have remedies against us, the mutual funds and collective funds we advise and/or our investment professionals under the federal securities laws and/or state law.
The historical returns of our existing investment strategies may not be indicative of their future results or of the investment strategies we may develop in the future.
We have presented the historical returns of our existing investment strategies under “Business—Investment Strategies and Performance”. The historical returns of our strategies and the ratings and rankings we or the mutual funds that we advise have received in the past should not be considered indicative of the future results of these strategies or of any other strategies that we may develop in the future. The investment performance we achieve for our clients varies over time and the variance can be wide. The ratings and rankings we or the mutual funds we advise have received are typically revised monthly. The historical performance and ratings and rankings presented herein are as of June 30, 2012 and for periods then ended. The performance we have achieved and the ratings and rankings received at subsequent dates and for subsequent periods may be higher or lower and the difference could be material. Our strategies’ returns have benefited during some periods from investment opportunities and positive economic and market conditions. In other periods, general economic and market conditions have negatively affected investment opportunities and our strategies’ returns. These negative conditions may occur again, and in the future we may not be able to identify and invest in profitable investment opportunities within our current or future strategies.
Difficult market conditions can adversely affect our business in many ways, including by reducing the value of our assets under management and causing clients to withdraw funds, each of which could materially reduce our revenues and adversely affect our financial condition.
The fees we earn under our investment management agreements are typically based on the market value of our assets under management, and to a much lesser extent based directly on investment performance. Investors in the mutual funds we advise can redeem their investments in those funds at any time without prior notice and our clients may reduce the aggregate amount of assets under management with us with minimal or no notice for any reason, including financial market conditions and the absolute or relative investment performance we achieve for our clients. In addition, the prices of the securities held in the portfolios we manage may decline due to any number of factors beyond our control, including, among others, a declining stock market, general economic downturn, political uncertainty or acts of terrorism. In connection with the severe market dislocations of 2008 and 2009, for example, the value of our assets under management declined substantially due primarily to the sizeable decline in stock prices worldwide. In future periods of difficult market conditions we may experience accelerated client redemptions or withdrawals if clients move assets to investments they perceive as offering greater opportunity or lower risk or our strategies underperform relative to benchmarks, which could further reduce our assets under management in addition to market depreciation. The economic outlook remains uncertain, particularly for the Euro-zone economies, and we continue to operate in a challenging business environment. If any of these factors cause a decline in our assets under management, it would result in lower investment management fees. If our revenues decline without a commensurate reduction in our expenses, our net income will be reduced and our business will be negatively affected.
We expect a change of control of our company to occur approximately one year after the completion of this offering. A change of control, if it occurs, will result in termination of our investment advisory agreements with SEC-registered mutual funds and will trigger consent requirements in our other investment advisory agreements.
Under the U.S. Investment Company Act of 1940, as amended, or the 1940 Act, each of the investment advisory agreements between SEC-registered mutual funds and our subsidiary, Artisan Partners Limited Partnership, will terminate automatically in the event of its assignment, as defined in the 1940 Act. Upon the
-24-
Table of Contents
occurrence of such an assignment, our subsidiary could continue to act as adviser to any such fund only if that fund’s board and shareholders approved a new investment advisory agreement, except in the case of certain of the funds that we sub-advise for which only board approval would be necessary. In addition, as required by the U.S. Investment Advisers Act of 1940, as amended, or the Advisers Act, each of the investment advisory agreements for the separate accounts we manage provides that it may not be assigned, as defined in the Advisers Act, without the consent of the client.
An assignment occurs under the 1940 Act and the Advisers Act if, among other things, Artisan Partners Limited Partnership undergoes a change of control. Currently, AIC is the general partner of Artisan Partners Holdings, which is the general partner of Artisan Partners Limited Partnership. Upon the consummation of this offering, AIC, by virtue of its designee’s right to determine how the shares of our common stock subject to the stockholders agreement are voted (subject to the obligation of the stockholders committee under the terms of the stockholders agreement to vote in support of certain nominees), will continue to control Artisan Partners Limited Partnership for purposes of the 1940 Act and the Advisers Act. AIC will cease to have the right to determine how to vote the shares subject to the stockholders agreement upon the earliest to occur of: (i) Andrew A. Ziegler’s death or disability, (ii) the voluntary termination of Mr. Ziegler’s employment with us, including by reason of the scheduled expiration of his employment on the first anniversary of this offering, and (iii) 180 days after the effective date of Mr. Ziegler’s involuntary termination of employment with us. When AIC no longer has the right to determine how to vote the shares of our common stock subject to the stockholders agreement and therefore no longer controls Artisan Partners Limited Partnership, which we expect will occur on the first anniversary of this offering in connection with the scheduled expiration of Mr. Ziegler’s employment with us, or if there were an earlier change of control at AIC or ZFIC Inc. (an entity that owns all of AIC and is controlled by Mr. Ziegler and Carlene M. Ziegler, who are married to each other), it is expected that an assignment will be deemed to have occurred and we will be required to seek the necessary approvals for new mutual fund investment advisory agreements and consents from our separate account clients. We cannot be certain that Artisan Partners Limited Partnership will be able to obtain the necessary approvals from the boards (including the boards of sub-advised funds, which are different than the board of Artisan Funds) and shareholders of the mutual funds that it advises or the necessary consents from separate account clients.
Failure to properly address conflicts of interest could harm our reputation or cause clients to withdraw funds, each of which could adversely affect our business and results of operations.
The SEC and other regulators have increased their scrutiny of potential conflicts of interest, and we have implemented procedures and controls that we believe are reasonably designed to address these issues. However, appropriately dealing with conflicts of interest is complex and if we fail, or appear to fail, to deal appropriately with conflicts of interest, we could face reputational damage, litigation or regulatory proceedings or penalties, any of which may adversely affect our results of operations.
In addition, as we expand the scope of our business and our client base, we must continue to monitor and address any conflicts between the interests of our stockholders and those of our clients. Our clients may withdraw funds if they perceive conflicts of interest between the investment decisions we make for strategies in which they have invested and our obligations to our stockholders. For example, we may limit the growth of assets in or close strategies or otherwise take action to slow the flow of assets when we believe it is in the best interest of our clients even though our aggregate assets under management and investment management fees may be negatively impacted in the short term. Similarly, we may establish or add new investment teams or expand operations into other geographic areas or jurisdictions if we believe such actions are in the best interest of our clients, even though our revenues may be adversely affected in the short term. Although we believe such actions enable us to retain client assets and maintain our fee schedules and profit margins, which benefits both our clients and stockholders, if clients perceive a change in our investment or operations decisions in favor of a strategy to maximize short term results, they may withdraw funds, which could adversely affect our investment management fees.
-25-
Table of Contents
Several of our investment strategies invest principally in the securities of non-U.S. companies, which involve foreign currency exchange, tax, political, social and economic uncertainties and risks.
As of June 30, 2012, we managed approximately 56% of our assets under management in strategies that primarily invest in securities of non-U.S. companies. In addition, some of our other strategies also invest on a more limited basis in securities of non-U.S. companies. Fluctuations in foreign currency exchange rates could negatively affect the returns of our clients who are invested in these strategies. In addition, an increase in the value of the U.S. dollar relative to non-U.S. currencies is likely to result in a decrease in the U.S. dollar value of our assets under management, which, in turn, could result in lower revenue since we report our financial results in U.S. dollars.
Investments in non-U.S. issuers may also be affected by tax positions taken in countries or regions in which we are invested as well as political, social and economic uncertainty. Declining tax revenues may cause governments to assert their ability to tax the local gains and/or income of foreign investors (including our clients), which could adversely affect clients’ interests in investing outside their home markets. Many financial markets are not as developed, or as efficient, as the U.S. financial markets, and, as a result, those markets may have lesser liquidity and higher price volatility. Liquidity may also be adversely affected by political or economic events within a particular country, and our ability to dispose of an investment may also be adversely affected if we increase the size of our investments in smaller non-U.S. issuers. Non-U.S. legal and regulatory environments, including financial accounting standards and practices, may also be different, and there may be less publicly available information about such companies. These risks could adversely affect the performance of our strategies that are invested in securities of non-U.S. issuers and may be particularly acute in the emerging or less developed markets in which we invest. In addition to our Emerging Markets strategy, a number of our other investment strategies are permitted to invest in emerging or less developed markets in amounts generally ranging from 20% to 25% of the strategy’s assets under management.
We derive a substantial portion of our revenues from a limited number of our strategies.
As of June 30, 2012, $16.4 billion of our assets under management was concentrated in our Non-U.S. Growth strategy, representing approximately 25% of our investment management fees for the six months ended June 30, 2012. Our next four largest strategies, U.S. Mid-Cap Growth, U.S. Mid-Cap Value, Non-U.S. Value and Global Value, represented an additional $11.3 billion, $10.7 billion, $9.3 billion and $5.6 billion of our assets under management, respectively, as of June 30, 2012, representing approximately 18%, 19%, 14% and 5% of our investment management fees, respectively, for the six months ended June 30, 2012. Two of those strategies, Non-U.S. Value and Global Value, are managed by the same investment team. As a result, a substantial portion of our operating results depends upon the performance of those strategies, and our ability to retain client assets in those strategies. Currently, we have closed our U.S. Mid-Cap Value, Non-U.S. Value, U.S. Small-Cap Value, U.S. Mid-Cap Growth and Non-U.S. Small-Cap Growth strategies to most new investors and client relationships. Our smaller strategies, such as our Global Equity strategy, due to their size, may not be able to generate sufficient fees to cover their expenses. If a significant portion of the investors in our larger strategies decided to withdraw their investments or terminate their investment management agreements for any reason, including poor investment performance or adverse market conditions, our revenues from those strategies would decline, which would have a material adverse effect on our earnings and financial condition.
We may not be able to maintain our current fee structure as a result of poor investment performance, competitive pressures or as a result of changes in our business mix, which could have a material adverse effect on our profit margins and results of operations.
We may not be able to maintain our current fee structure for any number of reasons, including as a result of poor investment performance, competitive pressures, changes in global markets and asset classes, or as a result of changes in our business mix. Although our investment management fees vary by client and investment strategy, we historically have been successful in charging above average fees due to the strength of our investment
-26-
Table of Contents
performance and our focus on high value-added investment strategies. In recent years, however, there has been a general trend toward lower fees in the investment management industry, and some of our more recent investment strategies, because they tend to invest in larger-capitalization companies and were designed to have larger capacity and to appeal to larger clients, have lower fee schedules. In order to maintain our fee structure in a competitive environment, we must retain the ability to decline additional assets to manage from potential clients who demand lower fees even though our revenues may be adversely affected in the short term. In addition, we must be able to continue to provide clients with investment returns and service that our clients believe justify our fees. If our investment strategies perform poorly, we may be forced to lower our fees in order to retain current, and attract additional, assets to manage. We may not succeed in providing the investment returns and service that will allow us to maintain our current fee structure. Downward pressure on fees may also result from the growth and evolution of the universe of potential investments in a market or asset class. For example, prevailing fee rates for managing portfolios of emerging markets securities have declined as those markets and the universe of potential investments in emerging markets companies have grown. Changes in how clients choose to access asset management services may also exert downward pressure on fees. Some investment consultants, for example, are implementing programs in which the consultant provides a range of services, including selection, in a fiduciary capacity, of asset managers to serve as sub-adviser at lower fee rates than the manager’s otherwise applicable rates, with the expectation of a larger amount of assets under management through that consultant. The expansion of those and similar programs could, over time, make it more difficult for us to maintain our fee rates. Over time, a larger part of our assets under management could be invested in our larger capacity, lower fee strategies, which could adversely affect our profitability. In addition, plan sponsors of 401(k) and other defined contribution assets that we manage may choose to invest plan assets in vehicles with lower cost structures than mutual funds and may choose to access our services through a collective trust (if available) or a separate account. We provide a lesser array of services to both collective trusts and separate accounts than we provide to Artisan Funds and we receive fees at lower rates.
The investment management agreements pursuant to which we advise mutual funds are terminable on short notice and, after an initial term, are subject to an annual process of review and renewal by the funds’ boards. As part of that annual review process, the fund board considers, among other things, the level of compensation that the fund has been paying us for our services, and that process may result in the renegotiation of our fee structure or increase the cost of our performance of our obligations. Any fee reductions on existing or future new business could have an adverse effect on our profit margins and results of operations. For more information about our fees see “Management’s Discussion and Analysis of Financial Condition and Results of Operations” and “Business—Investment Management Fees”.
We derive substantially all of our revenues from contracts and relationships that may be terminated upon short or no notice.
We derive substantially all of our revenues from investment advisory and sub-advisory agreements, all of which are terminable by clients upon short notice or no notice. Our investment management agreements with mutual funds, as required by law, are generally terminable by the funds’ boards or a vote of a majority of the funds’ outstanding voting securities on not more than 60 days’ written notice. After an initial term, each fund’s investment management agreement must be approved and renewed annually by that fund’s board, including by its independent members. In addition, all of our separate account clients and some of the mutual funds that we sub-advise have the ability to re-allocate all or any portion of the assets that we manage away from us at any time with little or no notice. These investment management agreements and client relationships may be terminated or not renewed for any number of reasons. The decrease in revenues that could result from the termination of a material client relationship or group of client relationships could have a material adverse effect on our business.
Investors in the funds that we advise can redeem their investments in those funds at any time without prior notice, which could adversely affect our earnings.
Investors in the mutual funds and some other pooled investment vehicles that we advise or sub-advise may redeem their investments in those funds at any time without prior notice and investors in other types of pooled
-27-
Table of Contents
vehicles we sub-advise may typically redeem their investments on fairly limited or no prior notice, thereby reducing the aggregate amount of our assets under management. These investors may redeem for any number of reasons, including general financial market conditions, the absolute or relative investment performance we have achieved, or their own financial condition and requirements. In a declining stock market, the pace of redemptions could accelerate. Poor investment performance relative to other funds tends to result in decreased purchases and increased redemptions of fund shares. For the six months ended June 30, 2012, we generated over 76% of our revenues from advising mutual funds and other pooled vehicles (including Artisan Funds, Artisan Global Funds, and other entities for which we are adviser or sub-adviser), and the redemption of investments in those funds would adversely affect our revenues and could have a material adverse effect on our earnings.
We depend on third-party distribution sources to market our investment strategies and access our client base.
Our ability to attract additional assets to manage is highly dependent on our access to third-party intermediaries. We gain access to investors in Artisan Funds primarily through consultants, 401(k) platforms, mutual fund platforms, broker-dealers and financial advisors through which shares of the funds are sold. As of June 30, 2012, the investment consultant advising the largest portion of our assets under management represented approximately 5% of our total assets under management, and our largest relationships with a 401(k) platform, broker-dealer and financial adviser represented approximately 6%, 3% and less than 1%, respectively, of our total assets under management. We compensate most of the intermediaries through which we gain access to investors in Artisan Funds by paying fees, most of which are a percentage of assets invested in Artisan Funds through that intermediary and with respect to which that intermediary provides services. The allocation of such fees between us and Artisan Funds is determined by the board of Artisan Funds, based on information and a recommendation from us, with the goal of allocating to us all costs attributable to marketing and distribution of shares of Artisan Funds. Our expenses in connection with those intermediary relationships could increase if the portion of those fees determined to be in connection with marketing and distribution, and therefore allocated to us, increased. These distribution sources and client bases may not continue to be accessible to us on terms we consider commercially reasonable, or at all. The absence of such access could have a material adverse effect on our results of operations.
We access institutional clients primarily through consultants. Our institutional business is highly dependent upon referrals from consultants. Many of these consultants review and evaluate our products and our firm from time to time. Poor reviews or evaluations of either a particular product, strategy, or us as an investment management firm may result in client withdrawals or may impair our ability to attract new assets through these intermediaries. In addition, the recent economic downturn and consolidation in the broker-dealer industry may lead to reduced distribution access and increases in fees we are required to pay to intermediaries. If such increased fees should be required, refusal to pay them could restrict our access to those client bases while paying them could adversely affect our profitability.
The significant growth we have experienced over the past decade has been and may continue to be difficult to sustain.
Our assets under management increased from $15.6 billion as of December 31, 2001 to $64.1 billion as of June 30, 2012. The absolute measure of our assets under management represents a significant rate of growth that has been and may continue to be difficult to sustain. The continued growth of our business will depend on, among other things, our ability to retain key investment professionals, to devote sufficient resources to maintaining existing investment strategies and to selectively develop new investment strategies. Our business growth will also depend on our success in achieving superior investment performance from our investment strategies, as well as our ability to maintain and extend our distribution capabilities, to deal with changing market conditions, to maintain adequate financial and business controls and to comply with new legal and regulatory requirements arising in response to both the increased sophistication of the investment management industry and the significant market and economic events of the last few years. In addition, the growth in our assets under
-28-
Table of Contents
management has benefited from a general depreciation of the U.S. dollar relative to many of the currencies in which we invest and such currency trends may not continue. If we believe that in order to continue to produce attractive returns from some or all of our investment strategies we should limit the growth of those strategies, we have in the past chosen, and in the future may choose, to limit or close access to those strategies to some or most categories of new investors or otherwise take action to slow the flow of assets into those strategies, even though such actions may adversely affect our revenues in the short term.
In addition, we expect there to be significant demand on our infrastructure and investment teams and we may not be able to manage our growing business effectively or be able to sustain the level of growth we have achieved historically, and any failure to do so could adversely affect our ability to generate revenue and control our expenses.
Our efforts to establish new investment teams and strategies may be unsuccessful and could negatively impact our results of operations and our reputation.
As part of our growth strategy, we may seek to take advantage of opportunities to add new investment teams that invest in a way that is consistent with our philosophy of offering high value-added investment strategies. To the extent we are unable to recruit and retain investment teams that will complement our existing business model, we may not be successful in further diversifying our investment strategies and client assets, any of which could have a material adverse effect on our business and future prospects. In addition, the costs associated with establishing a new team and investment strategy initially will exceed the revenues they generate and the addition of a new team using an investment strategy or investing in securities or instruments with which we have no or limited experience could strain our operational resources and increase the possibility of operational error. If any such new strategies perform poorly and fail to attract sufficient assets to manage, our results of operations will be negatively impacted. In addition, a new strategy’s poor performance may negatively impact our reputation and the reputation of our other investment strategies within the investment community.
The long-only, equity investment focus of our strategies exposes us to greater risk than certain of our competitors whose investment strategies may also include non-equity securities or short positions.
Our investment strategies hold long positions in publicly-traded equity securities of companies across a wide range of market capitalizations, geographies and industries; investments by our strategies in non-equity securities have been immaterial. Accordingly, under market conditions in which there is a general decline in the value of equity securities, each of our strategies is likely to perform poorly on an absolute basis. Unlike some of our competitors, we do not have strategies that invest in privately-held companies or in non-equity securities or take short positions in equity securities, which could offset some of the poor performance of our long-only, equity strategies under such market conditions. Even if our investment performance remains strong during such market conditions relative to other long-only, equity strategies, investors may choose to withdraw assets from our management or allocate a larger portion of their assets to non-long-only or non-equity strategies, which we do not currently offer. In addition, the prices of equity securities may fluctuate more widely than the prices of other types of securities, making the level of our assets under management and related revenues more volatile.
The performance of our investment strategies or the growth of our assets under management may be constrained by unavailability of appropriate investment opportunities.
The ability of our investment teams to deliver strong investment performance depends in large part on their ability to identify appropriate investment opportunities in which to invest client assets. If the investment team for any of our strategies is unable to identify sufficient appropriate investment opportunities for existing and new client assets on a timely basis, the investment performance of the strategy could be adversely affected. In addition, if we determine that sufficient investment opportunities are not available for a strategy, we may choose to limit the growth of the strategy by limiting the rate at which we accept additional client assets for management
-29-
Table of Contents
under the strategy, closing the strategy to all or substantially all new investors or otherwise taking action to limit the flow of assets into the strategy. If we misjudge the point at which it would be optimal to limit access to or close a strategy, the investment performance of the strategy could be negatively impacted. The risk that sufficient appropriate investment opportunities may be unavailable is influenced by a number of factors, including general market conditions, but is particularly acute with respect to our strategies that focus on small-cap and emerging market investments, and is likely to increase as our assets under management increase, particularly if these increases occur very rapidly. By limiting the growth of strategies, we may be managing the business in a manner that reduces the total amount of our assets under management and our investment management fees over the short term.
Our failure to comply with investment guidelines set by our clients, including the boards of mutual funds, and limitations imposed by applicable law, could result in damage awards against us and a loss of our assets under management, either of which could adversely affect our results of operations or financial condition.
When clients retain us to manage assets on their behalf, they generally specify certain guidelines regarding investment allocation and strategy that we are required to follow in managing their portfolios. The boards of mutual funds we manage generally establish similar guidelines regarding the investment of assets in those funds. We are also required to invest the mutual funds’ assets in accordance with limitations under the 1940 Act and applicable provisions of the Internal Revenue Code of 1986, as amended, or the Internal Revenue Code. Other clients, such as plans subject to the Employee Retirement Income Security Act of 1974, as amended, or ERISA, or non-U.S. funds, require us to invest their assets in accordance with applicable law. Our failure to comply with any of these guidelines and other limitations could result in losses to clients or investors in a fund which, depending on the circumstances, could result in our obligation to make clients or fund investors whole for such losses. If we believed that the circumstances did not justify a reimbursement, or clients and investors believed the reimbursement we offered was insufficient, they could seek to recover damages from us or could withdraw assets from our management or terminate their investment management agreement with us. Any of these events could harm our reputation and adversely affect our business.
Operational risks may disrupt our business, result in losses or limit our growth.
We are heavily dependent on the capacity and reliability of the communications, information and technology systems supporting our operations, whether developed, owned and operated by us or by third parties. Operational risks such as trading or operational errors or interruption of our financial, accounting, trading, compliance and other data processing systems, whether caused by fire, other natural disaster or pandemic, power or telecommunications failure, act of terrorism or war or otherwise, could result in a disruption of our business, liability to clients, regulatory intervention or reputational damage, and thus materially adversely affect our business. The potential for some types of operational risks, including, for example, trading errors, may be increased in periods of increased volatility, which can magnify the cost of an error. Although we have not suffered operational errors, including trading errors, of significant magnitude in the past, we may experience such errors in the future, which could be significant and the losses related to which we would be required to absorb. Insurance and other safeguards might not be available or might only partially reimburse us for our losses. Although we have back-up systems in place, our back-up procedures and capabilities in the event of a failure or interruption may not be adequate, and the fact that we operate our business out of multiple physical locations may make such failures and interruptions difficult to address on a timely and adequate basis. As our client base, number and complexity of investment strategies, client relationships and/or physical locations increase, developing and maintaining our operational systems and infrastructure may become increasingly challenging, which could constrain our ability to expand our businesses. Any upgrades or expansions to our operations and/or technology to accommodate increased volumes or complexity of transactions or otherwise may require significant expenditures and may increase the probability that we will suffer system degradations and failures. If we are unsuccessful in executing any such upgrades or expansions, we may instead have to hire additional employees, which could increase operational risk due to human error. We depend substantially on our Milwaukee, Wisconsin office where a majority of our employees, administration and technology resources are located, for the continued operation of our business. Any significant disruption to that office could have a material adverse effect on us.
-30-
Table of Contents
Employee misconduct could expose us to significant legal liability and reputational harm.
We are vulnerable to reputational harm because we operate in an industry in which integrity and the confidence of our clients are of critical importance. Our employees could engage in misconduct that adversely affects our business. For example, if an employee were to engage in illegal or suspicious activities, we could be subject to regulatory sanctions and suffer serious harm to our reputation (as a consequence of the negative perception resulting from such activities), financial position, client relationships and ability to attract new clients. Our business often requires that we deal with confidential information. If our employees were to improperly use or disclose this information, even if inadvertently, we could suffer serious harm to our reputation, financial position and current and future business relationships. It is not always possible to deter employee misconduct, and the precautions we take to detect and prevent this activity may not always be effective. In addition, the SEC recently has increased its scrutiny of the use of non-public information obtained from corporate insiders by professional investors. Misconduct by our employees, or even unsubstantiated allegations of misconduct, could result in an adverse effect on our reputation and our business.
If our techniques for managing risk are ineffective, we may be exposed to material unanticipated losses.
In order to manage the significant risks inherent in our business, we must maintain effective policies, procedures and systems that enable us to identify, monitor and control our exposure to operational, legal and reputational risks. Our risk management methods may prove to be ineffective due to their design or implementation, or as a result of the lack of adequate, accurate or timely information or otherwise. If our risk management efforts are ineffective, we could suffer losses that could have a material adverse effect on our financial condition or operating results. Additionally, we could be subject to litigation, particularly from our clients, and sanctions or fines from regulators. Our techniques for managing risks in client portfolios may not fully mitigate the risk exposure in all economic or market environments, or against all types of risk, including risks that we might fail to identify or anticipate.
Our indebtedness may expose us to material risks.
Even after giving effect to the application of a portion of the net proceeds of this offering to pay down all or a portion of the then-outstanding principal amount of any loans under our revolving credit agreement, we will continue to have substantial indebtedness outstanding, which exposes us to risks associated with the use of leverage. Our substantial indebtedness makes it more difficult for us to withstand or respond to adverse or changing business, regulatory and economic conditions or to take advantage of new business opportunities or make necessary capital expenditures. In August 2012, we entered into a $100 million five-year revolving credit agreement and issued $200 million in unsecured notes consisting of $60 million Series A notes maturing in 2017, $50 million Series B notes maturing in 2019, and $90 million Series C notes maturing in 2022. We used the proceeds of the notes and $90 million drawn from the revolving credit facility to prepay all of the then-outstanding principal amount of our $400 million term loan. Our notes and revolving credit agreement contain financial and operating covenants that may limit our ability to conduct our business. A substantial portion of our cash flow could be required for debt service and, as a result, might not be available for our operations or other purposes. Any substantial decrease in net operating cash flows or any substantial increase in expenses could make it difficult for us to meet our debt service requirements or force us to modify our operations. Our ability to repay the principal amount of our notes or outstanding loans under our revolving credit agreement, to refinance our debt or to obtain additional financing through debt or the sale of additional equity securities will depend on our performance, as well as financial, business and other general economic factors affecting the credit and equity markets generally or our business in particular, many of which are beyond our control. Any such alternatives may not be available to us on satisfactory terms or at all.
Our note purchase agreement and revolving credit agreement contain, and our future indebtedness may contain, various covenants that may limit our business activities.
Our note purchase agreement and revolving credit agreement contain financial and operating covenants that limit our business activities, including restrictions on our ability to incur additional indebtedness and pay
-31-
Table of Contents
dividends to our stockholders. For example, the agreements include financial covenants requiring Artisan Partners Holdings not to exceed specified ratios of indebtedness to consolidated earnings before interest, taxes, depreciation and amortization (as defined in the agreements), or EBITDA, and consolidated EBITDA to interest expense, and restricts Artisan Partners Holdings from making distributions to its partners (including us), other than tax distributions or distributions to fund our ordinary expenses, if a default (as defined in the respective agreements) has occurred and is continuing or would result from such a distribution. The failure to comply with any of these restrictions could result in an event of default, giving our lenders the ability to accelerate repayment of our obligations. As of the date of this prospectus, we believe we are in compliance with all of the covenants and other requirements set forth in the agreements.
We provide a broad range of services to Artisan Funds, Artisan Global Funds and sub-advised mutual funds which may expose us to liability.
We provide a broad range of administrative services to Artisan Funds, including providing personnel to Artisan Funds to serve as officers of Artisan Funds, preparation or supervision of the preparation of Artisan Funds’ regulatory filings, maintenance of board calendars and preparation or supervision of the preparation of board meeting materials, management of compliance and regulatory matters, provision of shareholder services and communications, accounting services including the supervision of the activities of Artisan Funds’ accounting services provider in the calculation of the funds’ net asset values, preparation of Artisan Funds’ financial statements and coordination of the audits of those financial statements, tax services including calculation of dividend and distribution amounts and supervision of tax return preparation, and supervision of the work of Artisan Funds’ other service providers. Although less extensive than the range of services we provide to Artisan Funds, we also provide a range of services, in addition to investment management services, to Artisan Global Funds, including providing personnel to serve as directors of Artisan Global Funds, various distribution, marketing and shareholder services, providing information to the accounting services provider to assist in the calculation of Artisan Global Funds’ net asset values, supplying information that is used by Artisan Global Funds to meet its regulatory requirements and review of the various service providers to Artisan Global Funds. In addition, we from time to time provide information to the mutual funds for which we act as sub-adviser (or to a person or entity providing administrative services to such a fund) which is used by those funds in their efforts to comply with various regulatory requirements. If we make a mistake in the provision of those services, Artisan Funds, Artisan Global Funds or the sub-advised fund could incur costs for which we might be liable. In addition, if it were determined that Artisan Funds, Artisan Global Funds or the sub-advised fund failed to comply with applicable regulatory requirements as a result of action or failure to act by our employees, we could be responsible for losses suffered or penalties imposed. In addition, we could have penalties imposed on us, be required to pay fines or be subject to private litigation, any of which could decrease our future income or negatively affect our current business or our future growth prospects.
The expansion of our business outside of the United States raises tax and regulatory risks, may adversely affect our profit margins and will place additional demands on our resources and employees.
We are expanding our distribution effort into non-U.S. markets, including the United Kingdom, other member countries of the European Union, Australia and certain Asian countries, among others, and we have established a U.K. subsidiary which is authorized to provide investment management services by the Financial Services Authority in the United Kingdom. The portfolio manager for our Global Equity strategy is based in our U.K. office. This expansion has required and will continue to require us to incur a number of up-front expenses, including those associated with obtaining regulatory approvals and office space, as well as additional ongoing expenses, including those associated with leases, the employment of additional support staff in the U.K. and regulatory compliance. In addition, we have organized Artisan Global Funds, a family of Ireland-based UCITS funds, that began operations during the first quarter of 2011, and for which we are investment manager and promoter. Clients outside the United States may be less accepting of the U.S. practice of payment for certain research products and services through soft dollars, which could have the effect of increasing our expenses. Our employees routinely travel outside the United States as a part of our investment research process or to market our
-32-
Table of Contents
services and may spend extended periods of time in one or more non-U.S. jurisdictions. Their activities outside the United States on our behalf may raise both tax and regulatory issues. If and to the extent we are incorrect in our analysis of the applicability or impact of non-U.S. tax or regulatory requirements, we could incur costs, penalties or be the subject of an enforcement or other action. We also expect that operating our business in non-U.S. markets generally will be more expensive than in the United States. Among other expenses, the effective tax rates applicable to our income allocated to some non-U.S. markets, which we are likely to earn through an entity that will pay corporate income tax, may be higher than the effective rates applicable to our income allocated to the United States, even though the effective tax rates are lower in many non-U.S. markets, because our U.S. operations are conducted through partnerships. To the extent that our revenues do not increase to the same degree our expenses increase in connection with our expansion outside the United States, our profitability could be adversely affected. Expanding our business into non-U.S. markets may also place significant demands on our existing infrastructure and employees.
The cost of insuring our business is substantial and may increase.
Our insurance costs are substantial and can fluctuate significantly from year to year and rate increases in the future are possible. In addition, certain insurance coverage may not be available or may only be available at prohibitive costs. As we renew our insurance policies, we may be subject to additional costs resulting from rising premiums, the assumption of higher deductibles and/or co-insurance liability and, to the extent Artisan Funds or Artisan Global Funds purchases separate director and officer and/or errors and omissions liability coverage, an increased risk of insurance companies disputing responsibility for joint claims. In addition, we intend to obtain liability insurance for our directors and officers in connection with this offering. Higher insurance costs and incurred deductibles would reduce our net income.
Fulfilling our public company financial reporting and other regulatory obligations will be expensive and time consuming and may strain our resources.
As a public company, we will be subject to the reporting requirements of the Securities Exchange Act of 1934, as amended, or the Exchange Act, and will be required to implement specific corporate governance practices and adhere to a variety of reporting requirements under the Sarbanes-Oxley Act of 2002, or Sarbanes-Oxley, and the related rules and regulations of the SEC, as well as the rules of the New York Stock Exchange, or NYSE. The Exchange Act will require us to file annual, quarterly and current reports with respect to our business and financial condition. Sarbanes-Oxley will require, among other things, that we maintain effective disclosure controls and procedures and internal control over financial reporting. Compliance with these requirements will place significant additional demands on our legal, accounting and finance staff and on our accounting, financial and information systems and will increase our legal and accounting compliance costs as well as our compensation expense as we will be required to hire additional accounting, tax, finance and legal staff with the requisite technical knowledge.
In accordance with Section 404 of Sarbanes-Oxley, our management will be required to conduct an annual assessment of the effectiveness of our internal control over financial reporting and include a report on these internal controls in the annual reports we will file with the SEC on Form 10-K. Our independent registered public accounting firm will not be required to formally attest to the effectiveness of our internal controls until the later of the year following the first annual report required to be filed with the SEC and the date on which we are no longer an “emerging growth company”. We are in the process of reviewing our internal control over financial reporting and are establishing formal policies, processes and practices related to financial reporting and to the identification of key financial reporting risks, assessment of their potential impact and linkage of those risks to specific areas and controls within our organization. If we are not able to implement the requirements of Section 404 in a timely and capable manner, we may be subject to adverse regulatory consequences and there could be a negative reaction in the financial markets due to a loss of investor confidence in us and the reliability of our financial statements. This could have a material adverse effect on us.
-33-
Table of Contents
As a public company we will also need to enhance our investor relations, legal and corporate communications functions. These additional efforts may strain our resources and divert management’s attention from other business concerns, which could have a material adverse effect on our business, financial condition and results of operations.
We are an emerging growth company within the meaning of the Securities Act, and if we decide to take advantage of certain exemptions from various reporting requirements applicable to emerging growth companies, our common stock could be less attractive to investors.
For as long as we remain an “emerging growth company”, as defined in the Jumpstart Our Business Startups Act of 2012, or the JOBS Act, we will have the option to take advantage of certain exemptions from various reporting and other requirements that are applicable to other public companies that are not “emerging growth companies” including, but not limited to, not being required to comply with the auditor attestation requirements of Section 404 of Sarbanes-Oxley, reduced disclosure obligations regarding executive compensation in our periodic reports and proxy statements, and exemptions from the requirements of holding a nonbinding advisory vote on executive compensation and stockholder approval of any golden parachute payments not previously approved. We may take advantage of these and other exemptions until we are no longer an “emerging growth company”.
The JOBS Act provides that an “emerging growth company” can take advantage of the extended transition period provided in Section 7(a)(2)(B) of the Securities Act of 1933, as amended, or the Securities Act, for complying with new or revised accounting standards. However, we are choosing to “opt out” of such extended transition period, and as a result, we will comply with new or revised accounting standards on the relevant dates on which adoption of such standards is required for non-emerging growth companies. Our decision to opt out of the extended transition period is irrevocable.
We anticipate that we will remain an “emerging growth company” until the earliest of (i) the end of the fiscal year during which we have total annual gross revenues of $1.0 billion or more, (ii) the end of the fiscal year following the fifth anniversary of the completion of this offering, (iii) the date on which we have, during the previous three-year period, issued more than $1 billion in non-convertible debt and (iv) the end of the fiscal year in which the market value of our equity securities that are held by non-affiliates exceeds $700 million as of June 30 of that year.
Risks Related to our Industry
We are subject to extensive regulation.
We are subject to extensive regulation in the United States, primarily at the federal level, including regulation by the SEC under the 1940 Act and the Advisers Act, by the U.S. Department of Labor under ERISA, and by the Financial Industry Regulatory Authority, Inc., or FINRA. We are also subject to regulation in the United Kingdom by the Financial Services Authority, or U.K. FSA. The U.S. mutual funds we manage are registered with and regulated by the SEC as investment companies under the 1940 Act. The U.K. FSA imposes a comprehensive system of regulation that is primarily principles-based (compared to the primarily rules-based U.S. regulatory system) and with which we currently have only limited experience. The Advisers Act imposes numerous obligations on investment advisers including record keeping, advertising and operating requirements, disclosure obligations and prohibitions on fraudulent activities. The 1940 Act imposes similar obligations, as well as additional detailed operational requirements, on registered investment companies, which must be adhered to by their investment advisers. We are also expanding our distribution effort into non-U.S. markets, including the United Kingdom, other member countries of the European Union, Australia and certain Asian countries, among others. The Central Bank of Ireland imposes requirements on UCITS funds subject to regulation by it, as do the regulators in certain other markets in which shares of Artisan Global Funds are offered for sale, and with which we are required to comply with respect to Artisan Global Funds. In the future, we may further expand our
-34-
Table of Contents
business outside of the United States in such a way or to such an extent that we may be required to register with additional foreign regulatory agencies or otherwise comply with additional non-U.S. laws and regulations that do not currently apply to us and with respect to which we do not have compliance experience. Our lack of experience in complying with any such non-U.S. laws and regulations may increase our risk of becoming party to litigation and subject to regulatory actions.
In addition, the U.S. mutual funds that we advise and our broker-dealer subsidiary are each subject to the USA PATRIOT Act of 2001, which requires them to know certain information about their clients and to monitor their transactions for suspicious financial activities, including money laundering. The U.S. Office of Foreign Assets Control, or OFAC, has issued regulations requiring that we refrain from doing business, or allowing our clients to do business through us, in certain countries or with certain organizations or individuals on a list maintained by the U.S. government. Our failure to comply with applicable laws or regulations could result in fines, censure, suspensions of personnel or other sanctions, including revocation of the registration of Artisan Partners Limited Partnership and Artisan Partners UK LLP as registered investment advisers.
Accordingly, we face the risk of significant intervention by regulatory authorities, including extended investigation and surveillance activity, adoption of costly or restrictive new regulations and judicial or administrative proceedings that may result in substantial penalties. Among other things, we could be fined or be prohibited from engaging in some of our business activities. The requirements imposed by our regulators are designed to ensure the integrity of the financial markets and to protect customers and other third parties who deal with us, and are not designed to protect our stockholders. Consequently, these regulations often serve to limit our activities, including through net capital, customer protection and market conduct requirements. See “Regulatory Environment and Compliance”.
In addition to the extensive regulation to which we are subject in the United States, the United Kingdom and Ireland, we are also subject to regulation by the Australian Securities and Investments Commission, where we operate pursuant to an order of exemption, and by Canadian regulatory authorities in the Canadian provinces where we operate pursuant to exemptions from registration. Our business is also subject to the rules and regulations of the countries in which we conduct investment activities. Failure to comply with applicable laws and regulations in the foreign countries where we invest could result in fines, suspensions of personnel or other sanctions. See “Regulatory Environment and Compliance”.
The regulatory environment in which we operate is subject to continual change, and regulatory developments designed to increase oversight may adversely affect our business.
The legislative and regulatory environment in which we operate has undergone significant changes in the recent past. We believe that significant regulatory changes in our industry are likely to continue on a scale that exceeds the historical pace of regulatory change, which is likely to subject industry participants to additional, more costly and generally more punitive regulation. The requirements imposed by our regulators are designed to ensure the integrity of the financial markets and to protect customers and other third parties who deal with us, and are not designed to protect our stockholders. Consequently, these regulations often serve to limit our activities and/or increase our costs, including through customer protection and market conduct requirements. New laws or regulations, or changes in the enforcement of existing laws or regulations, applicable to us and our clients may adversely affect our business. Our ability to function in this environment will depend on our ability to constantly monitor and promptly react to legislative and regulatory changes. There have been a number of highly publicized regulatory inquiries that have focused on the investment management industry. These inquiries already have resulted in increased scrutiny of the industry and new rules and regulations for mutual funds and investment managers. This regulatory scrutiny may limit our ability to engage in certain activities that might be beneficial to our stockholders. See “Regulatory Environment and Compliance”.
In addition, as a result of the recent economic downturn, acts of serious fraud in the investment management industry and perceived lapses in regulatory oversight, U.S. and non-U.S. governmental and regulatory authorities
-35-
Table of Contents
may increase regulatory oversight of our businesses. We may be adversely affected as a result of new or revised legislation or regulations imposed by the SEC, other U.S. or non-U.S. governmental regulatory authorities or self-regulatory organizations that supervise the financial markets. We also may be adversely affected by changes in the interpretation or enforcement of existing laws and rules by these governmental authorities and self-regulatory organizations, as well as by U.S. courts. It is impossible to determine the extent of the impact of any new laws, regulations or initiatives that may be proposed, or whether any of the proposals will become law. Compliance with any new laws or regulations could make compliance more difficult and expensive and affect the manner in which we conduct business.
Another change in the regulatory landscape is the Foreign Account Tax Compliance Act, or FATCA, which was enacted in 2010 and is intended to address tax compliance issues associated with U.S. taxpayers with foreign accounts. FATCA requires foreign financial institutions to report to the IRS information about financial accounts held by U.S. taxpayers and imposes withholding, documentation and reporting requirements on foreign financial institutions. FATCA, and the IRS regulations implementing it (which have yet to become fully effective), could cause us to incur significant administrative costs.
The investment management industry is intensely competitive.
The investment management industry is intensely competitive, with competition based on a variety of factors, including investment performance, investment management fee rates, continuity of investment professionals and client relationships, the quality of services provided to clients, corporate positioning and business reputation, continuity of selling arrangements with intermediaries and differentiated products. A number of factors, including the following, serve to increase our competitive risks:
| • | a number of our competitors have greater financial, technical, marketing and other resources, more comprehensive name recognition and more personnel than we do; |
| • | potential competitors have a relatively low cost of entering the investment management industry; |
| • | the recent trend toward consolidation in the investment management industry, and the securities business in general, has served to increase the size and strength of a number of our competitors; |
| • | some investors may prefer to invest with an investment manager that is not publicly traded based on the perception that a publicly traded asset manager may focus on the manager’s own growth to the detriment of investment performance for clients; |
| • | some competitors may invest according to different investment styles or in alternative asset classes that may be perceived as more attractive than the investment strategies we offer; |
| • | other industry participants, hedge funds and alternative asset managers may seek to recruit our investment professionals; and |
| • | some competitors charge lower fees for their investment management services than we do. |
If we are unable to compete effectively, our earnings would be reduced and our business could be materially adversely affected.
The investment management industry faces substantial litigation risks which could materially adversely affect our business, financial condition or results of operations or cause significant reputational harm to us.
We depend to a large extent on our network of relationships and on our reputation in order to attract and retain client assets. If a client is not satisfied with our services, its dissatisfaction may be more damaging to our business than client dissatisfaction would be to other types of businesses. We make investment decisions on behalf of our clients that could result in substantial losses to them. If our clients suffer significant losses, or are otherwise dissatisfied with our services, we could be subject to the risk of legal liabilities or actions alleging
-36-
Table of Contents
negligent misconduct, breach of fiduciary duty, breach of contract, unjust enrichment and/or fraud. These risks are often difficult to assess or quantify and their existence and magnitude often remain unknown for substantial periods of time, even after an action has been commenced. We may incur significant legal expenses in defending against litigation whether or not we engaged in conduct as a result of which we might be subject to legal liability. Substantial legal liability or significant regulatory action against us could materially adversely affect our business, financial condition or results of operations or cause significant reputational harm to us.
Risks Related to Our Structure
Control by our employee-partners and AIC of % of the combined voting power of our capital stock and the rights of holders of limited partnership units of Artisan Partners Holdings may give rise to conflicts of interest.
Immediately after the completion of this offering, our employee-partners will hold approximately % of the combined voting power of our capital stock and AIC will hold approximately % of the combined voting power of our capital stock (or approximately % and %, respectively, if the underwriters exercise in full their option to purchase additional shares). Concurrently with the completion of this offering, each of our employee-partners and AIC will enter into a stockholders agreement pursuant to which they will grant an irrevocable voting proxy with respect to all shares of our common stock they hold at such time or may acquire from us in the future to a stockholders committee. At the close of the reorganization, the only shares of our capital stock subject to the stockholders agreement will be the shares of our common stock held by our employee-partners and AIC. Thereafter, any shares of our common stock that we issue to our employee-partners or other employees will be subject to the stockholders agreement so long as the agreement has not been terminated. In connection with this offering, we plan to adopt the 2013 Omnibus Incentive Compensation Plan, pursuant to which we intend to grant equity awards of or with respect to shares of our Class A common stock or common units of Artisan Partners Holdings. To the extent that we cause Artisan Partners Holdings to issue additional common units to our employees, these employees would be entitled to receive a corresponding number of shares of our Class B common stock (including if the common units awarded are subject to vesting). All of the shares of our common stock issued to employees under this plan will be subject to the stockholders agreement. Each share of our Class B common stock initially will entitle its holder to five votes per share. If and when the holders of our Class B common stock collectively hold less than 20% of the aggregate number of outstanding shares of our common stock and our convertible preferred stock, shares of Class B common stock will entitle the holder to only one vote per share.
For so long as the shares subject to the stockholders agreement represent at least a majority of the combined voting power of our capital stock, the stockholders committee will be able to elect all of the members of our board of directors (subject to the obligation of the stockholders committee under the terms of the stockholders agreement to vote in support of certain nominees) and thereby control our management and affairs, including determinations with respect to acquisitions, dispositions, borrowings, issuances of securities, and the declaration and payment of dividends. In addition, subject to the class approval rights of each class of our outstanding capital stock and each class of Artisan Partners Holdings limited partnership units, the stockholders committee will be able to determine the outcome of all matters requiring approval of stockholders, and will be able to cause or prevent a change of control of our company or a change in the composition of our board of directors, and could preclude any unsolicited acquisition of our company. The stockholders committee will have the ability to prevent the consummation of mergers, takeovers or other transactions that may be in the best interests of our Class A stockholders. In particular, this concentration of voting power could deprive Class A stockholders of an opportunity to receive a premium for their shares of Class A common stock as part of a sale of our company, and could ultimately affect the market price of our Class A common stock. Because each share of our Class B common stock will initially entitle its holder to five votes, there may be situations where the stockholders committee controls our management and affairs even if the shares subject to the stockholders agreement represent less than a majority of the number of outstanding shares of our capital stock.
-37-
Table of Contents
A designee of AIC, who initially will be Mr. Ziegler, will have the sole right, in consultation with the other members of the stockholders committee as required pursuant to the stockholders agreement, to determine how to vote all shares subject to the stockholders agreement until the earliest to occur of: (i) Mr. Ziegler’s death or disability, (ii) the voluntary termination of Mr. Ziegler’s employment with us, including by reason of the scheduled expiration of his employment on the first anniversary of this offering, and (iii) 180 days after the effective date of Mr. Ziegler’s involuntary termination of employment with us. AIC will have the right to withdraw its shares of common stock from the stockholders agreement when Mr. Ziegler is no longer a member of the stockholders committee. Upon such withdrawal AIC will have sole voting control over its shares. Shares held by an employee will cease to be subject to the stockholders agreement upon termination of employment. See “Our Structure and Reorganization—Stockholders Agreement” for additional information about the stockholders agreement.
Even if AIC were to withdraw from the stockholders agreement, our employees, based on their ownership of our outstanding capital stock immediately after the completion of this offering, would still have the ability to determine the outcome of any matter requiring the approval of a simple majority of our outstanding voting stock and prevent the approval of any matter requiring the approval of 66 2/3% of our outstanding voting stock.
Our employee-partners (through their ownership of Class B common units), AIC (through its ownership of Class D common units), the holders of Class A common units and the holders of preferred units will have the right, each voting as a single and separate class, to approve or disapprove certain transactions and matters, including material corporate transactions, such as a merger, consolidation, dissolution or sale of greater than 25% of the fair market value of Artisan Partners Holdings’ assets, and the issuance or redemption of certain additional equity interests. See “Our Structure and Reorganization—Offering Transactions—Amended and Restated Limited Partnership Agreement of Artisan Partners Holdings—Voting and Class Approval Rights”. These voting and class approval rights may enable our employee-partners, AIC, the holders of Class A units or the holders of preferred units to prevent the consummation of transactions that may be in the best interests of holders of our Class A common stock.
In addition, because our existing owners will hold all or a portion of their ownership interests in our business through Artisan Partners Holdings, rather than through Artisan Partners Asset Management, these existing owners may have conflicting interests with holders of our Class A common stock. For example, our existing owners may have different tax positions from us which could influence their decisions regarding whether and when we should dispose of assets, whether and when we should incur new or refinance existing indebtedness, especially in light of the existence of the tax receivable agreements that we will enter into as part of the reorganization transactions, and whether and when Artisan Partners Asset Management should terminate the tax receivable agreements and accelerate its obligations thereunder. In addition, the structuring of future transactions may take into consideration these existing owners’ tax or other considerations even where no similar benefit would accrue to us. See “Our Structure and Reorganization—Tax Receivable Agreements”.
Our ability to pay regular dividends to our stockholders is subject to the discretion of our board of directors and may be limited by our structure and applicable provisions of Delaware law.
Following completion of this offering, we intend to declare cash dividends on our Class A common stock as described in “Dividend Policy and Dividends”. However, our board of directors may, in its sole discretion, change the amount or frequency of dividends or discontinue the payment of dividends entirely. In addition, because of our structure, we will be dependent upon the ability of our subsidiaries to generate earnings and cash flows and distribute them to us so that we may pay dividends to our stockholders. We expect to cause Artisan Partners Holdings, which is a Delaware limited partnership, to make distributions to its partners, including us, in an amount sufficient for us to pay dividends. However, its ability to make such distributions will be subject to its and its subsidiaries’ operating results, cash requirements and financial condition, the applicable provisions of Delaware law that may limit the amount of funds available for distribution to its partners, its compliance with covenants and financial ratios related to existing or future indebtedness, including under our notes and our
-38-
Table of Contents
revolving credit agreement, its other agreements with third parties, as well as its obligation to make tax distributions under its partnership agreement (which distributions would reduce the cash available for distributions by Artisan Partners Holdings to us). Our ability to pay cash dividends to our Class A stockholders with the distributions received by us as general partner of Artisan Partners Holdings will be subject to the prior right of holders of our convertible preferred stock to receive distributions attributable to the distributions (net of taxes) made on the preferred units of Artisan Partners Holdings that we hold and, as a Delaware corporation, the applicable provisions of Delaware law. See “Dividend Policy and Dividends”. In addition, each of the companies in the corporate chain must manage its assets, liabilities and working capital in order to meet all of its cash obligations, including the payment of dividends or distributions. As a consequence of these various limitations and restrictions, we may not be able to make, or may have to reduce or eliminate, the payment of dividends on our Class A common stock. Any change in the level of our dividends or the suspension of the payment thereof could adversely affect the market price of our Class A common stock.
Our ability to pay taxes and expenses, including payments under the tax receivable agreements, may be limited by our structure.
Upon the consummation of this offering, we will have no material assets other than our ownership of partnership units of, and CVRs issued by, Artisan Partners Holdings and will have no independent means of generating revenue. Artisan Partners Holdings will be treated as a partnership for U.S. federal income tax purposes and, as such, will not be subject to U.S. federal income tax. Instead, taxable income will be allocated to holders of its partnership units, including us. Accordingly, we will incur income taxes on our proportionate share of any net taxable income of Artisan Partners Holdings and will also incur expenses related to our operations. Under the terms of its amended and restated limited partnership agreement, Artisan Partners Holdings will be obligated to make tax distributions to holders of its partnership units, including us. In addition to tax expenses, we also will incur expenses related to our operations, including expenses under the tax receivable agreements, which we expect will be significant. We intend to cause Artisan Partners Holdings to make distributions in an amount sufficient to allow us to pay our taxes and operating expenses, including any payments due under the tax receivable agreements. However, its ability to make such distributions will be subject to various limitations and restrictions as set forth in the preceding risk factor. If, as a consequence of these various limitations and restrictions, we do not have sufficient funds to pay tax or other liabilities or to fund our operations, we may have to borrow funds and thus our liquidity and financial condition could be materially adversely affected. To the extent that we are unable to make payments under the tax receivable agreements for any reason, such payments will be deferred and will accrue interest at until paid.
We will be required to pay holders of our convertible preferred stock and holders of limited partnership units of Artisan Partners Holdings for certain tax benefits we may claim, and we expect that the payments we will be required to make will be substantial.
The H&F Corp Merger described under “Our Structure and Reorganization—Reorganization Transactions and Post-IPO Structure” will result in favorable tax attributes for us. In addition, the redemption of limited partnership units of Artisan Partners Holdings in connection with this offering and future exchanges of limited partnership units for shares of our Class A common stock or convertible preferred stock are expected to produce additional favorable tax attributes for us. When we acquire partnership units from existing partners, both the existing basis and the anticipated basis adjustments are likely to increase (for tax purposes) depreciation and amortization deductions allocable to us from Artisan Partners Holdings and therefore reduce the amount of income tax we would otherwise be required to pay in the future. This increase in tax basis may also decrease gain (or increase loss) on future dispositions of certain capital assets to the extent the increased tax basis is allocated to those capital assets.
We intend to enter into two tax receivable agreements. One tax receivable agreement, which we will enter into with the holders of convertible preferred stock issued as consideration for the H&F Corp Merger, will generally provide for the payment by us to such stockholders of 85% of the amount of cash savings, if any, in
-39-
Table of Contents
U.S. federal and state income tax that we actually realize (or are deemed to realize in certain circumstances) in periods after this offering as a result of (i) existing tax basis in Artisan Partners Holdings’ assets with respect to the preferred units acquired by us in the merger that arose from certain prior distributions by Artisan Partners Holdings and prior purchases of partnership interests by H&F Corp, (ii) any net operating losses available to us as a result of the H&F Corp Merger, and (iii) tax benefits related to imputed interest deemed to be paid by us as a result of this tax receivable agreement.
The second tax receivable agreement, which we will enter into with each of the holders of common and preferred units, will generally provide for the payment by us to each of them of 85% of the amount of the cash savings, if any, in U.S. federal and state income tax that we actually realize (or are deemed to realize in certain circumstances) in periods after this offering as a result of (i) any step-up in tax basis in Artisan Partners Holdings’ assets resulting from (a) the redemption of limited partnership units for cash or the exchange of limited partnership units (along with the corresponding shares of our Class B or Class C common stock) for shares of our Class A common stock or convertible preferred stock and (b) payments under this tax receivable agreement, (ii) certain prior distributions by Artisan Partners Holdings and prior transfers or exchanges of partnership interests which resulted in tax basis adjustments to the assets of Artisan Partners Holdings and (iii) tax benefits related to imputed interest deemed to be paid by us as a result of this tax receivable agreement.
We expect that the payments we will be required to make under the tax receivable agreements will be substantial. Assuming no material changes in the relevant tax law and that we earn sufficient taxable income to realize all tax benefits that are subject to the tax receivable agreements, we expect that the reduction in tax payments for us associated with (i) the merger, (ii) the redemption of common units held by certain of our initial outside investors with a portion of the net proceeds of this offering and (iii) future exchanges of limited partnership units as described above would aggregate to approximately $ over 15 years from the date of this offering based on an assumed price of $ per share of our Class A common stock (the midpoint of the price range set forth on the cover of this prospectus) and assuming all future exchanges, other than the redemptions in connection with this offering, would occur one year after this offering. Under such scenario we would be required to pay the other parties to the tax receivable agreements 85% of such amount, or $ , over the 15-year period from the date of this offering. The actual amounts may materially differ from these hypothetical amounts, as potential future reductions in tax payments for us and tax receivable agreement payments by us will be calculated using the market value of our Class A common stock at the time of exchange and the prevailing tax rates applicable to us over the life of the tax receivable agreements and will be dependent on us generating sufficient future taxable income to realize the benefit. See “Our Structure and Reorganization—Tax Receivable Agreements”. Payments under the tax receivable agreements are not conditioned on our existing owners’ continued ownership of us.
The actual increase in tax basis, as well as the amount and timing of any payments under these agreements, will vary depending upon a number of factors, including the timing of exchanges by the holders of limited partnership units, the price of our Class A common stock or the value of our convertible preferred stock, as the case may be, at the time of the exchange, the extent to which such exchanges are taxable, the amount and timing of the taxable income we generate in the future and the tax rate then applicable as well as the portion of our payments under the tax receivable agreements constituting imputed interest or depreciable or amortizable basis.
Payments under the tax receivable agreements will be based on the tax reporting positions that we determine. Although we are not aware of any issue that would cause the IRS to challenge a tax basis increase or other tax attributes subject to the tax receivable agreements, we will not be reimbursed for any payments previously made under the tax receivable agreements if such basis increases or other benefits are subsequently disallowed. As a result, in certain circumstances, payments could be made under the tax receivable agreements in excess of the benefits that we actually realize in respect of the attributes to which the tax receivable agreements relate.
-40-
Table of Contents
In certain cases, payments under the tax receivable agreements to our existing owners may be accelerated and/or significantly exceed the actual benefits we realize in respect of the tax attributes subject to the tax receivable agreements.
The tax receivable agreements provide that (i) upon certain mergers, asset sales, other forms of business combinations or other changes of control, (ii) in the event that we materially breach any of our material obligations under the agreements, whether as a result of failure to make any payment within six months of when due (provided we have sufficient funds to make such payment), failure to honor any other material obligation required thereunder or by operation of law as a result of the rejection of the agreements in a bankruptcy or otherwise, or (iii) if, at any time, we elect an early termination of the agreements, our (or our successor’s) obligations under the agreements (with respect to all units, whether or not units have been exchanged or acquired before or after such transaction) would be based on certain assumptions, including that our taxable income for purposes of calculating amounts due under the agreements would be no less than certain minimum levels. Furthermore, in the event we elect to terminate the agreements (as described in clause (iii) above) or we materially breach a material obligation (as described in clause (ii) above), our obligations under the agreements will accelerate. As a result, (i) we could be required to make payments under the tax receivable agreements that are greater than or less than the specified percentage of the actual benefits we realize in respect of the tax attributes subject to the agreements and (ii) if we materially breach a material obligation under the agreements or if we elect to terminate the agreements early, we would be required to make an immediate payment equal to the present value of the anticipated future tax benefits, which payment may be made significantly in advance of the actual realization of such future benefits. In these situations, our obligations under the tax receivable agreements could have a substantial negative impact on our liquidity and could have the effect of delaying, deferring or preventing certain mergers, asset sales, other forms of business combinations or other changes of control. There can be no assurance that we will be able to finance our obligations under the tax receivable agreements. If we were to elect to terminate the tax receivable agreements immediately after this offering, based on an assumed price of $ per share of our Class A common stock (the midpoint of the price range set forth on the cover of this prospectus) and a discount rate equal to one-year LIBOR plus 100 basis points, we estimate that we would be required to pay $ in the aggregate under the tax receivable agreements. See “Our Structure and Reorganization—Tax Receivable Agreements”.
In the case of dissolution of Artisan Partners Holdings or a partial capital event, the rights of the holders of our Class A common stock to distributions will be subject to the H&F preference.
The holders of preferred units of Artisan Partners Holdings will be entitled to preferential distributions (in proportion to their respective number of units) in the amount described in the following paragraphs in the case of a partial capital event or upon dissolution of Artisan Partners Holdings. In the case of any preferential distributions on the preferred units, the company will be obligated to pay the holder of each share of convertible preferred stock a preferential distribution equal to the distribution made on a preferred unit, net of taxes, if any, payable by the company on (without duplication) (i) allocations of taxable income related to such distributions and (ii) the distributions themselves, in each case in respect of the preferred units held by us (using an assumed tax rate based on the maximum combined corporate federal, state and local income tax rate applicable to us). We refer to those preference rights as the H&F preference. See “Our Structure and Reorganization—Reorganization Transactions and Post-IPO Structure—Preferential Distributions to Holders of Preferred Units and Convertible Preferred Stock”.
Net proceeds from a partial capital event will be distributed 60% to the holders of the preferred units and 40% to the holders of all other partnership units (including the GP units held by us that correspond to shares of our Class A common stock) until the amount distributed on each preferred unit in respect of all partial capital events equals the aggregate preference amount of approximately $357 million divided by the number of preferred units outstanding immediately after the reorganization transactions. We refer to that amount as the per unit
-41-
Table of Contents
preference amount. A “partial capital event” means any sale, transfer, conveyance or disposition of assets of Artisan Partners Holdings for cash or other liquid consideration (other than in a transaction (i) in the ordinary course of business, (ii) that involves assets with a fair market value of less than or equal to 1% of the consolidated assets of Artisan Partners Holdings or (iii) that is part of or would result in a dissolution of Artisan Partners Holdings), or the incurrence of indebtedness by Artisan Partners Holdings or its subsidiaries, the principal purpose of which is to distribute the proceeds to the partners or equity holders thereof. A “partial capital event” shall not include any payment from proceeds of this offering or any indebtedness that is refinancing indebtedness of Artisan Partners Holdings outstanding on or prior to the closing date of this offering.
In the case of dissolution of Artisan Partners Holdings, the assets of Artisan Partners Holdings would be distributed (after satisfaction of its debts and liabilities and distribution of any accrued and undistributed profits) to the holders of preferred units, including us, until the amount distributed on each preferred unit, taking into account any preferential distributions previously made in connection with a partial capital event, equals the per unit preference amount.
The H&F preference will terminate if either (i) the average of the daily VWAP of our Class A common stock over any period of 60 consecutive trading days, beginning no earlier than (1) the 90th day after completion of the follow-on underwritten offering we plan to conduct as soon as possible after the first anniversary of this offering or (2) the 15-month anniversary of this offering, if we do not conduct the follow-on offering by that date, is at least $ divided by the then-applicable conversion rate, or (ii) Artisan Partners Holdings is required to and does make a payment in settlement of the partnership CVRs described under “Our Structure and Reorganization—Offering Transactions—Contingent Value Rights”.
We may be required to make a cash payment to the H&F holders in 2016, or earlier upon a change of control.
We may be required to make a cash payment to the holders of CVRs on July 11, 2016, or earlier upon a change of control, unless the average of the daily VWAP of our Class A common stock over any period of 60 consecutive trading days, beginning no earlier than (i) the 90th day after completion of the follow-on underwritten offering we plan to conduct as soon as possible after the first anniversary of this offering or (ii) the 15-month anniversary of this offering, if we do not conduct the follow-on offering by that date, is at least $ divided by the then-applicable conversion rate, in which case the CVRs will be terminated. The amount of any payment we are required to make will depend on the average of the daily VWAP of our Class A common stock over the 60 consecutive trading days prior to July 3, 2016 or the effective date of an earlier change of control, and any proceeds realized by the H&F holders with respect to their equity interests in us, subject to a maximum aggregate payment of $ million for all CVRs. See “Our Structure and Reorganization—Offering Transactions—Contingent Value Rights”.
The H&F preference and the CVRs may give rise to conflicts of interests for one of our directors.
The holders (other than us) of a majority of the preferred units and our convertible preferred stock, who will also receive CVRs, will be entitled to designate one director nominee as long as they directly or indirectly own shares of our capital stock constituting at least 5% of the number of shares of our common stock and our convertible preferred stock outstanding. Given the economic benefits of the H&F preference and the CVRs, there may be circumstances in which the interests of the holders of the preferred units and our convertible preferred stock, and thus the interests of their director representative, are in conflict with the interests of our Class A stockholders.
-42-
Table of Contents
If we were deemed an investment company under the 1940 Act as a result of our ownership of Artisan Partners Holdings, applicable restrictions could make it impractical for us to continue our business as contemplated and could have a material adverse effect on our business.
We do not believe that we are an “investment company” under the 1940 Act. Because we, as the sole general partner of Artisan Partners Holdings, control and operate Artisan Partners Holdings, we believe that our interest in Artisan Partners Holdings is not an “investment security” as that term is used in the 1940 Act. If we were to cease participation in the management of Artisan Partners Holdings, our interest in Artisan Partners Holdings could be deemed an “investment security” for purposes of the 1940 Act. A person may be an “investment company” if it owns investment securities having a value exceeding 40% of the value of its total assets (exclusive of U.S. government securities and cash items). Upon consummation of this offering, our only assets will be our equity investment in Artisan Partners Holdings and the partnership CVRs that we will hold. A determination that our equity investment was an investment security could cause us to be deemed an investment company under the 1940 Act and to become subject to the registration and other requirements of the 1940 Act. In addition, we do not believe that we are an investment company under Section 3(b)(1) of the 1940 Act because we are not primarily engaged in a business that causes us to fall within the definition of “investment company”. We and Artisan Partners Holdings intend to conduct our operations so that we will not be deemed an investment company. However, if we were to be deemed an investment company, restrictions imposed by the 1940 Act, including limitations on our capital structure and our ability to transact with affiliates, could make it impractical for us to continue our business as contemplated and could have a material adverse effect on our business.
Risks Related to this Offering
There is no existing market for our Class A common stock, and we do not know if one will develop, which may cause our Class A common stock to trade at a discount from its initial offering price and make it difficult to sell the shares you purchase.
Prior to this offering, there has not been a public market for our Class A common stock and we cannot predict the extent to which investor interest in us will lead to the development of an active trading market on the NYSE, or otherwise, or how liquid that market might become. If an active trading market does not develop, you may have difficulty selling your shares of Class A common stock at an attractive price, or at all. The initial public offering price for our Class A common stock will be determined by negotiations between us and the representatives of the underwriters and may not be indicative of prices that will prevail in the open market following this offering. Consequently, you may not be able to sell shares of our Class A common stock at prices equal to or greater than the price you paid in this offering and you may suffer a loss on your investment.
The market price and trading volume of our Class A common stock may be volatile, which could result in rapid and substantial losses for our stockholders.
Even if an active trading market develops, the market price of our Class A common stock may be highly volatile and could be subject to wide fluctuations. In addition, the trading volume of our Class A common stock may fluctuate and cause significant price variations to occur. If the market price of our Class A common stock declines significantly, you may be unable to sell your shares of Class A common stock at or above your purchase price, if at all. The market price of our Class A common stock may fluctuate or decline significantly in the future. Some of the factors that could negatively affect the price of our Class A common stock, or result in fluctuations in the price or trading volume of our Class A common stock, include:
| • | variations in our quarterly operating results; |
| • | failure to meet the market’s earnings expectations; |
| • | publication of research reports about us or the investment management industry, or the failure of securities analysts to cover our Class A common stock after this offering; |
| • | departures of any of our portfolio managers or members of our management team or additions or departures of other key personnel; |
-43-
Table of Contents
| • | adverse market reaction to any indebtedness we may incur or securities we may issue in the future; |
| • | actions by stockholders; |
| • | changes in market valuations of similar companies; |
| • | actual or anticipated poor performance in one or more of the investment strategies we offer; |
| • | changes or proposed changes in laws or regulations, or differing interpretations thereof, affecting our business, or enforcement of these laws and regulations, or announcements relating to these matters; |
| • | adverse publicity about the investment management industry generally, or particular scandals, specifically; |
| • | litigation and governmental investigations; and |
| • | general market and economic conditions. |
Future sales of our Class A common stock in the public market could lower our stock price, and any additional capital raised by us through the sale of equity or convertible securities may dilute your ownership in us.
The market price of our Class A common stock could decline as a result of sales of a large number of shares of our Class A common stock available for sale after completion of this offering, or the perception that such sales could occur. These sales, or the possibility that these sales may occur, also may make it more difficult for us to raise additional capital by selling equity securities in the future, at a time and price that we deem appropriate.
We will agree with the underwriters not to issue, sell, or otherwise dispose of or hedge any shares of our Class A common stock, subject to certain exceptions, for the 180-day period following the date of this prospectus, without the prior consent of Citigroup Global Markets Inc. and Goldman, Sachs & Co. Our officers, directors and certain of our other stockholders (other than public stockholders) will enter into similar lock-up agreements with the underwriters. Citigroup Global Markets Inc. and Goldman, Sachs & Co. may, at any time, release us and/or any of our officers, directors and/or stockholders from this lock-up agreement and allow us to sell shares of our Class A common stock within this 180-day period. See “Underwriting; Conflicts of Interest”. In addition, pursuant to the terms of an exchange agreement that we will enter into with the holders of limited partnership units of Artisan Partners Holdings, unless we grant a waiver, such limited partnership units will not be exchangeable for shares of our Class A common stock or our convertible preferred stock, which are convertible into shares of our Class A common stock, until the first anniversary of this offering. See “Our Structure and Reorganization—Offering Transactions—Exchange Agreement”.
As part of the reorganization transactions, we will enter into a resale and registration rights agreement with each holder of limited partnership units of Artisan Partners Holdings and each holder of our convertible preferred stock, pursuant to which the shares of our Class A common stock issued upon exchange of limited partnership units, and, if applicable, conversion of convertible preferred stock, will be eligible for resale. Such shares of Class A common stock may be transferred only in accordance with the terms and conditions of the resale and registration rights agreement, as described under “Our Structure and Reorganization—Offering Transactions—Resale and Registration Rights Agreement—Restrictions on Sale”.
In each one-year period following the first anniversary of this offering (which one-year period will begin on each anniversary of this offering), an employee-partner may sell (i) a number of vested shares of our Class A common stock representing up to 15% of the aggregate number of common units and shares of Class A common stock received upon exchange of common units (in each case, whether vested or unvested) he or she held as of the first day of that period (as well as the number of shares such holder could have sold in any previous period or periods but did not sell in such period or periods) or, (ii) if greater, vested shares of our Class A common stock having a market value as of the time of sale of up to $250,000. AIC may sell a number of shares of Class A common stock representing up to 15% of its aggregate number of common units and shares of Class A common
-44-
Table of Contents
stock received upon exchange of common units in the one-year period following the first anniversary of the offering. There will be no limit on the number of shares of our Class A common stock AIC may sell after the later of (i) the termination of Mr. Ziegler’s employment (which is expected to occur approximately one year after this offering pursuant to his employment agreement) and (ii) the second anniversary of this offering.
Subject to underwriter cutbacks, the H&F holders and the holders of Class A common units of Artisan Partners Holdings will be entitled to sell any or all of their shares of Class A common stock in a follow-on underwritten offering we plan to conduct as soon as possible after the first anniversary of this offering. Following (i) the 15-month anniversary of this offering or (ii) the expiration of any lock-up period in connection with the follow-on offering, if completed prior to such 15-month anniversary, they may sell shares in any manner of sale permitted under the securities laws. In addition, after the same applicable time period, the H&F holders and AIC will each have demand registration rights, subject to certain restrictions and conditions. See “Our Structure and Reorganization—Offering Transactions—Resale and Registration Rights Agreement—Restrictions on Sale” for a description of the resale and registration rights agreement we will enter into with the current limited partners as part of the reorganization transactions and additional details relating to restrictions on transfer.
After this offering, we intend initially to register shares of our Class A common stock for issuance pursuant to our 2013 Omnibus Incentive Compensation Plan and 2013 Non-Employee Director Plan that we are adopting in connection with this offering. We may increase the number of shares registered for this purpose from time to time. Once we register these shares, they will be able to be sold in the public market upon issuance.
We cannot predict the size of future issuances of our Class A common stock or the effect, if any, that future issuances and sales of shares of our Class A common stock may have on the market price of our Class A common stock. Sales or distributions of substantial amounts of our Class A common stock (including shares issued in connection with an acquisition), or the perception that such sales could occur, may cause the market price of our Class A common stock to decline. See “Shares Eligible for Future Sale”.
The disparity in the voting rights among the classes of our capital stock may have a potential adverse effect on the price of our Class A common stock.
Each share of our Class A common stock, Class C common stock and convertible preferred stock will entitle its holder to one vote on all matters to be voted on by stockholders generally, while each share of our Class B common stock will entitle its holder to five votes on all matters to be voted on by stockholders generally for so long as the holders of our Class B common stock collectively hold at least 20% of the number of outstanding shares of our common stock and our convertible preferred stock. The difference in voting rights could adversely affect the value of our Class A common stock by, for example, delaying or deferring a change of control or if investors view, or any potential future purchaser of our company views, the superior voting rights of the Class B common stock to have value.
You will suffer immediate and substantial dilution and may experience additional dilution in the future.
We expect that the initial public offering price per share of our Class A common stock will be substantially higher than the pro forma net tangible book value per share of our Class A common stock immediately after this offering, and after giving effect to the exchange of all outstanding limited partnership units of Artisan Partners Holdings for shares of our Class A common stock or convertible preferred stock, as applicable, and the conversion of all shares of convertible preferred stock into shares of our Class A common stock. As a result, you will pay a price per share that substantially exceeds the per share book value of our assets after subtracting our liabilities. At an offering price of $ (the midpoint of the range set forth on the cover of this prospectus), you will incur immediate and substantial dilution in an amount of $ per share of our Class A common stock. See “Dilution”. In addition, you will experience further dilution upon the issuance of restricted common units or restricted shares of our Class A common stock, or upon the grant of options to purchase common units or shares of our Class A common stock, in each case under our 2013 Omnibus Incentive Compensation Plan or 2013 Non-Employee Director Plan.
-45-
Table of Contents
Anti-takeover provisions in our restated certificate of incorporation and amended and restated bylaws and in the Delaware General Corporation Law could discourage a change of control that our stockholders may favor, which could negatively affect the market price of our Class A common stock.
Provisions in our restated certificate of incorporation, amended and restated bylaws and in the Delaware General Corporation Law, or the DGCL, may make it more difficult and expensive for a third party to acquire control of us even if a change of control would be beneficial to the interests of our stockholders. For example, our restated certificate of incorporation, which will be in effect at the time this offering is consummated, will authorize the issuance of preferred stock that could be issued by our board of directors to thwart a takeover attempt. The market price of our Class A common stock could be adversely affected to the extent that the provisions of our restated certificate of incorporation and amended and restated bylaws discourage potential takeover attempts that our stockholders may favor. See “Description of Capital Stock” for additional information on the anti-takeover measures applicable to us.
If securities or industry analysts do not publish research or publish inaccurate or unfavorable research about our business, our stock price and trading volume could decline.
The trading market for our Class A common stock will depend in part on the research and reports that securities or industry analysts publish about us or our business. We do not currently have and may never obtain research coverage by securities and industry analysts. If no securities or industry analysts commence coverage of our company, the trading price for our Class A common stock would be negatively impacted. If we obtain securities or industry analyst coverage and if one or more of the analysts who covers us downgrades our stock or publishes inaccurate or unfavorable research about our business, our stock price would likely decline. If one or more of these analysts ceases coverage of us or fails to publish reports on us regularly, demand for our stock could decrease, which could cause our stock price and trading volume to decline.
-46-
Table of Contents
CAUTIONARY NOTE REGARDING FORWARD-LOOKING STATEMENTS
We have made statements under the captions “Prospectus Summary”, “Risk Factors”, “Management’s Discussion and Analysis of Financial Condition and Results of Operations”, “Business” and in other sections of this prospectus that are forward-looking statements. In some cases, you can identify these statements by forward-looking words such as “may”, “might”, “will”, “should”, “expects”, “intends”, “plans”, “anticipates”, “believes”, “estimates”, “predicts”, “potential” or “continue”, the negative of these terms and other comparable terminology. These forward-looking statements, which are subject to risks, uncertainties and assumptions, may include projections of our future financial performance, our anticipated growth strategies, descriptions of new business initiatives and anticipated trends in our business. These statements are only predictions based on our current expectations and projections about future events. There are important factors that could cause our actual results, level of activity, performance or achievements to differ materially from the results, level of activity, performance or achievements expressed or implied by the forward-looking statements, including those factors discussed under the caption entitled “Risk Factors”.
Although we believe the expectations reflected in the forward-looking statements are reasonable, we cannot guarantee future results, level of activity, performance or achievements. We are under no duty to update any of these forward-looking statements after the date of this prospectus to conform our prior statements to actual results or revised expectations.
Forward-looking statements include, but are not limited to, statements about:
| • | our anticipated future results of operations and operating cash flows; |
| • | our business strategies and investment policies; |
| • | our intention to pay quarterly dividends; |
| • | our financing plans; |
| • | our competitive position and the effects of competition on our business; |
| • | potential growth opportunities available to us; |
| • | the recruitment and retention of our employees; |
| • | our expected levels of compensation of our employees and the impact of compensation on our ability to attract and retain employees; |
| • | our potential operating performance and efficiency; |
| • | our expected tax rate; |
| • | our expectation with respect to the economy, capital markets, the market for asset management services and other industry trends; |
| • | the benefits to our business resulting from the effects of the reorganization; |
| • | our belief as to the adequacy of our facilities; and |
| • | the impact of future legislation and regulation, and changes in existing legislation and regulation, on our business. |
-47-
Table of Contents
OUR STRUCTURE AND REORGANIZATION
Structure Prior to the Reorganization Transactions
The diagram below depicts the organizational structure of our subsidiary, Artisan Partners Holdings, before giving effect to this offering and the related reorganization transactions.
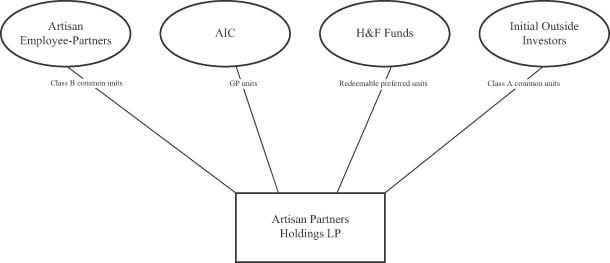
Prior to the reorganization transactions described below, the equity interests in Artisan Partners Holdings consisted of GP units, Class A common units, Class B common units and redeemable preferred units. AIC, an entity controlled by Andrew A. Ziegler and Carlene M. Ziegler, and through which Mr. Ziegler and Mrs. Ziegler maintain their ownership interests in Artisan Partners Holdings, held the GP units. Thirty-three investors (our initial outside investors and their successors) held the Class A common units, including current and former members of H&F, a private equity investment firm, investing in their individual capacities, and a venture capital fund managed by Sutter Hill Ventures, a venture capital firm, and related individuals. Fifty-five Artisan employees held the Class B common units. Private investment funds controlled in each case by a sole general partner, each of which is, in turn, controlled by H&F, held the preferred units. Artisan Partners Holdings conducts its business primarily through its wholly-owned subsidiary, Artisan Partners Limited Partnership, our principal operating subsidiary.
Under the terms of Artisan Partners Holdings’ limited partnership agreement in effect prior to the reorganization transactions, the preferred units entitled their holders to preferential distributions upon the occurrence of certain events and a right to put the preferred units to the partnership on July 3, 2016 under certain circumstances. The preferred units of Artisan Partners Holdings, as well as our convertible preferred stock and the CVRs, each as described below, are collectively intended to provide the H&F holders with economic and voting rights following the reorganization transactions similar (although not identical) to the economic and voting rights they possessed prior to the reorganization.
Reorganization Transactions and Post-IPO Structure
The diagram below depicts our organizational structure immediately after the consummation of the reorganization transactions and this offering. Immediately prior to the consummation of this offering, the limited partnership agreement of Artisan Partners Holdings will be amended and restated to reclassify the existing GP units as Class D common units of Artisan Partners Holdings and appoint Artisan Partners Asset Management as
-48-
Table of Contents
the sole general partner. The limited partners of Artisan Partners Holdings will have the right to exchange their respective units, subject to certain restrictions, for shares of our capital stock as described under “—Artisan Partners Holdings” and “—Offering Transactions—Exchange Agreement”. The reorganization transactions are designed to create a capital structure that preserves our ability to conduct our business through Artisan Partners Holdings (a partnership), while permitting us to raise additional capital and provide access to liquidity through a public company. Multiple classes of securities at the public company level are necessary to achieve these objectives and maintain a governance structure that resembles the current structure of Artisan Partners Holdings.
| (1) | Each of our employee-partners and AIC will enter into a stockholders agreement with respect to all shares of our common stock they hold at such time or may acquire from us in the future, pursuant to which they will grant an irrevocable voting proxy to a stockholders committee, as described under “Our Structure and Reorganization—Stockholders Agreement”. |
| (2) | Each share of Class B common stock will initially entitle its holder to five votes per share. The stockholders committee will hold an irrevocable proxy to vote the shares of common stock of Artisan Partners Asset Management held by the Class B common stockholders until the stockholders agreement terminates. |
| (3) | Includes restricted shares of our Class A common stock, representing % of the voting rights in Artisan Partners Asset Management, that we intend to grant to our non-employee directors in connection with this offering. |
| (4) | Economic rights of the Class A common stock, the common units and the GP units are subject to the H&F preference as described below under “ —Reorganization Transactions—Preferential Distributions to Holders of Preferred Units and Convertible Preferred Stock”. |
| (5) | We will be obligated to vote the preferred units we hold at the direction of our convertible preferred stockholders as described under “Our Structure and Reorganization—Offering Transactions—Amended and Restated Limited Partnership Agreement of Artisan Partners Holdings”. |
| (6) | Each class of common units generally will entitle its holders to the same economic and voting rights in Artisan Partners Holdings as each other class of common units, as described under “—Offering |
-49-
Table of Contents
| Transactions—Amended and Restated Limited Partnership Agreement of Artisan Partners Holdings—Economic Rights of Partners” and “—Offering Transactions—Amended and Restated Limited Partnership Agreement of Artisan Partners Holdings—Voting and Class Approval Rights”, respectively. |
| (7) | The preferred units of Artisan Partners Holdings, as well as our convertible preferred stock and the CVRs, each as described below, are collectively intended to provide the H&F holders with economic and voting rights following the reorganization transactions similar (although not identical) to the economic and voting rights they possessed prior to the reorganization. The CVRs may require us to make a cash payment to the holders thereof on July 11, 2016, or, if earlier, five business days after the effective date of a change of control of Artisan, unless the average of the daily VWAP of our Class A common stock over any period of 60 consecutive trading days, beginning no earlier than (i) the 90th day after completion of the follow-on underwritten offering we plan to conduct as soon as possible after the first anniversary of this offering or (ii) the 15-month anniversary of this offering, if we do not conduct the follow-on offering by that date, is at least $ divided by the conversion rate, in which case the CVRs will be terminated. The CVRs confer no voting rights or other rights of stockholders. Artisan Partners Asset Management will always hold one partnership CVR for each outstanding CVR of Artisan Partners Asset Management. See “—Offering Transactions—Contingent Value Rights” for additional information about the CVRs. |
Following the transactions described below, we will conduct all of our business activities through our operating subsidiaries, which are wholly owned by our direct subsidiary Artisan Partners Holdings (an intermediate holding company of which we will be the general partner), with the exception of Artisan Partners UK LLP. Artisan Partners UK LLP is controlled by its founder member, Artisan Partners Limited, a wholly owned subsidiary of Artisan Partners Holdings. The only other member of Artisan Partners UK LLP is one of our portfolio managers who, as a member, has the right to receive regular payments from Artisan Partners UK LLP but does not share in the profits beyond those regular payments, and does not control Artisan Partners UK LLP. Based on the ownership that will exist immediately after giving effect to the transactions described below, net profits and net losses of Artisan Partners Holdings will be allocated, and distributions of profits will be made (subject to the H&F preference, as described under “Our Structure and Reorganization—Reorganization Transactions—Preferential Distributions to Holders of Preferred Units and Convertible Preferred Stock”), approximately % to us and % in the aggregate to Artisan Partners Holdings’ limited partners (or % and %, respectively, if the underwriters exercise their option to purchase additional shares in full).
Artisan Partners Asset Management
We were incorporated in Wisconsin on March 21, 2011 and converted to a Delaware corporation on October 29, 2012. Immediately prior to the consummation of this offering, we will amend and restate our certificate of incorporation to authorize three classes of common stock, Class A common stock, Class B common stock and Class C common stock, as well as preferred stock, including a series of convertible preferred stock. Our common stock and convertible preferred stock will have the terms described below and, in more detail, under “Description of Capital Stock”:
Class A Common Stock. We will issue shares of our Class A common stock to the public in this offering. In addition, we intend to grant equity awards of or with respect to shares of our Class A common stock to our non-employee directors in connection with this offering. Each share of Class A common stock will entitle its holder to one vote and to economic rights (including rights to dividends or distributions upon liquidation), subject to the H&F preference. See “—Preferential Distributions to Holders of Preferred Units and Convertible Preferred Stock”. Following on the first anniversary of this offering (i) subject to certain restrictions, each common unit held by a limited partner of Artisan Partners Holdings will be exchangeable for one share of our Class A common stock and each preferred unit held by a limited partner of Artisan Partners Holdings will be exchangeable for shares of our Class A common stock at the conversion rate and (ii) each share of our convertible preferred stock will be convertible into our Class A common stock at the conversion rate.
Class B Common Stock. Immediately prior to the consummation of this offering, we will issue shares of our Class B common stock to our employee-partners, in amounts equal to the number of Class B common units that
-50-
Table of Contents
such employee-partners hold at such time. Each share of our Class B common stock will initially entitle its holder to five votes per share but will have no economic rights in Artisan (including no rights to dividends or distributions upon liquidation). If and when the holders of our Class B common stock collectively hold less than 20% of the aggregate number of outstanding shares of our common stock and our convertible preferred stock, each share of Class B common stock will entitle its holder to only one vote per share. A share of Class B common stock cannot be transferred except in connection with a transfer of the corresponding common unit.
Each time the holder of a Class B common unit exchanges such a unit for a share of our Class A common stock, we will automatically cancel a share of our Class B common stock held by such exchanging holder. Employee-partners who exchange Class B common units that are unvested will receive restricted shares of our Class A common stock that are subject to the same vesting requirements that applied to the common units exchanged.
Upon the termination of the employment of an employee-partner, such employee-partner’s Class B common stock and the associated Class B common units will automatically be exchanged for Class C common stock and Class E common units, respectively, and we will automatically cancel each share of the employee-partner’s Class B common stock.
Class C Common Stock. Immediately prior to the consummation of this offering, we will issue shares of our Class C common stock to AIC, our initial outside investors and certain H&F holders that hold preferred units of Artisan Partners Holdings in amounts equal to the number of Class D common units, Class A common units and preferred units, respectively, that such holders hold at such time. Each share of Class C common stock will entitle its holder to one vote per share but will have no economic rights in Artisan (including no rights to dividends or distributions upon liquidation). A share of Class C common stock cannot be transferred except in connection with a transfer of the corresponding common unit or preferred unit.
Each time the holder of a Class D common unit, Class A common unit or preferred unit exchanges such a unit for a share of our Class A common stock or convertible preferred stock, as applicable, we will automatically cancel a share of our Class C common stock held by such exchanging holder.
Convertible Preferred Stock. One of the H&F private investment funds that is an investor in Artisan Partners Holdings holds its preferred units through a corporation, which we refer to as H&F Corp. Immediately prior to the consummation of this offering, H&F Corp will merge with and into us and the H&F private investment fund that was the sole stockholder of H&F Corp will receive, as consideration, shares of our convertible preferred stock, CVRs of ours and the right to receive an amount of cash equal to H&F Corp’s share of the distribution of Artisan Partners Holdings’ retained profits to its pre-offering partners. We will be the surviving corporation in the merger, which we refer to as the H&F Corp Merger. Each share of convertible preferred stock will entitle its holder to one vote. In the case of distributions on the preferred units of Artisan Partners Holdings, each share of convertible preferred stock will entitle its holder to preferential distributions as described below under “—Preferential Distributions to Holders of Preferred Units and Convertible Preferred Stock”.
Following the first anniversary of this offering (unless we grant a waiver prior to that time with the consent of the holders of a majority of the convertible preferred stock), shares of our convertible preferred stock will be convertible at the election of the holder into shares of our Class A common stock at the conversion rate, which will be one-for-one subject to adjustment to reflect the payment of preferential distributions made to the holders of our convertible preferred stock. See “—Preferential Distributions to Holders of Preferred Units and Convertible Preferred Stock—Convertible Preferred Stock Conversion Rate”. When the holders of our convertible preferred stock are no longer entitled to preferential distributions, all shares of convertible preferred stock will automatically convert into shares of our Class A common stock at the conversion rate plus cash in lieu of fractional shares (after aggregating all shares of our Class A common stock that would otherwise be received by such holder). Upon the conversion of a share of convertible preferred stock into a share of Class A common stock or the exchange of a preferred unit for a share of a Class A common stock, Artisan Partners Holdings will issue to us a number of GP units equal to the number of shares of Class A common stock issued upon such conversion or exchange.
-51-
Table of Contents
Shares of convertible preferred stock cannot be transferred except to one or more affiliates of the H&F holders or in distributions by the original H&F holders to their partners or stockholders, as applicable, at any time after the expiration of any lock-up period in connection with the follow-on underwritten offering we plan to conduct as soon as possible after the first anniversary of this offering or on the 15-month anniversary of this offering, if we do not conduct the follow-on offering by that date.
Stockholders Agreement. Each of our employee-partners and AIC will enter into a stockholders agreement pursuant to which they will grant an irrevocable voting proxy with respect to all shares of our common stock they hold at such time or may acquire from us in the future to a stockholders committee consisting initially of (i) a designee of AIC, who initially will be Andrew A. Ziegler, our Executive Chairman, (ii) Eric R. Colson, our President and Chief Executive Officer, and (iii) James C. Kieffer, a portfolio manager of our U.S. Value strategies. The members of the stockholders committee other than the AIC designee must be Artisan employees. At the close of the reorganization, the only shares of our capital stock subject to the stockholders agreement will be the shares of our common stock held by our employee-partners and AIC. Thereafter, any shares of our common stock that we issue to our employee-partners or other employees will be subject to the stockholders agreement so long as the agreement has not been terminated.
For so long as the parties whose shares are subject to the stockholders agreement hold at least a majority of the combined voting power of our capital stock, the stockholders committee will be able to elect all of the members of our board of directors (subject to the obligation of the stockholders committee under the terms of the stockholders agreement to vote in support of certain nominees) and thereby control our management and affairs. Because each share of our Class B common stock will initially entitle its holder to five votes, there may be situations where the stockholders committee controls our management and affairs even if the parties whose shares are subject to the stockholders agreement hold less than a majority of the number of outstanding shares of our capital stock. We describe the terms of the stockholders agreement in more detail under “Our Structure and Reorganization—Stockholders Agreement”. Initially, the AIC designee, initially Mr. Ziegler, will have the sole right, in consultation with the other members of the stockholders committee, to determine how to vote all shares subject to the stockholders agreement.
Artisan Partners Holdings
Upon consummation of this offering, we will conduct all of our business activities through our direct subsidiary, Artisan Partners Holdings, which wholly owns Artisan Partners Limited Partnership, our principal operating subsidiary.
Immediately prior to the consummation of this offering, the limited partnership agreement of Artisan Partners Holdings will be amended and restated to reclassify the GP units of AIC, the current general partner, as Class D common units of Artisan Partners Holdings and appoint Artisan Partners Asset Management as the sole general partner. The amended and restated limited partnership agreement will also provide for Class E common units. Upon the termination of an employee-partner’s employment, the former employee-partner’s vested Class B common units will automatically be exchanged for Class E common units, the former employee-partner’s Class B common stock will be cancelled, and we will issue the former employee-partner a number of shares of our Class C common stock equal to the number of Class E common units held by the former employee-partner. Each Class E common unit (together with the corresponding share of Class C common stock) will be exchangeable for a share of Class A common stock after the first anniversary of this offering. Holders of Class E common units will not have any voting rights with respect to Artisan Partners Holdings.
Holders of Class A common units, Class B common units, Class D common units and preferred units will have certain voting rights as described under “—Offering Transactions—Amended and Restated Limited Partnership Agreement of Artisan Partners Holdings—Voting and Class Approval Rights”. Except as described below under “—Preferential Distributions to Holders of Preferred Units and Convertible Preferred Stock” and “Offering Transactions—Amended and Restated Limited Partnership Agreement of Artisan Partners Holdings—Economic Rights of Partners”, net profits and net losses and distributions of profits of Artisan Partners Holdings
-52-
Table of Contents
generally will be allocated and made to its partners pro rata in accordance with the number of partnership units of Artisan Partners Holdings they hold. Distributions to partners upon a liquidation of Artisan Partners Holdings will be made to its partners pro rata in proportion to their capital account balances, subject to the claims of creditors, the rights of all partners to their proportionate shares of undistributed profits and the H&F preference. The balance of each partner’s capital account as a percentage of the aggregate capital account balances of all partners will generally correspond to that partner’s respective percentage interest in the profits of Artisan Partners Holdings, although initially some limited partners will have a lower (and we, as the general partner, and certain limited partners will each have a correspondingly higher) capital account balance. As described below under “—Offering Transactions—Amended and Restated Limited Partnership Agreement of Artisan Partners Holdings—Economic Rights of Partners”, the pro rata portion of deemed gain and deemed losses on revaluation events will be allocated to limited partnership units until the respective capital account balances (disregarding accrued and undistributed profits for these purposes) of each partner are pro rata to their respective percentage interest in the profits of Artisan Partners Holdings.
Upon the consummation of this offering, Artisan Partners Asset Management will contribute all of the net proceeds it receives from this offering to Artisan Partners Holdings, and Artisan Partners Holdings will issue to Artisan Partners Asset Management a number of GP units equal to the number of shares of Class A common stock that Artisan Partners Asset Management has issued in this offering. As a result of the reorganization transactions described above, the consummation of this offering and the application of a portion of the net proceeds therefrom to redeem Class A common units:
| • | As the sole general partner of Artisan Partners Holdings, Artisan Partners Asset Management will hold (i) GP units representing approximately % of the economic rights of Artisan Partners Holdings (or GP units representing approximately % if the underwriters exercise in full their option to purchase additional shares), subject to the H&F preference, and (ii) sole control of its management (subject to certain voting rights of the limited partners as described under “—Offering Transactions —Amended and Restated Limited Partnership Agreement of Artisan Partners Holdings—Voting and Class Approval Rights”). As a result, we will consolidate the financial results of Artisan Partners Holdings with our results and will record a noncontrolling interest on our balance sheet for the economic interest in it held by all the limited partners who have not exchanged their limited partnership units for shares of our Class A common stock or convertible preferred stock, as applicable. |
| • | Artisan Partners Asset Management also will hold preferred units of Artisan Partners Holdings received by it in the H&F Corp Merger representing approximately % of the economic rights of Artisan Partners Holdings (or approximately % if the underwriters exercise in full their option to purchase additional shares). |
| • | The holders of the Class A, Class B and Class D common units and the holders of the preferred units of Artisan Partners Holdings will hold , , and units, respectively, representing approximately %, %, % and %, respectively, of the economic rights of Artisan Partners Holdings (or %, %, % and %, respectively, if the underwriters exercise in full their option to purchase additional shares), subject (i) to the bonus reallocation adjustments described under “Offering Transactions—Amended and Restated Limited Partnership Agreement of Artisan Partners Holdings—Economic Rights of Partners” and (ii), in the case of the holders of the common units, to the H&F preference. |
| • | Through their holdings of our Class A common stock, public stockholders will collectively have approximately % of the voting power in Artisan Partners Asset Management (or approximately % if the underwriters exercise in full their option to purchase additional shares). |
| • | AIC and our employee-partners will collectively have approximately % of the voting power in Artisan Partners Asset Management (or approximately % if the underwriters exercise in full their option to purchase additional shares), of which: |
| • | % (or approximately % if the underwriters exercise in full their option to purchase additional shares) will be held by AIC through its holdings of our Class C common stock, and |
-53-
Table of Contents
| • | % (or approximately % if the underwriters exercise in full their option to purchase additional shares) will be held by our employee-partners through their holdings of our Class B common stock. |
| • | Through their holdings of our Class C common stock, the initial outside investors will have approximately % of the voting power in Artisan Partners Asset Management (or approximately % if the underwriters exercise in full their option to purchase additional shares). |
| • | Through their holdings of our Class C common stock and our convertible preferred stock received in the H&F Corp Merger, the H&F holders will have approximately % of the voting power in Artisan Partners Asset Management (or approximately % if the underwriters exercise in full their option to purchase additional shares). |
| • | Through their holdings of restricted Class A common stock that we intend to grant in connection with this offering, our non-employee directors will collectively have approximately % of the voting power in Artisan Partners Asset Management (or approximately % if the underwriters exercise in full their option to purchase additional shares). Two of our non-employee directors, Messrs. Barger and Coxe, will also beneficially own shares of our Class C common stock collectively representing approximately % of the voting power in Artisan Partners Asset Management (or approximately % if the underwriters exercise in full their option to purchase additional shares). Another of our non-employee directors, Mr. Thorpe, is a managing director of H&F. |
The number of outstanding limited partnership units of Artisan Partners Holdings (not including the preferred units we will hold upon the consummation of the H&F Corp Merger and any future exchange of preferred units for shares of our convertible preferred stock) will equal the aggregate number of outstanding shares of our Class B common stock and Class C common stock. Following the first anniversary of this offering, subject to certain restrictions, holders of Artisan Partners Holdings units (other than us) and certain permitted transferees will have the right to exchange common units (together with an equal number of shares of Class B or Class C common stock, as applicable) for shares of our Class A common stock on a one-for-one basis and to exchange preferred units (together with an equal number of shares of Class C common stock) either for shares of our convertible preferred stock on a one-for-one basis or for shares of our Class A common stock at the conversion rate plus cash in lieu of fractional shares as described in “Our Structure and Reorganization—Reorganization Transactions and Post-IPO Structure—Preferential Distributions to Holders of Preferred Units and Convertible Preferred Stock—Convertible Preferred Stock Conversion Rate”. From and after the automatic conversion of our convertible preferred stock into Class A common stock, each preferred unit will be exchangeable for a number of shares of our Class A common stock equal to the conversion rate. A limited partnership unit cannot be exchanged for a share of our Class A common stock or convertible preferred stock without a share of our Class B common stock or Class C common stock, as applicable, being delivered together at the time of exchange, at which time we will automatically cancel such share of Class B common stock or Class C common stock.
Under the terms of its amended and restated limited partnership agreement, Artisan Partners Holdings will be obligated to distribute to us and its other partners cash payments for the purposes of funding tax obligations in respect of the taxable income and net capital gain that is allocated to us and them, respectively, as partners of Artisan Partners Holdings. The amounts available to Artisan Partners Holdings for distributions to us for the payment of dividends will be determined after Artisan Partners Holdings has made distributions for purposes of funding any such tax obligations. The determination to pay dividends, if any, to our Class A stockholders out of any distributions that we receive from Artisan Partners Holdings with respect to the GP units we will hold will be made by our board of directors. If Artisan Partners Holdings makes such distributions, the holders of its limited partnership units will be entitled to receive equivalent distributions on a pro rata basis. Distributions on the GP units we will hold and dividends, if any, on our Class A common stock are both subject to the H&F preference, as described below under “—Preferential Distributions to Holders of Preferred Units and Convertible Preferred Stock”. Following this offering, we intend to pay quarterly cash dividends, as well as one special annual dividend, each as described under “Dividend Policy and Dividends”. Although we intend to pay regular dividends, our Class A stockholders may not necessarily receive dividend distributions relating to our pro rata share of the income earned by Artisan Partners Holdings, even if Artisan Partners Holdings makes such distributions to us. See “Dividend Policy and Dividends”.
-54-
Table of Contents
Preferential Distributions to Holders of Preferred Units and Convertible Preferred Stock
In accordance with its amended and restated limited partnership agreement, taxable income and loss and distributions of profits of Artisan Partners Holdings will be allocated and made to its partners pro rata in accordance with the number of partnership units of Artisan Partners Holdings they hold, except in the case of (i) a partial capital event, (ii) dissolution of Artisan Partners Holdings or (iii) with respect only to the limited partners of Artisan Partners Holdings, the bonus reallocation adjustments as described under “Offering Transactions—Amended and Restated Limited Partnership Agreement of Artisan Partners Holdings—Economic Rights of Partners”. We refer in this prospectus to the preferential distributions in the case of partial capital events or dissolution of Artisan Partners Holdings, together with the preference rights of the convertible preferred stock, as the H&F preference. The H&F preference will terminate in accordance with the conditions described below under “—Termination of H&F Preference”.
Partial Capital Events. A “partial capital event” means any sale, transfer, conveyance or disposition of assets of Artisan Partners Holdings for cash or other liquid consideration (other than in a transaction (i) in the ordinary course of business, (ii) that involves assets with a fair market value of less than or equal to 1% of the consolidated assets of Artisan Partners Holdings or (iii) that is part of or would result in a dissolution of Artisan Partners Holdings), or the incurrence of indebtedness by Artisan Partners Holdings or its subsidiaries, the principal purpose of which is to distribute the proceeds to the partners or equity holders thereof. A “partial capital event” shall not include any payment from proceeds of this offering or any indebtedness that is refinancing indebtedness of Artisan Partners Holdings outstanding on or prior to the closing date of this offering.
The net proceeds of any partial capital event will be distributed:
| • | first, 60% to the holders of the preferred units and 40% to the holders of all of the classes of common units and GP units, in each case in proportion to their respective capital account balances, until the amount distributed on each preferred unit in respect of all partial capital events equals $357,194,316 divided by the number of preferred units outstanding immediately after the reorganization transactions, which we refer to as the per unit preference amount; |
| • | second, in the event that any amounts were ever distributed in accordance with the preceding bullet point, 100% to the holders of all of the classes of common units and GP units, in each case in proportion to their respective capital account balances, until the cumulative amount distributed on each such unit in respect of all partial capital events equals the cumulative amount the holders of all of the classes of common units and GP units would have received from all partial capital event distributions had all such distributions been made in proportion to the respective number of partnership units held by all partners; and |
| • | third, to the holders of all classes of partnership units (including GP units) in proportion to their respective capital account balances. |
Notwithstanding the foregoing, holders of the preferred units may decline all or any portion of a preferential distribution of the net proceeds of a partial capital event.
Dissolution. The assets of Artisan Partners Holdings will be distributed upon its dissolution, after satisfaction of its debts and liabilities:
| • | first, in the event Artisan Partners Holdings has accrued and undistributed profits, to the holders of all classes of partnership units (including GP units), in each case in proportion to each partner’s respective number of units at the time accrued and undistributed profits were earned or accrued, until Artisan Partners Holdings has distributed all such accrued and undistributed profits; |
| • | second, to the holders of the preferred units in proportion to their respective capital account balances, until the amount distributed on each preferred unit (including any preferential distributions previously made in connection with any partial capital event) equals the per unit preference amount; |
-55-
Table of Contents
| • | third, to the holders of all of the classes of common units and GP units, in each case in proportion to their respective capital account balances, until the cumulative amount distributed on each such unit (including distributions in respect of partial capital events) equals the cumulative amount the holders of all of the classes of common units and GP units would have received from all partial capital event and dissolution distributions had all such distributions been made in proportion to the respective number of partnership units held by all partners; and |
| • | fourth, to the holders of all of the classes of partnership units (including the GP units) in proportion to their respective capital account balances. |
Distributions on Convertible Preferred Stock. Each share of convertible preferred stock will entitle its holder to dividends equal to the amount distributed (whether in a preferential distribution or otherwise) by Artisan Partners Holdings on each preferred unit, net of taxes, if any, payable by us on (without duplication) (i) allocations of taxable income related to such distributions and (ii) the distributions themselves, in each case in respect of the preferred units held by us (using an assumed tax rate based on the maximum combined corporate federal, state and local income tax rate applicable to us). Until such dividends are declared and paid to holders of convertible preferred stock, we may not declare and pay a dividend on any other class of our capital stock.
Termination of H&F Preference. The H&F preference will terminate if either (i) the average of the daily VWAP of our Class A common stock over any period of 60 consecutive trading days, beginning no earlier than (1) the 90th day after completion of the follow-on underwritten offering we plan to conduct as soon as possible after the first anniversary of this offering or (2) the 15-month anniversary of this offering, if we do not conduct the follow-on offering by that date, is at least $ divided by the then-applicable conversion rate, or (ii) Artisan Partners Holdings is required to and does make a payment in settlement of the partnership CVRs described below under “—Offering Transactions—Contingent Value Rights”.
Upon termination of the H&F preference, distributions in the case of a partial capital event or dissolution of Artisan Partners Holdings will be made solely to the holders of partnership units (including GP units) other than the preferred units, in each case in proportion to their respective capital account balances, until the cumulative amount distributed per unit equals the amount the holders of partnership units (including GP units) would have received from all partial capital event and dissolution distributions had all such distributions been made in proportion to the respective number of partnership units held by all partners. After that, all holders of the partnership units, including the holders of the preferred units, will be entitled to distributions in proportion to their respective capital account balances, and Artisan Partners Holdings will no longer be required to make any distributions in connection with a partial capital event. The balance of each partner’s capital account as a percentage of the aggregate capital account balances of all partners will generally correspond to that partner’s respective percentage interest in the profits of Artisan Partners Holdings, although initially some limited partners will have a lower (and we, as the general partner, and certain limited partners will each have a correspondingly higher) capital account balance. As described below under “—Offering Transactions—Amended and Restated Limited Partnership Agreement of Artisan Partners Holdings—Economic Rights of Partners”, the pro rata portion of deemed gain and deemed losses on revaluation events will be allocated to limited partnership units until the respective capital account balances (disregarding accrued and undistributed profits for these purposes) of each partner are pro rata to their respective percentage interest in the profits of Artisan Partners Holdings.
Convertible Preferred Stock Conversion Rate. Following the first anniversary of this offering, at the election of the holder, each share of our convertible preferred stock will be convertible into a number of shares of our Class A common stock equal to the conversion rate (as described below). When the holders of preferred units of Artisan Partners Holdings are no longer entitled to preferential distributions as described above in “—Preferential Distributions to Holders of Preferred Units and Convertible Preferred Stock”, all shares of
-56-
Table of Contents
convertible preferred stock will automatically convert into shares of our Class A common stock at the then-applicable conversion rate plus cash in lieu of fractional shares (after aggregating all shares of our Class A common stock that would otherwise be received by such holder). Upon the conversion of a share of convertible preferred stock into a share of Class A common stock, Artisan Partners Holdings will issue us a number of GP units equal to the number of shares of Class A common stock issued upon such conversion or exchange.
The conversion rate will equal the excess, if any, of (a) one over (b) a fraction equal to (x) the cumulative excess distributions per preferred unit (as described below) divided by (y) the average daily VWAP per share of our Class A common stock for the 60 consecutive trading days immediately preceding the conversion date. The cumulative excess distributions per preferred unit will equal the excess, if any, of (a) the cumulative amount of distributions upon partial capital events made per preferred unit over (b) the cumulative amount of distributions upon partial capital events made, on a per unit basis, to the holders of the classes of units other than the preferred units. The conversion rate will equal one when either (i) no partial capital events have occurred or (ii) when the amount distributed in respect of all partial capital events on a per unit basis equals the amount distributed per preferred unit in respect of all partial capital events.
Offering Transactions
Exchange Agreement
Immediately prior to the consummation of this offering, we will enter into an exchange agreement with the holders of limited partnership units of Artisan Partners Holdings. Following the first anniversary of this offering, subject to certain restrictions set forth in the exchange agreement (including those intended to ensure that Artisan Partners Holdings is not treated as a “publicly traded partnership” for U.S. federal income tax purposes), holders of Artisan Partners Holdings units (other than us) and certain permitted transferees will have the right to exchange common units (together with an equal number of shares of Class B or Class C common stock, as applicable) for shares of our Class A common stock on a one-for-one basis and to exchange preferred units (together with an equal number of shares of Class C common stock) either for shares of our convertible preferred stock on a one-for-one basis or for shares of our Class A common stock at the conversion rate as described in “Our Structure and Reorganization—Reorganization Transactions and Post-IPO Structure—Preferential Distributions to Holders of Preferred Units and Convertible Preferred Stock—Convertible Preferred Stock Conversion Rate”. Following the automatic conversion of our convertible preferred stock into Class A common stock, preferred units will be exchangeable only for Class A common stock at the conversion rate plus cash in lieu of fractional shares (after aggregating all shares of our Class A common stock that would otherwise be received by each holder). A limited partnership unit cannot be exchanged for a share of our Class A common stock or convertible preferred stock without a share of our Class B common stock or Class C common stock, as applicable, being delivered together at the time of exchange, at which time we will automatically cancel such share of Class B common stock or Class C common stock.
The exchange agreement generally provides that holders of limited partnership units will be permitted to exchange such units in a number of circumstances that are generally based on, but in several respects are not identical to, the “safe harbors” contained in the U.S. Treasury Regulations dealing with publicly traded partnerships. In accordance with the terms of the exchange agreement, partnership units may be exchanged (i) in connection with the first underwritten offering in any calendar year pursuant to the resale and registration rights agreement, (ii) on a specified date each fiscal quarter, (iii) in connection with such holder’s death, disability or mental incompetence, (iv) as part of one or more exchanges by such holder and any related persons (within the meaning of Section 267(b) or 707(b)(1) of the Internal Revenue Code, and treating H&F Brewer AIV, L.P. and H&F Capital Associates V, L.P., or H&F Capital Associates, as related persons for this purpose) during any 30 calendar day period representing in the aggregate more than 2% of all outstanding partnership units of Artisan Partners Holdings (disregarding interests held by us so long as we are the general partner of Artisan Partners Holdings and owned at least 10% of all outstanding partnership units at any point during the taxable year during which such exchanges occur), (v) the exchange is of all of the limited partnership units of Artisan Partners
-57-
Table of Contents
Holdings held by H&F Brewer AIV, L.P. and H&F Capital Associates or AIC in a single transaction, (vi) in connection with a tender offer, share exchange offer, issuer bid, take-over bid, recapitalization or similar transaction with respect to our Class A common stock that is effected with the consent of our board of directors or in connection with certain mergers, consolidations or other business combinations (such exchanges to be contingent upon the consummation of the transaction) or (vii) if we permit the exchanges after determining (after consultation with our outside legal counsel and tax advisor) that Artisan Partners Holdings would not be treated as a “publicly traded partnership” under Section 7704 of the Internal Revenue Code as a result of such exchanges.
A holder may not exchange limited partnership units if we determine, after consultation with legal counsel, that such exchange would be prohibited by law or regulation or such exchange would not be permitted under any of the agreements with us to which the holder is then subject. In addition, we may impose additional restrictions on exchange in certain circumstances that we reasonably determine to be necessary or advisable so that Artisan Partners Holdings is not treated as a “publicly traded partnership” under Section 7704 of the Internal Revenue Code (other than the circumstances described in clauses (ii), (iv) or (v) of the paragraph above in the absence of a change of law).
Common units of Artisan Partners Holdings may be exchanged only to the extent such partner’s capital account at the time of the exchange represents at least the same percentage of the aggregate capital account balances of all partners of Artisan Partners Holdings as the percentage interest in profits represented by such units. To the extent a holder of common units of Artisan Partners Holdings has a capital account that, as a percentage of the aggregate capital account balances of all partners of Artisan Partners Holdings, is less than the percentage interest in profits represented by such holder’s common units, such holder will only be permitted to exchange the portion of its common units that represent the same (or less than the same) percentage of the aggregate limited partnership units of Artisan Partners Holdings as the percentage interest in the aggregate capital account balances of all partners of Artisan Partners Holdings represented by such holder’s capital account.
Employee-partners who exchange common units that are unvested will receive restricted shares of our Class A common stock that are subject to the same vesting requirements that applied to the common units exchanged. As the holders of common units or preferred units exchange their units for Class A common stock, we will receive a number of GP units of Artisan Partners Holdings equal to the number of shares of our Class A common stock that they receive, and an equal number of common units or preferred units, and shares of our Class B or Class C common stock, as applicable, will be cancelled. We will retain any preferred units exchanged for shares of convertible preferred stock until the subsequent conversion of such shares into shares of our Class A common stock, although an equal number of shares of our Class C common stock will be cancelled. Upon conversion of shares of convertible preferred stock, we will exchange a number of preferred units we hold for GP units equal to the number of shares of our Class A common stock issued upon conversion. See “Our Structure and Reorganization—Offering Transactions—Exchange Agreement” for more detailed information concerning the exchange rights, including a diagram that illustrates the exchange of units of Artisan Partners Holdings for shares of our capital stock.
The diagram below illustrates the exchange of units of Artisan Partners Holdings for shares of our capital stock and the issuance of GP units to us as contemplated by the exchange agreement and the amended and restated limited partnership agreement of Artisan Partners Holdings, respectively.
-58-
Table of Contents
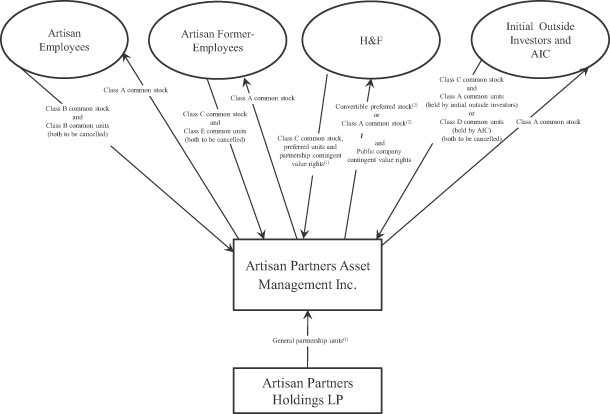
| (1) | We will retain any preferred units exchanged for shares of convertible preferred stock until the subsequent conversion of such shares into shares of Class A common stock, although an equal number of shares of Class C common stock will be cancelled. We will also retain any partnership CVRs exchanged for public company CVRs until a cash payment is made to the holders thereof or such rights are terminated as described in “Our Structure and Reorganization—Reorganization Transactions and Post-IPO Structure—Contingent Value Rights—Termination”. |
| (2) | Prior to the automatic conversion of our convertible preferred stock into Class A common stock, holders of preferred units will have the option of exchanging one preferred unit for one share of convertible preferred stock or for a number of shares of Class A common stock equal to the conversion rate as described in “Our Structure and Reorganization—Reorganization Transactions and Post-IPO Structure—Preferential Distributions to Holders of Preferred Units and Convertible Preferred Stock—Convertible Preferred Stock Conversion Rate”. After the automatic conversion of our convertible preferred stock into Class A common stock, preferred units will be exchangeable only for Class A common stock at the conversion rate. |
| (3) | As holders of common units or preferred units exchange their units for Class A common stock, we will receive a number of GP units of Artisan Partners Holdings equal to the number of shares of Class A common stock that such holders receive. As described in footnote 1 above, as holders of preferred units exchange their units for convertible preferred stock, we will retain any preferred units exchanged for shares of convertible preferred stock until the subsequent conversion of such shares of convertible preferred stock into shares of Class A common stock. Upon conversion of shares of convertible preferred stock into shares of Class A common stock (or the exchange of preferred units for shares of Class A common stock), we will receive a number of GP units of Artisan Partners Holdings equal to the number of shares of Class A common stock that such holders receive. Each time Artisan Partners Holdings issues a GP unit to us, either a common unit or preferred unit, as applicable, will be cancelled. |
-59-
Table of Contents
Resale and Registration Rights Agreement—Restrictions on Sale
As part of the reorganization transactions, we will enter into a resale and registration rights agreement, which we refer to as the registration rights agreement, with the holders of limited partnership units of Artisan Partners Holdings and holders of our convertible preferred stock, pursuant to which the shares of our Class A common stock issued upon exchange of their limited partnership units, and, if applicable, conversion of their convertible preferred stock, will be eligible for resale. Such shares of Class A common stock may be transferred only in accordance with the terms and conditions of the registration rights agreement, which includes restrictions on the timing and manner of resales as described below.
Registration Rights
Pursuant to the registration rights agreement, we will commit to file on or as soon as possible after the first anniversary of this offering but not later than (i) the 15-month anniversary of this offering or (ii) the expiration of any lock-up period in connection with a follow-on underwritten offering we plan to conduct after the first anniversary of this offering, if such follow-on offering is completed prior to such 15-month anniversary, (A) an exchange shelf registration statement registering all shares of our Class A common stock and convertible preferred stock to be issued and delivered by us upon exchange of limited partnership units and (B) a shelf registration statement registering secondary sales of Class A common stock issuable upon exchange of units or conversion of convertible preferred stock by the H&F holders and AIC. We will also commit to use our reasonable best efforts, prior to the 15-month anniversary of this offering and in any event as soon as possible, to cause the SEC to declare both shelf registration statements effective.
Follow-on Underwritten Offering. We will be required to use our reasonable best efforts to provide for and complete an underwritten offering as soon as possible following the first anniversary of this offering, but not later than the 15-month anniversary of this offering, in which all stockholders party to the registration rights agreement may sell shares of Class A common stock in accordance with the resale restrictions described below.
In the event that the number of shares requested to be sold in the follow-on underwritten offering exceeds, in the opinion of the underwriters, the number of shares that can be sold in the offering without adversely affecting the distribution of the securities being offered, the price that will be paid for the shares or the marketability of the offering, which we refer to as underwriter cut-backs, priority will be given to (i) any and all shares of our Class A common stock that we propose to issue and sell in connection with the offering, then to (ii) the right of the H&F holders to sell the greater of 40% of the aggregate number of shares being offered or two and one-half times their proportionate interest, and then to (iii) the other participating holders pro rata based on their proportionate interest, subject to any applicable resale restrictions. For purposes of this section, “proportionate interest” means a person’s aggregate shares of Class A common stock and shares of Class A common stock issuable upon exchange of limited partnership units or conversion of convertible preferred stock, as applicable, divided by the total number of outstanding shares of our capital stock.
Demand Registration by the H&F holders and AIC. The H&F holders and AIC will each have demand registration rights, subject to certain restrictions and conditions, as discussed further below. Without the consent of our board of directors, underwritten shelf takedowns requested by any party may not occur within 90 days of another underwritten offering. Additionally, we will have the right to delay or suspend the use of our shelf registration statement under certain circumstances when we are in possession of material non-public information.
Indemnification and Expenses. We will agree in the resale and registration rights agreement to indemnify the participating holders, solely in their capacity as selling stockholders, against any losses or damages resulting from any untrue statement, or omission, of material fact in any registration statement, prospectus or free writing prospectus pursuant to which they may sell the shares of our Class A common stock that they receive upon exchange of their limited partnership units or conversion of shares of convertible preferred stock, except to the extent such liability arose from the selling stockholder’s misstatement or omission of a material fact, and the participating holders have agreed to indemnify us against certain losses caused by their misstatements or omissions of a material fact relating to them to the extent caused by or contained in information furnished in writing by such stockholder.
-60-
Table of Contents
We will pay all expenses incident to our performance of, or compliance with, any registration or marketing of securities pursuant to the resale and registration rights agreement, including reasonable fees and out-of-pocket costs and expenses of selling stockholders (including reasonable legal fees for the H&F holders and AIC). The selling stockholders will pay their respective portions of all underwriting discounts, commissions and transfer taxes relating to the sale of their shares of our Class A common stock pursuant to the registration rights agreement.
Resale Timing and Manner Restrictions
All stockholders party to the registration rights agreement may transfer their shares of Class A common stock only in accordance with the following timing, amount and manner of resale limitations:
Employee-Partners. In each 12-month period following the first anniversary of this offering, an employee-partner may sell (i) a number of vested shares of our Class A common stock representing up to 15% of the aggregate number of common units and shares of Class A common stock received upon exchange of common units (in each case, whether vested or unvested) he or she held as of the first day of that period (as well as the number of shares such holder could have sold in any previous period or periods but did not sell in such period or periods) or, (ii) if greater, vested shares of our Class A common stock having a market value as of the time of sale of up to $250,000.
Subject to the volume restrictions described above, a stockholder who is an employee-partner of Artisan may sell shares of Class A common stock received upon exchange of common units in the follow-on underwritten offering we plan to conduct as soon as possible after the first anniversary of this offering, and, following (i) the 15-month anniversary of this offering or (ii) the expiration of any lock-up period in connection with the follow-on offering, if such offering is completed prior to the 15-month anniversary, in any manner of sale permitted under the securities laws. Employee-partners are also permitted to transfer vested shares of our Class A common stock received upon exchange of common units to certain family members and estate planning vehicles.
Former Employee-Partners. Following the termination of an employee-partner’s employment, such former employee-partner’s vested Class B common units will automatically be exchanged for Class E common units, such former employee-partner’s shares of Class B common stock will be cancelled and we will issue such former employee-partner a number of shares of Class C common stock equal to such former employee-partner’s number of Class E common units. The former employee-partner’s Class E common units will be exchangeable for Class A common stock subject to the same restrictions and limitations on exchange applicable to the other limited partners.
Subject to the contractual limitations described below, a former employee-partner may sell his or her shares of Class A common stock received upon exchange in the follow-on underwritten offering, and, following (i) the 15-month anniversary of this offering or (ii) the expiration of any lock-up period in connection with the follow-on offering, if such offering is completed prior to the 15-month anniversary, in any manner of sale permitted under the securities laws.
If the employee-partner’s employment was terminated as a result of retirement, death or disability, such employee-partner or his or her estate may (i) as of and after the time of termination of employment, sell a number of shares of our Class A common stock up to one-half of the employee-partner’s aggregate number of vested common units and shares of Class A common stock received upon exchange of common units held as of the date of termination of employment, and (ii) as of and after the first anniversary of the termination, the employee-partner’s remaining shares of our Class A common stock received upon exchange of common units. Retirement, for these purposes, requires that the employee-partner have provided 10 years of service or more at the date of retirement and offered one year’s written notice (or three years’ written notice in the case of employee-partners who are portfolio managers or executive officers) of the intention to retire, subject to the partnership’s right, at its discretion, to accept a period of notice that is shorter.
-61-
Table of Contents
If an employee-partner resigns or is terminated involuntarily, such employee-partner may in each 12-month period following the third, fourth, fifth and sixth anniversary of the termination, sell a number of shares of our Class A common stock up to one-fourth of the employee-partner’s aggregate number of vested common units and shares of Class A common stock received upon exchange of common units held as of the date of termination of his or her employment (as well as the number of shares such employee-partner could have sold in any previous period or periods but did not sell in such period or periods).
Former employee-partners are also permitted to transfer shares of our Class A common stock received upon exchange of common units to certain family members and estate planning vehicles.
AIC. AIC may sell up to 15% of its aggregate number of common units and shares of Class A common stock received upon exchange of common units in the follow-on offering. There will be no limit on the number of shares of our Class A common stock AIC may sell after the later of (i) the termination of Mr. Ziegler’s employment (which is expected to occur approximately one year after this offering pursuant to his employment agreement) and (ii) the second anniversary of this offering. AIC will have the right to use the shelf registration statement to sell shares of Class A common stock and will be entitled to sell its shares in any manner of sale permitted under the securities laws following (i) the 15-month anniversary of this offering or (ii) the expiration of any lock-up period in connection with the follow-on offering, if such follow-on offering is completed prior to the 15-month anniversary.
Subject to the volume restrictions described above, AIC may exercise its demand registration rights to sell shares of Class A common stock under the shelf registration statement in (i) an unrestricted number of brokered transactions and (ii) during the one-year period beginning on the first anniversary of this offering, two underwritten shelf takedowns (but only one marketed underwritten shelf takedown), and, during each one-year period beginning on the second anniversary of this offering, three underwritten shelf takedowns (but only one marketed underwritten shelf takedown), subject to the limitation of two demands for marketed underwritten shelf takedowns in the aggregate. A shelf takedown will be deemed “marketed” if it involves (i) one-on-one meetings or calls between investors and our management or (ii) a customary roadshow or other marketing activity that requires members of our management to be out of the office for two business days or more or group meetings or calls between investors and management or any other substantial marketing effort by the underwriters over a period of at least 48 hours.
AIC’s demand registration rights will be subject to certain restrictions and conditions, including as to amount and priority. Each underwritten shelf takedown, whether or not marketed, demanded by AIC must have anticipated aggregate net proceeds of at least the lesser of (i) $35 million or (ii) the value of all Class A common stock (including the value of any Class A common stock issuable upon exchange of common units) owned by AIC at the time of such demand. In the event that the H&F holders make a demand for an underwritten shelf takedown, AIC (the non-demanding party) will have the right, but not the obligation, to participate in any such offering. In the event of underwriter cut-backs in a demand registration, AIC will have the right to participate in proportion to its proportionate interest; provided that, if (i) the H&F holders are the demanding party, the participation rights of AIC will be subject to the right of the H&F holders to sell, in the aggregate, the greater of 40% of the aggregate number of shares being offered or two and one-half times their proportionate interest.
The H&F Holders. The H&F holders may sell shares of Class A common stock received upon exchange of preferred units or conversion of shares of convertible preferred stock in the follow-on underwritten offering we plan to conduct as soon as possible after the first anniversary of this offering. In such offering, in the event of underwriter cutbacks, the H&F holders shall be entitled to sell the greater of (i) 40% of the aggregate number of shares being offered and (ii) two and one-half times their proportionate interest, subject to our right to register shares for our own account.
Following (i) the 15-month anniversary of this offering or (ii) the expiration of any lock-up period in connection with the follow on offering, if such follow on offering is completed prior to the 15-month
-62-
Table of Contents
anniversary, the H&F Holders will be entitled to sell shares in any manner of sale permitted under the securities laws. In addition, subject to certain restrictions, the H&F holders will have the right to use the shelf registration statement to sell shares of Class A common stock in (i) an unrestricted number of brokered transactions and (ii) during the one-year period beginning on the first anniversary of this offering, two underwritten shelf takedowns (but only one marketed underwritten shelf takedown), and, during each one-year period beginning on the second anniversary of this offering, three underwritten shelf takedowns (but only one marketed underwritten shelf takedown), subject to the limitation of two demands for marketed underwritten shelf takedowns in the aggregate.
Each underwritten shelf takedown, whether or not marketed, demanded by the H&F holders must have anticipated aggregate net proceeds of at least the lesser of (i) $35 million or (ii) the value of all Class A common stock (including the value of any Class A common stock issuable upon exchange of preferred units or conversion of shares of convertible preferred stock) owned by them at the time of such demand. In any demand registration, the H&F holders shall be entitled to sell the greater of (i) 40% of the aggregate number of shares being offered and (ii) two and one-half times their proportionate interest, in the event of underwriter cut-backs. In the event that AIC makes a demand for an underwritten shelf takedown, the H&F holders (the non-demanding party) will have the right, but not the obligation, to participate in such offering. In the event of underwriter cut-backs in such a registration, the H&F holders will have the right to sell their proportionate interest.
Additionally, the original H&F holders will have the right to distribute preferred units, shares of convertible preferred stock or shares of Class A common stock to any one or more of their partners or stockholders, as applicable, at any time following (i) the 15-month anniversary of this offering or (ii) the expiration of any lock-up period in connection with the follow-on offering, if such follow-on offering is completed prior to the 15-month anniversary. The transferees in any such distribution will not be subject to contractual resale restrictions and will not have any rights under the registration rights agreement.
The H&F holders also will have the right to transfer preferred units, shares of convertible preferred stock or shares of Class A common stock to their affiliates. Any such transferees will be subject to the same resale restrictions applicable to the transferring H&F holder.
Class A Limited Partners
The holders of Class A common units of Artisan Partners Holdings may sell shares of Class A common stock received in exchange for such common units in our follow-on underwritten offering. Following (i) the 15-month anniversary of this offering or (ii) the expiration of any lock-up period in connection with the follow-on offering, if such follow-on offering is completed prior to the 15-month anniversary, the holders of Class A common units will be entitled to sell shares in any manner of sale permitted under the securities laws. Additionally, after the same applicable time period, Sutter Hill Ventures and Frog & Peach LLC may distribute their Class A common units or Class A common stock received in exchange for Class A common units to their partners or members, respectively. The transferees in any such distribution will not be subject to contractual resale restrictions and will not have any rights under the registration rights agreements.
Other Permitted Transfers
Notwithstanding the restrictions described above, following (i) the 15-month anniversary of this offering or (ii) the expiration of any lock-up period in connection with the follow-on offering, if such follow-on offering is completed prior to the 15-month anniversary, if our board of directors determines that an actual or proposed change in law may result in income recognized by an employee-partner or former employee-partner upon exchange of common units being taxed at ordinary income rates or will otherwise have material adverse tax consequences on the employee-partners or former employee-partners, then in any period during which an employee-partner or former employee-partner exchanges common units, if the value of Class A common stock otherwise permitted to be sold during the period does not equal the tax liability created by the exchanges, the
-63-
Table of Contents
employee-partner or former employee-partner may sell in any manner of sale permitted under the securities laws an additional number of vested shares of Class A common stock the value of which equals the excess of the tax liability over the value of the Class A common stock otherwise permitted to be sold in such period. In addition, the estate of any deceased holders or the beneficiaries thereof may sell shares of Class A common stock as necessary to pay all applicable estate and inheritance taxes relating thereto. Lastly, following (i) the 15-month anniversary of this offering or (ii) the expiration of any lock-up period in connection with the follow-on offering, if such follow-on offering is completed prior to the 15-month anniversary, we may allow sales of our Class A common stock issued upon exchange of limited partnership units or conversion of convertible preferred stock in amounts exceeding those described above at any time, which determination may be withheld, delayed, or granted on such terms and conditions as our board of directors may determine, in its sole discretion.
Contingent Value Rights
Immediately prior to the consummation of this offering, Artisan Partners Holdings will issue to each holder of preferred units of Artisan Partners Holdings (including Artisan Partners Asset Management) a number of CVRs, the partnership CVRs, equal to the number of preferred units held by such holder (such partnership CVRs may only be exchanged together with a corresponding number of preferred units), and, in connection with the H&F Corp Merger, Artisan Partners Asset Management will issue to each holder of convertible preferred stock a number of CVRs, the public company CVRs, equal to the number of shares of convertible preferred stock held by such holder. Upon the exchange of preferred units of Artisan Partners Holdings for shares of our convertible preferred stock or Class A common stock, as applicable, the corresponding partnership CVRs will be exchanged for the same number of public company CVRs, and Artisan Partners Asset Management will hold the partnership CVRs so exchanged. The partnership CVRs may only be exchanged or transferred together with a corresponding number of preferred units. Upon the transfer of shares of convertible preferred stock, an equal number of public company CVRs shall automatically be deemed transferred to the same transferee. Holders of convertible preferred stock may convert shares of such stock into shares of our Class A common stock (and thereafter sell such shares of Class A common stock) without transferring, or terminating any of their rights with respect to, public company CVRs that they hold. In addition, holders of public company CVRs may transfer such CVRs to their affiliates.
We are issuing the CVRs in order to provide the holders of preferred units in Artisan Partners Holdings following the reorganization transactions with economic rights similar (although not identical) to certain economic rights such holders currently possess. In addition to rights to receive preferential distributions in the case of partial capital events or dissolution of Artisan Partners Holdings, the current holders of preferred units have the right to put their units to Artisan Partners Holdings in July 2016 for an amount specified in Artisan Partners Holdings’ limited partnership agreement as in effect immediately prior to the reorganization, which effectively places a minimum value on the value of the preferred units. The CVRs provide the same type of protection against a decline in the value of Artisan Partners Holdings as currently provided by the put right and thus provide the current holders of preferred units with an economic right following the reorganization transactions that is similar to their put rights prior to the reorganization transactions, modified in light of the other reorganization transactions. The current holders of the preferred units will not pay any cash consideration for the CVRs.
Settlement. On the settlement date, which will be July 11, 2016, or, if earlier, five business days after the effective date of a change of control of Artisan, we will pay to the holders of CVRs an aggregate amount equal to the least of the following three alternative amounts: (i) $ ; (ii) the excess, if any, of (a) $ over (b) the sum of the measured value and partial capital event distributions; and (iii) the excess, if any, of (a) $ over (b) the sum of partial capital event distributions, the associated securities value and realized proceeds. The “measured value” is, generally, an amount equal to the product of the total number of CVRs (other than the partnership CVRs held by us) multiplied by the average of the daily VWAP of a share of our Class A common stock over the 60 consecutive trading days prior to July 3, 2016 or the effective date of a change of control, multiplied by the conversion rate on the applicable date. Generally, “partial capital event distributions” will equal the total amount distributed to holders of CVRs upon the occurrence of partial capital events or the dissolution of Artisan Partners Holdings. Generally, “associated securities value” will equal the product of the
-64-
Table of Contents
average of the daily VWAP of a share of our Class A common stock over the 60 consecutive trading days prior to July 3, 2016 or the effective date of a change of control, multiplied by the number of shares of our capital stock or preferred units of Artisan Partners Holdings held by the holders of the CVRs on the settlement date, multiplied by the conversion rate on the applicable date. Generally, “realized proceeds” will equal the gross proceeds realized by the holders of CVRs from the prior sale of our Class A common stock or the value of such shares at the time they are distributed as calculated under the CVR agreement.
For the purposes of the CVRs, a “change of control” will generally be defined to include the occurrence of the following events: (i) Artisan Partners Asset Management (or any direct or indirect wholly owned subsidiary thereof) ceases to be the general partner of Artisan Partners Holdings; (ii) a person or group (other than and not including any of the pre-reorganization partners of Artisan Partners Holdings) acquires beneficial ownership of 35% of either the aggregate voting power or the aggregate economic value represented by all outstanding equity interests in Artisan Partners Asset Management at any time the pre-reorganization partners of Artisan Partners Holdings do not own, directly or indirectly, equity interests in Artisan Partners Asset Management collectively representing at least a majority of the aggregate voting power or the aggregate economic value represented by all issued and outstanding equity interests in Artisan Partners Asset Management; or (iii) the majority of our board ceases to consist of our current directors or persons whose nomination or election was approved by a majority of our board.
To the extent we receive distributions with respect to the partnership CVRs we hold (which payments will be distributed to the holders of the public company CVRs in accordance with the terms thereof), the tax basis in the partnership units of Artisan Partners Holdings we hold will be reduced. The reduced basis could increase our taxable gain or reduce our taxable loss upon a future sale of partnership units or the assets of Artisan Partners Holdings.
Termination. The CVRs will terminate prior to the settlement date if the average of the daily VWAP of our Class A common stock over any period of 60 consecutive trading days beginning no earlier than (i) the 90th day after completion of the follow-on underwritten offering we plan to conduct as soon as possible after the first anniversary of this offering or (ii) the 15-month anniversary of this offering, if we do not conduct the follow-on offering by that date, is at least $ divided by the then-applicable conversion rate.
No other rights. The CVRs will have no voting rights or economic rights, other than the right to the payments on the settlement date described above.
Amended and Restated Limited Partnership Agreement of Artisan Partners Holdings
As a result of the reorganization, we will conduct all of our business activities through our direct subsidiary, Artisan Partners Holdings, an intermediate holding company, which wholly owns Artisan Partners Limited Partnership, our principal operating subsidiary. The operations of Artisan Partners Holdings, and the rights and obligations of its partners, will be set forth in an amended and restated limited partnership agreement of Artisan Partners Holdings, a form of which will be filed as an exhibit to the registration statement of which this prospectus forms a part. The following is a description of the material terms of this agreement.
Governance. We will serve as the general partner of Artisan Partners Holdings. As such, we will control its business and affairs and be responsible for the management of its business, subject to the voting rights of the limited partners as described under “—Voting and Class Approval Rights”. We will also have the power to delegate certain of our management responsibilities in respect of Artisan Partners Holdings to officers, as determined by our board of directors. No limited partners of Artisan Partners Holdings, in their capacity as such, will have any authority or right to control the management of Artisan Partners Holdings or to bind it in connection with any matter.
Economic Rights of Partners. Artisan Partners Holdings will have GP units, common units and preferred units. Net profits and net losses and distributions of profits of Artisan Partners Holdings generally will be
-65-
Table of Contents
allocated and made to partners pro rata in accordance with the number of partnership units of Artisan Partners Holdings they hold (whether or not vested), except in the case of (i) a partial capital event or dissolution of Artisan Partners Holdings as described above under “—Reorganization Transactions and Post-IPO Structure—Preferential Distributions to Holders of Preferred Units and Convertible Preferred Stock” or (ii), with respect only to the limited partners of Artisan Partners Holdings, the bonus reallocation adjustments described below. The pro rata portion of deemed gain on revaluation events otherwise allocable to the preferred units will be allocated to the common units and, after the H&F preference has terminated, the pro rata portion of deemed losses on revaluation events otherwise allocable to the common units will be allocated to the preferred units, in each case until the respective capital account balances (disregarding accrued and undistributed profits for these purposes) of each limited partner are pro rata to their respective percentage interest in the profits of Artisan Partners Holdings.
Pursuant to the terms of the amended and restated limited partnership agreement, the first $ of profits after this offering otherwise allocable and distributable, in the aggregate, to certain holders of common units and the holders of preferred units will instead be allocated and distributed to certain holders of Class B common units. These adjustments reflect an agreement reached among the pre-offering partners of Artisan Partners Holdings regarding which partners would bear, and in what amounts, the burden of a $56 million cash incentive compensation payment being made to certain of our portfolio managers in connection with this offering, which payment reduces the amount of accrued profits available for distribution to the pre-offering partners. We refer to these adjustments as the “bonus reallocation adjustments”. The bonus reallocation adjustments will not affect the amount of profits allocable or distributable with respect to the GP units held by Artisan Partners Asset Management.
Under the terms of its amended and restated limited partnership agreement, Artisan Partners Holdings will be obligated to distribute to us and its other partners cash payments for the purposes of funding tax obligations in respect of the taxable income and net capital gain that is allocated to us and them, respectively, as partners of Artisan Partners Holdings. See “—Tax Consequences”. In addition, Artisan Partners Holdings may make distributions to us without making pro rata distributions to other partners in order to fund our operating expenses, overhead and other fees and expenses. Distributions to partners upon the liquidation of Artisan Partners Holdings will be made as described under “—Preferential Distributions to Holders of Preferred Units and Convertible Preferred Stock—Dissolution”.
Coordination of Artisan Partners Asset Management and Artisan Partners Holdings. In order to make a share of Class A common stock represent the same percentage economic interest, disregarding corporate-level taxes and payments with respect to the tax receivable agreements, in Artisan Partners Holdings as a common unit of Artisan Partners Holdings, we will always hold a number of GP units equal to the number of shares of Class A common stock issued and outstanding. Any time we issue a share of our Class A common stock for cash, we will promptly transfer the net proceeds we receive to Artisan Partners Holdings and Artisan Partners Holdings will issue to us a GP unit for each share so issued. Any time we issue a share of our Class A common stock pursuant to our 2013 Omnibus Incentive Compensation Plan or 2013 Non-Employee Director Plan, we will contribute to Artisan Partners Holdings all of the proceeds that we receive (if any) and Artisan Partners Holdings will issue to us a GP unit. Any time Artisan Partners Holdings issues a common unit pursuant to our 2013 Omnibus Incentive Compensation Plan, we will issue a share of Class B common stock to the recipient of the common unit. In the event that we issue other classes or series of our equity securities, Artisan Partners Holdings will issue an equal amount of equity securities of Artisan Partners Holdings with designations, preferences and other rights and terms that are substantially the same as our newly issued equity securities. Conversely, if we redeem, repurchase or otherwise acquire any shares of our Class A common stock (or our equity securities of other classes or series) for cash, Artisan Partners Holdings will, at substantially the same time as our transaction, redeem an equal number of GP units (or its equity securities of the corresponding classes or series) held by us, upon the same terms and for the same price, as the shares of our Class A common stock (or our equity securities of such other classes or series) are redeemed, repurchased or otherwise acquired. Upon the forfeiture of any common unit held by an employee-partner as a result of applicable vesting provisions, the breach of any restrictive covenants in grant agreements, or otherwise, a corresponding share of our Class B common stock will automatically be redeemed and cancelled by us.
-66-
Table of Contents
We may, upon the consummation of a merger, consolidation or other business combination involving us (unless such a transaction would result in our voting stock continuing to represent at least a majority of the total voting power of the voting stock of the surviving entity or its parent), require each holder of limited partnership units to exchange all such units (together with an equal number of shares of Class B common stock or Class C
common stock, as applicable) for shares of our Class A common stock, in the case of common units, or shares of our convertible preferred stock, in the case of the preferred units, and to convert such shares of convertible preferred stock into shares of our Class A common stock. In the event that a tender offer, share exchange offer, issuer bid, take-over bid, recapitalization or similar transaction with respect to our Class A common stock is proposed by us or by a third party and approved by our board of directors or is otherwise effected with the consent of our board of directors, each holder of limited partnership units (other than us) will be permitted to participate in such transaction by exchanging their units for shares of our Class A common stock or converting their shares of convertible preferred stock contingent upon the consummation of the transaction.
Pursuant to the amended and restated limited partnership agreement, we will agree, as general partner, that we will not conduct any business other than the management and ownership of Artisan Partners Holdings and its subsidiaries, or own any other assets (other than on a temporary basis), although we may incur indebtedness, own other assets and take other actions if we determine in good faith that such indebtedness, ownership or other actions are in the best interest of Artisan Partners Holdings. In addition, the limited partnership units of Artisan Partners Holdings, as well as our common stock, will be subject to equivalent stock splits, dividends and reclassifications and other similar transactions.
Issuances and Transfers of Partnership Units. GP units of Artisan Partners Holdings may only be issued to us, its general partner, and are non-transferable. We do not intend to cause Artisan Partners Holdings to issue additional partnership or other units after this offering other than GP units in connection with exchanges of limited partnership units for capital stock of Artisan Partners Asset Management and common or other units under our 2013 Omnibus Incentive Compensation Plan that we plan to adopt in connection with this offering. Holders of the limited partnership units may not transfer any such limited partnership units to any person unless he or she transfers an equal number of shares of our Class B common stock or Class C common stock to the same transferee. The common units of Artisan Partners Holdings will be transferable only to family members or certain estate planning vehicles of the transferor or in distributions by certain of our initial outside investors to any one or more of their partners or members. Preferred units of Artisan Partners Holdings and shares of our convertible preferred stock cannot be transferred except in transfers by the original H&F holders to certain partners, stockholders or affiliates.
Voting and Class Approval Rights. As the general partner of Artisan Partners Holdings, we will hold all GP units and will control the business of Artisan Partners Holdings. Our approval, acting in our capacity as the general partner, along with the approval of holders of a majority of each class of limited partnership units (except the Class E common units), voting as a separate class, will be required to:
| • | engage in a material corporate transaction, including a merger, consolidation, dissolution or sale of greater than 25% of the fair market value of the partnership’s assets; |
| • | except in connection with the exchange of partnership units for shares of our capital stock, the conversion of convertible preferred stock into Class A common stock or the exchange of a former employee-partner’s vested Class B common units for Class E common units, redeem or reclassify partnership units, issue additional partnership units or create additional classes of partnership units, provided that, without the consent of the limited partners or any class thereof, (i) the partnership may issue additional partnership units the issuance of which has been approved by the stockholders of Artisan Partners Asset Management and preferred units that are expressly junior in rights to the outstanding preferred units and (ii) the partnership may redeem partnership units from Artisan Partners Asset Management if it uses the proceeds of such redemption to repurchase shares of its Class A common stock or convertible preferred stock; |
| • | make any in-kind distributions; |
-67-
Table of Contents
| • | admit a new general partner that is not a wholly-owned, direct or indirect, subsidiary of Artisan Partners Asset Management or any successor thereof; or |
| • | take any action on tax matters that materially adversely affects the allocation of the step-up in basis of assets under certain tax laws with respect to the limited partners. |
If any of the foregoing affects only certain classes of limited partnership units, only the approval of the general partner and the affected classes would be required to approve such a transaction or issuance in accordance with the terms of the amended and restated limited partnership agreement. The right of each class of limited partnership units to approve or disapprove such a transaction or issuance will terminate when the holders of the respective class of limited partnership units directly or indirectly cease to own limited partnership units constituting at least 5% of the outstanding partnership units of Artisan Partners Holdings. The holders of Class E common units will have no voting rights with respect to their Class E common units.
Artisan Partners Asset Management has agreed that it will vote the preferred units that it holds pursuant to the instructions of the holders of the convertible preferred stock in connection with any voting rights of the holders of the preferred units.
Amendments. The amended and restated limited partnership agreement may be amended with the consent of the general partner and the holders of a majority of the Class A common units, Class B common units, Class D common units and preferred units, each voting as a separate class, provided that the general partner may, without the consent of any limited partner, make amendments that do not materially and adversely affect any limited partners. To the extent any amendment materially and adversely affects only certain classes of limited partners, only the holders of a majority of the units of the affected classes will have the right to approve such amendment.
Notwithstanding the foregoing, no amendment increasing the personal liability of a limited partner, modifying the limited liability of a limited partner or requiring any additional capital contribution by a limited partner may be made without the consent of the affected limited partner.
In addition, pursuant to the amended and restated limited partnership agreement, if our board of directors determines that the result obtained by applying the terms of the amended and restated limited partnership agreement is inconsistent with the intended substantive result, then, by a unanimous vote of the members of the board then in office, an alternative result and related allocations, determinations and distributions shall govern in lieu of the provisions in the agreement notwithstanding anything in the agreement to the contrary.
Non-Competition. Mr. Ziegler will agree and all of our portfolio managers (not including associate portfolio managers) have agreed not to compete with us during the term of their employment with us and for a period of two years for our U.S.-based portfolio managers and one year for our U.K.-based portfolio manager following termination of employment. All of our other employees who currently are limited partners or who receive equity awards pursuant to our 2013 Omnibus Incentive Compensation Plan will, pursuant to the terms of the applicable grant agreements pursuant to which they have been issued equity awards, agree to refrain from competing with us during the term of their employment with us, but will not be prohibited from doing so after their employment with us.
Non-Solicitation and Confidential Information. Mr. Ziegler will agree and all of our portfolio managers (not including associate portfolio managers) have agreed not to solicit our employees and customers, while employed by us and for a period of two years for our U.S.-based portfolio managers and one year for our U.K.-based portfolio manager following termination of employment. All of our other employees who are currently limited partners or who receive equity awards pursuant to our 2013 Omnibus Incentive Compensation Plan will agree not to solicit our employees and, depending on such employee’s position, certain customers, while employed by us and for a period of one year following termination of employment. All employees will agree to protect the confidential information of Artisan Partners Asset Management and Artisan Partners’ Holdings, which obligation will survive the termination of his or her employment for a period of two years.
-68-
Table of Contents
Indemnification and Exculpation. Artisan Partners Holdings will indemnify AIC, as its former general partner, us, as its current general partner, the former members of its pre-offering Advisory Committee, the members of our stockholders committee and our directors and officers against any losses, damages, costs or expenses (including reasonable attorney’s fees, judgments, fines and amounts paid in settlement) actually incurred in connection with any threatened, pending or completed action, suit or proceeding, whether civil, criminal or administrative (including any action by or on behalf of Artisan Partners Holdings) arising as a result of the capacities in which they serve or served Artisan Partners Holdings to the maximum extent that any of them could be indemnified if Artisan Partners Holdings were a Delaware corporation and they were directors of such corporation.
Artisan Partners Holdings will also indemnify its employees and employees of its subsidiaries against any losses, damages, costs or expenses (including reasonable attorney’s fees, judgments, fines and amounts paid in settlement) actually incurred in connection with any threatened, pending or completed action, suit or proceeding, whether civil, criminal or administrative arising as a result of their being an employee of Artisan Partners Holdings (or their serving as an officer or fiduciary of any of Artisan Partners Holdings’ subsidiaries or benefit plans or any entity of which Artisan is sponsor or adviser), provided that no employee will be indemnified or reimbursed for any claim, obligation or liability adjudicated to have arisen out of or been based upon such employee’s intentional misconduct, gross negligence, fraud or knowing violation of law.
In addition, Artisan Partners Holdings will pay the costs or expenses (including reasonable attorneys’ fees) incurred by the indemnified parties in advance of a final disposition of such matters so long as the indemnified party undertakes to repay the expenses if the party is adjudicated not to be entitled to indemnification.
We, as the general partner, and our directors and officers will not be liable to Artisan Partners Holdings or its limited partners for damages incurred by (i) any mistake in judgment or (ii) any action or inaction taken or omitted in the course of performing our or their duties under the amended and restated limited partnership agreement or in connection with the business of Artisan Partners Holdings. In addition, we, as the general partner, will not be liable to Artisan Partners Holdings or its limited partners for any loss due to the mistake, negligence, dishonesty, fraud or bad faith of any employee, broker or other agent of Artisan Partners Holdings selected by us without willful misconduct or gross negligence on our part.
Stockholders Agreement
Concurrently with the consummation of this offering, each of our employee-partners and AIC will enter into a stockholders agreement pursuant to which such holders will grant an irrevocable voting proxy with respect to all shares of our common stock they hold at such time or may acquire from us in the future to a stockholders committee consisting initially of a designee of AIC, who initially will be Mr. Ziegler, Eric R. Colson and James C. Kieffer, a portfolio manager of our U.S. Value strategies. At the close of the reorganization, the only shares of our capital stock subject to the stockholders agreement will be the shares of our common stock held by our employee-partners and AIC. Thereafter, any shares of our common stock that we issue to our employee-partners or other employees will be subject to the stockholders agreement so long as the agreement has not been terminated. The AIC designee will have the sole right, in consultation with the other members of the stockholders committee, to determine how to vote all shares subject to the stockholders agreement until the earliest to occur of: (i) Mr. Ziegler’s death or disability, (ii) the voluntary termination of Mr. Ziegler’s employment with us, including the scheduled expiration of his employment on the first anniversary of this offering and (iii) 180 days after the effective date of Mr. Ziegler’s involuntary termination of employment with us.
The AIC designee will be required to consult in good faith, or participate in the activities of the stockholders committee so as to be available to consult in good faith, with the other members of the stockholders committee. If the AIC designee ceases to have sole power to determine how the shares are voted, the shares will be voted in accordance with the majority decision of the three members of the stockholders committee. Although AIC may replace Mr. Ziegler as its stockholders committee designee, Mr. Ziegler indirectly holds 50% of the voting stock of AIC, and therefore could not be replaced without his consent.
-69-
Table of Contents
Pursuant to the stockholders agreement, AIC will lose its right to designate one member of the stockholders committee upon the earliest to occur of: (i) Mr. Ziegler’s death or disability, (ii) the voluntary termination of Mr. Ziegler’s employment with us, including by reason of the scheduled expiration of his employment on the first anniversary of this offering, and (iii) 180 days after the effective date of Mr. Ziegler’s involuntary termination of employment. AIC may withdraw its shares of common stock from the stockholders agreement when Mr. Ziegler is no longer a member of the stockholders committee. Upon such withdrawal AIC will have sole voting control over its shares.
The members of the stockholders committee other than the AIC designee must be Artisan employees and holders of shares subject to the agreement. Pursuant to the terms of the stockholders agreement, if a member of the stockholders committee ceases to act as a member of the stockholders committee, the chief executive officer of Artisan Partners Asset Management (if he or she is a holder of shares subject to the stockholders agreement and is not already a member of the stockholders committee) will become a member of the stockholders committee. Otherwise, the two remaining members of the stockholders committee will jointly select a third member of the stockholders committee. If the remaining members of the stockholders committee cannot agree on a third member of the stockholders committee or if there are fewer than two remaining members of the stockholders committee, then the member or members of the stockholders committee will be selected by the vote of the holders of the shares subject to the stockholders agreement from among candidates nominated by the five holders of shares subject to the stockholders agreement, other than AIC, that hold the largest number of shares of our Class A common stock, counting for these purposes each common unit held as one share of Class A common stock. Notwithstanding the foregoing, so long as AIC has the right to designate one member of the stockholders committee, it shall have the right to select a replacement if its designee ceases to be a member of the committee. Each member of the stockholders committee is entitled to indemnification from Artisan in his or her capacity as a member of the stockholders committee.
The stockholders agreement will provide that members of the stockholders committee will vote the shares subject to the stockholders agreement in support of (i) a director nominee designated by the holders of a majority of the preferred units (other than us) and convertible preferred stock (which at the completion of this offering will be the H&F holders), so long as the holders of preferred units (other than us) and convertible preferred stock together beneficially own at least 5% of the number of outstanding shares of our common stock and our convertible preferred stock, (ii) Matthew R. Barger, or, unless Mr. Barger is removed from the board for cause, a successor selected by Mr. Barger who holds Class A common units, so long as the holders of the Class A common units beneficially own at least 5% of the number of outstanding shares of our common stock and our convertible preferred stock; (iii) a director nominee designated by AIC, so long as AIC beneficially owns at least 5% of the number of outstanding shares of our common stock and our convertible preferred stock; and (iv) a director nominee designated by the stockholders committee who is an employee-partner. Following (i) the 15-month anniversary of this offering or (ii) the expiration of any lock-up period in connection with the follow-on offering, if such follow-on offering is completed prior to the 15-month anniversary, for so long as the CVRs remain outstanding, if our board determines in good faith that the combined ownership of the CVRs and equity interests in us and Artisan Partners Holdings held by the stockholders described in clause (i) of the preceding sentence constitutes a net short position and at least two-thirds of our board, excluding the director nominated pursuant to clause (i) of the preceding sentence, votes in favor of a resolution requesting that such director no longer participate in (and recuse himself or herself from) meetings of the board, then those stockholders shall use their best efforts to cause such director to comply with the request as promptly as practicable and until the net short position ceases to exist. The stockholders described in clause (i) shall have the right to forfeit their director nominee designation right at any time and thereafter designate a board observer who shall have the right to attend meetings of the board and receive all information provided to the members of the board. The right to designate a board observer will last only so long as such stockholders would otherwise have had the right to designate a director nominee.
Other than as provided above, under the terms of the stockholders agreement, the stockholders committee may in its discretion vote, or abstain from voting, all or any of the shares subject to the stockholders agreement
-70-
Table of Contents
on any matter on which holders of shares of our common stock are entitled to vote, including, but not limited to, the election of directors to our board of directors, amendments to our certificate of incorporation or bylaws, changes to our capitalization, the declaration of dividends, a merger or consolidation, a sale of substantially all of our assets, and a liquidation, dissolution or winding up. The stockholders committee is specifically authorized to vote for its members as directors under the terms of the stockholders agreement.
At any time after the earlier of (i) the elimination of the Class B common stock’s super-voting rights and (ii) the fifth anniversary of this offering, parties to the stockholders agreement holding at least two-thirds of the shares subject to the agreement may terminate it provided that the stockholders committee is no longer obligated to vote in favor of a director nominee who is a Class A common unit holder or a director nominee selected by the holders of a majority of the preferred units (other than us) and convertible preferred stock. Accordingly, for so long as the parties whose shares are subject to the stockholders agreement hold at least a majority of the combined voting power of our capital stock, the stockholders committee will be able to elect all of the members of our board of directors (subject to the obligation of the stockholders committee to vote in support of certain nominees as described above) and thereby control our management and affairs. Because each share of Class B common stock will initially entitle its holder to five votes, there may be situations where the stockholders committee controls our management and affairs even if the parties whose shares are subject to the stockholders agreement hold less than a majority of the number of outstanding shares of our capital stock.
Any transferee of shares of our Class B common stock that is subject to the stockholders agreement is required, as a condition to the transfer of such shares, to agree that such transferee shall be bound by the stockholders agreement and, as such, will grant an irrevocable voting proxy to the stockholders committee. In addition, in connection with this offering, we plan to adopt the 2013 Omnibus Incentive Compensation Plan, pursuant to which we expect to grant equity awards of or with respect to shares of our Class A common stock or common units of Artisan Partners Holdings. To the extent that we cause Artisan Partners Holdings to issue additional common units to our employees, those employees would be entitled to receive a corresponding number of shares of our Class B common stock (including if the common units awarded are subject to vesting). All of the shares of our common stock issued to employee-partners or other employees under this plan will be subject to the stockholders agreement. Shares held by an employee-partner or other employee will cease to be subject to the stockholders agreement upon termination of employment.
Tax Consequences
As the general partner of Artisan Partners Holdings, we will incur U.S. federal, state and local income taxes on our allocable share of any of its net taxable income. Under the terms of its amended and restated limited partnership agreement, Artisan Partners Holdings will be obligated to distribute to us and its other partners cash payments for the purpose of funding tax obligations in respect of the taxable income and net capital gain that is allocated to us and them, respectively, as partners of Artisan Partners Holdings. These cash payments for the purpose of funding tax obligations shall be treated as an advance on amounts otherwise distributable to us and other recipients of such cash payments. See “—Offering Transactions—Amended and Restated Limited Partnership Agreement of Artisan Partners Holdings”.
Tax Receivable Agreements
Pursuant to the exchange agreement described above, from time to time we may be required to acquire common or preferred units of Artisan Partners Holdings from their holders upon exchange for shares of our Class A common stock or shares of our convertible preferred stock and the cancellation of an equal number of shares of our Class B or Class C common stock, as the case may be. In addition, we will acquire preferred units as a result of the H&F Corp Merger. Artisan Partners Holdings had an election under Section 754 of the Internal Revenue Code in effect for prior taxable years in which (i) distributions from Artisan Partners Holdings were made; and (ii) transfers and exchanges of partnership interests occurred, and intends to have such election in effect for future taxable years in which exchanges of limited partnership units occur. Pursuant to the Section 754 election, certain prior distributions on, and transfers and exchanges of, partnership interests resulted in, and each future exchange of limited partnership units is expected to result in, an increase in the tax basis of tangible and
-71-
Table of Contents
intangible assets of Artisan Partners Holdings. When we acquire partnership units from existing partners, we expect that both the existing basis and the anticipated basis adjustments will increase (for tax purposes) depreciation and amortization deductions allocable to us from Artisan Partners Holdings and therefore reduce the amount of income tax we would otherwise be required to pay in the future. This increase in tax basis may also decrease gain (or increase loss) on future dispositions of certain capital assets to the extent increased tax basis is allocated to those capital assets.
We intend to enter into two tax receivable agreements. One tax receivable agreement, which we will enter into with each holder of convertible preferred stock issued as consideration for the H&F Corp Merger, will generally provide for the payment by us to such stockholders of 85% of the amount of cash savings, if any, in U.S. federal and state income tax that we actually realize (or are deemed to realize in certain circumstances) in periods after this offering as a result of (i) existing tax basis in Artisan Partners Holdings’ assets with respect to the preferred units acquired by us in the merger that arose from certain prior distributions by Artisan Partners Holdings and prior purchases of partnership interests by H&F Corp, (ii) any net operating losses available to us as a result of the H&F Corp Merger, and (iii) tax benefits related to imputed interest deemed to be paid by us as a result of this tax receivable agreement.
The second tax receivable agreement, which we will enter into with each holder of common and preferred units, will generally provide for the payment by us to each of them of 85% of the amount of the cash savings, if any, in U.S. federal and state income tax that we actually realize (or are deemed to realize in certain circumstances) in periods after this offering as a result of (i) any step-up in tax basis in Artisan Partners Holdings’ assets resulting from (a) the redemption of limited partnership units of Artisan Partners Holdings in connection with this offering and future exchanges of limited partnership units (along with the corresponding shares of our Class B or Class C common stock) for shares of our Class A common stock or convertible preferred stock and (b) payments under this tax receivable agreement, (ii) certain prior distributions by Artisan Partners Holdings and prior transfers or exchanges of partnership interests which resulted in tax basis adjustments to the assets of Artisan Partners Holdings and (iii) tax benefits related to imputed interest deemed to be paid by us as a result of this tax receivable agreement.
For purposes of these tax receivable agreements, cash savings in tax are calculated by comparing our actual income tax liability to the amount we would have been required to pay had we not been able to utilize any of the tax benefits subject to the tax receivable agreements, unless certain assumptions apply, as discussed herein. The term of the tax receivable agreements will commence upon the completion of this offering and will continue until all such tax benefits have been utilized or expired, unless we exercise our rights to terminate the agreements or payments under the agreements are accelerated in the event that we materially breach any of our material obligations under the agreements (as described below). The actual increase in tax basis, as well as the amount and timing of any payments under these agreements, will vary depending upon a number of factors, including the timing of exchanges by the holders of limited partnership units, the price of our Class A common stock or the value of our convertible preferred stock, as the case may be, at the time of the exchange, the extent to which such exchanges are taxable, the amount and timing of the taxable income we generate in the future and the tax rate then applicable and the portion of our payments under the tax receivable agreements constituting imputed interest or depreciable or amortizable basis.
We expect that the payments we will be required to make under the tax receivable agreements will be substantial. Assuming no material changes in the relevant tax law and that we earn sufficient taxable income to realize all tax benefits that are subject to the tax receivable agreements, we expect that the reduction in tax payments for us associated with (i) the merger, (ii) the redemption of common units from certain of our initial outside investors with a portion of the net proceeds of this offering and (iii) future exchanges of partnership units as described above would aggregate approximately $ over 15 years from the date of this offering based on an assumed price of $ per share of our Class A common stock (the midpoint of the price range set forth on the cover of this prospectus) and assuming all future exchanges, other than the redemptions in connection with this offering, would occur one year after this offering. Under such scenario we would be required to pay the
-72-
Table of Contents
holders of limited partnership units 85% of such amount, or $ , over the 15-year period from the date of this offering. The actual amounts may materially differ from these hypothetical amounts, as potential future reductions in tax payments for us and tax receivable agreement payments by us will be calculated using the market value of the shares at the time of exchange and the prevailing tax rates applicable to us over the life of the tax receivable agreements and will be dependent on us generating sufficient future taxable income to realize the benefit. Payments under the tax receivable agreements are not conditioned on our existing owners’ continued ownership of us.
In addition, although we are not aware of any issue that would cause the IRS to challenge the tax basis increases or other benefits arising under the tax receivable agreements, the beneficiaries of the tax receivable agreements will not reimburse us for any payments previously made if such basis increases or other benefits are subsequently disallowed, except that excess payments made to any beneficiary will be netted against payments otherwise to be made, if any, to such beneficiary after our determination of such excess. As a result, in such circumstances, we could make payments under the tax receivable agreement that are greater than our actual cash tax savings.
The tax receivable agreements provide that (i) upon certain mergers, asset sales, other forms of business combinations or other changes of control, (ii) in the event that we materially breach any of our material obligations under the agreements, whether as a result of failure to make any payment within six months of when due (provided we have sufficient funds to make such payment), failure to honor any other material obligation required thereunder or by operation of law as a result of the rejection of the agreements in a bankruptcy or otherwise, or (iii) if, at any time, we elect an early termination of the agreements, our (or our successor’s) obligations under the agreements (with respect to all units, whether or not units have been exchanged or acquired before or after such transaction) would be based on certain assumptions, including that our taxable income for purposes of calculating amounts due under the agreements would be no less than certain minimum levels. Furthermore, in the event we elect to terminate the agreements (as described in clause (iii) above) or we materially breach a material obligation (as described in clause (ii) above), our obligations under the agreements will accelerate. As a result, (i) we could be required to make payments under the tax receivable agreements that are greater than or less than the specified percentage of the actual benefits we realize in respect of the tax attributes subject to the agreements and (ii) if we materially breach a material obligation under the agreements or if we elect to terminate the agreements early, we would be required to make an immediate payment equal to the present value of the anticipated future tax benefits, which payment may be made significantly in advance of the actual realization of such future benefits. In these situations, our obligations under the tax receivable agreements could have a substantial negative impact on our liquidity and could have the effect of delaying, deferring or preventing certain mergers, asset sales, other forms of business combinations or other changes of control. There can be no assurance that we will be able to finance our obligations under the tax receivable agreements. If we were to elect to terminate the tax receivable agreements immediately after this offering, based on an assumed price of $ per share of our Class A common stock (the midpoint of the price range set forth on the cover of this prospectus) and a discount rate equal to one-year LIBOR plus 100 basis points, we estimate that we would be required to pay $ in the aggregate under the tax receivable agreements.
Payments under the tax receivable agreements, if any, will be made pro rata among all tax receivable agreement holders entitled to payments on an annual basis to the extent we have sufficient taxable income to utilize the increased depreciation and amortization charges. The availability of sufficient taxable income to utilize the increased depreciation and amortization expense will not be determined until such time as the financial results for the year in question are known and tax estimates prepared, which typically occurs within 90 days after the end of the applicable calendar year. We expect to make payments under the tax receivable agreements, to the extent they are required, within 145 days after the end of the calendar year in which the increased depreciation and amortization expense was utilized. Interest on such payments will begin to accrue at a rate of from the due date (without extensions) of such tax return.
-73-
Table of Contents
The impact that the tax receivable agreements will have on our consolidated financial statements will be the establishment of a liability, which will be increased upon the exchanges of limited partnership units for our Class A common stock or convertible preferred stock, representing 85% of the estimated future tax benefits, if any, relating to the increase in tax basis associated with the preferred units we receive as a result of the H&F Corp Merger and other exchanges by holders of limited partnership units. Because the amount and timing of any payments will vary based on a number of factors (including the timing of future exchanges, the price of our Class A common stock or the value of our convertible preferred stock, as the case may be, at the time of any exchange, the extent to which such exchanges are taxable and the amount and timing of our income), depending upon the outcome of these factors, we may be obligated to make substantial payments pursuant to the tax receivable agreements. In light of the numerous factors affecting our obligation to make such payments, however, the timing and amount of any such actual payments are not certain at this time.
Decisions made by our existing owners in the course of running our business, such as with respect to mergers, asset sales, other forms of business combinations or other changes in control, may influence the timing and amount of payments that are received by an exchanging or selling existing owner under the tax receivable agreements. For example, the earlier disposition of assets following an exchange or acquisition transaction will generally accelerate payments under the tax receivable agreements and increase the present value of such payments, and the disposition of assets before an exchange or acquisition transaction will increase an existing owner’s tax liability without giving rise to any rights of an existing owner to receive payments under the tax receivable agreements.
Because of our structure, our ability to make payments under the tax receivable agreements is dependent on the ability of Artisan Partners Holdings to make distributions to us. The ability of Artisan Partners Holdings to make such distributions will be subject to, among other things, the applicable provisions of Delaware law that may limit the amount of funds available for distribution to its partners. To the extent that we are unable to make payments under the tax receivable agreement for any reason, such payments will be deferred and will accrue interest until paid.
-74-
Table of Contents
We estimate that the net proceeds from the sale of shares of our Class A common stock by us in this offering will be approximately $ million, or approximately $ million if the underwriters exercise in full their option to purchase additional shares of Class A common stock, based on an assumed initial public offering price of $ per share (the midpoint of the price range set forth on the cover of this prospectus), in each case after deducting assumed underwriting discounts and estimated offering expenses payable by us. We intend to use $ million of the net proceeds to repay all or a portion of the then-outstanding principal amount of any loans under our revolving credit agreement, $ million of the net proceeds to purchase an aggregate of Class A common units from certain of our initial outside investors, $ million to pay a portion of a $56 million cash incentive compensation payment due to certain of our portfolio managers, $ million to make a distribution of retained profits of Artisan Partners Holdings to its pre-offering partners and the balance for general corporate purposes, including working capital. Investors who purchase Class A common stock in this offering will not be entitled to a portion of the distribution of the retained profits. Pending the use of proceeds for general corporate purposes, we intend to invest that portion of the net proceeds in short-term money market and money-market equivalent securities.
Any outstanding loans under the revolving credit agreement will mature, and commitments will terminate, in August 2017. We currently intend to use $ million of the net proceeds of this offering to repay all or a portion of the then-outstanding loans under the revolving credit agreement. The proceeds of the outstanding loans under the revolving credit agreement were used, together with proceeds from our issuance of notes, to repay in August 2012 all of the outstanding principal amount of our previously existing term loan. Outstanding loans under the revolving credit agreement currently bear interest at a rate equal to, at our election, (i) LIBOR adjusted by a statutory reserve percentage plus an applicable margin ranging from 1.50% to 3.00%, depending on Artisan Partners Holdings’ leverage ratio (as defined in the agreement) or (ii) an alternate base rate equal to the highest of Citibank, N.A.’s prime rate, the federal funds effective rate plus 0.50% and the daily one-month LIBOR adjusted by a statutory reserve percentage plus 1.00%, plus an applicable margin ranging from 0.50% to 2.00%, depending on Artisan Partners Holdings’ leverage ratio (as defined in the agreement). Unused commitments under the revolving credit agreement bear interest at a rate that ranges from 0.175% to 0.625%, depending on Artisan Partners Holdings’ leverage ratio (as defined in the agreement).
A $1.00 change in the assumed initial public offering price will increase or decrease the net proceeds we receive by $ million.
-75-
Table of Contents
Dividend Policy
Following this offering, we intend to pay quarterly cash dividends and to consider each year payment of an additional special dividend. We expect that our first dividend will be paid in the (in respect of the ) and will be $ per share of our Class A common stock. We intend to fund our initial dividend, as well as any future dividends, from our portion of distributions made by Artisan Partners Holdings, from its available cash generated from operations. The holders of our Class B common stock and Class C common stock will not be entitled to any cash dividends in their capacity as stockholders, but will, in their capacity as holders of limited partnership units of Artisan Partners Holdings, generally participate on a pro rata basis in distributions by Artisan Partners Holdings.
The declaration and payment of all future dividends, if any, will be at the sole discretion of our board of directors. In determining the amount of any future dividends, our board of directors will take into account: (i) the financial results of Artisan Partners Holdings, (ii) our available cash, as well as anticipated cash requirements (including debt servicing), (iii) our capital requirements and the capital requirements of our subsidiaries (including Artisan Partners Holdings), (iv) contractual, legal, tax and regulatory restrictions on, and implications of, the payment of dividends by us to our stockholders or by our subsidiaries (including Artisan Partners Holdings) to us, including the obligation of Artisan Partners Holdings to make tax distributions to the holders of partnership units (including us) (v) general economic and business conditions and (vi) any other factors that our board of directors may deem relevant.
Upon consummation of this offering, we will have no material assets other than our ownership of partnership units of, and CVRs issued by, Artisan Partners Holdings and, accordingly, will depend on distributions from it to fund any dividends we may pay. We intend to cause Artisan Partners Holdings to distribute cash to its partners, including us, in an amount sufficient to cover dividends, if any, declared by us. If we do cause Artisan Partners Holdings to make such distributions, holders of Artisan Partners Holdings limited partnership units will be entitled to receive equivalent distributions on a pro rata basis.
Our dividend policy has certain risks and limitations, particularly with respect to liquidity. Although we expect to pay dividends according to our dividend policy, we may not pay dividends according to our policy, or at all, if, among other things, Artisan Partners Holdings is unable to make distributions to us as a result of its operating results, cash requirements and financial condition, the applicable laws of the State of Delaware (which may limit the amount of funds available for distribution), its compliance with covenants and financial ratios related to indebtedness (including the notes and the revolving credit agreement) and its other agreements with third parties. Our note purchase and revolving credit agreements contain covenants limiting Artisan Partners Holdings’ ability to make distributions if a default has occurred and is continuing or would result from such a distribution. See “Management’s Discussion and Analysis of Financial Condition and Results of Operations—Liquidity and Capital Resources”.
The terms of our convertible preferred stock prevent us from declaring or paying any dividend on our Class A common stock until we have paid to the convertible preferred stockholders an amount per share equal to the proceeds per preferred unit of any distributions we receive on the preferred units held by us plus the cumulative amount of any prior distributions made on the preferred units held by us which have not been paid to the convertible preferred stockholders, net of taxes, if any, payable by us on (without duplication) (i) allocations of taxable income related to such distributions and (ii) the distributions themselves, in each case in respect of the preferred units held by us. We intend to pay dividends on our convertible preferred stock promptly upon receipt of any distributions made on the preferred units of Artisan Partners Holdings that we hold in amounts sufficient to permit the declaration and payment of dividends on our Class A common stock.
Under Delaware General Corporation Law, we may only pay dividends from legally available surplus or, if there is no such surplus, out of our net profits for the fiscal year in which the dividend is declared and/or the
-76-
Table of Contents
preceding fiscal year. Surplus is defined as the excess of our total assets over the sum of our total liabilities plus the par value of our outstanding capital stock. Capital stock is defined as the aggregate of the par value of all issued capital stock. To the extent we do not have sufficient cash to pay dividends, we may decide not to pay dividends. By paying cash dividends rather than investing that cash in our future growth, we risk slowing the pace of our growth, or not having a sufficient amount of cash to fund our operations or unanticipated capital expenditures.
We are taxable as a corporation for U.S. federal income tax purposes and therefore holders of our Class A common stock will not be taxed directly on our earnings. Distributions of cash or other property that we pay to our stockholders will constitute dividends for U.S. federal income tax purposes to the extent paid from our current or accumulated earnings and profits (as determined under U.S. federal income tax rules). If the amount of a distribution by us to our stockholders exceeds our current and accumulated earnings and profits, such excess will be treated first as a tax-free return of capital to the extent of a holder’s basis in the Class A common stock and thereafter as capital gain.
Artisan Partners Holdings’ Historical Distributions
Artisan Partners Holdings is currently owned by its general partner and limited partners. All decisions regarding the amount and timing of distributions (other than in connection with certain capital events specified in the limited partnership agreement) currently are made by Artisan Partners Holdings’ general partner, with the approval of Artisan Partners Holdings’ Advisory Committee, in accordance with the terms of the limited partnership agreement and applicable law. The Advisory Committee, the membership of which includes representatives of the holders of Artisan Partners Holdings’ Class A common units and preferred units and AIC, will no longer exist following this offering.
Artisan Partners Holdings intends to distribute all of the retained profits of the partnership available for distribution as of the date of the closing of this offering, which is expected to be approximately $ million, to its pre-offering partners. Approximately $ million of the distribution will be made immediately prior to the reorganization, and the other approximately $ million of the distribution will be made following the closing of this offering with a portion of the net proceeds from this offering.
-77-
Table of Contents
The following table sets forth our cash and cash equivalents and our capitalization as of June 30, 2012:
| • | on an actual basis for Artisan Partners Holdings; and |
| • | on a pro forma basis for Artisan Partners Asset Management after giving effect to the transactions described under “Unaudited Pro Forma Consolidated Financial Information”, including the reorganization transactions, the distribution of retained profits and the application of the net proceeds from this offering. |
After the completion of the reorganization transactions, as the sole general partner of Artisan Partners Holdings, we will control its business and affairs and, therefore, consolidate its financial results with ours. In light of our employee-partners’ and other investors’ collective % limited partnership interest in Artisan Partners Holdings immediately after the reorganization and this offering, we will reflect their interests as a noncontrolling interest in our consolidated financial statements. As a result, our net income, after excluding that noncontrolling interest, will represent % of Artisan Partners Holdings’ net income, and similarly, outstanding shares of our Class A common stock will represent % of the outstanding partnership units of Artisan Partners Holdings. For more information on the pro forma impact of our reorganization, see “Unaudited Pro Forma Consolidated Financial Information”.
You should read the following table in conjunction with the consolidated financial statements and related notes, “Unaudited Pro Forma Consolidated Financial Information” and “Management’s Discussion and Analysis of Financial Condition and Results of Operations” appearing elsewhere in this prospectus.
| As of June 30, 2012 | ||||||||
| Actual Artisan Partners Holdings (unaudited) |
Pro Forma Artisan Partners Asset Management (unaudited) |
|||||||
| (dollars in millions except per share amounts) |
||||||||
| Cash and cash equivalents |
$ | 172.1 | $ | |||||
|
|
|
|
|
|||||
| Note payable |
289.4 | |||||||
| Temporary equity—redeemable Class C interest |
357.2 | |||||||
| Partners’ equity / stockholders’ permanent equity (deficit): |
||||||||
| Class A common stock, $0.01 par value per share, none authorized and outstanding on an actual basis, shares authorized and outstanding on a pro forma basis |
— | |||||||
| Class B common stock, $0.01 par value per share, none authorized and outstanding on an actual basis, shares authorized and outstanding on a pro forma basis |
— | |||||||
| Class C common stock, $0.01 par value per share, none authorized and outstanding on an actual basis, shares authorized and outstanding on a pro forma basis |
— | |||||||
| Convertible preferred stock, $0.01 par value per share, none authorized and outstanding on an actual basis, shares authorized and outstanding on a pro forma basis |
— | |||||||
| Partners’ equity (deficit) |
(655.9 | ) | ||||||
| Additional paid-in capital |
— | |||||||
| Retained earnings (deficit) |
— | |||||||
| Accumulated other comprehensive income (loss) |
1.3 | |||||||
| Treasury stock, at cost |
— | |||||||
| Artisan Partners Asset Management stockholders’ permanent equity (deficit) |
(654.6 | ) | ||||||
| Noncontrolling interests |
28.7 | |||||||
|
|
|
|
|
|||||
| Total permanent equity (deficit) |
(625.9 | ) | ||||||
|
|
|
|
|
|||||
| Total capitalization |
$ | 20.7 | $ | |||||
|
|
|
|
|
|||||
-78-
Table of Contents
If you invest in our Class A common stock, your interest will be diluted to the extent of the difference between the initial public offering price per share of our Class A common stock and the pro forma, as adjusted net tangible book value (deficit) per share of our Class A common stock immediately after this offering. Dilution results from the fact that the per share offering price of the Class A common stock is substantially in excess of the net tangible book value (deficit) per share attributable to the existing equity holders. Net tangible book value represents the amount of total tangible assets less total liabilities.
Pro forma, as adjusted net tangible book value (deficit) represents the amount of total tangible assets less total liabilities, after giving effect to the reorganization transactions and the distribution by Artisan Partners Holdings to its pre-offering partners of its retained profits as of the date of the closing of this offering. Pro forma, as adjusted net tangible book value (deficit) per share represents pro forma, as adjusted net tangible book value (deficit) divided by the number of shares of Class A common stock outstanding after giving effect to the reorganization transactions and assuming that (1) the holders of common units of Artisan Partners Holdings have exchanged all of their units for shares of our Class A common stock on a one-for-one basis and we have benefited from the resulting increase in tax basis, (2) the holders of preferred units of Artisan Partners Holdings have exchanged all of their units for shares of our convertible preferred stock on a one-for-one basis and we have benefited from the resulting increase in tax basis, (3) the holders of all shares of our convertible preferred stock have converted all of their shares into Class A common stock on a one-for-one basis and (4) the shares of restricted stock that we expect to issue to our non-employee directors in connection with this offering have vested.
After giving effect to the sale of shares of Class A common stock that we are offering at an assumed initial public offering price of $ per share (the midpoint of the price range set forth on the cover of this prospectus), the deduction of assumed underwriting discounts and estimated offering expenses payable by us and the use of the estimated net proceeds as described under “Use of Proceeds”, our pro forma, as adjusted net tangible book value (deficit) at June 30, 2012 was $ , or $ per share of Class A common stock.
The following table illustrates the immediate increase in pro forma net tangible book value (deficit) of $ per share for existing equity holders and the immediate dilution of $ per share to new stockholders purchasing Class A common stock in this offering, assuming the underwriters do not exercise their option to purchase additional shares.
| Assumed initial public offering price per share |
$ | |||||||
| Pro forma, as adjusted net tangible book value (deficit) per share as of June 30, 2012 |
$ | |||||||
| Increase in pro forma, as adjusted net tangible book value (deficit) per share attributable to new investors |
$ | |||||||
| Pro forma, as adjusted net tangible book value (deficit) per share after this offering |
$ | |||||||
|
|
|
|||||||
| Dilution in pro forma, as adjusted net tangible book value (deficit) per share to new investors |
$ |
The following table sets forth, on the same pro forma basis, as of June 30, 2012, the number of shares of Class A common stock purchased from us, the total consideration paid, or to be paid, and the average price per share paid, or to be paid, by existing equity holders and by the new investors, assuming that (1) the holders of common units of Artisan Partners Holdings have exchanged all of their units for shares of our Class A common stock on a one-for-one basis and we have benefited from the resulting increase in tax basis, (2) the holders of preferred units of Artisan Partners Holdings have exchanged all of their units for shares of our convertible
-79-
Table of Contents
preferred stock on a one-for-one basis and we have benefited from the resulting increase in tax basis and (3) the holders of all shares of our convertible preferred stock have converted all of their shares into Class A common stock on a one-for-one basis, before deducting estimated underwriting discounts payable by us:
| Shares Purchased | Total Consideration(1) | Average Price per Share |
||||||||||||||
| Number |
Percent | Amount | Percent | |||||||||||||
| Existing equity holders |
% | $ | — | — | $ | — | ||||||||||
| New investors |
% | $ | % | $ | ||||||||||||
| Total |
100 | % | $ | 100 | % | $ | ||||||||||
| (1) | Total consideration paid by existing equity holders has been set to zero, as our net tangible book value prior to this offering was a deficit. |
The table above gives effect to the issuance of shares of restricted stock that we expect to issue in connection with this offering to our non-employee directors.
If the underwriters exercise their option to purchase additional shares of Class A common stock in full:
| • | the pro forma percentage of shares of our Class A common stock held by existing equity holders will decrease to approximately % of the total number of pro forma shares of our Class A common stock outstanding after this offering; and |
| • | the pro forma number of shares of our Class A common stock held by new investors will increase to approximately % of the total pro forma shares of our Class A common stock outstanding after this offering. |
If the underwriters exercise their option to purchase additional shares of Class A common stock in full, pro forma, as adjusted net tangible book value would be approximately $ per share, representing an increase to existing equity holders of approximately $ per share, and there would be an immediate dilution of approximately $ per share to new investors.
A $1.00 increase (decrease) in the assumed initial public offering price of $ per share of Class A common stock (the midpoint of the price range set forth on the cover of this prospectus), would increase (decrease) total consideration paid by new investors in this offering and by all investors by $ million, and would increase (decrease) the average price per share paid by new investors by $ , and would increase (decrease) pro forma, as adjusted net tangible book value (deficit) per share by $ , assuming the number of shares of Class A common stock offered by us, as set forth on the cover page of this prospectus, remains the same and without deducting the estimated underwriting discounts payable by us in connection with this offering.
-80-
Table of Contents
UNAUDITED PRO FORMA CONSOLIDATED FINANCIAL INFORMATION
The following unaudited pro forma consolidated financial statements present the consolidated statements of operations and financial position of Artisan Partners Asset Management and subsidiaries, assuming that all of the transactions described below had been completed as of: (i) January 1, 2011 with respect to the unaudited pro forma consolidated statements of operations and (ii) June 30, 2012 with respect to the unaudited pro forma consolidated statement of financial position. The pro forma adjustments are based on available information and upon assumptions that our management believes are reasonable in order to reflect, on a pro forma basis, the impact of these transactions.
The pro forma adjustments principally give effect to the following transactions:
| • | the reorganization transactions described in “Our Structure and Reorganization”; |
| • | the grant of shares of restricted Class A common stock to our non-employee directors in connection with this offering, which generally vest over a one to five-year period; and |
| • | the sale of shares of our Class A common stock by us in this offering at an assumed offering price of $ per share (the midpoint of the price range set forth on the cover of this prospectus), and the application of $ million of the net proceeds to repay all or a portion of the then-outstanding principal amount of any loans under our revolving credit agreement, $ million of the net proceeds to purchase an aggregate of Class A common units (and cancellation of the corresponding shares of Class C common stock) from certain of the Class A limited partners, $ million of the net proceeds to make a distribution of retained profits and $ million to pay a portion of a $56 million cash incentive compensation payment due to certain of our portfolio managers. |
The unaudited pro forma consolidated financial information reflects the manner in which we will account for these transactions. Specifically, we will account for the reorganization transactions by which Artisan Partners Asset Management will become the general partner of Artisan Partners Holdings as a transaction between entities under common control pursuant to ASC 805. Accordingly, after the reorganization, Artisan Partners Asset Management will reflect the assets and liabilities of Artisan Partners Holdings at their carryover basis. We will account for the H&F Corp Merger as an exchange of equity investment of equal value, and the convertible preferred stock, as well as the preferred units of Artisan Partners Holdings, as permanent equity. We will account for the CVRs as derivative liabilities under ASC 815.
We have not made any pro forma adjustments to our general and administrative expense, or any of our other expense items, relating to reporting, compliance or investor relations costs, or other incremental costs that we may incur as a public company, including costs relating to compliance with Section 404 of Sarbanes-Oxley.
Future exchanges of common or preferred units of Artisan Partners Holdings for shares of our Class A common stock or convertible preferred stock pursuant to the exchange agreement will be recorded at existing carrying value.
The unaudited pro forma consolidated financial information is included for informational purposes only and does not purport to reflect our statement of operations or financial position that would have occurred had we operated as a public company during the periods presented. The unaudited pro forma consolidated financial information should not be relied upon as being indicative of our statement of operations or financial position had the transactions contemplated in connection with the reorganization and this offering been completed on the dates assumed. The unaudited pro forma consolidated financial information also does not project the statement of operations or financial position for any future period or date.
-81-
Table of Contents
UNAUDITED PRO FORMA CONSOLIDATED STATEMENT OF OPERATIONS
For the Year Ended December 31, 2011
| Artisan Partners Holdings Historical |
Reorganiza- tion and Other Pro Forma Adjustments |
As Adjusted Before Offering |
Offering | Artisan Partners Asset Management Pro Forma |
||||||||||||||||
| (dollars in millions, except per share amounts) | ||||||||||||||||||||
| Revenues |
||||||||||||||||||||
| Management fees |
||||||||||||||||||||
| Artisan Funds & Artisan Global Funds |
$ | 305.2 | $ | — | $ | 305.2 | $ | — | $ | 305.2 | ||||||||||
| Separate accounts |
145.8 | — | 145.8 | — | 145.8 | |||||||||||||||
| Performance fees |
4.1 | — | 4.1 | — | 4.1 | |||||||||||||||
|
|
|
|
|
|
|
|
|
|
|
|||||||||||
| Total revenues |
455.1 | — | 455.1 | — | 455.1 | |||||||||||||||
| Operating expenses |
||||||||||||||||||||
| Compensation and benefits |
||||||||||||||||||||
| Salaries, incentive compensation and benefits |
198.6 | — | 198.6 | — | 198.6 | |||||||||||||||
| Distributions on Class B liability awards |
55.7 | (a) | — | — | ||||||||||||||||
| Change in value of Class B liability awards |
(21.1 | ) | (a) | — | — | |||||||||||||||
| Equity-based compensation—Pre-IPO grants |
— | (b) | (c) | |||||||||||||||||
|
|
|
|
|
|
|
|
|
|
|
|||||||||||
| Total compensation and benefits |
233.2 | |||||||||||||||||||
| Distribution and marketing |
26.2 | — | 26.2 | — | 26.2 | |||||||||||||||
| Occupancy |
9.0 | — | 9.0 | — | 9.0 | |||||||||||||||
| Communication and technology |
10.6 | — | 10.6 | — | 10.6 | |||||||||||||||
| General and administrative |
21.8 | — | 21.8 | — | 21.8 | |||||||||||||||
|
|
|
|
|
|
|
|
|
|
|
|||||||||||
| Total operating expenses |
300.8 | |||||||||||||||||||
|
|
|
|
|
|
|
|
|
|
|
|||||||||||
| Operating income |
154.3 | |||||||||||||||||||
| Non-operating income (loss) |
||||||||||||||||||||
| Interest expense |
(18.4 | ) | — | (18.4 | ) | (d) | ||||||||||||||
| Net gain (loss) of consolidated investment products |
(3.1 | ) | — | (3.1 | ) | — | (3.1 | ) | ||||||||||||
| Other income (loss) |
(1.6 | ) | — | (1.6 | ) | — | (1.6 | ) | ||||||||||||
|
|
|
|
|
|
|
|
|
|
|
|||||||||||
| Total non-operating income (loss) |
(23.1 | ) | — | (23.1 | ) | |||||||||||||||
|
|
|
|
|
|
|
|
|
|
|
|||||||||||
| Income before income taxes |
131.2 | |||||||||||||||||||
| Provision for income taxes |
1.2 | (e) | (e) | |||||||||||||||||
|
|
|
|
|
|
|
|
|
|
|
|||||||||||
| Income from continuing operations before nonrecurring charges directly attributable to the transaction |
130.0 | |||||||||||||||||||
| Less: Net income attributable to noncontrolling interests |
(3.1 | ) | (f) | (f) | ||||||||||||||||
|
|
|
|
|
|
|
|
|
|
|
|||||||||||
| Net income attributable to Artisan Partners Asset Management |
$ | 133.1 | $ | $ | $ | $ | ||||||||||||||
|
|
|
|
|
|
|
|
|
|
|
|||||||||||
| Basic net income per share attributable to Artisan Partners Asset Management Class A common stockholders |
$ | |||||||||||||||||||
| Diluted net income per share attributable to Artisan Partners Asset Management Class A common stockholders |
$ | |||||||||||||||||||
| Shares used in basic net income per share |
(g) | |||||||||||||||||||
| Shares used in diluted net income per share |
(h) | |||||||||||||||||||
The accompanying notes are an integral part of these unaudited pro forma consolidated financial statements.
-82-
Table of Contents
UNAUDITED PRO FORMA CONSOLIDATED STATEMENT OF OPERATIONS
For the Six Months Ended June 30, 2012
| Artisan Partners Holdings Historical |
Reorganiza- tion and Other Pro Forma Adjustments |
As Adjusted Before Offering |
Offering | Artisan Partners Asset Management Pro Forma |
||||||||||||||||
| (dollars in millions, except per share amounts) | ||||||||||||||||||||
| Revenues |
||||||||||||||||||||
| Management fees |
||||||||||||||||||||
| Artisan Funds & Artisan Global Funds |
$ | 160.3 | $ | — | $ | 160.3 | $ | — | $ | 160.3 | ||||||||||
| Separate accounts |
79.9 | — | 79.9 | — | 79.9 | |||||||||||||||
| Performance fees |
0.3 | — | 0.3 | — | 0.3 | |||||||||||||||
|
|
|
|
|
|
|
|
|
|
|
|||||||||||
| Total revenues |
240.5 | — | 240.5 | — | 240.5 | |||||||||||||||
|
|
|
|
|
|
|
|
|
|
|
|||||||||||
| Operating expenses |
||||||||||||||||||||
| Compensation and benefits |
||||||||||||||||||||
| Salaries, incentive compensation and benefits |
109.3 | — | 109.3 | — | 109.3 | |||||||||||||||
| Distributions on Class B liability awards |
21.9 | (a | ) | — | — | |||||||||||||||
| Change in value of Class B liability awards |
29.9 | (a | ) | — | — | |||||||||||||||
| Equity-based compensation—Pre-IPO grants |
— | (b | ) | (c | ) | |||||||||||||||
|
|
|
|
|
|
|
|
|
|
|
|||||||||||
| Total compensation and benefits |
161.1 | |||||||||||||||||||
| Distribution and marketing |
14.2 | — | 14.2 | — | 14.2 | |||||||||||||||
| Occupancy |
4.5 | — | 4.5 | — | 4.5 | |||||||||||||||
| Communication and technology |
6.4 | — | 6.4 | — | 6.4 | |||||||||||||||
| General and administrative |
8.4 | — | 8.4 | — | 8.4 | |||||||||||||||
|
|
|
|
|
|
|
|
|
|
|
|||||||||||
| Total operating expenses |
194.6 | |||||||||||||||||||
|
|
|
|
|
|
|
|
|
|
|
|||||||||||
| Operating income |
45.9 | |||||||||||||||||||
| Non-operating income (loss) |
||||||||||||||||||||
| Interest expense |
(5.2 | ) | — | (5.2 | ) | (d | ) | |||||||||||||
| Net gain (loss) of consolidated investment products |
1.5 | — | 1.5 | — | 1.5 | |||||||||||||||
| Other income |
(0.1 | ) | — | (0.1 | ) | — | (0.1 | ) | ||||||||||||
|
|
|
|
|
|
|
|
|
|
|
|||||||||||
| Total non-operating income (loss) |
(3.8 | ) | — | (3.8 | ) | |||||||||||||||
|
|
|
|
|
|
|
|
|
|
|
|||||||||||
| Income before income taxes |
42.1 | |||||||||||||||||||
| Provision for income taxes |
0.6 | (e | ) | (e | ) | |||||||||||||||
|
|
|
|
|
|
|
|
|
|
|
|||||||||||
| Income from continuing operations before nonrecurring charges directly attributable to the transaction |
41.5 | |||||||||||||||||||
| Less: Net income attributable to noncontrolling interests |
1.5 | (f | ) | (f | ) | |||||||||||||||
|
|
|
|
|
|
|
|
|
|
|
|||||||||||
| Net income attributable to Artisan Partners Asset Management |
$ | 40.0 | $ | $ | $ | $ | ||||||||||||||
|
|
|
|
|
|
|
|
|
|
|
|||||||||||
| Basic net income per share attributable to Artisan Partners Asset Management Class A common and convertible preferred stockholders |
$ | |||||||||||||||||||
| Diluted net income per share attributable to Artisan Partners Asset Management Class A common and convertible preferred stockholders |
$ | |||||||||||||||||||
| Shares used in basic net income per share |
(g | ) | ||||||||||||||||||
| Shares used in diluted net income per share |
(h | ) | ||||||||||||||||||
The accompanying notes are an integral part of these unaudited pro forma consolidated financial statements.
-83-
Table of Contents
Notes to Unaudited Pro Forma Consolidated Statement of Operations
For the Year Ended December 31, 2011 and the Six Months Ended June 30, 2012
| (a) | Under the existing Class B grant agreements, Artisan Partners Holdings is required to redeem all of its Class B common units upon the termination of employment of the holders of Class B common units. Historically Artisan Partners Holdings recorded the Class B limited partnership interests as a liability and recognized compensation expense for the change in the value of the awards, even after the awards were fully vested. As part of the reorganization transactions, we will amend the Class B grant agreements to eliminate the cash redemption feature. Accordingly, we will no longer record as compensation expense distributions to the Class B limited partners, or redemptions or changes in the value of Class B common units. |
| (b) | As discussed in footnote (a) above, the Class B grant agreements will be amended to eliminate the cash redemption feature as part of the reorganization transactions. As a result, liability award accounting will no longer apply with respect to the Class B common units. We will record compensation expense for the fair value of the unvested awards of Class B common units at the amendment date over the remaining vesting period. Assuming an initial offering price of $ per share of Class A common stock (the midpoint of the price range set forth on the cover of this prospectus), the total value of unvested Class B common units as of the close of this offering will be $ million. This adjustment represents the compensation expense that would be recorded related to these awards if the amendment had occurred on January 1, 2011. |
As part of the reorganization transactions, we will also recognize a one-time expense as a result of the amendment of these awards based on the difference between the carrying value of the liability associated with the vested Class B common units immediately prior to the offering and the value based on the offering price per share of Class A common stock. Assuming an initial offering price of $ per share of our Class A common stock (the midpoint of the price range set forth on the cover of this prospectus), the amount of this one-time charge will be $ million. We have not included the impact of this charge in the pro forma consolidated statement of operations because the adjustment only occurs in the year of the offering and not thereafter.
| (c) | In connection with this offering, we expect to grant shares of restricted Class A common stock to our non-employee directors, all of which will vest over a one to five-year period. The value, in the aggregate, of these awards will be approximately $ million, assuming an initial offering price of $ per share of our Class A common stock (the midpoint of the price range set forth on the cover of this prospectus). This adjustment represents the increase in compensation expense associated with these awards. |
| (d) | Represents the elimination of the historical interest expense associated with the $ million of principal amount drawn under Artisan Partners Holdings’ revolving credit facility that will be repaid with a portion of the net proceeds of this offering. |
| (e) | Represents the impact of foreign, U.S. federal and U.S. state income taxes that Artisan Partners Asset Management will incur as a C-corporation on the pass through of income from Artisan Partners Holdings to the corporation for its allocable portion of the income of Artisan Partners Holdings. Our business was historically organized as a partnership and was not subject to U.S. federal and certain U.S. state income taxes. |
-84-
Table of Contents
The effective rate of pro forma income tax is estimated to be approximately % at December 31, 2011 and % at June 30, 2012, and was determined by combining projected federal, state and local income taxes. The pro forma effective tax rate is impacted by % at December 31, 2011 and % at June 30, 2012 by non-deductible compensation expense associated with the vesting of partnership units and % by the noncontrolling interest. Absent these items, the pro forma effective tax rate, on the portion of income owned by the corporation, would be %. The provision for corporate income taxes has been computed as follows:
| For the Year Ended December 31, 2011 |
For the Six Months Ended June 30, 2012 |
|||||||
| (dollars in millions) | ||||||||
| Income before income taxes and income attributable to noncontrolling interests |
$ | $ | ||||||
| Less: |
||||||||
| Net income attributable to noncontrolling interests |
||||||||
|
|
|
|
|
|||||
| Artisan Partners Asset Management net income |
||||||||
|
|
|
|
|
|||||
| Provision for corporate income taxes |
$ | $ | ||||||
|
|
|
|
|
|||||
| (f) | The common and preferred units owned by the partners (other than Artisan Partners Asset Management) of Artisan Partners Holdings will be considered noncontrolling interests for financial accounting purposes. The amount allocated to noncontrolling interests represents the proportional interest in the pro forma income of Artisan Partners Holdings owned by those partners ( % on a pro forma basis after the reorganization transactions and % after the offering). |
| (g) | Based on assumed issuance of shares of our Class A common stock in connection with this offering. |
| (h) | Assumes the dilutive potential of shares from grants of restricted Class A common stock is for the year ended December 31, 2011 and for the six months ended June 30, 2012. |
-85-
Table of Contents
UNAUDITED PRO FORMA CONSOLIDATED STATEMENT OF FINANCIAL CONDITION As of June 30, 2012
| Artisan Partners Holdings Actual |
Reorganization and Other Pro Forma Adjustments |
As Adjusted Before Offering |
Offering | Artisan Partners Asset Management Pro Forma |
||||||||||||||||
| (dollars in millions) | ||||||||||||||||||||
| Assets |
||||||||||||||||||||
| Cash and cash equivalents |
$ | 172.1 | $ | (a) | $ | $ | (a) | $ | ||||||||||||
|
|
|
(h) (i) (j) (k) |
||||||||||||||||||
| Cash and cash equivalents of consolidated investment products |
7.9 | — | 7.9 | — | 7.9 | |||||||||||||||
| Accounts receivable |
43.1 | — | 43.1 | — | 43.1 | |||||||||||||||
| Investment securities |
18.5 | — | 18.5 | — | 18.5 | |||||||||||||||
| Investment securities of consolidated investment products |
28.6 | — | 28.6 | — | 28.6 | |||||||||||||||
| Prepaid expenses |
3.7 | — | 3.7 | — | 3.7 | |||||||||||||||
| Debt issuance costs |
0.7 | — | 0.7 | — | 0.7 | |||||||||||||||
| Property and equipment, net |
6.2 | — | 6.2 | — | 6.2 | |||||||||||||||
| Deferred tax assets |
— | (b | ) | (b | ) | |||||||||||||||
| (b | ) | (b | ) | |||||||||||||||||
| Restricted cash |
1.0 | — | 1.0 | — | 1.0 | |||||||||||||||
| Other |
1.0 | — | 1.0 | (l | ) | |||||||||||||||
|
|
|
|
|
|
|
|
|
|
|
|||||||||||
| Total assets |
$ | 282.8 | $ | $ | $ | $ | ||||||||||||||
|
|
|
|
|
|
|
|
|
|
|
|||||||||||
| Liabilities and stockholders’ equity (deficit) |
||||||||||||||||||||
| Accounts payable, accrued expenses, and other liabilities |
12.6 | — | 12.6 | — | 12.6 | |||||||||||||||
| Accrued incentive compensation |
50.3 | — | 50.3 | — | 50.3 | |||||||||||||||
| Amounts payable under tax receivable agreements |
— | (b | ) | (b | ) | |||||||||||||||
| Deferred lease obligations |
3.0 | — | 3.0 | — | 3.0 | |||||||||||||||
| Interest rate swap |
1.1 | — | 1.1 | — | 1.1 | |||||||||||||||
| Note payable |
289.4 | — | 289.4 | (i | ) | |||||||||||||||
| Class B liability awards |
171.8 | (c | ) | — | — | |||||||||||||||
| Contingent value right liability |
— | (d | ) | — | ||||||||||||||||
| Class B redemptions payable |
15.4 | — | 15.4 | — | 15.4 | |||||||||||||||
| Payables of consolidated investment products |
1.5 | — | 1.5 | — | 1.5 | |||||||||||||||
| Securities sold, not yet purchased of consolidated investment products |
6.4 | — | 6.4 | — | 6.4 | |||||||||||||||
|
|
|
|
|
|
|
|
|
|
|
|||||||||||
| Total liabilities |
551.5 | |||||||||||||||||||
| Temporary equity—Redeemable Class C interest |
357.2 | (e | ) | — | — | |||||||||||||||
| Partners’/Stockholders’ permanent equity (deficit) |
||||||||||||||||||||
| Partners’ deficit |
(655.9 | ) | (f | ) | — | — | ||||||||||||||
| Common stock |
||||||||||||||||||||
| Class A common stock |
— | — | — | (h | ) | |||||||||||||||
| Class B common stock |
— | (f | ) | — | ||||||||||||||||
| Class C common stock |
— | (f | ) | — | ||||||||||||||||
| Convertible preferred stock |
— | (f | ) | — | ||||||||||||||||
| Additional paid-in capital |
— | (f | ) | (h | ) | |||||||||||||||
| (c | ) | (b | ) | |||||||||||||||||
| (d | ) | (g | ) | |||||||||||||||||
| (c | ) | (l | ) | |||||||||||||||||
| (b | ) | |||||||||||||||||||
| (g | ) | |||||||||||||||||||
| Retained earnings (deficit) |
— | (f | ) | (617.1 | ) | (a | ) | |||||||||||||
| (a | ) | (k | ) | |||||||||||||||||
| (c | ) | |||||||||||||||||||
| Accumulated other comprehensive income (loss) |
1.3 | — | 1.3 | — | 1.3 | |||||||||||||||
|
|
|
|
|
|
|
|
|
|
|
|||||||||||
| Total partners’/stockholders’ permanent equity (deficit) |
(654.6 | ) | ||||||||||||||||||
|
|
|
|
|
|
|
|
|
|
|
|||||||||||
| Noncontrolling interest |
28.7 | (g | ) | (g | ) | |||||||||||||||
| Total equity (deficit) |
(268.7 | ) | ||||||||||||||||||
|
|
|
|
|
|
|
|
|
|
|
|||||||||||
| Total liabilities, temporary equity and permanent equity (deficit) |
$ | 282.8 | $ | $ | $ | $ | ||||||||||||||
|
|
|
|
|
|
|
|
|
|
|
|||||||||||
The accompanying notes are an integral part of these unaudited pro forma consolidated financial statements.
-86-
Table of Contents
Notes to Unaudited Pro Forma Consolidated Statement of Financial Position
As of June 30, 2012
| (a) | Represents a distribution by Artisan Partners Holdings to its pre-offering partners of retained profits in the aggregate amount of $ million. |
We calculate retained profits as net income, excluding equity-based compensation expenses, cumulative distributions paid and debt principal payments. The aggregate amount includes retained profits of $ million as of June 30, 2012 and an estimated additional amount representing undistributed profits through 2012, the estimated closing date of this offering. The actual amount of the total distribution will vary depending on the actual closing date of the offering.
In these pro forma financial statements, the distribution of retained profits consists of a distribution to the pre-offering partners of approximately $ million in connection with the reorganization transactions immediately before the closing of this offering and a second distribution of approximately $ million. The second distribution will be funded with a portion of the net proceeds from this offering. The actual amount of the second distribution will be an estimate of our undistributed profits through the closing date of this offering and will be equal to (i) our actual undistributed profits as of the most recent month-end for which the information is available (the “baseline month”), less (ii) the aggregate amount of any distributions of profits made since the end of the baseline month, plus (iii) an estimate of our undistributed profits from the end of the baseline month through the date of the closing of this offering (the “estimate period”) equal to (x) our average daily assets under management for the estimate period, multiplied by (y) our weighted average fee rate for the baseline month, multiplied by (z) our average net pre-tax income margin percentage (excluding equity-based compensation expenses) for the 12-month period ended at the end of the baseline month.
| (b) | Reflects the recognition of deferred tax assets resulting from (i) our status, following the reorganization transactions, as a C-corporation, (ii) the H&F Corp Merger, (iii) the redemption of Class A common units from certain of our initial outside investors and (iv) the recognition of tax liabilities related to our tax receivable agreements. |
Under the tax receivable agreement associated with the H&F Corp Merger, we generally will be required to pay to each of the holders of convertible preferred stock issued as consideration for the H&F Corp Merger 85% of the applicable cash savings, if any, in U.S. federal and state income tax that we actually realize as a result of the tax attributes of the units we acquire in the merger. Under the tax receivable agreement associated with the exchange of partnership units for Class A common stock or convertible preferred stock, we will be required to pay to each of the holders of limited partnership units of Artisan Partners Holdings 85% of the applicable cash savings, if any, in U.S. federal and state income tax that we actually realize as a result of certain tax attributes of their units exchanged or that are created as a result of the exchanges of their units.
The pro forma deferred tax asset adjustment is based on an assumed share price of $ (the midpoint of the price range set forth on the cover of this prospectus) and an incremental tax rate of %. The pro forma adjustment for the amounts payable under the tax receivable agreements represents 85% of the asset subject to the tax receivable agreements. The net deferred tax asset is shown as an increase to paid-in capital within the pro forma statement of financial condition. Any payments made under the tax receivable agreements may give rise to additional tax benefits and additional potential payments under the tax receivable agreements.
The deferred tax asset relating to, and the amount payable under, the tax receivable agreement related to the H&F Corp Merger are $ million and $ million, respectively. The deferred tax asset relating to, and the amount payable under, the tax receivable agreement related to the exchange of partnership units into Class A common stock are $ million and $ million, respectively, assuming an initial public offering price of $ per share of our Class A common stock and the redemption by Artisan Partners Holdings of Class A common units. The computation of the deferred tax asset takes into account additional tax benefits and additional potential payments triggered by payments made under the tax receivable agreements.
-87-
Table of Contents
In determining the future realization of the potential tax benefits associated with the H&F Corp Merger and the redemption of Class A common units, we have assumed our future taxable income remains consistent with our actual results for the fiscal year ended December 31, 2011. As such, we assumed no growth in assets under management and projected that we will be able to fully realize the potential tax benefits of both transactions.
The computation of the total deferred tax benefit is as follows:
| Amount (dollars in millions) |
||||
| Fair value of Class A common units to be redeemed by Artisan Partners Holdings, assuming an initial public offering price of $ per share of our Class A common stock |
$ | |||
| Assumed future effective tax rate |
% | |||
|
|
|
|||
| Tax deduction |
||||
| Deferred tax assets related to the H&F Corp Merger |
||||
| Additional deferred tax assets |
||||
|
|
|
|||
| Total deferred tax asset |
$ | |||
|
|
|
|||
We anticipate that we will account for the income tax effects and corresponding tax receivable agreement effects resulting from future taxable exchanges of partnership units by limited partners of Artisan Partners Holdings for shares of our Class A common stock or convertible preferred stock by recognizing an increase in our deferred tax assets, based on enacted tax rates at the date of the exchange. Further, we will evaluate the likelihood that we will realize the benefit represented by the deferred tax asset and, to the extent that we estimate that it is more likely than not that we will not realize the benefit, we will reduce the carrying amount of the deferred tax asset with a valuation allowance. We expect to record the estimated amount of the increase in deferred tax assets, net of any valuation allowance, directly in paid-in capital, offset by the liability for the expected amount we will pay the limited partners who have exchanged partnership units under the tax receivable agreement (85% of the actual reduction in tax payments), estimated using assumptions consistent with those used in estimating the net deferred tax assets. Therefore, at the date of an exchange of partnership units for shares of our Class A common stock or convertible preferred stock, the net effect of the accounting for income taxes and the tax receivable agreement on our financial statements will be a net increase to paid-in capital of 15% of the estimated realizable tax benefit. The effect of subsequent changes in any of our estimates after the date of the exchange will be included in net income. Similarly, the effect of changes in enacted tax rates and in applicable tax laws will be included in net income. It is possible that future transactions or events could increase or decrease the actual tax benefits realized and the corresponding tax receivable payments from these tax attributes. Future deferred tax assets or amounts payable by us resulting from either of the tax receivable agreements discussed above would be in addition to amounts related to the reorganization transactions.
| (c) | As discussed in the notes to the Unaudited Pro Forma Consolidated Statement of Operations, as part of the reorganization transactions we will amend the Class B grant agreements, resulting in, among other things, the elimination of the redemption feature associated with the Class B common units. This adjustment represents the elimination of the liability associated with the redemption feature. |
As part of the reorganization transactions, we will also recognize a one-time expense of $ million as a result of the modification of these Class B awards based on the difference between the carrying value of the liability associated with the vested Class B common units immediately prior to the offering and the value based on the offering price per share of Class A common stock. This adjustment reflects the impact on retained earnings of the additional compensation expense. This one-time expense results in an increase in the redemption liability associated with the Class B common units. As a result of the amendment of the Class B grant agreements, this increase in the liability is eliminated.
| (d) | As part of the reorganization transactions, Artisan Partners Holdings will issue partnership CVRs to the H&F holders who will hold preferred units of Artisan Partners Holdings, and Artisan Partners Asset |
-88-
Table of Contents
| Management will issue public company CVRs to the H&F holders who will hold shares of Artisan Partners Asset Management’s convertible preferred stock. The terms of the CVRs are discussed under “Offering Transactions—Contingent Value Rights”. The CVRs will be accounted for as derivative liabilities under ASC 815 and therefore will be recorded on our Statement of Financial Position at fair value. Changes in the fair value each period will be recorded in our earnings. |
This adjustment represents the estimated initial fair value of the CVRs. A barrier bear put spread option pricing model was utilized to determine the fair value of the CVRs. The model factors are the “upper barrier” (where the price of our Class A common stock would result in termination of the CVRs), a “lower barrier” (where the price of our Class A common stock would indicate an inability to fund payment on the CVRs), the maximum payment on the CVRs of $ million and the CVR test date of July 3, 2016. Material assumptions include the volatility of the underlying Class A common stock, expected dividends of the underlying Class A common stock and the discount rate. The fair value of the CVRs is an estimate of our initial liability with respect to the CVRs. This value will change over time as assumptions utilized in the model change.
| (e) | Due to the redemption feature of the preferred units of Artisan Partners Holdings prior to the reorganization, such units were accounted for as temporary equity. As part of the reorganization transactions, the redemption feature will be eliminated, and the preferred units will be reclassified to permanent equity. |
| (f) | As a C-Corporation, we will no longer record a partners’ deficit in the Statement of Financial Condition. To reflect the C-Corporation structure of our equity, we will separately present the value of our capital stock, additional paid-in capital and retained earnings. |
The portion of partners’ deficit reclassified to Class B common stock, Class C common stock and convertible preferred stock represents the par value of the following shares issued as part of the reorganization transactions:
| • | shares of Class B common stock, par value $0.01 per share, issued to the holders of Class B common units of Artisan Partners Holdings; |
| • | shares of Class C common stock, par value $0.01 per share, issued to the holders of Class A common units, Class D common units and preferred units of Artisan Partners Holdings; and |
| • | shares of convertible preferred stock, par value $0.01 per share, issued in the H&F Corp Merger. |
The portion of the reclassification of partners’ deficit associated with additional paid-in capital was determined by taking the permanent capital contributions we have received of $4.7 million less the purchase price of limited partnership interests from our non-employee partners of $ million and the $ million classified to the common stock.
The portion of the reclassification of partners’ deficit associated with retained earnings represents cumulative earnings less the purchase price of limited partnership interests from employee-partners and cumulative distributions paid.
| (g) | The common and preferred units owned by the limited partners of Artisan Partners Holdings will be considered noncontrolling interests for financial accounting purposes. The amount allocated to noncontrolling interests represents the proportional interest in the pro forma net assets of Artisan Partners Holdings owned by those partners ( % on a pro forma basis after the reorganization transactions and % after the offering). |
| (h) | Represents the issuance of shares of our Class A common stock, par value $0.01 per share, including (i) the par value of the Class A common stock, (ii) the additional paid in capital representing the gross proceeds less the amount attributable to the par value and (iii) the deduction from additional paid in capital of $ million related to the underwriting discount. The gross proceeds are based on an assumed offering price of $ per share (the midpoint of the range set forth on the cover of this prospectus). |
| (i) | Represents the repayment of $ million of indebtedness outstanding under Artisan Partners Holdings’ revolving credit agreement with a portion of the net proceeds of this offering. |
-89-
Table of Contents
| (j) | Represents the redemption of approximately Class A common units of Artisan Partners Holdings with a portion of the net proceeds of this offering. |
| (k) | Represents the payment of bonuses in the aggregate amount of $56 million to certain of our portfolio managers in connection with this offering. We have not included the impact of this charge in the pro forma consolidated statement of operations because the adjustment only occurs in the year of the offering and not thereafter. |
| (l) | Represents $ million in previously incurred offering expenses associated with the offering that we had capitalized and included in Other assets on our Statement of Financial Position. These costs will be offset against the proceeds and reclassified as additional paid-in capital. |
-90-
Table of Contents
SELECTED HISTORICAL CONSOLIDATED FINANCIAL DATA
The following tables set forth selected historical consolidated financial data of Artisan Partners Holdings as of the dates and for the periods indicated. The selected consolidated statements of operations data for the years ended December 31, 2011, 2010 and 2009, and the consolidated statements of financial condition data as of December 31, 2011 and 2010 have been derived from Artisan Partners Holdings’ audited consolidated financial statements included elsewhere in this prospectus. The selected consolidated statements of operations data for the six months ended June 30, 2012 and 2011 and the consolidated statement of financial condition as of June 30, 2012 have been derived from Artisan Partners Holdings’ unaudited consolidated financial statements included elsewhere in this prospectus. These unaudited consolidated financial statements have been prepared on substantially the same basis as our audited consolidated financial statements and include all adjustments that we consider necessary for a fair statement of our consolidated results of operations and financial condition for the periods and as of the dates presented therein. Our results for the six months ended June 30, 2012 may not be indicative of our results for a full fiscal year. The selected consolidated statements of operations data for the years ended December 31, 2008 and 2007 and the consolidated statements of financial condition data as of December 31, 2009, 2008 and 2007 have been derived from Artisan Partners Holdings’ audited consolidated financial statements not included in this prospectus.
You should read the following selected historical consolidated financial data together with “Management’s Discussion and Analysis of Financial Condition and Results of Operations” and the historical consolidated financial statements and the related notes included elsewhere in this prospectus.
| Six Months Ended June 30, (unaudited) |
Year Ended December 31, | |||||||||||||||||||||||||||
| 2012 | 2011 | 2011 | 2010 | 2009 | 2008 | 2007 | ||||||||||||||||||||||
| (dollars in millions) | ||||||||||||||||||||||||||||
| Statements of Operations Data: |
||||||||||||||||||||||||||||
| Revenues |
||||||||||||||||||||||||||||
| Management fees |
||||||||||||||||||||||||||||
| Artisan Funds & Artisan Global Funds |
$ | 160.3 | $ | 157.3 | $ | 305.2 | $ | 261.6 | $ | 197.2 | $ | 249.8 | $ | 307.2 | ||||||||||||||
| Separate accounts |
79.9 | 75.3 | 145.8 | 117.8 | 95.5 | 103.5 | 123.7 | |||||||||||||||||||||
| Performance fees |
0.3 | 0.6 | 4.1 | 2.9 | 3.5 | 3.7 | 3.1 | |||||||||||||||||||||
|
|
|
|
|
|
|
|
|
|
|
|
|
|
|
|||||||||||||||
| Total revenues |
240.5 | 233.2 | 455.1 | 382.3 | 296.2 | 357.0 | 434.0 | |||||||||||||||||||||
| Operating expenses |
||||||||||||||||||||||||||||
| Compensation and fringe benefits |
||||||||||||||||||||||||||||
| Salaries, incentive compensation and benefits |
109.3 | 103.9 | 198.6 | 166.6 | 132.9 | 147.0 | 171.7 | |||||||||||||||||||||
| Distributions on Class B liability awards |
21.9 | 48.0 | 55.7 | 17.6 | 2.5 | 57.9 | 56.9 | |||||||||||||||||||||
| Change in value of Class B liability awards |
29.9 | (6.7 | ) | (21.1 | ) | 79.1 | 41.8 | (108.9 | ) | 34.5 | ||||||||||||||||||
|
|
|
|
|
|
|
|
|
|
|
|
|
|
|
|||||||||||||||
| Total compensation and benefits |
161.1 | 145.2 | 233.2 | 263.3 | 177.2 | 96.0 | 263.1 | |||||||||||||||||||||
| Distribution and marketing |
14.2 | 13.4 | 26.2 | 23.0 | 17.8 | 20.1 | 24.2 | |||||||||||||||||||||
| Occupancy |
4.5 | 4.4 | 9.0 | 8.1 | 8.0 | 7.1 | 5.4 | |||||||||||||||||||||
| Communication and technology |
6.4 | 4.9 | 10.6 | 9.9 | 10.1 | 14.3 | 10.5 | |||||||||||||||||||||
| General and administrative |
8.4 | 8.1 | 21.8 | 12.8 | 10.0 | 10.6 | 10.4 | |||||||||||||||||||||
|
|
|
|
|
|
|
|
|
|
|
|
|
|
|
|||||||||||||||
| Total operating expenses |
194.6 | 176.0 | 300.8 | 317.1 | 223.1 | 148.1 | 313.6 | |||||||||||||||||||||
|
|
|
|
|
|
|
|
|
|
|
|
|
|
|
|||||||||||||||
| Operating income (loss) |
45.9 | 57.2 | 154.3 | 65.2 | 73.1 | 208.9 | 120.4 | |||||||||||||||||||||
| Non-operating income (loss) |
||||||||||||||||||||||||||||
| Interest expense |
(5.2 | ) | (12.4 | ) | (18.4 | ) | (23.0 | ) | (24.9 | ) | (26.5 | ) | (27.9 | ) | ||||||||||||||
| Net gain (loss) of consolidated investment products |
1.5 | — | (3.1 | ) | — | — | — | — | ||||||||||||||||||||
| Other income (loss) |
(0.1 | ) | — | (1.6 | ) | 1.6 | — | 0.9 | 2.8 | |||||||||||||||||||
|
|
|
|
|
|
|
|
|
|
|
|
|
|
|
|||||||||||||||
| Total non-operating income (loss) |
(3.8 | ) | (12.4 | ) | (23.1 | ) | (21.4 | ) | (24.9 | ) | (25.6 | ) | (25.1 | ) | ||||||||||||||
|
|
|
|
|
|
|
|
|
|
|
|
|
|
|
|||||||||||||||
| Income (loss) before income taxes |
42.1 | 44.8 | 131.2 | 43.8 | 48.2 | 183.3 | 95.3 | |||||||||||||||||||||
| Provision for income taxes |
0.6 | 0.6 | 1.2 | 1.3 | — | — | — | |||||||||||||||||||||
|
|
|
|
|
|
|
|
|
|
|
|
|
|
|
|||||||||||||||
| Net income (loss) before noncontrolling interests |
41.5 | 44.2 | 130.0 | — | — | — | — | |||||||||||||||||||||
| Less: Net gain (loss) attributable to noncontrolling interests |
1.5 | — | (3.1 | ) | — | — | — | — | ||||||||||||||||||||
|
|
|
|
|
|
|
|
|
|
|
|
|
|
|
|||||||||||||||
| Net income (loss) attributable to Artisan Partners Holdings LP |
$ | 40.0 | $ | 44.2 | $ | 133.1 | $ | 42.5 | $ | 48.2 | $ | 183.3 | $ | 95.3 | ||||||||||||||
|
|
|
|
|
|
|
|
|
|
|
|
|
|
|
|||||||||||||||
-91-
Table of Contents
| As
of June 30, (unaudited) |
As of December 31, | |||||||||||||||||||||||
| 2012 | 2011 | 2010 | 2009 | 2008 | 2007 | |||||||||||||||||||
| (dollars in millions) | ||||||||||||||||||||||||
| Statement of Financial Condition Data: |
||||||||||||||||||||||||
| Cash and cash equivalents |
$ | 172.1 | $ | 127.0 | $ | 159.0 | $ | 101.8 | $ | 35.9 | $ | 66.3 | ||||||||||||
| Total assets |
282.8 | 224.9 | 209.9 | 145.7 | 71.6 | 117.7 | ||||||||||||||||||
| Note payable(1) |
289.4 | 324.8 | 380.0 | 400.0 | 400.0 | 400.5 | ||||||||||||||||||
| Total liabilities |
551.5 | 508.8 | 589.3 | 545.7 | 509.0 | 610.6 | ||||||||||||||||||
| Temporary equity—redeemable Class C interest(2) |
357.2 | 357.2 | 357.2 | 357.2 | 357.2 | 357.2 | ||||||||||||||||||
| Total permanent equity (deficit) |
$ | (625.9 | ) | $ | (641.1 | ) | $ | (736.6 | ) | $ | (757.2 | ) | $ | (794.6 | ) | $ | (850.1 | ) | ||||||
| (1) | In August 2012, we issued $200 million in unsecured notes and entered into a $100 million five-year revolving credit agreement. We used the proceeds of the notes and $90 million drawn from the revolving credit facility to prepay all of the then-outstanding principal amount of our $400 million term loan. We currently intend to repay all or a portion of the then-outstanding principal amount of any loans under our revolving credit agreement with a portion of the net proceeds of this offering. |
| (2) | Under the terms of Artisan Partners Holdings’ limited partnership agreement in effect prior to the reorganization transactions, the holders of the preferred units have a right to put such units to the partnership on July 3, 2016 under certain circumstances. |
One of the financial measures our management uses to evaluate the profitability and efficiency of our business model is adjusted operating margin, which is not presented in accordance with GAAP. Until we complete the reorganization transactions and this offering, the Class B common units held by our employee-partners are classified under GAAP as liability awards, and we are required to recognize as compensation expense distributions of profits to our employee-partners, amounts paid in connection with redemptions of Class B common units from former employee-partners, and marked-to-market changes in the value of Class B common units. After we complete the reorganization transactions and this offering, Class B common units of Artisan Partners Holdings will be classified as equity awards and those amounts will no longer be recognized as compensation expense. As a result of that change in accounting classification, the expense related to equity-based compensation recognized in our pre-offering periods will not be comparable to the expense related to equity-based compensation we expect to recognize after this offering.
We compute our adjusted operating margin by adding to operating income (thereby effectively excluding) the expenses we recognize for equity-based compensation, which includes distributions to the Class B partners of Artisan Partners Holdings, redemptions of Class B common units and changes in the value of Class B liability awards, and then dividing that sum by total revenues for the applicable period. Even after completion of the reorganization transactions and this offering, we will continue to calculate adjusted operating margin by excluding all expense associated with Class B common units that were granted prior to this offering. Adjusted operating margin may be different from non-GAAP measures used by other companies.
-92-
Table of Contents
The following table shows our adjusted operating margin for the six months ended June 30, 2012 and 2011 and the years ended December 31, 2011, 2010, 2009, 2008 and 2007 as well as a reconciliation of our adjusted operating margin with GAAP operating margin for the periods presented:
| Six Months Ended June 30, (unaudited) |
Year Ended December 31, | |||||||||||||||||||||||||||
| 2012 | 2011 | 2011 | 2010 | 2009 | 2008 | 2007 | ||||||||||||||||||||||
| (dollars in millions) | ||||||||||||||||||||||||||||
| GAAP operating income |
$ | 45.9 | $ | 57.2 | $ | 154.3 | $ | 65.2 | $ | 73.1 | $ | 208.9 | $ | 120.4 | ||||||||||||||
| Distributions on Class B liability awards |
21.9 | 48.0 | 55.7 | 17.6 | 2.5 | 57.9 | 56.9 | |||||||||||||||||||||
| Change in value of Class B liability awards |
29.9 | (6.7 | ) | (21.1 | ) | 79.1 | 41.8 | (108.9 | ) | 34.5 | ||||||||||||||||||
|
|
|
|
|
|
|
|
|
|
|
|
|
|
|
|||||||||||||||
| Adjusted operating income |
$ | 97.7 | $ | 98.5 | $ | 188.9 | $ | 161.9 | $ | 117.4 | $ | 157.9 | $ | 211.8 | ||||||||||||||
| Total revenues |
$ | 240.5 | $ | 233.2 | $ | 455.1 | $ | 382.3 | $ | 296.2 | $ | 357.0 | $ | 434.0 | ||||||||||||||
| GAAP operating margin |
19.1 | % | 24.5 | % | 33.9 | % | 17.1 | % | 24.7 | % | 58.5 | % | 27.7 | % | ||||||||||||||
| Adjusted operating margin |
40.6 | % | 42.2 | % | 41.5 | % | 42.3 | % | 39.6 | % | 44.2 | % | 48.8 | % | ||||||||||||||
| Selected Unaudited Operating Data: |
||||||||||||||||||||||||||||
| Assets under management(1) |
$ | 64,072 | $ | 63,645 | $ | 57,104 | $ | 57,459 | $ | 46,788 | $ | 30,577 | $ | 55,468 | ||||||||||||||
| Net client cash flows(2) |
2,758 | 2,012 | 1,960 | 3,410 | 2,556 | (1,783 | ) | (2,875 | ) | |||||||||||||||||||
| Market appreciation (depreciation)(3) |
$ | 4,210 | $ | 4,174 | $ | (2,315 | ) | $ | 7,261 | $ | 13,655 | $ | (23,108 | ) | $ | 7,440 | ||||||||||||
| (1) | Reflects the dollar value of assets we managed for our clients in our strategies as of the last day of the period. |
| (2) | Reflects the dollar value of assets our clients placed with us for management, and withdrew from our management, during the period, excluding appreciation (depreciation) due to market performance and fluctuations in exchange rates. |
| (3) | Represents the appreciation (depreciation) of the value of our assets under management during the period due to market performance and fluctuations in exchange rates, as well as income, such as dividends, earned on assets under management. |
-93-
Table of Contents
MANAGEMENT’S DISCUSSION AND ANALYSIS OF FINANCIAL CONDITION
AND RESULTS OF OPERATIONS
The following discussion contains forward-looking statements that involve risks and uncertainties. Our actual results could differ materially from those anticipated in these forward-looking statements for many reasons, including the factors described under the caption “Risk Factors” and elsewhere in this prospectus. The following discussion and analysis should be read in conjunction with the consolidated financial statements and related notes included elsewhere in this prospectus.
The historical financial data discussed below reflect the historical results of operations and financial condition of Artisan Partners Holdings LP and its consolidated subsidiaries and do not give effect to our reorganization. See “Our Structure and Reorganization” and “Unaudited Pro Forma Consolidated Financial Information” included elsewhere in this prospectus for a description of our reorganization and its effect on our historical results of operations.
Overview
We are an independent investment management firm that provides a broad range of 12 equity investment strategies spanning different market capitalization segments and investing styles in both U.S. and non-U.S. markets. We offer our investment management capabilities primarily to institutions and through intermediaries that operate with institutional-like decision-making processes and have longer-term investment horizons. We manage separate accounts for pension and profit sharing plans, trusts, endowments, foundations, charitable organizations, governmental entities, investment companies and similar pooled investment vehicles, and also provide investment management and administrative services to Artisan Funds, an SEC-registered family of mutual funds. Our operations are based principally in the United States, but we are expanding our operations outside the United States.
As of June 30, 2012, we had $64.1 billion in assets under management. We derive essentially all of our revenues from investment management fees. Our fees are based on a specified percentage of clients’ average assets under management, except for a limited number of institutional separate account clients with which we have a fee arrangement that has a component based on our investment performance for that client. We have a single operating segment.
The historical results of operations discussed in this Management’s Discussion and Analysis of Financial Condition and Results of Operations are those of Artisan Partners Holdings and its consolidated subsidiaries. After the completion of the reorganization transactions, as the sole general partner of Artisan Partners Holdings, we will control its business and affairs and, therefore, consolidate its financial results with ours. In light of our employee-partners’ and other investors’ collective % equity interest in Artisan Partners Holdings immediately after the reorganization and this offering, we will reflect their interests as a noncontrolling interest in our consolidated financial statements. As a result, our net income, after excluding that noncontrolling interest, will represent % of Artisan Partners Holdings’ net income and, similarly, outstanding shares of our Class A common stock will represent % of the outstanding equity interests of Artisan Partners Holdings. For more information on the pro forma impact of our reorganization, see “Unaudited Pro Forma Consolidated Financial Information”.
A significant portion of our historical compensation and benefits expense relates to the Class B common units granted to certain of our employees. The Class B common units, when granted, provided for an interest in future profits of Artisan Partners Holdings, as well as an interest in the overall appreciation or depreciation in the value of Artisan Partners Holdings from the date of grant. In connection with the reorganization transactions, the Class B common units of Artisan Partners Holdings will become exchangeable for shares of our Class A common stock and will no longer be redeemable for cash upon termination of employment.
-94-
Table of Contents
Key Performance Indicators
When we review our performance we focus on the indicators described below:
| For the Six Months Ended June 30, |
For the Year Ended December 31, |
|||||||||||||||||||
| 2012 | 2011 | 2011 | 2010 | 2009 | ||||||||||||||||
| (dollars in millions) | ||||||||||||||||||||
| Assets under management at period end |
$ | 64,072 | $ | 63,645 | $ | 57,104 | $ | 57,459 | $ | 46,788 | ||||||||||
| Average assets under management(1) |
$ | 63,263 | $ | 61,772 | $ | 59,436 | $ | 48,724 | $ | 36,918 | ||||||||||
| Net client cash flows |
$ | 2,758 | $ | 2,012 | $ | 1,960 | $ | 3,410 | $ | 2,556 | ||||||||||
| Total revenues |
$ | 240 | $ | 233 | $ | 455 | $ | 382 | $ | 296 | ||||||||||
| Weighted average fee(2) |
76 bps | 76 bps | 77 bps | 79 bps | 80 bps | |||||||||||||||
| Adjusted operating margin(3) |
40.6 | % | 42.2 | % | 41.5 | % | 42.3 | % | 39.6 | % | ||||||||||
| (1) | We compute average assets under management by averaging day-end assets under management for the applicable period. |
| (2) | We compute our weighted average fee by dividing annualized investment management fees by average assets under management for the applicable period. |
| (3) | We compute our adjusted operating margin by adding to operating income (thereby effectively excluding) the expenses we recognize for equity-based compensation, which includes distributions to the Class B partners of Artisan Partners Holdings, redemptions of Class B common units and changes in the value of Class B liability awards, and then dividing that sum by total revenues for the applicable period. Even after completion of the reorganization transactions and this offering, we will continue to calculate adjusted operating margin by excluding all expense associated with Class B common units that were granted prior to this offering. Adjusted operating margin may be different from non-GAAP measures used by other companies. |
We review our weighted average fee and adjusted operating margin to monitor progress with internal forecasts, understand the underlying business and compare our firm with others in our industry. The weighted average fee represents annualized investment management fees as a percentage of average assets under management for the applicable period, i.e., the amount of investment management fees we earn for each dollar of assets we manage. We use this information to evaluate the contribution to investment management fees of our investment products. Our weighted average fee for the periods shown has remained relatively consistent. We have historically been disciplined about maintaining our rates of fees, and our fees generally have been higher than those of many of our competitors. Over time, industry-wide fee pressure could cause us to reduce our fees.
-95-
Table of Contents
One of the financial measures our management uses to evaluate the profitability and efficiency of our business model is adjusted operating margin, which is not presented in accordance with GAAP. Until we complete the reorganization transactions and this offering, the Class B common units held by our employee-partners are classified under GAAP as liability awards, and we are required to recognize as compensation expense distributions of profits to our employee-partners, amounts paid in connection with redemptions of Class B common units from former employee-partners, and marked-to-market changes in the value of Class B common units. After we complete the reorganization transactions and this offering, Class B common units of Artisan Partners Holdings will be classified as equity awards and those amounts will no longer be recognized as compensation expense. As a result of that change in accounting classification, the expense related to equity-based compensation recognized in our pre-offering periods will not be comparable to the expense related to equity-based compensation we expect to recognize after this offering. We believe that adjusted operating margin is helpful in more clearly highlighting trends in our business that may not otherwise be apparent when relying solely on GAAP operating margin because it excludes from our results specific financial items relating to equity compensation and our current partnership structure that have less bearing on our operating performance. The following table reconciles our adjusted operating margin with GAAP operating margin for the periods presented:
| For the Six Months Ended June 30, (unaudited) |
For the Year Ended December 31, |
|||||||||||||||||||
| 2012 | 2011 | 2011 | 2010 | 2009 | ||||||||||||||||
| (dollars in millions) | ||||||||||||||||||||
| GAAP operating income |
$ | 45.9 | $ | 57.2 | $ | 154.3 | $ | 65.2 | $ | 73.1 | ||||||||||
| Distributions on Class B liability awards |
21.9 | 48.0 | 55.7 | 17.6 | 2.5 | |||||||||||||||
| Change in value of Class B liability awards |
29.9 | (6.7 | ) | (21.1 | ) | 79.1 | 41.8 | |||||||||||||
|
|
|
|
|
|
|
|
|
|
|
|||||||||||
| Adjusted operating income |
$ | 97.7 | $ | 98.5 | $ | 188.9 | $ | 161.9 | $ | 117.4 | ||||||||||
| Total revenues |
$ | 240.5 | $ | 233.2 | $ | 455.1 | $ | 382.3 | $ | 296.2 | ||||||||||
| GAAP operating margin |
19.1 | % | 24.5 | % | 33.9 | % | 17.1 | % | 24.7 | % | ||||||||||
| Adjusted operating margin |
40.6 | % | 42.2 | % | 41.5 | % | 42.3 | % | 39.6 | % | ||||||||||
Financial Overview
Assets Under Management and Investment Management Fees
Our assets under management increase or decrease with the net inflows or outflows of assets into our various investment strategies and with the investment performance of these strategies. In order to increase our assets under management and expand our business, we must continue to offer investment strategies that suit the investment needs of our clients and generate attractive returns over the long term. The amount and composition of our assets under management are, and will continue to be, influenced by a variety of factors including, among others:
| • | investment performance, including fluctuations in both the financial markets and foreign currency exchange rates and the quality of our investment decisions; |
| • | flows of client assets into and out of our investment products; |
| • | the composition of assets under management among our various strategies and investment vehicles; |
| • | our decision to close strategies or limit the growth of assets in a strategy when we believe it is in the best interests of our clients; |
| • | our ability to educate our clients and potential clients about our investment strategies and provide our clients with exceptional client service; |
| • | our ability to attract and retain qualified investment, management and marketing and client service professionals; |
| • | competitive conditions in the investment management and broader financial services sectors; and |
| • | investor sentiment and confidence. |
-96-
Table of Contents
Changes to our operating results from one period to another are primarily caused by changes in the value of our assets under management. Changes in the relative composition of our assets under management among our investment strategies and products and the effective fee rates on our products could also impact our operating results, and in some periods the impact could be material. However, for the six months ended June 30, 2012 and 2011 and the years ended December 31, 2011, 2010 and 2009, our operating results were not materially impacted by such changes.
We monitor the availability of attractive investment opportunities relative to the amount of assets we manage in each of our investment strategies. When appropriate, we are willing to close a strategy to new investors or otherwise take action to slow or restrict its growth, even though our aggregate assets under management may be negatively impacted in the short term. We believe that our willingness to restrict the growth of assets under management in our strategies is important to protecting the interests of our clients and, in the long term, enables us to retain client assets and maintain our fee schedules and profit margins. When we close a strategy, we typically continue to allow additional investments in the strategy by existing clients and certain related entities, which means that during a given period we could have net client cash inflows even in a closed strategy. However, when a strategy is closed or its growth is restricted we expect there to be periods of net client cash outflows. We closed our U.S. Small-Cap Growth, U.S. Mid-Cap Value, U.S. Small-Cap Value, U.S. Mid-Cap Growth and Non-U.S. Small-Cap Growth strategies to most new investors and client relationships at various points in time prior to January 1, 2009. Since January 1, 2009, we have taken the following actions:
| • | U.S. Small-Cap Growth: we reopened this strategy in October 2009. |
| • | U.S. Mid-Cap Value: we reopened this strategy to separate account clients for the period between January 2007 and October 2009. In July 2009 we closed this strategy to most new mutual fund clients, and in January 2010 we closed the strategy to all new mutual fund investors. |
| • | Non-U.S. Value: we closed this strategy to most new separate account clients in December 2010 and to most mutual fund clients in March 2011. |
The primary drivers of inflows and outflows of client assets are our investment performance and the extent to which we have acted to slow the growth of our assets under management in a strategy, as described above. Our distribution efforts are targeted at institutional investors and intermediaries that operate with institutional-like decision-making processes and have longer-term investment horizons. In our experience, those investors typically (although not always) require that an investment manager have a performance track record of three to five years (depending on the strategy) placing the manager in the top quartile of the relevant comparative performance universe in that strategy as a minimum qualification to be considered for a new mandate. As a result, our experience has been that growth in our assets under management in a new strategy is typically modest during the first three to five years of the strategy’s operation but accelerates after that three to five years of operation, provided that our investment performance is superior to the threshold level required for consideration. Following periods during which investment performance did not meet that standard, we have found that client cash flows have been stagnant or negative.
Although we have outperformed, on a gross and net basis, the relevant benchmarks in 11 of our 12 investment strategies since their inception, we also have had periods in each strategy in which we have underperformed those relevant benchmarks and have suffered periods of stagnant or negative client cash flows following such periods of underperformance. One of the benefits of a diverse range of investment strategies is that periods of stagnant or negative cash flows in one strategy may be offset by periods of net cash inflows in other strategies. During 2008, we had negative net client cash flows. However, during that period, we had only two investment strategies that were open to all or most new investors and had at least a three-year performance track record. During 2009, 2010 and 2011, our Non-U.S. Growth, Global Value, Value Equity, Global Opportunities and Emerging Markets strategies were open throughout the period, and our Non-U.S. Value and Global Equity strategies were open for parts of the period, and we enjoyed net client cash inflows of more than $2.5 billion, $3.4 billion and $1.9 billion, respectively.
-97-
Table of Contents
Our clients access our investment strategies through mutual funds and separate accounts, which include mutual funds and non-U.S. funds we sub-advise, as well as collective investment trusts, which pool retirement plan assets together in a single portfolio maintained by a bank or trust company and are managed by us on a separate account basis. The following table sets forth the changes in our assets under management under our advisory agreements with Artisan Funds and Artisan Global Funds and in the separate accounts that we managed from December 31, 2007 to June 30, 2012:
| As % of Assets Under Management |
||||||||||||||||||||
| Assets Under Management |
Artisan Funds & Artisan Global Funds |
Separate Accounts |
Total | Artisan Funds & Artisan Global Funds |
Separate Accounts |
|||||||||||||||
| (dollars in millions) | ||||||||||||||||||||
| As of December 31, 2007 |
$ | 33,396 | $ | 22,072 | $ | 55,468 | 60 | % | 40 | % | ||||||||||
| Gross client cash inflows |
6,637 | 3,452 | 10,089 | |||||||||||||||||
| Gross client cash outflows |
8,619 | 3,253 | 11,872 | |||||||||||||||||
| Net client cash flows |
(1,982 | ) | 199 | (1,783 | ) | |||||||||||||||
| Market appreciation (depreciation) |
(13,925 | ) | (9,183 | ) | (23,108 | ) | ||||||||||||||
| Transfers between investment vehicles |
(279 | ) | 279 | — | ||||||||||||||||
|
|
|
|
|
|
|
|||||||||||||||
| As of December 31, 2008 |
17,210 | 13,367 | 30,577 | 56 | % | 44 | % | |||||||||||||
| Gross client cash inflows |
7,278 | 3,048 | 10,326 | |||||||||||||||||
| Gross client cash outflows |
5,215 | 2,555 | 7,770 | |||||||||||||||||
| Net client cash flows |
2,063 | 493 | 2,556 | |||||||||||||||||
| Market appreciation (depreciation) |
7,531 | 6,124 | 13,655 | |||||||||||||||||
| Transfers between investment vehicles |
(160 | ) | 160 | — | ||||||||||||||||
|
|
|
|
|
|
|
|||||||||||||||
| As of December 31, 2009 |
26,644 | 20,144 | 46,788 | 57 | % | 43 | % | |||||||||||||
| Gross client cash inflows |
7,524 | 5,722 | 13,246 | |||||||||||||||||
| Gross client cash outflows |
6,718 | 3,118 | 9,836 | |||||||||||||||||
| Net client cash flows |
806 | 2,604 | 3,410 | |||||||||||||||||
| Market appreciation (depreciation) |
3,917 | 3,344 | 7,261 | |||||||||||||||||
| Transfers between investment vehicles |
— | — | — | |||||||||||||||||
|
|
|
|
|
|
|
|||||||||||||||
| As of December 31, 2010 |
31,367 | 26,092 | 57,459 | 55 | % | 45 | % | |||||||||||||
| Gross client cash inflows |
8,809 | 5,201 | 14,010 | |||||||||||||||||
| Gross client cash outflows |
7,896 | 4,154 | 12,050 | |||||||||||||||||
| Net client cash flows |
913 | 1,047 | 1,960 | |||||||||||||||||
| Market appreciation (depreciation) |
(1,226 | ) | (1,089 | ) | (2,315 | ) | ||||||||||||||
| Transfers between investment vehicles |
(211 | ) | 211 | — | ||||||||||||||||
|
|
|
|
|
|
|
|||||||||||||||
| As of December 31, 2011 |
30,843 | 26,261 | 57,104 | 54 | % | 46 | % | |||||||||||||
| Gross client cash inflows |
6,133 | 2,617 | 8,750 | |||||||||||||||||
| Gross client cash outflows |
4,051 | 1,941 | 5,992 | |||||||||||||||||
| Net client cash flows |
2,082 | 676 | 2,758 | |||||||||||||||||
| Market appreciation (depreciation) |
2,147 | 2,063 | 4,210 | |||||||||||||||||
| Transfers between investment vehicles |
(128 | ) | 128 | — | ||||||||||||||||
|
|
|
|
|
|
|
|||||||||||||||
| As of June 30, 2012 |
$ | 34,944 | $ | 29,128 | $ | 64,072 | 55 | % | 45 | % | ||||||||||
|
|
|
|
|
|
|
|||||||||||||||
The different fee structures associated with Artisan Funds, Artisan Global Funds and separate accounts and the different fee schedules of our investment strategies make the composition of our assets under management an important determinant of the investment management fees we earn. Historically, we have received higher effective rates of investment management fees from Artisan Funds and Artisan Global Funds than from our separate accounts, reflecting, among other things, the different array of services we provide to Artisan Funds and Artisan Global Funds. Our investment management fees also differ by investment strategy, with our newer, higher-capacity strategies having lower standard fee schedules than our older strategies which in some cases have or had more limited capacity.
-98-
Table of Contents
Artisan Funds and Artisan Global Funds
We serve as the investment adviser to Artisan Funds, an SEC-registered family of 12 mutual funds that offers no-load, open-end share classes designed to meet the needs of a range of institutional and other investors. Each of the 12 mutual funds corresponds to one of our 12 investment strategies. As of June 30, 2012, Artisan Funds comprised $34.6 billion, or 54%, of our assets under management. For the six months ended June 30, 2012, fees from Artisan Funds represented $159.1 million, or 66%, of our revenues.
Artisan Funds shares are not listed on an exchange. These funds issue new shares for purchase and redeem shares from those shareholders who sell. The share price for purchases and redemptions of each of these funds’ shares is each fund’s net asset value per share, which is calculated at the end of each business day. The assets of each Artisan Fund, and therefore our assets under management, vary as a result of market appreciation and depreciation, the level of purchases or redemptions of fund shares and distributions, net of reinvestments, by each fund. We earn investment management fees, which are based on the average daily net assets of each Artisan Fund and paid monthly, for serving as investment adviser to these funds. Our fee rates for the series of Artisan Funds range from 0.64% to 1.25% of fund assets, depending on the strategy, the amount invested and other factors. Each Artisan Fund’s fee schedule includes breakpoints at which a lower rate of fee is applied to assets above the breakpoint level, except Artisan International Small Cap Fund, which was closed to most new investors at a relatively small asset level, and Artisan Emerging Markets Fund, which enjoys a fee schedule that we believe starts at a lower level than would be appropriate if there were breakpoints in its fee schedule.
Although retail investors can invest directly in the series of Artisan Funds that remain open to new investors, most of the investors in Artisan Funds are institutions or have invested in Artisan Funds through intermediaries that operate with institutional-like decision-making processes.
We also serve as the investment manager and promoter of Artisan Global Funds, a family of Ireland-based UCITS funds organized pursuant to the European Union’s Undertaking for Collective Investment in Transferable Securities, also referred to as UCITS. For serving as investment adviser to Artisan Global Funds, we earn investment management fees based on the average daily net assets of each fund and paid monthly. Artisan Global Funds began operations in the first quarter of 2011 and offers shares to non-U.S. investors. As of June 30, 2012, Artisan Global Funds comprised $298.9 million, or less than 1%, of our assets under management. In UCITS funds, it is permissible and in some circumstances customary for a portion of the management fee to be rebated to investors with accounts of a certain type or asset size, to encourage investment at an early stage, or for other reasons. Our fee rates for Artisan Global Funds range from 0.85% to 0.95% of assets under management. For the six months ended June 30, 2012, fees from Artisan Global Funds represented $1.2 million, or less than 1%, of our revenue, with an effective rate of fee, net of rebates, of 0.87% of assets under management.
Separate Accounts
We manage separate accounts primarily for institutional clients, such as pension and profit sharing plans, trusts, endowments, foundations, charitable organizations, governmental entities, investment companies and similar pooled investment vehicles. Separate accounts comprised $29.1 billion, or 45%, of our assets under management as of June 30, 2012. For the six months ended June 30, 2012, fees from separate accounts, including U.S.-registered mutual funds, non-U.S. funds and collective investment trusts we sub-advise, represented $80.2 million, or 33%, of our revenues.
The fees we charge our separate accounts vary by client, investment strategy and the size of the account and are accrued monthly. Fees are billed in accordance with the provisions of the applicable investment advisory agreements, which is generally quarterly, based on the market value of the assets we manage for a particular separate account. Depending on the particular arrangement we have with a client, the fee generally is based on the average daily or average monthly market values of the assets we manage, the quarter-end value of the assets we manage or, less frequently, based on the performance of the client’s account relative to an agreed-upon benchmark.
-99-
Table of Contents
For separate account clients, we generally impose standard fee schedules that vary by investment strategy and, through the application of standard breakpoints, reflect the size of the account and client relationship, with rates of fee currently ranging from 0.40% of assets under management to 1.05% of assets under management. There are a number of exceptions to our standard fee schedules, including exceptions based on the nature of our relationship with the client and the value of the assets under our management in that relationship. For example, we may accept a sub-advised relationship in a strategy at a lower rate of fee if doing so allows us to gain access to a market segment to which we otherwise would not have access. In addition, we currently charge the collective investment trusts for which we are sub-adviser and that are marketed under the Artisan name fees that subsume breakpoints and so generally are lower than would be charged in connection with other types of separate accounts, as otherwise the initial investors in these trusts would bear a disproportionate amount of expense until a sufficient number of plans were invested. We also may enter into agreements with lower rates of fee for related accounts, particularly including accounts with a single point of contact for us or that otherwise require a lesser commitment of resources by us, and that together commit a larger amount of assets to our management. Our standard fee schedules have generally been in place for many years and were developed at a time when it was highly unusual for a separate account, or group of related accounts, under our management to be larger than a few hundred million dollars. As a result, those fee schedules do not address and are generally not appropriate for very large accounts. Clients or relationships with very large amounts of assets under our management (typically about $500 million or more) pay us fees at lower rates that reflect the size of our relationship. Many of those client relationships include multiple accounts, which may be in the same or in different investment strategies. Because our regular fee schedules do not apply, the structures of the fee schedules for those relationships have been individually designed to suit the needs of the particular client. So, for those larger relationships, our fees may be on an account-by-account basis (with different rates of fee for different accounts or different strategies), may apply a single fee schedule across multiple accounts, may impose a flat rate of fee across all assets under our management in that relationship, or may be traditional fee schedules with breakpoints at various asset levels but with higher or lower initial rates of fee and breakpoints at steeper or more gradual levels. In each case, the fees we receive, including in connection with a larger client relationship, are designed to achieve an overall effective rate of fee for that relationship that we consider to be appropriate taking into account a number of factors, including the value of the client’s assets under management, the number of accounts, investment strategies or investment teams across which those assets are invested and the nature of the client and relationship, including our expectations for the duration of the relationship and the size of the relationship over time.
In general, our effective rate of fee for a particular client relationship declines as the assets we manage for that client increase, which we believe is typical for the asset management industry. So, for example, our standard fee schedules for our Global Opportunities or Global Value strategies would result in an effective rate of fee of 0.80% for an account with average assets of $50 million, 0.70% for an account with average assets of $100 million, and 0.54% for an account with average assets of $450 million. In general, we have experienced a trend towards larger separate accounts across all of our separate account clients, as a result of both market appreciation and the establishment of new separate account relationships with relatively larger account sizes.
The weighted average rate of fee paid by our separate account clients in the aggregate for the years ended December 31, 2009, 2010 and 2011 and for the six months ended June 30, 2012 was 0.61%, 0.57%, 0.56% and 0.56%, respectively. In our management of the business, we calculate and our management monitors the weighted average rate of fee we receive from our separate account clients. We do not track, monitor or evaluate that information separately for separate account clients or relationships with assets under our management of any particular asset size. Because, as is typical in the asset management industry, our rates of fee decline as the assets under our management in a relationship increase, and because of differences in our fees by investment strategy, a change in the composition of our assets under management, in particular a shift to strategies, clients or relationships with lower effective rates of fees, could have a material impact on our overall weighted average rate of fee. See “—Qualitative and Quantitative Disclosures Regarding Market Risk—Market Risk” for a sensitivity analysis that demonstrates the impact that certain changes in the composition of our assets under management could have on our revenues.
-100-
Table of Contents
Revenues
Our revenues consist of investment management fees earned from managing clients’ assets. Our investment management fees fluctuate based on the total value of our assets under management, composition of assets under management among both our investment vehicles and our investment strategies (which have different fee rates), changes in the investment management fee rates on our products and, for the few accounts on which we earn performance-based fees, the investment performance of those accounts relative to various benchmarks. Because we earn investment management fees based on the value of the assets we manage across a reporting period, we believe that average assets under management for a period is a better metric for understanding changes in our revenues than period end assets under management.
The following table sets forth revenues we earned under our investment management agreements with Artisan Funds and Artisan Global Funds and on the separate accounts that we managed as well as average assets under management for the six months ended June 30, 2012 and 2011 and the years ended December 31, 2011, 2010 and 2009:
| For the Six Months Ended June 30, (unaudited) |
For the Year Ended December 31, | |||||||||||||||||||
| 2012 | 2011 | 2011 | 2010 | 2009 | ||||||||||||||||
| (dollars in millions) | ||||||||||||||||||||
| Revenues |
||||||||||||||||||||
| Management fees |
||||||||||||||||||||
| Artisan Funds & Artisan Global Funds |
$ | 160.3 | $ | 157.3 | $ | 305.2 | $ | 261.6 | $ | 197.2 | ||||||||||
| Separate accounts |
79.9 | 75.3 | 145.8 | 117.8 | 95.5 | |||||||||||||||
| Performance fees |
0.3 | 0.6 | 4.1 | 2.9 | 3.5 | |||||||||||||||
|
|
|
|
|
|
|
|
|
|
|
|||||||||||
| Total revenues |
$ | 240.5 | $ | 233.2 | $ | 455.1 | $ | 382.3 | $ | 296.2 | ||||||||||
|
|
|
|
|
|
|
|
|
|
|
|||||||||||
| Average assets under management for period |
$ | 63,263 | $ | 61,772 | $ | 59,436 | $ | 48,724 | $ | 36,918 | ||||||||||
For the years ended December 31, 2011, 2010 and 2009, more than 95%, 98% and 99% of our investment management fees, respectively, were earned from clients located in the United States. For the six months ended June 30, 2012 and 2011, 95% and 96% of our investment management fees, respectively, were earned from clients located in the United States.
A small number of our separate account clients pay us fees according to the performance of their accounts relative to certain agreed-upon benchmarks, which typically results in a lower base fee, but allows us to earn higher fees if the performance we achieve for that client is superior to the performance of an agreed-upon benchmark. Performance-based fees represented only 0.1%, 0.9%, 0.8% and 1.2% of our total revenues for the six months ended June 30, 2012 and the years ended December 31, 2011, 2010 and 2009, respectively.
Operating Expenses
Our operating expenses consist primarily of compensation and benefits expenses, distribution and marketing fees, occupancy expenses, communication and technology expenses and general and administrative expenses. Our expenses may fluctuate due to a number of factors, including the following:
| • | variations in the level of total compensation expense due to, among other things, incentive compensation, awards of equity to the employee-partners of Artisan Partners Holdings, changes in our employee count and product mix and competitive factors; and |
| • | expenses, such as distribution fees, rent, professional service fees and data-related costs, incurred, as necessary, to operate our business. |
Our largest operating expenses are compensation and benefits and distribution and marketing fees. A significant portion of our operating expenses are variable and fluctuate in direct relation to our revenues or our assets under management. We regularly monitor our expenses in comparison to revenues and have historically
-101-
Table of Contents
reduced our expense levels, where appropriate, when we have experienced downward pressure on revenues. However, even if we experience declining revenues, we expect to continue to make the expenditures necessary for us to manage client portfolios effectively and support and maintain our existing client relationships and franchise value. As a result, our profits may decline.
Compensation and Benefits
Compensation and benefits includes salaries, incentive compensation, benefits costs, distributions of profits to Class B partners, redemptions of Class B common units and changes in the value of Class B liability awards. It also includes regular payments we make to one of our portfolio managers who is a member of Artisan Partners UK LLP. A significant portion of our incentive compensation varies directly with revenues. Incentive compensation is one of the most significant parts of the total compensation of our senior employees. The aggregate amount of incentive compensation paid to members of our portfolio management teams and senior members of our marketing and client service teams is based on formulas that are tied directly to revenues. Incentive compensation paid to other employees is discretionary and subjectively determined based on individual performance and our overall results during the applicable year. In connection with our transition to a public company, we intend to implement a new compensation structure that uses a combination of cash and equity-based incentives as appropriate. However, we expect that a significant part of our compensation will remain variable, using a formula tied directly to revenues to determine the aggregate variable compensation for members of each investment team and marketing and client service team. We expect that incentive compensation paid to other employees will continue to be discretionary and subjectively determined based on individual performance and our overall results. As we mature as a public company, we will periodically evaluate and may change our compensation programs.
Accounting for our Class B limited partnership interests has changed as we transition from a private company to a public company. Historical financial statements presented for periods prior to the filing of an initial registration statement on April 6, 2011 reflect the Class B limited partnership interests as liability awards with measurement at intrinsic value under ASC 718. After the filing of an initial registration statement on April 6, 2011, we were considered a public registrant for financial reporting purposes. As a result, the Class B limited partnership interests are reflected as liabilities measured at fair value, instead of intrinsic value, beginning with the financial statements as of June 30, 2011 and all subsequent financial statements prepared prior to the completion of this offering. In July 2012, the limited partnership agreement of Artisan Partners Holdings was amended to reclassify the Class B limited partnership interests as “Class B common units” and the redemption value of Class B common units was modified to be based on the value of comparable firms with publicly-traded equity securities. As part of the reorganization transactions, the Class B common units will become exchangeable for Class A common stock pursuant to the terms of the exchange agreement and modified to remove the cash redemption feature. As a result, the Class B common units are expected to be treated as equity awards and compensation cost will be measured based upon the fair value of the awards at the time of the modification.
The table below describes the components of our compensation and benefits expense for the six months ended June 30, 2012 and 2011 and the years ended December 31, 2011, 2010 and 2009:
| For the Six Months Ended June 30, (unaudited) |
For the Year Ended December 31, |
|||||||||||||||||||
| 2012 | 2011 | 2011 | 2010 | 2009 | ||||||||||||||||
| (dollars in millions) | ||||||||||||||||||||
| Salaries, incentive compensation, and benefits |
$ | 109.3 | $ | 103.9 | $ | 198.6 | $ | 166.6 | $ | 132.9 | ||||||||||
| Distributions on Class B liability awards |
21.9 | 48.0 | 55.7 | 17.6 | 2.5 | |||||||||||||||
| Change in value of Class B liability awards |
29.9 | (6.7 | ) | (21.1 | ) | 79.1 | 41.8 | |||||||||||||
|
|
|
|
|
|
|
|
|
|
|
|||||||||||
| Total compensation and benefits expense |
$ | 161.1 | $ | 145.2 | $ | 233.2 | $ | 263.3 | $ | 177.2 | ||||||||||
|
|
|
|
|
|
|
|
|
|
|
|||||||||||
A significant portion of our compensation and benefits expense relates to our Class B limited partnership interests. Prior to this offering and the reorganization transactions, Class B limited partnership interests were
-102-
Table of Contents
granted to certain employees under the terms of Artisan Partners Holdings’ limited partnership agreement and pursuant to grant agreements. The Class B limited partnership interests provided for an interest in future profits of Artisan Partners Holdings as well as an interest in the overall appreciation or depreciation of Artisan Partners Holdings subsequent to the date of grant. Class B limited partnership interests generally vested ratably over a five-year period, beginning on the date of grant. Vesting could be accelerated upon the occurrence of certain events, including a change in control (as defined in the grant agreements). Holders of Class B limited partnership interests were entitled to fully participate in future profits from and after the date of grant. The distribution of profits associated with these limited partnership interests was recorded as compensation and benefits expense. Generally, these profits were determined based on Artisan Partners Holdings’ net income before equity-based compensation charges. In July 2012, the limited partnership agreement of Artisan Partners Holdings was amended to reclassify the Class B limited partnership interests as “Class B common units”.
Prior to this offering and the reorganization transactions, all vested Class B limited partnership interests were subject to mandatory redemption on termination of employment for any reason, with payment in cash in annual installments over the five years following termination of employment. Unvested Class B limited partnership interests were forfeited on termination of employment. Under the Class B grant agreements, the redemption value of Class B limited partnership interests varied depending on the circumstances of the partner’s termination, but, prior to July 15, 2012, was based on the partner’s equity balance which was determined for this purpose using a formula based on then-current EBITDA (excluding equity-based compensation charges) multiplied by a stated multiple, adjusted to take into account working capital, debt and noncurrent liabilities associated with Class B partner redemptions. Subsequent to July 15, 2012, the redemption value of Class B common units continued to vary depending on the circumstances of the partner’s termination but was based on the fair market value of the firm determined by the general partner, and approved by the Advisory Committee, by reference to the value of other asset management firms with publicly-traded equity securities. Due to the redemption feature, the Class B grants were considered liability awards. Compensation cost was measured at the grant date based on the intrinsic value of the limited partnership interests granted, and was re-measured each period. For purposes of estimating the intrinsic value, we assumed a holder’s termination of employment was the result of resignation or involuntary termination, which provides for a redemption value that is one-half of the total vested value of the partner’s limited partnership interests. The redemption value for employee-partners who have given notice of retirement in accordance with the terms of their grant agreements was calculated using the retirement valuation which provides for a redemption value that equals the total vested value of the partner’s limited partnership interests. Intrinsic value as measured each period was recognized as expense over the remaining vesting period, typically five years. Changes in the intrinsic value that occurred after the end of the vesting period were recorded as compensation cost of the period in which the changes occurred through settlement of the limited partnership interests.
Because, prior to July 15, 2012, the intrinsic value of the Class B limited partnership interests was based on the EBITDA formula described above, significant fluctuations in the redemption value occurred as a result of changes in assets under management, revenues and EBITDA (before equity-based compensation charges). The increase in the value of Class B liability awards from 2009 to 2010 primarily resulted from an increase in the value of Artisan Partners Holdings (calculated for this purpose pursuant to the EBITDA formula described above). This increase in value was driven by an increase in EBITDA (before equity-based compensation charges) resulting from higher average assets under management and corresponding revenues during the period.
As of and for the periods subsequent to June 30, 2011, the Class B limited partnership interests are reflected as liabilities measured at fair value. As part of the calculation to estimate the fair value of each Class B limited partnership interest, we first determined the value of the business based on the probability weighted expected return method. This approach considers the value of the business, calculated using a discounted cash flow analysis and a market approach using earnings multiples of comparable entities, under various scenarios. Significant inputs included historical revenues and expenses, future revenue and expense projections, discount rates and market prices of comparable entities. The value of the business as determined is then adjusted to take into account working capital, debt and noncurrent liabilities associated with Class B partner redemptions and allocated to individual limited partnership interests based on their respective terms. The use of the discounted
-103-
Table of Contents
cash flow and market approaches to derive the fair value of the liability at a point in time can result in volatility to the financial statements as our current and projected financial results, and the results and earnings multiples of comparable entities, will change over time.
As part of the reorganization transactions, the Class B grant agreements will be amended to eliminate the cash redemption feature. As a result, liability award accounting will no longer apply and the costs associated with distributions to our Class B partners and changes in the value of Class B liability awards will no longer be recognized as a compensation expense because the Class B common units will no longer be redeemable for cash upon termination of employment. However, we will record compensation expense for the fair value of the unvested awards of Class B common units over the remaining vesting period. Assuming an initial offering price of $ per share of Class A common stock (the midpoint of the price range set forth on the cover of this prospectus), the total value of unvested Class B common units as of the close of this offering will be $ million. Also as a result of the reorganization transactions, we will recognize a one-time compensation expense based on the difference between the carrying value of the liability associated with the vested Class B common units immediately prior to the offering and the value based on the offering price per share of Class A common stock. Assuming an initial offering price of $ per share of our Class A common stock (the midpoint of the price range set forth on the cover of this prospectus), the amount of this one-time charge will be $ million. We will also recognize a $56 million compensation expense relating to a $56 million cash incentive compensation payment that will be made to certain of our portfolio managers in connection with this offering.
As described in “Management—2013 Omnibus Incentive Compensation Plan”, we plan to adopt the Artisan Partners Asset Management Inc. 2013 Omnibus Incentive Compensation Plan, in connection with this offering. Pursuant to the 2013 Omnibus Incentive Compensation Plan, we expect to make equity-based compensation awards and performance awards, and performance-based cash awards. Equity-based awards will be based on our Class A common stock or on Class B common units of Artisan Partners Holdings and will be subject to certain vesting restrictions. See “Management—2013 Omnibus Incentive Compensation Plan” for additional information about the 2013 Omnibus Incentive Compensation Plan.
In connection with this offering, we intend to grant equity-based awards to our non-employee directors as a part of their compensation.
Distribution and Marketing
Distribution and marketing fees primarily represent payments we make to broker-dealers, financial advisors, defined contribution plan providers, mutual fund supermarkets and other intermediaries for selling, servicing and administering accounts invested in shares of Artisan Funds. Artisan Funds authorizes intermediaries to accept purchase, exchange, and redemption orders for shares of Artisan Funds on behalf of Artisan Funds. Many authorized agents charge a fee for those services. Artisan Funds pays a portion of such fees, which are intended to compensate the authorized agent for its provision of services of the type that would be provided by Artisan Funds’ transfer agent or other service providers if the shares were registered directly on the books of Artisan Funds’ transfer agent. Like the investment management fees we earn as adviser to Artisan Funds, distribution fees typically vary with the value of the assets invested in shares of Artisan Funds. The allocation of such fees between us and Artisan Funds is determined by the board of Artisan Funds, based on information and a recommendation from us, with the goal of allocating to us all costs attributable to the marketing and distribution of shares of Artisan Funds. A significant portion of Artisan Funds’ shares are held by investors through intermediaries, which is consistent with an industry-wide shift from direct retail sales of mutual fund shares to sales through intermediaries that provide advice, administrative convenience or both. As a result, distribution fees are likely to increase due to an increase in our assets under management that are sourced through intermediaries that charge these fees or an increase in the fee rates charged by intermediaries. In contrast to some mutual funds, investors in Artisan Funds pay no 12b-1 fees, which are fees charged to investors to pay for marketing, advertising and distribution services. See “Business—Distribution, Investment Products and Client Relationships” for additional information about 12b-1 fees.
-104-
Table of Contents
Occupancy
Occupancy expenses include operating leases for facilities, furniture and office equipment, miscellaneous facility related costs and depreciation expense associated with furniture purchases and leasehold improvements.
Communication and technology
Communication and technology expenses include information and print subscriptions, telephone costs, information systems consulting fees, equipment and software maintenance expenses, operating leases for information technology equipment and depreciation and amortization expenses associated with computer hardware and software. Information and print subscriptions represent the costs we pay to obtain investment research and other data we need to operate our business, and such expenses generally increase or decrease in relative proportion to the number of our employees and the overall size and scale of our business operations.
On behalf of our mutual fund and separate account clients, we make decisions to buy and sell securities for each portfolio, select broker-dealers to execute trades and negotiate brokerage commission rates. In connection with these transactions, we may receive research products and services from broker-dealers in exchange for the business we conduct with such firms. Some of those research products and services could be acquired for cash and our receipt of those products and services through the use of client commissions, or soft dollars, reduces cash expenses we would otherwise incur. The reduction in our operating expenses through the use of soft dollars amounted to $1.9 million and $2.3 million for the six months ended June 30, 2012 and 2011 and $4.1 million, $3.3 million, and $2.9 million for the years ended December 31, 2011, 2010 and 2009, respectively. Our operating expenses will increase to the extent these soft dollars are reduced or eliminated. We believe that all research products and services we acquire through soft dollars are within the safe harbor provided by Section 28(e) of the Exchange Act.
General and Administrative
General and administrative expenses include professional fees, travel and entertainment, state and local taxes, and other miscellaneous expenses we incur in operating our business.
Following this offering, we expect that we will incur additional expenses as a result of becoming a public company, including expenses related to additional staffing, director and officer insurance, director fees, SEC reporting and compliance (including Sarbanes-Oxley compliance), transfer agent fees, professional fees and other similar expenses. These additional expenses will increase our general and administrative expenses and reduce our net income.
Non-Operating Income (Loss) and Net Income (Loss) Attributable to Noncontrolling Interests
Interest Expense
Interest expense includes the interest we pay on our debt. We prepaid our $400 million term loan in full in August 2012 with proceeds from the issuance of $200 million in unsecured notes and $90 million drawn from a $100 million five-year revolving credit facility. The term loan bore interest at a rate equal to LIBOR adjusted by a statutory reserve percentage plus an applicable margin ranging from 2.00% to 3.50%, depending on Artisan Partners Holdings’ leverage ratio (as defined in the term loan agreement).
The notes are comprised of three series, each with a balloon payment at maturity. The Series A notes, in an aggregate principal amount of $60 million, bear interest at a rate equal to 4.98% per annum and are due August 16, 2017. The Series B notes, in an aggregate principal amount of $50 million, bear interest at a rate equal to 5.32% per annum and are due August 16, 2019. The Series C notes, in an aggregate principal amount of $90 million, bear interest at a rate equal to 5.82% per annum and are due August 16, 2022. The interest rate on each series of notes is subject to a 1.00% increase in the event Artisan Partners Holdings receives a below-investment grade rating and any such increase will continue to apply until an investment grade rating is received.
Outstanding loans under the revolving credit agreement currently bear interest at a rate equal to, at our election, (i) LIBOR adjusted by a statutory reserve percentage plus an applicable margin ranging from 1.50% to 3.00%, depending on Artisan Partners Holdings’ leverage ratio (as defined in the agreement) or (ii) an alternate
-105-
Table of Contents
base rate equal to the highest of Citibank, N.A.’s prime rate, the federal funds effective rate plus 0.50% and the daily one-month LIBOR adjusted by a statutory reserve percentage plus 1.00%, plus an applicable margin ranging from 0.50% to 2.00%, depending on Artisan Partners Holdings’ leverage ratio (as defined in the agreement). Unused commitments under the revolving credit agreement bear interest at a rate that ranges from 0.175% to 0.625%, depending on Artisan Partners Holdings’ leverage ratio (as defined in the agreement). If the revolving credit agreement had been had been effective as of June 30, 2012, the applicable margin on the interest rate would have been 1.75% with respect to the LIBOR interest rate option and 0.75% for the alternate base rate interest rate option, and the interest rate on the unused commitments would have been 0.20%. We currently intend to repay all or a portion of the then-outstanding principal amount of any loans under our revolving credit agreement with a portion of the net proceeds of this offering.
To effectively convert a portion of our term loan’s variable interest rate to a fixed rate, in July 2006, we executed with two counterparties five-year amortizing interest rate swap contracts that had a combined total notional value of $400 million at inception and had a final maturity date of July 1, 2011. In November 2010, we entered into a forward starting interest rate swap with a notional value of $200 million, an effective start date of July 1, 2011 and a final maturity date of July 1, 2013. The counterparty under this interest rate swap paid Artisan Partners Holdings variable interest at three-month LIBOR, and Artisan Partners Holdings paid the counterparty a fixed interest rate of 1.04%. The income and expense related to the interest rate swap contracts was accounted for under interest expense. Artisan Partners Holdings terminated the forward starting interest rate swap contract in August 2012 in connection with the repayment in full of the term loan.
When Artisan Partners Holdings historically redeemed Class B limited partnership interests, it generally paid the redemption price for the limited partnership interests over a period of five years and paid interest on the unpaid portion of the redemption price at rates comparable to those it received on money market instruments. These interest payments are included in our interest expense. As part of the reorganization transactions, the Class B common units will become exchangeable for shares of our Class A common stock, and will no longer be redeemed for cash upon termination of employment.
Net Gain (Loss) of Consolidated Investment Products and Net Gain (Loss) Attributable to Noncontrolling Interests
Artisan provides investment management services to a private investment partnership the investors in which are certain partners and employees of Artisan. Artisan makes day-to-day investment decisions concerning the assets of the private investment partnership. This partnership is consolidated under variable interest entity consolidation guidance. If Artisan were to liquidate, these investments would not be available to the general creditors of the company and as a result, Artisan does not consider investments held by consolidated investment products to be company assets.
Net gain (loss) of consolidated investment products include net interest income, dividend expense and realized and unrealized gains and losses which are driven by the underlying investments held by consolidated investment products. Nearly all of these net gains or losses are attributable to third party investors and are offset by net gain (loss) attributable to noncontrolling interests.
Other Income (Loss)
Other income (loss) includes income from our excess cash balances, dividends earned on available-for-sale securities, gains or losses we recognized on the ineffective portion of our interest rate swaps and capital gains or losses we recognize upon the sale of the securities we hold.
Provision for Income Taxes
Our business was historically organized as a partnership and was not subject to U.S. federal and certain state income taxes. Prior to the completion of this offering, as a result of the reorganization transactions, our business will become subject to taxes applicable to C-corporations. For more information on pro forma income taxes applicable to our business under C-corporation status, see “Unaudited Pro Forma Consolidated Financial Information”. Income tax expense is recognized for certain foreign subsidiaries that pay corporate income tax.
-106-
Table of Contents
Results of Operations
Our investment management fees are driven by the amount and composition of our assets under management. As a result, our earnings and cash flows are heavily dependent upon prevailing conditions in the securities markets, particularly in the equity securities markets. Significant increases or decreases in the value of equity securities or significant changes in the level of client contributions or withdrawals can have a material impact on our results of operations. Client contributions and withdrawals are driven by the performance results of our investment strategies, the competitiveness of our fee rates, the success of our marketing and client service efforts, the state of the overall securities markets and clients’ individual investment philosophies and cash-flow requirements.
Six Months Ended June 30, 2012 Compared to the Six Months Ended June 30, 2011
Assets Under Management
Our assets under management increased by $427 million, or 1%, to $64.1 billion as of June 30, 2012 from $63.6 billion as of June 30, 2011. As of June 30, 2012 and 2011, our assets under management consisted of 55% Artisan Funds and Artisan Global Funds and 45% separate accounts. The following table sets forth the changes in our assets under management for Artisan Funds and Artisan Global Funds and the separate accounts that we managed for the six months ended June 30, 2012 and 2011, as well as the average assets under management for each period:
| Six Months Ended June 30, |
Period-to-Period | |||||||||||||||
| 2012 | 2011 | $ Change | % Change | |||||||||||||
| (dollars in millions) | ||||||||||||||||
| Artisan Funds and Artisan Global Funds |
||||||||||||||||
| Beginning assets under management |
$ | 30,843 | $ | 31,367 | $ | (524 | ) | (2 | )% | |||||||
| Gross client cash inflows |
6,133 | 4,797 | 1,336 | 28 | ||||||||||||
| Gross client cash outflows |
4,051 | 3,582 | 469 | 13 | ||||||||||||
|
|
|
|
|
|||||||||||||
| Net client cash flows |
2,082 | 1,215 | 867 | 71 | ||||||||||||
| Market appreciation (depreciation) |
2,147 | 2,339 | (192 | ) | (8 | ) | ||||||||||
| Transfers between investment vehicles |
(128 | ) | (124 | ) | (4 | ) | (3 | ) | ||||||||
|
|
|
|
|
|||||||||||||
| Ending assets under management |
$ | 34,944 | $ | 34,797 | $ | 147 | 0 | % | ||||||||
|
|
|
|
|
|||||||||||||
| Average assets under management |
$ | 34,347 | $ | 33,690 | $ | 657 | 2 | % | ||||||||
| Separate Accounts |
||||||||||||||||
| Beginning assets under management |
$ | 26,261 | $ | 26,092 | $ | 169 | 1 | % | ||||||||
| Gross client cash inflows |
2,617 | 2,868 | (251 | ) | (9 | ) | ||||||||||
| Gross client cash outflows |
1,941 | 2,071 | (130 | ) | (6 | ) | ||||||||||
|
|
|
|
|
|||||||||||||
| Net client cash flows |
676 | 797 | (121 | ) | (15 | ) | ||||||||||
| Market appreciation (depreciation) |
2,063 | 1,835 | 228 | 12 | ||||||||||||
| Transfers between investment vehicles |
128 | 124 | 4 | 3 | ||||||||||||
|
|
|
|
|
|||||||||||||
| Ending assets under management |
$ | 29,128 | $ | 28,848 | $ | 280 | 1 | % | ||||||||
|
|
|
|
|
|||||||||||||
| Average assets under management |
$ | 28,917 | $ | 28,082 | $ | 835 | 3 | % | ||||||||
| Total Assets Under Management |
||||||||||||||||
| Beginning assets under management |
$ | 57,104 | $ | 57,459 | ($ | 355 | ) | (1 | )% | |||||||
| Gross client cash inflows |
8,750 | 7,665 | 1,085 | 14 | ||||||||||||
| Gross client cash outflows |
5,992 | 5,653 | 339 | 6 | ||||||||||||
|
|
|
|
|
|||||||||||||
| Net client cash flows |
2,758 | 2,012 | 746 | 37 | ||||||||||||
| Market appreciation (depreciation) |
4,210 | 4,174 | 36 | 1 | ||||||||||||
| Transfers between investment vehicles |
— | — | — | — | ||||||||||||
|
|
|
|
|
|||||||||||||
| Ending assets under management |
$ | 64,072 | $ | 63,645 | $ | 427 | 1 | % | ||||||||
|
|
|
|
|
|||||||||||||
| Average assets under management |
$ | 63,263 | $ | 61,772 | $ | 1,491 | 2 | % | ||||||||
-107-
Table of Contents
Revenues
Our investment management fees increased $7.3 million, or 3%, to $240.5 million for the six months ended June 30, 2012 from $233.2 million for the six months ended June 30, 2011. This increase was driven primarily by a $1.5 billion, or 2%, increase in our average assets under management to $63.3 billion for the six months ended June 30, 2012 from $61.8 billion for the six months ended June 30, 2011. The increase in our average assets under management was primarily attributable to rising global equity markets and strong net client cash inflows during the first half of 2012. During the six months ended June 30, 2012, our net client cash inflows were $2.8 billion, which was an increase of $746 million compared to the six months ended June 30, 2011. Our weighted average investment management fee remained consistent at 76 basis points for the six months ended June 30, 2012 and 2011. Separate accounts as a percentage of our total assets under management, which paid a lower weighted average fee (56 basis points and 54 basis points for the six months ended June 30, 2012 and June 30, 2011, respectively), remained unchanged at 45% of total assets under management as of June 30, 2012 as compared to June 30, 2011. Artisan Funds and Artisan Global Funds, to which we provide services in addition to the services we provide to separate account clients, paid a weighted average fee of 94 basis points for the six months ended June 30, 2012 and June 30, 2011.
Operating Expenses
The following table sets forth our operating expenses for the six months ended June 30, 2012 and 2011:
| Six Months Ended June 30, (unaudited) |
Period-to-Period | |||||||||||||||
| 2012 | 2011 | $ Change | % Change | |||||||||||||
| (dollars in millions) | ||||||||||||||||
| Salaries, incentive compensation, and benefits |
$ | 109.3 | $ | 103.9 | $ | 5.4 | 5 | % | ||||||||
| Distributions on Class B liability awards |
21.9 | 48.0 | (26.1 | ) | (54 | ) | ||||||||||
| Change in value of Class B liability awards |
29.9 | (6.7 | ) | 36.6 | 546 | |||||||||||
|
|
|
|
|
|||||||||||||
| Total compensation and benefits expense |
161.1 | 145.2 | 15.9 | 11 | ||||||||||||
| Distribution and marketing |
14.2 | 13.4 | 0.8 | 6 | ||||||||||||
| Occupancy |
4.5 | 4.4 | 0.1 | 2 | ||||||||||||
| Communication and technology |
6.4 | 4.9 | 1.5 | 31 | ||||||||||||
| General and administrative |
8.4 | 8.1 | 0.3 | 4 | ||||||||||||
|
|
|
|
|
|||||||||||||
| Total operating expenses |
$ | 194.6 | $ | 176.0 | $ | 18.6 | 11 | % | ||||||||
|
|
|
|
|
|||||||||||||
Total operating expenses increased by $18.6 million, or 11%, to $194.6 million for the six months ended June 30, 2012 from $176.0 million for the six months ended June 30, 2011. This increase was primarily attributable to increased compensation and benefits expense, which increased by $15.9 million, or 11%, to $161.1 million for the six months ended June 30, 2012 from $145.2 million for the six months ended June 30, 2011. Salary, incentive compensation and benefits represented 45% of our revenues for the six months ended June 30, 2012 and 2011.
Salaries, incentive compensation and benefits expense increased $5.4 million, or 5%, to $109.3 million for the six months ended June 30, 2012 from $103.9 million for the six months ended June 30, 2011. Incentive compensation paid to our investment and marketing professionals is directly linked to our revenues and consequently increased by $3.2 million because of our higher investment management fee revenue during the first six months of 2012 compared to the first six months of 2011. Incentive compensation expense associated with a new incentive compensation plan introduced in March 2011 for certain portfolio managers increased the expense by $1.4 million in 2012 as there was a full six months of expense in 2012 as compared to four months in 2011. This incentive compensation plan provides certain portfolio managers with additional cash compensation over a three-year period based on the then-current value of shares of mutual funds managed by such portfolio managers. We do not intend to enter into other similar incentive compensation plans in the future. The remaining increase in salaries, incentive compensation and benefits expense is driven by increased headcount in 2012 as compared to 2011.
-108-
Table of Contents
This increase in total compensation and benefits expense was also primarily a result of an increase in the change in value of our Class B liability awards from $(6.7) million during the six months ended June 30, 2011, to $29.9 million during the six months ended June 30, 2012, as a result of an additional year of vesting of the awards, partially offset by a 54% decrease in distributions to Class B partners, from $48.0 million in the six months ended June 30, 2011 to $21.9 million in the same period of 2012. Distributions to Class B partners decreased as a result of a $26.5 million profits distribution in March 2011. There were no profits distributions made in the six months ended June 30, 2012 as we opted to retain cash as we evaluated our capital structure plans. Historically, we have distributed substantially all of our profits to our partners. For further information on our Class B liability awards, see under “Management’s Discussion and Analysis of Financial Condition and Results of Operations—Financial Overview—Operating Expenses—Compensation and Benefits”.
Distribution and marketing fees increased by $0.8 million, or 6%, to $14.2 million for the six months ended June 30, 2012 from $13.4 million for the six months ended June 30, 2011, primarily as a result of a new distribution agreement with a third party as we seek to expand our global operations.
Communications and technology expense increased by $1.5 million, or 31%, to $6.4 million for the six months ended June 30, 2012 from $4.9 million for the six months ended June 30, 2011 as a result of increased users of market data subscriptions and external consulting fees for technology initiatives.
Non-Operating Income (Loss)
The following table sets forth our non-operating income (loss) for the six months ended June 30, 2012 and 2011:
| Six Months Ended June 30, (unaudited) |
Period-to-Period | |||||||||||||||
| 2012 | 2011 | $ Change | % Change | |||||||||||||
| (dollars in millions) | ||||||||||||||||
| Interest expense |
$ | (5.2 | ) | $ | (12.4 | ) | $ | 7.2 | 58 | % | ||||||
| Gains (losses) of consolidated investment products, net |
1.5 | — | 1.5 | — | ||||||||||||
| Other income (loss) |
(0.1 | ) | — | (0.1 | ) | — | ||||||||||
|
|
|
|
|
|||||||||||||
| Total non-operating income (loss) |
$ | (3.8 | ) | $ | (12.4 | ) | $ | 8.6 | 69 | % | ||||||
|
|
|
|
|
|||||||||||||
Interest expense for the six months ended June 30, 2012 was $5.2 million, a decrease of $7.2 million, or 58%, from $12.4 million for the six months ended June 30, 2011. This decrease resulted from total principal payments on our term loan agreement of $35.2 million from July 1, 2011 through December 31, 2011 and a principal payment totaling $25.9 million on March 30, 2012. In addition, a swap that fixed the interest rate on a portion of our term loan agreement at 5.689% per annum expired on July 1, 2011.
Gains of consolidated investment products represent net realized and unrealized gains of the underlying assets of a private investment partnership that is consolidated. Nearly all of this gain is attributable to third party investors and is offset by net gain (loss) attributable to noncontrolling interests. The private investment partnership commenced operations on July 25, 2011.
Other loss of $0.1 million for the six months ended June 30, 2012 relates to mark-to-market losses on a forward starting interest rate swap which Artisan Partners Holdings terminated in August 2012.
-109-
Table of Contents
Net Income
The following table sets forth our income before taxes, provision for income taxes, net income and adjusted operating margin for the six months ended June 30, 2012 and 2011:
| Six Months Ended June 30, (unaudited) |
Period-to-Period | |||||||||||||||
| 2012 | 2011 | $ Change | % Change | |||||||||||||
| (dollars in millions) | ||||||||||||||||
| Revenues |
$ | 240.5 | $ | 233.2 | $ | 7.3 | 3 | % | ||||||||
| Total operating expenses |
194.6 | 176.0 | 18.6 | 11 | ||||||||||||
|
|
|
|
|
|||||||||||||
| Operating income (loss) |
45.9 | 57.2 | (11.3 | ) | (20 | ) | ||||||||||
| Total non-operating income (loss) |
(3.8 | ) | (12.4 | ) | 8.6 | 69 | ||||||||||
| Income before income taxes |
42.1 | 44.8 | (2.7 | ) | (6 | ) | ||||||||||
|
|
|
|
|
|||||||||||||
| Provision for income taxes |
0.6 | 0.6 | — | — | ||||||||||||
|
|
|
|
|
|||||||||||||
| Net income before noncontrolling interests |
41.5 | 44.2 | (2.7 | ) | (6 | ) | ||||||||||
| Less: Net income attributable to noncontrolling interests |
1.5 | — | 1.5 | — | ||||||||||||
|
|
|
|
|
|||||||||||||
| Net income attributable to Artisan Partners Holdings LP |
$ | 40.0 | $ | 44.2 | $ | (4.2 | ) | (10 | )% | |||||||
|
|
|
|
|
|||||||||||||
| Adjusted operating margin(1) |
40.6 | % | 42.2 | % | (1.6 | )% | (4 | )% | ||||||||
| (1) | For a discussion of adjusted operating margin and a reconciliation to GAAP operating income, please see pages 92-93 of this prospectus. |
Income before income taxes for the six months ended June 30, 2012 was $42.1 million, a decrease of $2.7 million, or 6%, from $44.8 million for the six months ended June 30, 2011. Provision for income taxes remained consistent at $0.6 million and represents corporate income tax incurred by our U.K. subsidiary. Net income before noncontrolling interests decreased by $2.7 million, or 6%, to $41.5 million for the six months ended June 30, 2012 from $44.2 million for the six months ended June 30, 2011. This decrease was primarily due to the increase in total compensation and benefits expense primarily driven by the increase in value of our Class B liability awards for the six months ended June 30, 2012, as compared to the six months ended June 30, 2011, which more than offset the increased revenue and the reduced distributions on Class B liability awards. Net income attributable to noncontrolling interests represents income associated with the private investment partnership which commenced operations on July 25, 2011. Net income attributable to Artisan Partners Holdings LP was $40.0 million for the six months ended June 30, 2012, a decrease of $4.2 million, or 10%, from $44.2 million for the six months ended June 30, 2011. Our adjusted operating margin decreased to 40.6% for the six months ended June 30, 2012 from 42.2% for the six months ended June 30, 2011, as the overall increase in our adjusted operating expenses (which exclude the expenses we recognize for equity-based compensation, including distributions to the Class B partners of Artisan Partners Holdings and changes in the value of Class B liability awards) outpaced the overall increase in our revenues.
-110-
Table of Contents
Year Ended December 31, 2011 Compared to Year Ended December 31, 2010
Assets Under Management
Our assets under management decreased by $0.4 billion, or 1%, to $57.1 billion as of December 31, 2011 from $57.5 billion as of December 31, 2010. As of December 31, 2011, our assets under management consisted of 54% Artisan Funds and Artisan Global Funds and 46% separate accounts as compared to 55% Artisan Funds and 45% separate accounts as of December 31, 2010. The following table sets forth the changes in our assets under management for Artisan Funds and the separate accounts that we managed for the years ended December 31, 2011 and 2010, as well as our average assets under management for each period:
| Year Ended December 31, |
Period-to-Period | |||||||||||||||
| 2011 | 2010 | $ Change | % Change | |||||||||||||
| (dollars in millions) | ||||||||||||||||
| Artisan Funds and Artisan Global Funds |
||||||||||||||||
| Beginning assets under management |
$ | 31,367 | $ | 26,644 | $ | 4,723 | 18 | % | ||||||||
| Gross client cash inflows |
8,809 | 7,524 | 1,285 | (17 | ) | |||||||||||
| Gross client cash outflows |
7,896 | 6,718 | 1,178 | 18 | ||||||||||||
|
|
|
|
|
|||||||||||||
| Net client cash flows |
913 | 806 | 107 | 13 | ||||||||||||
| Market appreciation (depreciation) |
(1,226 | ) | 3,917 | (5,143 | ) | (131 | ) | |||||||||
| Transfers between investment vehicles |
(211 | ) | — | (211 | ) | — | ||||||||||
|
|
|
|
|
|||||||||||||
| Ending assets under management |
$ | 30,843 | $ | 31,367 | $ | (524 | ) | (2 | )% | |||||||
|
|
|
|
|
|||||||||||||
| Average assets under management |
$ | 32,449 | $ | 27,646 | $ | 4,803 | 17 | % | ||||||||
| Separate Accounts |
||||||||||||||||
| Beginning assets under management |
$ | 26,092 | $ | 20,144 | $ | 5,948 | 30 | |||||||||
| Gross client cash inflows |
5,201 | 5,722 | (521 | ) | (9 | ) | ||||||||||
| Gross client cash outflows |
4,154 | 3,118 | 1,036 | 33 | ||||||||||||
|
|
|
|
|
|||||||||||||
| Net client cash flows |
1,047 | 2,604 | (1,557 | ) | (60 | ) | ||||||||||
| Market appreciation (depreciation) |
(1,089 | ) | 3,344 | (4,433 | ) | (133 | ) | |||||||||
| Transfers between investment vehicles |
211 | — | 211 | — | ||||||||||||
|
|
|
|
|
|||||||||||||
| Ending assets under management |
$ | 26,261 | $ | 26,092 | $ | 169 | 1 | |||||||||
|
|
|
|
|
|||||||||||||
| Average assets under management |
$ | 26,987 | $ | 21,078 | $ | 5,910 | 28 | |||||||||
| Total Assets Under Management |
||||||||||||||||
| Beginning assets under management |
$ | 57,459 | $ | 46,788 | $ | 10,671 | 23 | |||||||||
| Gross client cash inflows |
14,010 | 13,246 | 764 | 6 | ||||||||||||
| Gross client cash outflows |
12,050 | 9,836 | 2,214 | 23 | ||||||||||||
|
|
|
|
|
|||||||||||||
| Net client cash flows |
1,960 | 3,410 | (1,450 | ) | (43 | ) | ||||||||||
| Market appreciation (depreciation) |
(2,315 | ) | 7,261 | (9,576 | ) | 132 | ||||||||||
| Transfers between investment vehicles |
— | — | — | — | ||||||||||||
|
|
|
|
|
|||||||||||||
| Ending assets under management |
$ | 57,104 | $ | 57,459 | $ | (355 | ) | (1 | ) | |||||||
|
|
|
|
|
|||||||||||||
| Average assets under management |
$ | 59,436 | $ | 48,724 | $ | 10,712 | 22 | |||||||||
Revenues
Our investment management fees increased $72.8 million, or 19%, to $455.1 million for the year ended December 31, 2011 from $382.3 million for the year ended December 31, 2010. This increase was driven primarily by a $10.7 billion, or 22%, increase in our average assets under management to $59.4 billion for the year ended December 31, 2011 from $48.7 billion for the year ended December 31, 2010. The increase in our average assets under management was primarily attributable to the continued recovery of global equity markets
-111-
Table of Contents
during 2011. During the year ended December 31, 2011, our net client cash inflows were $2.0 billion, which was a decrease of $1.5 billion compared to the year ended December 31, 2010. Our weighted average investment management fee decreased to 77 basis points for the year ended December 31, 2011 from 79 basis points for the year ended December 31, 2010 primarily as a result of a new client mandate in late 2010 with discounted fee rates. To a lesser extent, this decrease was also a result of the increase in separate accounts as a percentage of our assets under management, which paid a lower weighted average fee (56 basis points and 57 basis points for the years ended December 31, 2011 and December 31, 2010, respectively), compared with Artisan Funds, to which we provide services in addition to the services we provide to separate account clients and which paid a weighted average fee of 94 basis points and 95 basis points for the years ended December 31, 2011 and December 31, 2010, respectively.
Operating Expenses
The following table sets forth our operating expenses for the years ended December 31, 2011 and 2010:
| Year Ended December 31, |
Period-to-Period | |||||||||||||||
| 2011 | 2010 | $ Change | % Change | |||||||||||||
| (dollars in millions) | ||||||||||||||||
| Salaries, incentive compensation, and benefits |
$ | 198.6 | $ | 166.6 | $ | 32.0 | 19 | % | ||||||||
| Distributions on Class B liability awards |
55.7 | 17.6 | 38.1 | 216 | ||||||||||||
| Change in value of Class B liability awards |
(21.1 | ) | 79.1 | (100.2 | ) | (127 | ) | |||||||||
|
|
|
|
|
|||||||||||||
| Total compensation and benefits expense |
233.2 | 263.3 | (30.1 | ) | (11 | ) | ||||||||||
| Distribution and marketing |
26.2 | 23.0 | 3.2 | 14 | ||||||||||||
| Occupancy |
9.0 | 8.1 | 0.9 | 11 | ||||||||||||
| Communication and technology |
10.6 | 9.9 | 0.7 | 7 | ||||||||||||
| General and administrative |
21.8 | 12.8 | 9.0 | 70 | ||||||||||||
|
|
|
|
|
|||||||||||||
| Total operating expenses |
$ | 300.8 | $ | 317.1 | $ | (16.3 | ) | (5 | )% | |||||||
|
|
|
|
|
|||||||||||||
Total operating expenses decreased by $16.3 million, or 5%, to $300.8 million for the year ended December 31, 2011 from $317.1 million for the year ended December 31, 2010. This decrease was attributable to decreased compensation and benefits expense, which decreased by $30.1 million, or 11%, to $233.2 million for the year ended December 31, 2011 from $263.3 million for the year ended December 31, 2010. Salary, incentive compensation and benefits represented 44% of our revenues for the years ended December 31, 2011 and 2010.
The decrease in total compensation and benefits expense of $30.1 million was largely the result of a decrease in the value of our Class B liability awards during the year ended December 31, 2011. The value of our Class B liability awards increased substantially during 2010 as our assets under management and revenues improved along with the global equity markets. In 2011, the value dropped slightly as we began to measure the liability at fair value rather than intrinsic value, using the redemption formula. This use of fair value considers the performance of comparable entities and a discounted analysis of Artisan’s future revenue and expense projections, where intrinsic value considered Artisan’s recent historical financial performance exclusively in accordance with the terms of our partnership agreement. Partially offsetting the decline in expense associated with the change in value of our Class B liability awards was an increase in distributions to our Class B partners and an increase in salaries, incentive compensation and benefits during the year ended December 31, 2011 as compared to the year ended December 31, 2010. Distributions to Class B partners increased as a result of a $26.5 million profits distribution in 2011 and higher tax distribution payments which corresponded to higher earnings in 2011 as compared to 2010. There were no profits distributions in 2010. Incentive compensation paid to our investment and marketing professionals is directly linked to our revenues and consequently increased by $25.8 million because of our higher investment management fee revenue during 2011 compared to 2010. Incentive compensation for a new incentive plan introduced in 2011 for certain portfolio managers increased expense by $6.0 million in 2011. This incentive plan provides certain portfolio managers with additional cash compensation over a three-year period based on the then-current value of shares of mutual funds managed by such portfolio
-112-
Table of Contents
managers. In addition, salary expense increased by $2.1 million during 2011 as compared to 2010 as a result of increased headcount. Offsetting these increases was non-recurring compensation costs incurred in 2010 of $2.8 million associated with the hiring of our new portfolio manager for the Global Equity strategy.
Distribution and marketing fees increased by $3.2 million, or 14%, to $26.2 million for the year ended December 31, 2011 from $23.0 million for the year ended December 31, 2010, primarily as a result of the overall increase in our assets under management invested in Artisan Funds through certain intermediaries.
General and administrative expenses increased by $9.0 million, or 70%, to $21.8 million for the year ended December 31, 2011 from $12.8 million for the year ended December 31, 2010. This increase was primarily attributable to higher professional fees and travel and entertainment expenses. Professional fees increased in 2011 as compared to 2010 primarily due to legal, accounting and tax fees associated with our 2011 public offering effort and legal costs associated with litigation that was dismissed with prejudice in August 2012. Travel and entertainment costs were higher as compared to 2010 driven by the expansion of our global operations and distribution efforts.
Non-Operating Income (Loss)
The following table sets forth our non-operating income (loss) for the years ended December 31, 2011 and 2010:
| Year Ended December 31, |
Period-to-Period | |||||||||||||||
| 2011 | 2010 | $ Change | % Change | |||||||||||||
| (dollars in millions) | ||||||||||||||||
| Interest expense |
$ | (18.4 | ) | $ | (23.0 | ) | $ | 4.6 | 20 | % | ||||||
| Gains (losses) of consolidated investment products, net |
(3.1 | ) | — | (3.1 | ) | — | ||||||||||
| Other income (loss) |
(1.6 | ) | 1.6 | (3.2 | ) | (200 | ) | |||||||||
|
|
|
|
|
|||||||||||||
| Total non-operating income (loss) |
$ | (23.1 | ) | $ | (21.4 | ) | $ | (1.7 | ) | (8 | )% | |||||
|
|
|
|
|
|||||||||||||
Interest expense for the year ended December 31, 2011 was $18.4 million, a decrease of $4.6 million, or 20%, from $23.0 million for the year ended December 31, 2010. This decrease resulted from the maturity of an interest rate swap on July 1, 2011 that fixed a portion of our term loan at 5.689%. In addition, we made principal payments totaling $55.2 million on our term loan during 2011.
Losses of consolidated investment products of $3.1 million in 2011 represented net realized and unrealized losses of the underlying assets of a private investment partnership that is consolidated. Nearly all of this loss is attributable to third party investors and is offset by net gain (loss) attributable to noncontrolling interests. The private investment partnership commenced operations on July 25, 2011.
Other loss of $1.6 million for the year ended December 31, 2011 relates mainly to the discontinuance of hedge accounting on an interest rate swap as the forecasted transaction was no longer probable of occurring. The discontinuance of hedge accounting required us to reclassify unrealized losses on the swap recorded in accumulated other comprehensive income to other income (loss). The gain of $1.6 million in 2010 relates mainly to the gain of $0.9 million on the change in fair value on a forward starting swap, which resulted from an increase in interest rates from the date we entered into the forward starting swap to the date the swap was designated as an effective cash flow hedge. In addition, we recognized a gain of $0.7 million on the sale of certain available-for-sale investments in March 2010. We sold certain of our investments in Artisan Funds, initially made as seed capital investments, to partially fund our seed investment in Artisan Global Equity Fund.
-113-
Table of Contents
Net Income
The following table sets forth our income before income taxes, provision for income taxes, net income and adjusted operating margin for the years ended December 31, 2011 and 2010:
| Year Ended December 31, |
Period-to-Period | |||||||||||||||
| 2011 | 2010 | Net Change | % Change | |||||||||||||
| (dollars in millions) | ||||||||||||||||
| Revenues |
$ | 455.1 | $ | 382.3 | $ | 72.8 | 19 | % | ||||||||
| Total operating expenses |
300.8 | 317.1 | (16.3 | ) | (5 | ) | ||||||||||
|
|
|
|
|
|||||||||||||
| Operating income |
154.3 | 65.2 | 89.1 | 137 | ||||||||||||
| Total non-operating income (loss) |
(23.1 | ) | (21.4 | ) | (1.7 | ) | (8 | ) | ||||||||
|
|
|
|
|
|||||||||||||
| Income before income taxes |
131.2 | 43.8 | 87.4 | 200 | ||||||||||||
| Provision for income taxes |
1.2 | 1.3 | (0.1 | ) | (8 | ) | ||||||||||
|
|
|
|
|
|||||||||||||
| Net income before noncontrolling interests |
130.0 | 42.5 | 87.5 | 206 | ||||||||||||
| Less: Net loss attributable to noncontrolling interests |
(3.1 | ) | — | (3.1 | ) | — | ||||||||||
|
|
|
|
|
|||||||||||||
| Net income attributable to Artisan Partners Holdings LP |
$ | 133.1 | $ | 42.5 | $ | 90.6 | 213 | % | ||||||||
|
|
|
|
|
|||||||||||||
| Adjusted operating margin(1) |
41.5 | % | 42.3 | % | (0.8 | )% | (2 | )% | ||||||||
| (1) | For a discussion of adjusted operating margin and a reconciliation to GAAP operating income, please see pages 92-93 of this prospectus. |
Income before income taxes increased by $87.4 million, or 200%, to $131.2 million for the year ended December 31, 2011 from $43.8 million for the year ended December 31, 2010. Net income increased by $87.5 million, or 206%, to $130.0 million for the year ended December 31, 2011 from $42.5 million for the year ended December 31, 2010. This increase was due primarily to the decrease in operating expenses associated with the change in value of our Class B liability awards as compared to the year ended December 31, 2010. Net loss attributable to noncontrolling interests represents losses associated with the private investment partnership which commenced operations on July 25, 2011. Net income attributable to Artisan Partners Holdings LP was $133.1 million for the year ended December 31, 2011, an increase of $90.6 million, or 213%, from $42.5 million for the year ended December 31, 2010. Our adjusted operating margin declined slightly to 41.5% for the year ended December 31, 2011 from 42.3% for the year ended December 31, 2010, as the overall increase in our adjusted operating expenses, particularly our general and administrative expenses, outpaced the overall increase in our revenues.
-114-
Table of Contents
Year Ended December 31, 2010 Compared to Year Ended December 31, 2009
Assets Under Management
Our assets under management increased by $10.7 billion, or 23%, to $57.5 billion as of December 31, 2010 from $46.8 billion as of December 31, 2009. As of December 31, 2010, our assets under management consisted of 55% Artisan Funds and 45% separate accounts, as compared to 57% Artisan Funds and 43% separate accounts as of December 31, 2009. The following table sets forth the changes in our assets under management for Artisan Funds and the separate accounts that we managed for the years ended December 31, 2010 and 2009, as well as our average assets under management for each period:
| Year Ended December 31, |
Period-to-Period | |||||||||||||||
| 2010 | 2009 | $ Change | % Change | |||||||||||||
| (dollars in millions) | ||||||||||||||||
| Artisan Funds |
||||||||||||||||
| Beginning assets under management |
$ | 26,644 | $ | 17,210 | $ | 9,434 | 55 | % | ||||||||
| Gross client cash inflows |
7,524 | 7,278 | 246 | 3 | ||||||||||||
| Gross client cash outflows |
6,718 | 5,215 | 1,503 | 29 | ||||||||||||
| Net client cash flows |
806 | 2,063 | (1,257 | ) | (61 | ) | ||||||||||
| Market appreciation (depreciation) |
3,917 | 7,531 | (3,614 | ) | (48 | ) | ||||||||||
| Transfers between investment vehicles |
— | (160 | ) | 160 | — | |||||||||||
|
|
|
|
|
|||||||||||||
| Ending assets under management |
$ | 31,367 | $ | 26,644 | $ | 4,723 | 18 | |||||||||
|
|
|
|
|
|||||||||||||
| Average assets under management |
$ | 27,646 | $ | 20,792 | $ | 6,854 | 33 | |||||||||
| Separate Accounts |
||||||||||||||||
| Beginning assets under management |
$ | 20,144 | $ | 13,367 | $ | 6,777 | 51 | |||||||||
| Gross client cash inflows |
5,722 | 3,048 | 2,674 | 88 | ||||||||||||
| Gross client cash outflows |
3,118 | 2,555 | 563 | 22 | ||||||||||||
|
|
|
|
|
|||||||||||||
| Net client cash flows |
2,604 | 493 | 2,111 | 428 | ||||||||||||
| Market appreciation (depreciation) |
3,344 | 6,124 | (2,780 | ) | (45 | ) | ||||||||||
| Transfers between investment vehicles |
— | 160 | (160 | ) | — | |||||||||||
|
|
|
|
|
|||||||||||||
| Ending assets under management |
$ | 26,092 | $ | 20,144 | $ | 5,948 | 30 | |||||||||
|
|
|
|
|
|||||||||||||
| Average assets under management |
$ | 21,078 | $ | 16,126 | $ | 4,952 | 31 | |||||||||
| Total Assets Under Management |
||||||||||||||||
| Beginning assets under management |
$ | 46,788 | $ | 30,577 | $ | 16,211 | 53 | |||||||||
| Gross client cash inflows |
13,246 | 10,326 | 2,920 | 28 | ||||||||||||
| Gross client cash outflows |
9,836 | 7,770 | 2,066 | 27 | ||||||||||||
|
|
|
|
|
|||||||||||||
| Net client cash flows |
3,410 | 2,556 | 854 | 33 | ||||||||||||
| Market appreciation (depreciation) |
7,261 | 13,655 | (6,394 | ) | (47 | ) | ||||||||||
| Transfers between investment vehicles |
— | — | — | — | ||||||||||||
|
|
|
|
|
|||||||||||||
| Ending assets under management |
$ | 57,459 | $ | 46,788 | $ | 10,671 | 23 | |||||||||
|
|
|
|
|
|||||||||||||
| Average assets under management |
$ | 48,724 | $ | 36,918 | $ | 11,806 | 32 | % | ||||||||
Revenues
Our investment management fees increased $86.1 million, or 29%, to $382.3 million for the year ended December 31, 2010 from $296.2 million for the year ended December 31, 2009. This increase was driven primarily by an $11.8 billion, or 32%, increase in our average assets under management to $48.7 billion for the year ended December 31, 2010 from $36.9 billion for the year ended December 31, 2009. The increase in our average assets under management was primarily attributable to the continued recovery of global equity markets
-115-
Table of Contents
during 2010, compared to the year ended December 31, 2009, during which period the global economic crisis caused a sharp decline in our assets under management. During the year ended December 31, 2010, our net client cash inflows were $3.4 billion, which was an increase of $0.9 billion compared to the year ended December 31, 2009. Our weighted average investment management fee decreased slightly to 79 basis points for the year ended December 31, 2010 from 80 basis points for the year ended December 31, 2009 as a result of the growth in assets subject to lower fee tiers in our advisory contract fee schedules, which were triggered by higher assets under management. To a lesser extent, this decrease was also a result of the increase in separate accounts as a percentage of our assets under management, which paid a lower weighted average fee (57 basis points and 61 basis points for the years ended December 31, 2010 and December 31, 2009, respectively), compared with Artisan Funds, to which we provide services in addition to the services we provide to separate account clients and which paid a weighted average fee of 95 basis points for the years ended December 31, 2010 and December 31, 2009.
Operating Expenses
The following table sets forth our operating expenses for the years ended December 31, 2010 and 2009:
| Year Ended December 31, |
Period-to-Period | |||||||||||||||
| 2010 | 2009 | $ Change | % Change | |||||||||||||
| (dollars in millions) | ||||||||||||||||
| Salaries, incentive compensation, and benefits |
$ | 166.6 | $ | 132.9 | $ | 33.7 | 25 | % | ||||||||
| Distributions on Class B liability awards |
17.6 | 2.5 | 15.1 | 604 | ||||||||||||
| Change in value of Class B liability awards |
79.1 | 41.8 | 37.3 | 89 | ||||||||||||
|
|
|
|
|
|||||||||||||
| Total compensation and benefits expense |
263.3 | 177.2 | 86.1 | 49 | ||||||||||||
| Distribution and marketing |
23.0 | 17.8 | 5.2 | 29 | ||||||||||||
| Occupancy |
8.1 | 8.0 | 0.1 | 1 | ||||||||||||
| Communication and technology |
9.9 | 10.1 | (0.2 | ) | (2 | ) | ||||||||||
| General and administrative |
12.8 | 10.0 | 2.8 | 28 | ||||||||||||
|
|
|
|
|
|||||||||||||
| Total operating expenses |
$ | 317.1 | $ | 223.1 | $ | 94.0 | 42 | % | ||||||||
|
|
|
|
|
|||||||||||||
Total operating expenses increased by $94.0 million, or 42%, to $317.1 million for the year ended December 31, 2010 from $223.1 million for the year ended December 31, 2009. This increase was primarily attributable to increased compensation and benefits expense, which increased by $86.1 million, or 49%, to $263.3 million for the year ended December 31, 2010 from $177.2 million for the year ended December 31, 2009. Salary, incentive compensation and benefits represented 44% and 45% of our revenues for the years ended December 31, 2010 and 2009, respectively.
The increase in total compensation and benefits expense of $86.1 million was primarily a result of an increase in distributions to Class B partners, an increase in the value of our Class B liability awards and an increase in salaries, incentive compensation and benefits during the year ended December 31, 2010 as compared to the year ended December 31, 2009, as our assets under management and revenues improved along with the global equity markets. Distributions to Class B partners increased as a result of higher tax distribution payments which correspond to higher earnings in 2010 as compared to 2009. The increase in the value of our Class B liability awards primarily resulted from an increase in the value of the firm (as determined for this purpose under Artisan Partners Holdings’ limited partnership agreement). Incentive compensation paid to our investment and marketing professionals is directly linked to our revenues and consequently increased by $23.4 million because of our higher investment management fee revenue during 2010 compared to 2009. Incentive compensation paid to our administrative and executive teams is discretionary and increased $5.1 million during 2010 compared to 2009 as a result of our improved financial performance. In addition, we incurred non-recurring compensation costs associated with the hiring of our new portfolio manager for the Global Equity strategy of $2.8 million.
Distribution and marketing fees increased by $5.2 million, or 29%, to $23.0 million for the year ended December 31, 2010 from $17.8 million for the year ended December 31, 2009, primarily as a result of the overall increase in our assets under management invested in Artisan Funds through certain intermediaries.
-116-
Table of Contents
General and administrative expenses increased by $2.8 million, or 28%, to $12.8 million for the year ended December 31, 2010 from $10.0 million for the year ended December 31, 2009. This increase was primarily attributable to higher professional fees and travel and entertainment expenses. Professional fees increased in 2010 as compared to 2009 due to accounting fees associated with tax planning, capital structure planning and search and placement fees for newly hired employees. Travel and entertainment costs were higher in 2010 because we significantly limited the amount of travel by our associates during 2009, commensurate with the decline in revenues caused by the global equity market crisis during the first six months of 2009.
Non-Operating Income (Loss)
The following table sets forth our non-operating income (loss) for the years ended December 31, 2010 and 2009:
| Year Ended December 31, |
Period-to-Period | |||||||||||||||
| 2010 | 2009 | Net Change | % Change | |||||||||||||
| (dollars in millions) | ||||||||||||||||
| Interest expense |
$ | (23.0 | ) | $ | (24.9 | ) | $ | 1.9 | 8 | % | ||||||
| Other income (loss) |
1.6 | — | 1.6 | — | ||||||||||||
|
|
|
|
|
|||||||||||||
| Total non-operating income (loss) |
$ | (21.4 | ) | $ | (24.9 | ) | $ | 3.5 | 14 | % | ||||||
|
|
|
|
|
|||||||||||||
Interest expense for the year ended December 31, 2010 was $23.0 million, a decrease of $1.9 million, or 8%, from $24.9 million for the year ended December 31, 2009. This decrease resulted from the increase in the unhedged portion of our term loan, which allowed us to pay the lower stated interest rate on that unhedged portion rather than the higher fixed rate payable under our interest rate swap agreements. Other income of $1.6 million for the year ended December 31, 2010 relates mainly to a gain of $0.9 million on the change in fair value on our forward starting swap, which resulted from an increase in interest rates from the date we entered into the forward starting swap to the date the swap was designated as an effective cash flow hedge. In addition, we recognized a gain of $0.7 million on the gain on the sale of certain available-for-sale investments in March 2010. We sold certain of our investments in Artisan Funds, initially made as seed capital investments, to partially fund our seed investment in Artisan Global Equity Fund.
Net Income
The following table sets forth our income before income taxes, provision for income taxes, net income and adjusted operating margin for the years ended December 31, 2010 and 2009:
| Year Ended December 31, | Period-to-Period | |||||||||||||||
| 2010 | 2009 | Net Change | % Change | |||||||||||||
| (dollars in millions) | ||||||||||||||||
| Revenues |
$ | 382.3 | $ | 296.2 | $ | 86.1 | 29 | % | ||||||||
| Total operating expenses |
317.1 | 223.1 | 94.0 | 42 | ||||||||||||
|
|
|
|
|
|||||||||||||
| Operating income |
65.2 | 73.1 | (7.9 | ) | (11 | ) | ||||||||||
| Total non-operating income (loss) |
(21.4 | ) | (24.9 | ) | 3.5 | 14 | ||||||||||
|
|
|
|
|
|||||||||||||
| Income before income taxes |
43.8 | 48.2 | (4.4 | ) | (9 | ) | ||||||||||
| Provision for income taxes |
1.3 | — | 1.3 | — | ||||||||||||
|
|
|
|
|
|||||||||||||
| Net income |
$ | 42.5 | $ | 48.2 | $ | (5.7 | ) | (12 | ) | |||||||
|
|
|
|
|
|||||||||||||
| Adjusted operating margin(1) |
42.3 | % | 39.6 | % | 2.7 | % | 7 | % | ||||||||
| (1) | For a discussion of adjusted operating margin and a reconciliation to GAAP operating income, please see pages 92-93 of this prospectus. |
-117-
Table of Contents
Income before income taxes decreased by $4.4 million, or 9%, to $43.8 million for the year ended December 31, 2010 from $48.2 million for the year ended December 31, 2009. Provision for income taxes increased by $1.3 million as a result of corporate income tax incurred by our U.K. subsidiary which began operations in 2010. Net income decreased by $5.7 million, or 12%, to $42.5 million for the year ended December 31, 2010 from $48.2 million for the year ended December 31, 2009. This decrease is due primarily to the increase in operating expenses as a result of higher compensation and benefits expenses for the year ended December 31, 2010 as compared to the year ended December 31, 2009. Our adjusted operating margin improved to 42.3% for the year ended December 31, 2010 from 39.6% for the year ended December 31, 2009 as the overall increase in our revenues outpaced the overall increase in our adjusted operating expenses (which exclude the expenses we recognize for equity-based compensation, including distributions to the Class B partners of Artisan Partners Holdings, redemptions of Class B limited partnership interests and changes in the value of Class B liability awards).
Quarterly Results
The following tables set forth selected unaudited consolidated quarterly results of operations data and selected consolidated operating data for the eight quarters ended June 30, 2012. This unaudited information has been prepared on substantially the same basis as our audited consolidated financial statements and includes all adjustments, consisting only of normal recurring adjustments, necessary to a fair statement of the consolidated results of operations and selected consolidated operating data for the periods presented therein. The unaudited consolidated quarterly data should be read together with the consolidated financial statements and related notes included elsewhere in this prospectus. The results for any quarter are not necessarily indicative of results for any future period, and you should not rely on them as such. Changes to our operating results from one period to another are primarily caused by changes in the value of our assets under management, which increase or decrease with the general worldwide stock markets, net inflows or outflows of cash into our various investment strategies and with the investment performance of these strategies. Our operating income is further impacted by variations in the level of total compensation and benefits expense and distribution fees, of which a large portion is variable and fluctuates in relation to our revenue or other financial metrics. Distributions paid to our Class B partners will also impact our operating income.
| Three Months Ended | ||||||||||||||||||||||||||||||||
| June 30, 2012 (unaudited) |
March 31, 2012 (unaudited) |
December 31, 2011 (unaudited) |
September 30, 2011 (unaudited) |
June 30, 2011 (unaudited) |
March 31, 2011 (unaudited) |
December 31, 2010 (unaudited) |
September 30, 2010 (unaudited) |
|||||||||||||||||||||||||
| (dollars in millions) | ||||||||||||||||||||||||||||||||
| Statements of Operations Data: |
||||||||||||||||||||||||||||||||
| Total revenue |
$ | 120.8 | $ | 119.7 | $ | 111.6 | $ | 110.3 | $ | 120.3 | $ | 112.9 | $ | 106.9 | $ | 92.5 | ||||||||||||||||
| Operating income (loss) |
41.4 | 4.5 | 26.7 | 70.4 | 40.1 | 17.1 | (1.7 | ) | 30.6 | |||||||||||||||||||||||
| Net income (loss) |
$ | 38.8 | $ | 1.2 | $ | 21.9 | $ | 67.0 | $ | 34.1 | $ | 10.1 | $ | (8.3 | ) | $ | 25.3 | |||||||||||||||
| Other Operating Data: |
||||||||||||||||||||||||||||||||
| Assets under management at period end |
$ | 64,072 | $ | 66,492 | $ | 57,104 | $ | 51,767 | $ | 63,645 | $ | 62,665 | $ | 57,459 | $ | 49,785 | ||||||||||||||||
| Average assets under management |
$ | 63,637 | $ | 62,925 | $ | 56,336 | $ | 57,930 | $ | 63,497 | $ | 60,037 | $ | 54,611 | $ | 46,517 | ||||||||||||||||
| Total revenues |
$ | 120.8 | $ | 119.7 | $ | 111.6 | $ | 110.3 | $ | 120.3 | $ | 112.9 | $ | 106.9 | $ | 92.5 | ||||||||||||||||
| Weighted average fee |
76 bps | 76 bps | 79 bps | 76 bps | 76 bps | 76 bps | 78 bps | 79 bps | ||||||||||||||||||||||||
| Adjusted operating margin(1) |
41.6 | % | 39.6 | % | 41.4 | % | 40.1 | % | 42.8 | % | 41.6 | % | 43.3 | % | 43.2 | % | ||||||||||||||||
| (1) | For a discussion of adjusted operating margin, please see page 92 of this prospectus. |
-118-
Table of Contents
The following table reconciles our adjusted operating margin with GAAP operating margin for the periods presented:
| Three Months Ended | ||||||||||||||||||||||||||||||||
| June 30, 2012 (unaudited) |
March 31, 2012 (unaudited) |
December 31, 2011 (unaudited) |
September 30, 2011 (unaudited) |
June 30, 2011 (unaudited) |
March 31, 2011 (unaudited) |
December 31, 2010 (unaudited) |
September 30, 2010 (unaudited) |
|||||||||||||||||||||||||
| (dollars in millions) | ||||||||||||||||||||||||||||||||
| GAAP operating income |
$ | 41.4 | $ | 4.5 | $ | 26.7 | $ | 70.4 | $ | 40.1 | $ | 17.1 | $ | (1.7 | ) | $ | 30.6 | |||||||||||||||
| Distributions on Class B liability awards |
13.8 | 8.1 | — | 7.7 | 12.5 | 35.5 | — | 5.2 | ||||||||||||||||||||||||
| Change in value of Class B liability awards |
(4.9 | ) | 34.8 | 19.5 | (33.9 | ) | (1.1 | ) | (5.6 | ) | 48.0 | 4.2 | ||||||||||||||||||||
|
|
|
|
|
|
|
|
|
|
|
|
|
|
|
|
|
|||||||||||||||||
| Adjusted operating income |
$ | 50.3 | $ | 47.4 | $ | 46.2 | $ | 44.2 | $ | 51.5 | $ | 47.0 | $ | 46.3 | $ | 40.0 | ||||||||||||||||
| Total revenues |
$ | 120.8 | $ | 119.7 | $ | 111.6 | $ | 110.3 | $ | 120.3 | $ | 112.9 | $ | 106.9 | $ | 92.5 | ||||||||||||||||
| GAAP operating margin |
34.3 | % | 3.8 | % | 23.9 | % | 63.8 | % | 33.3 | % | 15.1 | % | (1.6 | )% | 33.1 | % | ||||||||||||||||
| Adjusted operating margin |
41.6 | % | 39.6 | % | 41.4 | % | 40.1 | % | 42.8 | % | 41.6 | % | 43.3 | % | 43.2 | % | ||||||||||||||||
Liquidity and Capital Resources
Historically, the working capital needs of our business have been met primarily through cash generated by our operations. We expect that our cash and liquidity requirements in the twelve months following this offering will be met primarily through cash generated by our operations and a portion of the net proceeds of this offering. The following table shows our cash and cash equivalents and accounts receivable as of June 30, 2012 and 2011 and December 31, 2011, 2010 and 2009. The data presented excludes the assets of consolidated investment products as these assets are not Artisan’s assets and are not a source of liquidity for Artisan.
| June
30, (unaudited) |
December 31, | |||||||||||||||||||
| 2012 | 2011 | 2011 | 2010 | 2009 | ||||||||||||||||
| (dollars in millions) | ||||||||||||||||||||
| Cash and cash equivalents |
$ | 172.1 | $ | 141.8 | $ | 127.0 | $ | 159.0 | $ | 101.8 | ||||||||||
| Accounts receivable |
$ | 43.1 | $ | 40.3 | $ | 39.5 | $ | 36.7 | $ | 31.7 | ||||||||||
We manage our cash balances in order to fund our day-to-day operations. Accounts receivable primarily represent investment management fees that have been, or will be, billed to our clients and other miscellaneous receivables. We perform a review of our receivables on a monthly basis.
Historically, we have distributed substantially all of our profits to our partners. In the third quarter of 2008 and continuing into 2009 and 2010, in order to build our cash balances, we voluntarily stopped distributions to partners, and beginning in the third quarter of 2009 through the end of the first quarter of 2010, under the terms of our term loan agreement, as in effect at that time, we were restricted from making distributions to our partners, in both cases except tax distributions paid to partners for the purpose of funding tax liabilities attributable to their interests. Our ability to distribute profits to partners ceased to be restricted during the second quarter of 2010 and we distributed $50 million of our retained profits on March 31, 2011. We made additional distributions of $50 million and $12.5 million to our partners on August 21, 2012 and October 16, 2012, respectively. Prior to the consummation of this offering, Artisan Partners Holdings intends to make a cash incentive compensation payment of approximately $56 million to certain of our portfolio managers. In addition, in connection with the reorganization, Artisan Partners Holdings intends to distribute to its pre-offering partners all of its retained profits as of the date of the closing of this offering.
In August 2012, we issued $200 million in unsecured notes and entered into a $100 million five-year revolving credit agreement. We used the proceeds of the notes and $90 million drawn from the revolving credit facility to prepay all of the then-outstanding principal amount of our $400 million term loan.
-119-
Table of Contents
The notes are comprised of three series, each with a balloon payment at maturity. The Series A notes, in an aggregate principal amount of $60 million, bear interest at a rate equal to 4.98% and are due August 16, 2017. The Series B notes, in an aggregate principal amount of $50 million, bear interest at a rate equal to 5.32% and are due August 16, 2019. The Series C notes, in an aggregate principal amount of $90 million, bear interest at a rate equal to 5.82% and are due August 16, 2022. The interest rate on each series of notes is subject to a 1.00% increase in the event Artisan Partners Holdings receives a below-investment grade rating and any such increase will continue to apply until an investment grade rating is received.
Outstanding loans under the revolving credit agreement currently bear interest at a rate equal to, at our election, (i) LIBOR adjusted by a statutory reserve percentage plus an applicable margin ranging from 1.50% to 3.00%, depending on Artisan Partners Holdings’ leverage ratio (as defined in the agreement) or (ii) an alternate base rate equal to the highest of Citibank, N.A.’s prime rate, the federal funds effective rate plus 0.50% and the daily one-month LIBOR adjusted by a statutory reserve percentage plus 1.00%, plus an applicable margin ranging from 0.50% to 2.00%, depending on Artisan Partners Holdings’ leverage ratio (as defined in the agreement). Unused commitments under the revolving credit agreement bear interest at a rate that ranges from 0.175% to 0.625%, depending on Artisan Partners Holdings’ leverage ratio (as defined in the agreement). If the revolving credit agreement had been effective as of June 30, 2012, the applicable margin on the interest rate would have been 1.75% with respect to the LIBOR interest rate option and 0.75% for the alternate base rate interest rate option, and the interest rate on the unused commitments would have been 0.20%. We currently intend to repay all or a portion of the then-outstanding principal amount of any loans under our revolving credit agreement with a portion of the net proceeds of this offering.
The note purchase and revolving credit agreements contain certain customary covenants including limitations on Artisan Partners Holdings’ ability to: (i) incur additional indebtedness or liens, (ii) engage in mergers or other fundamental changes, (iii) sell or otherwise dispose of assets including equity interests, and (iv) make dividend payments or other distributions to Artisan Partners Holdings’ partners (other than, among others, tax distributions paid to partners for the purpose of funding tax liabilities attributable to their interests) when a default occurred and is continuing or would result from such a distribution. In addition, a change of control (as defined in the agreements) of Artisan Partners Holdings or Artisan Partners Asset Management is an event of default under the revolving credit agreement and requires that Artisan Partners Holdings offer to prepay all of the notes under the note purchase agreement. The change of control that we expect to occur for purposes of the 1940 Act and Advisers Act approximately one year after this offering resulting from the resignation from the stockholders committee of the AIC designee will not be a change of control as defined under the agreements.
In addition, covenants in the note purchase and revolving credit agreements require Artisan Partners Holdings to maintain the following financial ratios:
| • | leverage ratio (calculated as the ratio of consolidated total indebtedness on any date to consolidated EBITDA for the period of four consecutive fiscal quarters ended on or prior to such date) cannot exceed 3.00 to 1.00 (Artisan Partners Holdings’ leverage ratio for the twelve months ended June 30, 2012 was 1.48 to 1.00); and |
| • | interest coverage ratio (calculated as the ratio of consolidated EBITDA for any period of four consecutive fiscal quarters to consolidated interest expense for such period) cannot be less than 4.00 to 1.00 for such period (Artisan Partners Holdings’ interest coverage ratio for the twelve months ended June 30, 2012 was 18.84 to 1.00). |
Our failure to comply with any of the covenants or restrictions described above could result in an event of default under the agreements, giving our lenders the ability to accelerate repayment of our obligations.
As part of the reorganization transactions, we will enter into two tax receivable agreements, each of which is described under “Our Structure and Reorganization—Tax Receivable Agreements”. The impact that the tax receivable agreements will have on our consolidated financial statements will be the establishment of a liability, which will be increased upon the exchanges of limited partnership units for our Class A common stock or
-120-
Table of Contents
convertible preferred stock, representing 85% of the estimated future tax benefits, if any, relating to the increase in tax basis associated with the preferred units we receive as a result of the H&F Corp Merger and other exchanges by holders of limited partnership units. As the amount and timing of any payments will vary based on a number of factors (including the timing of future exchanges, the price of our Class A common stock at the time of any exchange, the extent to which such exchanges are taxable and the amount and timing of our income), depending upon the outcome of these factors, we may be obligated to make substantial payments pursuant to the tax receivable agreements. In light of the numerous factors affecting our obligation to make such payments, however, the timing and amount of any such actual payments are not certain at this time. For more information about the tax receivable agreements, see “Our Structure and Reorganization—Tax Receivable Agreements” and “Unaudited Pro Forma Consolidated Financial Information”.
As discussed under “Dividend Policy and Dividends”, we will fund any distribution pursuant to our dividend policy by causing Artisan Partners Holdings to distribute cash to its partners, including us, in an amount sufficient to cover dividends, if any, declared by us.
Cash Flows
The following table sets forth our cash flows for the six months ended June 30, 2012 and 2011 and the years ended December 31, 2011, 2010 and 2009. Operating activities consist of net income subject to adjustments for accounts payable and accrued expenses, Class B liability awards, accounts receivable, depreciation and amortization and other items. Investing activities consist primarily of acquiring and selling property and equipment, leasehold improvements and the purchase and sale of available-for-sale securities. Financing activities consist primarily of partnership distributions to non-employee partners, payments on the note payable, proceeds from the note payable and debt issuance costs.
The consolidation of variable interest entities, as further discussed in “—Critical Accounting Policies and Estimates—Consolidation”, did not impact our cash. We have no rights to the benefits from, nor do we bear the risks associated with, the assets and liabilities of variable interest entities required to be consolidated, beyond our investments in and investment advisory fees generated from these entities, which are eliminated in consolidation. Additionally, creditors of variable interest entities have no recourse to our general credit beyond the level of our investment, so we do not consider those liabilities to be our obligations.
| For the Six Months Ended June 30, (unaudited) |
For the Year Ended December 31, |
|||||||||||||||||||
| 2012 | 2011 | 2011 | 2010 | 2009 | ||||||||||||||||
| (dollars in millions) | ||||||||||||||||||||
| Cash flow data |
||||||||||||||||||||
| Net cash provided by (used in) operating activities |
$ | 109.7 | $ | 80.9 | $ | 103.2 | $ | 116.0 | $ | 86.3 | ||||||||||
| Net cash provided by (used in) investing activities |
(1.7 | ) | (21.8 | ) | (19.6 | ) | (0.3 | ) | (1.2 | ) | ||||||||||
| Net cash provided by (used in) financing activities |
(62.9 | ) | (76.3 | ) | (115.6 | ) | (58.6 | ) | (19.2 | ) | ||||||||||
|
|
|
|
|
|
|
|
|
|
|
|||||||||||
| Net increase (decrease) in cash and cash equivalents |
$ | 45.1 | $ | (17.2 | ) | $ | (32.0 | ) | $ | 57.1 | $ | 65.9 | ||||||||
Six Months Ended June 30, 2012 Compared to Six Months Ended June 30, 2011
Operating activities provided $109.7 million and $80.9 million for the six months ended June 30, 2012 and 2011, respectively. This increase in net cash flows from operating activities was driven by an increase in the value of our Class B liability awards of $26.2 million for the six months ended June 30, 2012 as compared to a decrease of $10.4 million for the six months ended June 30, 2011. Included in the cash provided by operating activities for both periods was the benefit of accrued incentive compensation to our cash position as incentive payments related to second quarter revenues are paid in the third quarter of the year and bonus payments for the
-121-
Table of Contents
executive and administrative groups are paid in the fourth quarter of the year. Transactions associated with the private investment partnership that is consolidated under ASC 810 did not have a material impact on our net cash provided by operating activities. These assets are not considered Artisan’s assets.
Investing activities used $1.7 million and $21.8 million of net cash for the six months ended June 30, 2012 and 2011, respectively. The decrease in net cash used in investing activities was primarily due to our purchase in March 2011 of investment securities in the amount of $20.0 million in connection with a new incentive compensation plan that commenced in March 2011. This incentive compensation plan provides certain portfolio managers with additional cash compensation over a three-year period based on the then-current value of the investment securities, which are shares of mutual funds managed by such portfolio managers. Artisan is not required to purchase additional securities as part of this plan and does not intend to enter into other similar incentive compensation plans in the future.
Financing activities used $62.9 million and $76.3 million of net cash for the six months ended June 30, 2012 and 2011, respectively. This decrease in net cash used in financing activities was primarily the result of a $23.5 million profits distribution to our non-employee partners during the six months ended June 30, 2011. No profits distributions were paid during the six months ended June 30, 2012. This decrease was partially offset by an increase in principal payments on the note payable, which totaled $35.4 million for the six months ended June 30, 2012, compared to $20.0 million for the six months ended June 30, 2011. Capital of $4.0 million was contributed to the private investment partnership consolidated under ASC 810 during the six months ended June 30, 2012. This capital is not considered Artisan’s capital.
Year Ended December 31, 2011 Compared to Year Ended December 31, 2010
Operating activities provided $103.2 million and $116.0 million for the years ended December 31, 2011 and 2010, respectively. This decrease in net cash flows from operating activities was driven primarily by a decrease in the value of our Class B liability awards of $24.9 million for the year ended December 31, 2011 as compared to an increase of $78.2 million for the year ended December 31, 2010. Improved net income of $130.0 million for the year ended December 31, 2011 as compared to $42.5 million for the year ended December 31, 2010 partially offset the impact of the decrease in the value of the Class B liability awards. Transactions associated with the private investment partnership that is consolidated under ASC 810 did not have a material impact on our net cash provided by operating activities. These assets are not considered Artisan’s assets.
Investing activities used $19.6 million and $0.3 million of net cash for the years ended December 31, 2011 and 2010, respectively. The increase in net cash used in investing activities in 2011 was primarily due to our purchase in March 2011 of investment securities in the amount of $20.0 million in connection with a new incentive compensation plan that commenced in March 2011. This incentive compensation plan provides certain portfolio managers with additional cash compensation over a three-year period based on the then-current value of the investment securities, which are shares of mutual funds managed by such portfolio managers. Artisan is not required to purchase additional securities as part of this plan and does not intend to enter into other similar incentive compensation plans in the future.
Financing activities used $115.6 million and $58.6 million of net cash for the years ended December 31, 2011 and 2010, respectively. This increase in net cash used in financing activities was primarily the result of (i) a $23.5 million profits distribution paid in 2011 to our non-employee partners as compared to 2010 when no profits distributions were made and (ii) an increase in principal payments on the note payable, which totaled $55.2 million for the year ended December 31, 2011 as compared to $20.0 million for the year ended December 31, 2010. Capital of $6.9 million was contributed to the private investment partnership consolidated under ASC 810 during the year ended December 31, 2011. This capital is not considered Artisan’s capital.
Year Ended December 31, 2010 Compared to Year Ended December 31, 2009
Operating activities provided $116.0 million and $86.3 million of net cash for the years ended December 31, 2010 and 2009, respectively. This increase in net cash flows from operating activities was driven primarily by an increase in our average assets under management to $48.7 billion for the year ended December 31, 2010 from
-122-
Table of Contents
$36.9 billion for the year ended December 31, 2009, which had a corresponding positive impact on our investment management fee revenue. This increase in net cash was partially offset by (i) the increased variable cash incentive compensation paid to our investment and marketing and client service professionals as our investment management fees increased, and (ii) the fact that distributions to our Class B partners increased $15.1 million from 2009 to 2010.
Investing activities used $0.3 million and $1.2 million of net cash for the years ended December 31, 2010 and 2009, respectively. The increased cash from investing activities was primarily due to the sale of certain available-for-sale investments in March 2010. We sold certain of our investments in Artisan Funds, initially made as seed capital investments, to partially fund our seed investment in Artisan Global Equity Fund.
Financing activities used $58.6 million and $19.2 million of net cash for the years ended December 31, 2010 and 2009, respectively. This increase in net cash used in financing activities was primarily the result of tax distributions to our non-employee partners during the year ended December 31, 2010 as compared to the year ended December 31, 2009. In addition, we paid $20.0 million in principal payments on our term loan during the year ended December 31, 2010.
Certain Contractual Obligations
The following table sets forth our total obligations under certain contracts as of December 31, 2011. The consolidation of variable interest entities, as further discussed below in “—Critical Accounting Policies and Estimates—Consolidation”, does not impact our cash. We have no rights to the benefits from, nor do we bear the risks associated with, the assets and liabilities of variable interest entities required to be consolidated, beyond our investments in and investment advisory fees generated from these entities, which are eliminated in consolidation. Additionally, creditors of variable interest entities have no recourse to our general credit beyond the level of our investment, so we do not consider those liabilities to be our obligations and as such, these liabilities are not included in the table below.
| Payments Due by Period | ||||||||||||||||||||
| Total | Less than 1 year |
1-3 Years | 3-5 Years | More than 5 Years |
||||||||||||||||
| (dollars in millions) | ||||||||||||||||||||
| Note payable principal payments(1) |
$ | 324.8 | $ | 54.5 | $ | 270.3 | $ | — | $ | — | ||||||||||
| Interest payable(2) |
14.1 | 9.7 | 4.4 | — | — | |||||||||||||||
| Operating lease obligations |
35.5 | 7.0 | 11.7 | 6.2 | 10.6 | |||||||||||||||
| Long-term bonus agreement |
16.2 | 4.1 | 12.1 | — | — | |||||||||||||||
| Class B liability awards |
146.2 | — | — | — | 146.2 | |||||||||||||||
| Other long-term liabilities reflected on our balance sheet under GAAP |
14.9 | 3.8 | 7.4 | 3.7 | — | |||||||||||||||
|
|
|
|
|
|
|
|
|
|
|
|||||||||||
| Total |
$ | 551.7 | $ | 79.1 | $ | 305.9 | $ | 9.9 | $ | 156.8 | ||||||||||
|
|
|
|
|
|
|
|
|
|
|
|||||||||||
| (1) | In August 2012, we used the proceeds from the issuance of $200 million in unsecured notes and $90 million drawn from a $100 million revolving credit facility to prepay all of the then-outstanding principal amount of our $400 million term loan. The $200.0 million in unsecured notes consists of $60.0 million 4.98% Series A notes maturing August 16, 2017, $50.0 million 5.32% Series B notes maturing August 16, 2019, and $90.0 million 5.82% Series C notes maturing August 16, 2022. Outstanding loans under the revolving credit agreement bear interest at a rate equal to, at our election, (i) LIBOR adjusted by a statutory reserve percentage plus an applicable margin ranging from 1.50% to 3.00%, depending on Artisan’s leverage ratio (as defined in the agreement) or (ii) an alternate base rate equal to the highest of prime rate plus 0.50% and the daily one-month LIBOR adjusted by a statutory reserve percentage plus 1.00%, plus an applicable margin ranging from 0.50% to 2.00%, depending on Artisan’s leverage ratio (as defined in the agreement). Unused commitments under the revolving credit agreement bear interest at a rate that ranges from 0.175% to 0.625%, depending on Artisan’s leverage ratio (as defined in the agreement). |
| (2) | See footnote 1 above, for interest rate information applicable to our debt arrangements effective August 2012. |
-123-
Table of Contents
Note payable principal payments of $324.8 million represent the term loan agreement that our subsidiary, Artisan Partners Holdings, entered into in July 2006. In August 2012, we issued $200 million in unsecured notes and entered into a $100 million five-year revolving credit agreement. We currently intend to repay all or a portion of the then-outstanding principal amount of any loans under our revolving credit agreement with a portion of the net proceeds of this offering.
Operating lease obligations represent commitments for non-cancelable operating lease payments for office space, furniture, and equipment. Long-term bonus agreement represents amounts due pursuant to an incentive compensation plan that commenced in March 2011 and provides certain portfolio managers with additional cash compensation over a three-year period based on the then-current value of investment securities purchased by Artisan at the commencement of the plan.
The $146.2 million liability associated with the Class B liability awards is due to the accounting treatment of grants of Class B common units. Because vested Class B common units of a terminated employee are redeemed in cash with payment over the five years following termination of employment at an aggregate amount determined under a formula stated in the corresponding grant agreement, we have historically accounted for the aggregate redemption value of vested Class B common units as a long-term liability. Other long-term liabilities include liabilities associated with Class B partner redemptions of $14.9 million associated with partners that have been terminated as of December 31, 2011. As part of the reorganization transactions, we intend to amend the grant agreements pursuant to which the Class B common units were issued, which will result in, among other things, the elimination of Artisan Partners Holdings’ obligation to redeem any of its Class B common units upon the termination of employment of the holders of such units. Accordingly, we expect to no longer recognize a liability for the redemption value of Class B common units, except for those partners that have already terminated.
Off-Balance Sheet Arrangements
We did not have any off-balance sheet arrangements as of June 30, 2012.
Critical Accounting Policies and Estimates
The accompanying consolidated financial statements were prepared in accordance with GAAP, and related rules and regulations of the SEC. The preparation of financial statements in conformity with GAAP requires management to make estimates or assumptions that affect the reported amounts of assets and liabilities at the date of the financial statements and the reported amounts of revenues and expenses during the periods presented. Actual results could differ from these estimates or assumptions and may have a material effect on the consolidated financial statements.
Accounting policies are an integral part of our financial statements. A thorough understanding of these accounting policies is essential when reviewing our reported results of operations and our financial condition. Management believes that the critical accounting policies and estimates discussed below involve additional management judgment due to the sensitivity of the methods and assumptions used.
Consolidation
The primary beneficiary of variable interest entities (VIEs) consolidate the VIEs. A VIE is an entity in which the equity-at-risk holders cannot control the entity. Artisan provides investment management services to a private investment partnership the investors in which are certain of our employees. Artisan makes day-to-day investment decisions concerning the assets of the private investment partnership. This partnership is consolidated under variable interest entity consolidation guidance. Artisan determined it is the primary beneficiary of this private investment partnership since it retains exclusive control of the management and affairs of the partnership.
-124-
Table of Contents
Assessing if an entity is a VIE involves judgment and analysis. Factors included in this assessment include the legal organization of the entity, Artisan’s contractual involvement with the entity and any related party or de facto agent implications of Artisan’s involvement with the entity. Determining if Artisan is the primary beneficiary of a VIE also requires significant judgment. There is judgment involved to assess if Artisan has the power to direct the activities that most significantly impact the entity’s economic results and to assess if Artisan’s interests could be deemed to be significant.
As of June 30, 2012, Artisan consolidated a private investment partnership that held assets totaling $36.5 million (including cash and cash equivalents, accounts receivable and investment securities) and liabilities totaling $7.8 million (including payables for investment purchased and liabilities for short positions). As circumstances change, the determination of VIE and primary beneficiary status may change.
Revenue Recognition
Investment management fees are computed as a percentage of assets under management and recognized as earned. Fees for providing investment management services are computed and billed in accordance with the provisions of the applicable investment management agreements. The investment management agreements for a small number of accounts provide for performance-based fees. Performance-based fees, if earned, are recognized on the contractually determined measurement date. Interest and dividend income is recognized when earned. Performance fees generally are not subject to clawback as a result of performance declines subsequent to the most recent measurement date.
The investment management fees that we receive are calculated based on the values of the securities held in the accounts that we manage for our clients. For our U.S.-registered mutual fund clients, including Artisan Funds, our fees are based on the values of the funds’ assets as determined for purposes of calculating their net asset values. Securities held by U.S.-registered mutual funds, including Artisan Funds, are generally valued at closing market prices, or if closing market prices are not readily available or are not considered reliable, at a fair value determined under procedures established by the fund’s board (fair value pricing). A U.S.-registered mutual fund typically considers a closing market price not to be readily available, and therefore uses fair value pricing, if, among other things, the value of the security might have been materially affected by events occurring after the close of the market in which the security was principally traded but before the time for determination of the fund’s net asset value. A subsequent event might be a company-specific development, a development affecting an entire market or region, or a development that might be expected to have global implications. A significant change in securities prices in U.S. markets may be deemed to be such a subsequent event with respect to non-U.S. securities. Values of securities determined using fair value pricing are likely to be different than they would be if only closing market prices were used. As a result, over short periods of time, the revenues we generate from U.S.-registered mutual funds, including Artisan Funds, may be different than they would be if only closing prices were used in valuing portfolio securities. Over longer time periods, the differences in our fees resulting from fair value pricing are not material.
For our separate account clients other than U.S.-registered mutual funds, our fees may be based, at the client’s option, on the values of the securities in the portfolios we manage as determined by the client (or its custodian or other service provider) or by us in accordance with valuation procedures we have adopted. The valuation procedures we have adopted generally use closing market prices in the markets in which the securities trade, without adjustment for subsequent events except in unusual circumstances. We believe that our fees based on valuations determined under our procedures are not materially different from the fees we receive that are based on valuations determined by clients, their custodians or other service providers.
The portfolios of Artisan Funds and Artisan Global Funds, as well as the portfolios we manage for our separate account clients, are invested almost entirely in publicly-traded equity securities for which public market values are readily available, with a modest portion of each portfolio held in cash or cash-like instruments.
See “—Qualitative and Quantitative Disclosures Regarding Market Risk—Market Risk” for a sensitivity analysis that demonstrates the impact that changes in our assets under management could have on our revenues.
-125-
Table of Contents
Equity-Based Compensation
Class B limited partnership interests of Artisan Partners Holdings have been granted to certain employees under the terms of Artisan Partners Holdings’ limited partnership agreement and pursuant to written grant agreements. The limited partnership interests granted to the Class B partners provided for an interest in future profits of Artisan Partners Holdings as well as an interest in the overall appreciation or depreciation of Artisan Partners Holdings subsequent to the date of grant under the terms of the corresponding grant agreements. In July 2012, the limited partnership agreement of Artisan Partners Holdings was amended to reclassify the Class B limited partnership interests as “Class B common units”. Class B common units generally vest ratably over a five-year vesting period, beginning on the date of grant. Vesting is accelerated upon the occurrence of certain events, including a change in control. Class B partners are entitled to fully participate in future profits from and after the date of grant. The distribution of profits associated with these interests is recorded to compensation and benefits expense. Generally, these profits distributions are determined based on Artisan Partners Holdings’ net income before equity-based compensation charges.
Class B common units may not be sold. Prior to the consummation of this offering, all vested Class B common units are subject to mandatory redemption on termination of employment for any reason. Unvested Class B common units are forfeited on termination of employment. Vested units of a terminated employee are redeemed in cash, with payment in annual installments over the five years following termination of employment, at an aggregate amount determined under a formula stated in the corresponding grant agreement. Due to the cash redemption feature, the grants are considered liability awards under ASC 718. Prior to April 6, 2011, compensation cost was measured based on the intrinsic value of the limited partnership interests granted, and was re-measured each period. Intrinsic value was measured using the redemption formula of the Class B awards. The redemption formula was based on current EBITDA (excluding equity-based compensation charges) multiplied by a stated multiple and adjusted to take into account working capital, debt and non-current liabilities associated with Class B partner redemptions. Intrinsic value as measured each period was recognized as expense over the remaining vesting period, typically five years. Changes in the intrinsic value that occurred after the end of the vesting period were recorded as compensation cost of the period in which the changes occurred through settlement of the interests. Because the intrinsic value of the Class B limited partnership interests was based on the EBITDA formula described above, significant fluctuations in the measurement of the Class B interests occurred with changes in EBITDA (before equity-based compensation charges) as a result of changes in assets under management, revenues or operating expenses.
Accounting for our Class B limited partnership interests has changed as we transition from a private company to a public company. Historical financial statements presented for periods prior to April 6, 2011 reflect the Class B limited partnership interests as liability awards with measurement at intrinsic value under ASC 718. In our financial statements for periods subsequent to April 6, 2011 and before the completion of this offering, the Class B limited partnership interests are reflected as liabilities measured at fair value, instead of intrinsic value. As part of the calculation to estimate the fair value of each Class B limited partnership interest, we first determined the value of the business based on the probability weighted expected return method. This approach considers the value of the business, calculated using a discounted cash flow analysis and a market approach using earnings multiples of comparable entities, under various scenarios. Significant inputs included historical revenues and expenses, future revenue and expense projections, discount rates and market prices of comparable entities. The value of the business as determined is then adjusted to take into account working capital, debt and noncurrent liabilities associated with Class B partner redemptions and allocated to individual limited partnership interests based on their respective terms. The use of the discounted cash flow and market approaches to derive the fair value of the liability at a point in time can result in volatility to the financial statements as our current and projected financial results, and the results and earnings multiples of comparable entities will change over time. The process for determining fair value is generally more subjective and involves a high degree of management judgment and assumptions. These assumptions may have a significant effect on our estimates of fair value, and the use of different assumptions as well as changes in market conditions could have a material effect on our results of operations or financial condition.
-126-
Table of Contents
As part of the reorganization transactions, the Class B common units will become exchangeable for Class A common stock pursuant to the terms of the exchange agreement and modified to remove the cash redemption feature. As a result, the Class B common units are expected to be treated as equity awards and compensation cost will be measured based upon the fair value of the awards at the time of the modification. Subsequent to the completion of the reorganization, the costs associated with distributions to our Class B partners and changes in the value of Class B liability awards will no longer be recognized as compensation expense. However, in calculating adjusted operating margin, we will continue to exclude all expense associated with Class B common units that were granted prior to the offering, because the basis of accounting for those awards prior to the offering will not be indicative of the basis of accounting for post-offering equity awards.
Income Taxes
Artisan Partners Holdings is a limited partnership that is not subject to federal or state income taxes. Each of Artisan Partners Holdings’ partners reports that partner’s proportionate share of Artisan Partners Holdings’ taxable income or loss. State and local taxes reported on our consolidated statement of operations consist of local taxes assessed in various jurisdictions in which Artisan Partners Holdings and its subsidiaries operate.
In accordance with current accounting standards, we account for uncertain income tax positions by recognizing the impact of a tax position in our consolidated financial statements when Artisan Partners Holdings believes it is more likely than not that the tax position would not be sustained upon examination by the appropriate tax authorities based on the technical merits of the position.
Interest and penalties relating to tax liabilities are recognized on actual tax liabilities and exposure items. Interest is accrued according to the provisions of the relevant tax law and is reported as interest expense. Penalties are accrued when we expect to take the related position in our tax return and are reported as other income (loss) within the Non-operating income (loss) section of our consolidated statements of operations. As of June 30, 2012 and June 30, 2011, there were no liabilities recorded related to uncertain tax positions.
Interest Rate Swaps
In July 2006, Artisan Partners Holdings entered into five-year amortizing interest rate swap contracts with two counterparties that had a combined total notional amount of $400 million at inception and had a final maturity date of July 1, 2011. Based on the terms of the interest rate swap contracts and our term loan, these interest rate swap contracts were determined to be effective, and thus qualified as a cash flow hedge for accounting purposes. Any changes in the fair value of these interest rate swaps that related to the effective portion of the cash flow hedge were recorded in total comprehensive income (loss) rather than in our consolidated statements of operations. These interest rate swaps matured on July 1, 2011.
In November 2010, we entered into a forward starting interest rate swap with a notional value of $200 million, an effective date of July 1, 2011 and a final maturity date of July 1, 2013. In August 2012, Artisan Partners Holdings terminated the swap in connection with its repayment in full of the term loan. The counterparty under the interest rate swap paid Artisan Partners Holdings variable interest at three-month LIBOR, and Artisan Partners Holdings paid the counterparty a fixed interest rate of 1.04%. Based on the terms of the interest rate swap contract and the term loan, the interest rate swap contract was determined to be effective, and thus qualified as a cash flow hedge for accounting purposes until December 2011. Any changes in the fair value of this interest rate swap that related to the effective portion of the cash flow hedge were recorded in total comprehensive income (loss) and changes in fair value that related to the ineffective portion of the cash flow hedge were recorded as a component of other income (loss). In December 2011, Artisan discontinued hedge accounting on this swap as the hedged forecasted transaction was no longer probable of occurring and Artisan recognized a loss of $1.9 million upon discontinuance of the hedge accounting relationship. Artisan continued to hold the swap until the third quarter of 2012 as it provided an economic hedge of the benchmark interest rate.
-127-
Table of Contents
New or Revised Accounting Standards
We qualify as an “emerging growth company” pursuant to the provisions of the JOBS Act, enacted on April 5, 2012. Section 102 of the JOBS Act provides that an “emerging growth company” can take advantage of the extended transition period provided in Section 7(a)(2)(B) of the Securities Act for complying with new or revised accounting standards. We have chosen to “opt out” of such extended transition period, and as a result, we will comply with new or revised accounting standards on the relevant dates on which adoption of such standards is required for non-emerging growth companies. Our decision to opt out of the extended transition period is irrevocable.
Qualitative and Quantitative Disclosures Regarding Market Risk
Market Risk
Our exposure to market risk is directly related to the role of our operating company as an investment adviser for the mutual funds and separate accounts it manages. Substantially all of our revenues are derived from investment management agreements with these funds and accounts. Under these agreements, the investment management fees we receive are based on the value of our assets under management and our fee rates. Accordingly, our revenues and net income may decline as a result of our assets under management decreasing due to depreciation of our investment portfolios. In addition, such a decline could cause our clients to withdraw their funds in favor of investments offering higher returns or lower risk, which would cause our revenues to decline further.
The value of our assets under management was $64.1 billion as of June 30, 2012. A 10% increase or decrease in the value of our assets under management, if proportionally distributed over all our investment strategies, products and client relationships, would cause an annualized increase or decrease in our revenues of approximately $48.7 million at our current weighted average fee rate of 76 basis points. Because of our declining rates of fee for larger relationships and differences in our rates of fee across investment strategies, a change in the composition of our assets under management, in particular an increase in the proportion of our total assets under management attributable to strategies, clients or relationships with lower effective rates of fees, could have a material negative impact on our overall weighted average rate of fee. The same 10% increase or decrease in the value of our total assets under management, if attributed entirely to a proportionate increase or decrease in the assets of each of the Artisan Funds, to which we provide a range of services in addition to those provided to separate accounts, would cause an annualized increase or decrease in our revenues of approximately $60.2 million at the Artisan Funds weighted average fee of 94 basis points. If the same 10% increase or decrease in the value of our total assets under management was attributable entirely to a proportionate increase or decrease in the assets of each separate account we manage, it would cause an annualized increase or decrease in our revenues of approximately $35.9 million at the current weighted average fee rate across all of our separate accounts (56 basis points), $28.8 million at the current weighted average fee rate across all of our separate account relationships with more than $500 million assets under management (45 basis points) or $42.9 million at the current weighted average fee rate across all of our separate account relationships with less than $500 million assets under management (67 basis points).
We have not adopted a corporate-level risk management policy regarding client assets, nor have we attempted to hedge at the corporate level the market risks that would affect the value of our overall assets under management and related revenues. Some of these risks (e.g., sector risks and currency risks) are inherent in certain strategies, and clients may invest in particular strategies to gain exposure to these risks.
We also are subject to market risk from a decline in the prices of marketable securities that we own. These securities consist primarily of investment securities in the amount of $17.3 million to fund an incentive compensation plan. These securities also consist of investments in series of Artisan Funds in an amount sufficient to cover the fund’s organizational expenses, for administrative convenience in securing initial shareholder approval of certain matters, or to ensure that a fund had sufficient assets at the commencement of its operations to build a viable investment portfolio. The total value of marketable securities was $18.5 million as of June 30,
-128-
Table of Contents
2012. Additionally, investment securities of consolidated investment products related to the private investment partnership, the investors in which are certain partners and employees of Artisan, are reflected in the Consolidated Statement of Financial Condition. Artisan’s risk with respect to investments in consolidated investment products is limited to its equity ownership of $1,000. Management regularly monitors the value of these investments; however, given their nature and relative size, we have not adopted a specific risk management policy to manage the associated market risk. Assuming a 10% increase or decrease in the values of these marketable securities, the fair value would increase or decrease by $1.9 million at June 30, 2012.
Due to the nature of our business, we believe that we do not face any material risk from inflation.
Exchange Rate Risk
A substantial portion of the accounts that we advise, or sub-advise, hold investments that are denominated in currencies other than the U.S. dollar. Movements in the rate of exchange between the U.S. dollar and the underlying foreign currency affect the values of assets held in accounts we manage, thereby affecting the amount of revenues we earn. The value of the assets we manage was $64.1 billion as of June 30, 2012. As of June 30, 2012, approximately 56% of our assets under management across our investment strategies was invested in strategies that primarily invest in securities of non-U.S. companies and approximately 38% of our assets under management was invested in securities denominated in currencies other than the U.S. dollar. To the extent our assets under management are denominated in currencies other than the U.S. dollar, the value of those assets under management would decrease with an increase in the value of the U.S. dollar, or increase with a decrease in the value of the U.S. dollar. Each investment team monitors its own exposure to exchange rate risk and makes decisions on how to manage such risk in the portfolios managed by that team. Because we believe that many of our clients invest in those strategies in order to gain exposure to non-U.S. currencies, or may implement their own hedging programs, we rarely hedge an investment portfolio’s exposure to a non-U.S. currency. However, we routinely purchase and sell foreign currencies in order to reduce or eliminate the impact of currency fluctuation in connection with particular client transactions, such as the purchase and sale of a portfolio security. We have not adopted a corporate-level risk management policy to manage exchange rate risk. Assuming that 38% of our assets under management is invested in securities denominated in currencies other than the U.S. dollar and excluding the impact of any hedging arrangements, a 10% increase or decrease in the value of the U.S. dollar would decrease or increase the fair value of our assets under management by $2.4 billion, which would cause an annualized increase or decrease in revenues of approximately $18.5 million at our current weighted average fee rate of 76 basis points.
Interest Rate Risk
At certain times, we invest our excess cash balances in money market mutual funds that invest primarily in U.S. Treasury or agency-backed money market instruments. These funds attempt to maintain a stable net asset value but interest rate changes may affect the fair value of such investments and, if significant, could result in a loss of investment principal. Interest rate changes affect the income we earn from our excess cash balances. As of June 30, 2012, virtually all of our cash balances were held in non-interest bearing deposit accounts that are fully insured by the FDIC.
Borrowings under our notes and revolving credit agreement bear interest as described under “Management’s Discussion and Analysis of Financial Condition and Results of Operations—Liquidity and Capital Resources”. Interest rate changes may affect the amount of our interest payments in connection with our revolving credit agreement, and thereby affect future earnings and cash flows. Assuming the aggregate principal amount of outstanding loans under our revolving credit agreement is $100.0 million and assuming interest rates and spreads in effect at August 16, 2012, we estimate that net interest expense related to the revolving credit agreement would increase by $1.0 million on an annual basis in the event interest rates were to increase by one percentage point.
-129-
Table of Contents
Overview
Founded in 1994, we are an independent investment management firm that provides a broad range of U.S., non-U.S. and global equity investment strategies and managed a total of $64.1 billion in assets as of June 30, 2012. We have established a record of investment excellence with attractive and consistent investment performance across multiple strategies and products. Through June 30, 2012, 11 of our 12 investment strategies (comprising 96% of our assets under management) had outperformed their respective benchmarks, on a gross and net basis, since inception, with inception dates ranging from April 1, 1995 for our U.S. Small-Cap Growth strategy to April 1, 2010 for our Global Equity strategy.
Since our founding, we have pursued a business model that is designed to maximize our ability to produce attractive investment results for our clients, and we believe this model has contributed to our success in doing so. We focus on attracting, retaining and developing talented investment professionals by creating an environment in which each investment team is provided ample resources and support, transparent, direct and predictable financial incentives, and a high degree of investment autonomy without imposing a centralized research function. We currently offer 12 actively-managed equity investment strategies, managed by five distinct investment teams. Each team is led by one or more experienced portfolio managers with a track record of investing success and is devoted to identifying long-term investment opportunities. We believe this autonomous structure promotes independent analysis and accountability among our investment professionals, which we believe promotes superior investment results.
Our 12 equity investment strategies span different market capitalization segments and investing styles in both U.S. and non-U.S. markets. Each strategy is designed to have a clearly articulated, consistent and replicable investment process that is well-understood by clients and managed to achieve superior long-term performance. Throughout our history, we have expanded our investment management capabilities in a disciplined manner that we believe is consistent with our overall philosophy of offering high value-added investment strategies in growing asset classes. Our business leaders work closely with each investment team to develop that team into an investment “franchise” with multiple investment decision-makers and the capacity to make a substantial contribution to our financial results. We have successfully expanded the range of strategies that we offer by launching new strategies managed by our existing investment teams as those teams have developed investment capacity, as well as by launching new strategies managed by new investment teams recruited to join Artisan.
In addition to our investment teams, we have a strong and seasoned management team that is focused on our business objectives of achieving profitable growth, expanding our investment capabilities, diversifying the source of our assets under management and delivering superior client service. Our management team supports our investment management capabilities and manages a centralized infrastructure, which allows our investment professionals to focus primarily on making investment decisions and generating attractive returns for our clients.
The combination of our superior investment performance and our strong business management has allowed us to attract and retain a diverse base of clients across a range of distribution channels and to increase our assets under management over time. Our assets under management have increased from $15.6 billion as of December 31, 2001 to $64.1 billion as of June 30, 2012, representing a compound annual growth rate, or CAGR, of 14.4%.
We offer our investment management capabilities primarily to institutions and through intermediaries that operate with institutional-like decision-making processes and have longer-term investment horizons, by means of separate accounts and mutual funds. As of June 30, 2012, we managed separate accounts representing $29.1 billion, or 45%, of our assets under management in 173 separate accounts spanning 124 client relationships, including pension and profit sharing plans, trusts, endowments, foundations, charitable organizations, government entities, private funds and non-U.S. pooled investment vehicles that are generally comparable to U.S.
-130-
Table of Contents
mutual funds, as well as mutual funds, non-U.S. funds and collective trusts we sub-advise. We serve as the investment adviser to Artisan Funds, an SEC-registered family of mutual funds that offers shares in multiple classes designed to meet the needs of a range of institutional and other investors, and as investment manager and promoter of Artisan Global Funds, a family of Ireland-based UCITS funds that began operations in the first quarter of 2011 and offers shares to non-U.S. investors. Artisan Funds and Artisan Global Funds comprised $34.9 billion, or 55%, of our assets under management as of June 30, 2012.
We access traditional institutional clients primarily through relationships with investment consultants and access institutional-like investors primarily through consultants, alliances with major defined contribution/401(k) platforms and relationships with fee-based financial advisors and broker-dealers.
We derive essentially all of our revenues from investment management fees, which primarily are based on a specified percentage of clients’ average assets under management. Our growth in assets under management has resulted in an increase in our revenues from $101.5 million for the year ended December 31, 2001 to $462.4 million for the 12 months ended June 30, 2012. We believe our talent-focused business model, attractive range of high value-added equity investment strategies, track record of investment excellence and thoughtful approach to distribution and client service position us well for future growth.
As of June 30, 2012, we had 270 employees, including 47 employee-partners. Immediately following the completion of this offering, our investment professionals, senior management and other employees will collectively own approximately % of the economic interests in our company. Our culture of employee ownership strongly aligns our management’s and clients’ interests in our delivery of strong investment performance and growth.
Our assets under management, or AUM, as of June 30, 2012 by investment team and distribution channel were as follows:
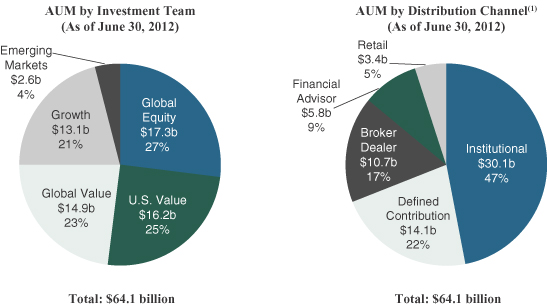
| (1) | The allocation of AUM by distribution channel involves the use of estimates and the exercise of judgment. See “Performance and Assets Under Management Information Used in this Prospectus” for more information. |
-131-
Table of Contents
Competitive Strengths
We believe that our success as an investment manager is based on the following competitive strengths:
Talent-Focused Business Model
We believe that the success of an investment management firm depends on the talent of its professionals. As a result, we have implemented a business model that is designed to attract, develop and retain talented investment professionals by allowing them to focus on portfolio management in an environment conducive to producing their best work on a consistent, long-term basis. We have a strong philosophical belief in the autonomy of each investment team. We provide each investment team with ample resources and support, without imposing a centralized research function. We believe this structure differentiates us from those of our competitors who function with an integrated structure in which there is less investment team autonomy. At the same time, we have experienced business leadership that manages a team of dedicated client service professionals and a centralized infrastructure, and we work to reduce the demands on our investment professionals from responsibilities not directly related to managing client portfolios.
Our business leaders work closely with each Artisan investment team to develop that team into an investment franchise with multiple investment decision-makers and natural, internal succession, a solid, repeatable investment process, a strong long-term performance track record, a diversified client base, dedicated resources, and the capacity to make a significant contribution to our financial results. As a team grows into an investment franchise, the team develops the capacity to manage multiple strategies, growth opportunities for members of the team are created, and portfolio managers are encouraged by the potential evolution of their responsibilities over time to extend their careers and their contributions to our success. Developing an investment team into an investment franchise involves identifying, evaluating and developing investment professionals who are the right fit for our strategy and business model. Our rigorous standards are evidenced by the select number of senior investment professionals we have added over the years. Over our nearly 18-year history, we have had no significant turnover among our portfolio managers. Minimizing such turnover is a significant part of the responsibilities of our senior business management team.
Attractive Range of Diverse, High Value-Added Equity Investment Strategies
We have five distinct investment teams that currently manage a diverse array of 12 equity investment strategies. These U.S., non-U.S. and global equity investment strategies are diversified by market capitalization and investment style and are focused on areas that we believe provide opportunities to generate returns in excess of the relevant benchmarks. Each of our investment teams has its own dedicated research personnel and works independently from our other investment teams. We believe this investment autonomy increases the degree to which the investment performance of each of our teams is generated by independent ideas that are distinct from the investments pursued by our other teams. As of June 30, 2012, our largest strategy accounted for approximately 26% of our total assets under management and none of our investment teams managed more than approximately 27% of our total assets under management.
Track Record of Investment Excellence
Through June 30, 2012, 11 of our 12 investment strategies had outperformed their benchmarks, on a gross and net basis, since inception, with inception dates ranging from April 1, 1995 for our U.S. Small-Cap Growth strategy to April 1, 2010 for our Global Equity strategy. Nine of the 11 series of Artisan Funds eligible for Morningstar ratings, representing 95% of the assets of Artisan Funds and managed in strategies representing 94% of our total assets under management, had an Overall Morningstar Rating™ of 4 or 5 stars as of June 30, 2012. Investment performance highlights of our three largest strategies include:
| • | Non-U.S. Growth is our largest strategy and accounted for approximately 26% of our assets under management as of June 30, 2012. It is managed by our Global Equity investment team. Our Non-U.S. Growth composite has outperformed its benchmark by an average of 697 basis points annually from inception in 1996 through June 30, 2012 (calculated on an average annual gross basis before payment of fees). Artisan International Fund, which is managed in our Non-U.S. Growth strategy, is ranked as |
-132-
Table of Contents
| of June 30, 2012 #49 of 118 funds over the trailing 10 years, and #1 of 44 funds from inception (December 1995) in Lipper’s international large-cap growth category. See “Performance and Assets Under Management Information Used in this Prospectus”. |
| • | U.S. Mid-Cap Growth accounted for approximately 18% of our assets under management as of June 30, 2012. It is managed by our Growth investment team. Our U.S. Mid-Cap Growth composite has outperformed its benchmark by an average of 667 basis points annually from inception in 1997 through June 30, 2012 (calculated on an average annual gross basis before payment of fees). Artisan Mid Cap Fund, which is managed in our U.S. Mid-Cap Growth strategy, is ranked as of June 30, 2012 #32 of 245 funds over the trailing 10 years, and #1 of 108 funds from inception (June 1997) in Lipper’s multi-cap growth category. See “Performance and Assets Under Management Information Used in this Prospectus”. |
| • | U.S. Mid-Cap Value accounted for approximately 17% of our assets under management as of June 30, 2012. It is managed by our U.S. Value investment team. Our U.S. Mid-Cap Value composite has outperformed its benchmark by an average of 629 basis points annually from inception in 1999 through June 30, 2012 (calculated on an average annual gross basis before payment of fees). Artisan Mid Cap Value Fund, which is managed in our U.S. Mid-Cap Value strategy, is ranked as of June 30, 2012 #7 of 107 funds over the trailing 10 years, and #7 of 87 funds from inception (March 2001) in Lipper’s mid-cap value category. See “Performance and Assets Under Management Information Used in this Prospectus”. |
We have been successful at generating attractive long-term investment performance on a consistent basis. Over the five-year period ended June 30, 2012, strategies representing approximately 96% of our total assets under management had outperformed their relevant benchmarks. A similar measure of trailing five-year investment performance relative to benchmarks taken at each of December 31, 2011, December 31, 2010 and December 31, 2009 indicates that strategies representing 95%, 99% and 99% of our total assets under management at each such date, respectively, were outperforming their relevant benchmarks.
Disciplined Growth—Balancing Investment Integrity, Investment Performance and Sustainable Demand
We manage our business with a long-term view. We launch a new strategy only when we believe it has the potential to achieve superior investment performance in an area that we believe will have sustained client demand at attractive fee rates over the long term. We strive to maintain the integrity of the investment process followed in each of our strategies by rigorous adherence to the investment parameters we have communicated to our clients. We also carefully monitor our investment capacity in each investment strategy. We believe that management of our investment capacity protects our ability to manage assets successfully, which protects the interests of our clients and, in the long term, protects our ability to retain client assets and maintain our fee schedules and profit margins. In order to better achieve our long-term goals, we are willing to close a strategy to new investors or otherwise take action to slow or restrict its growth when appropriate, even though our short-term results may be impacted. Currently, we have closed our Non-U.S. Small-Cap Growth, Non-U.S. Value, U.S. Mid-Cap Growth, U.S. Small-Cap Value and U.S. Mid-Cap Value strategies to most new investors and client relationships. Each of the strategies that we have offered to clients during our history continues in operation today.
Institutionally Oriented Client Base
We target discrete market segments that we believe offer attractive growth opportunities, which include institutions and intermediaries that operate with institutional-like decision-making processes and have longer-term investment horizons, and where we believe we have a well-recognized brand. Our original focus was on traditional institutional investors, including corporate and public pension plans, foundations and endowments. We believed those investors were often more focused on the integrity of the investment process and consistency of long-term investment performance than some other types of investors, which offered the potential for relationships of longer duration. As other market segments have evolved to have more institutional-like decision-making processes and longer-term investment horizons, we have expanded our distribution efforts into those areas, including defined contribution/401(k) administrators, broker-dealer fee-based programs and fee-based financial advisors. We have had significant success in
-133-
Table of Contents
attracting client assets from the defined contribution/401(k) market, and have experienced strong growth in assets through broker-dealers, where fee-based programs using centralized, institutional-like decision-making processes continue to grow.
As of June 30, 2012, we managed 173 separate accounts spanning 124 client relationships, including pension and profit sharing plans, trusts, endowments, foundations, charitable organizations, government entities, private funds and non-U.S. pooled investment vehicles that are generally comparable to U.S. mutual funds, as well as mutual funds, non-U.S. funds and collective trusts we sub-advise. Our largest client relationship, other than Artisan Funds, represented approximately 5% of our assets under management and no single consulting firm represented clients (including investors in Artisan Funds) having more than 6% of our assets under management. No single 401(k) platform, broker-dealer or financial advisor relationship represented more than 7%, 3% or 1%, respectively, of our assets under management.
Attractive Financial Model
We focus on high value-added strategies in asset classes that support fee rates that are above average for the asset management industry generally. We also have designed our expense structure to be flexible. The majority of our operating expenses, including incentive compensation and mutual fund intermediary fees, vary directly with our revenues and the amount of our assets under management. We believe that our model of relatively low fixed costs and relatively high variable costs is efficient and flexible, and historically has generated attractive adjusted operating margins and strong cash flow, even during challenging market conditions.
Ownership Culture That Aligns Interests
We believe that broad equity ownership of our business by our investment professionals and senior management is critical in aligning the interests of our clients, stockholders, investment professionals and management. Broad employee ownership helps us to attract talented investment professionals who have the ability to achieve attractive long-term investment performance. Attractive long-term investment performance benefits our clients and generally leads to growth in our assets under management. Growth in our assets under management enhances our financial results. Strong financial results drive the value of our equity, thereby helping us to attract and retain talented investment professionals. Immediately following the completion of this offering, our investment professionals, senior management and other employees will collectively own approximately % of the economic interests in our company. Following our transition to a public company, we intend to continue to promote broad and substantial equity ownership by our investment professionals and senior management through grants of equity interests and inclusion of equity interests as an element of compensation.
Strategy
Our strategy for continued success and future growth is guided by the following principles:
Execute Proven Business Model
The cornerstone of our strategy is to continue to promote our business model of attracting, developing and retaining talented investment professionals. We remain committed to investment team autonomy, to ensuring that our teams are able to focus on portfolio management and to fostering an environment that is attractive for our teams because they are able to do their best work on a consistent, long-term basis. We actively seek to identify new investment talent and teams both within and outside Artisan. Our business leaders will continue to work closely with each investment team to develop that team into an investment franchise with multiple decision-makers with natural, internal succession, a solid repeatable investment process, a strong long-term investment track record, a diversified client base, dedicated resources and the capacity to make a substantial contribution to our financial results. We are committed to the continuing development of our existing investment teams and we are open to the possibility of adding new investment teams, through hiring or acquisitions, when our rigorous standards have been met.
-134-
Table of Contents
Deliver Profitable and Sustainable Financial Results
As a public company, we will continue to focus on delivering profitable and sustainable financial results. We are committed to managing high value-added strategies capable of supporting above-average fee rates. We intend to maintain our flexible financial profile through our highly variable expense structure with centralized infrastructure and investment team support.
Capitalize on our “Realizable Capacity” in Products with Strong Client Demand
We believe that growth in assets under management in an investment strategy requires investment capacity in the strategy (which is driven by the availability of attractive investment opportunities relative to the amount of assets under management in the strategy) at a time when the strategy has a competitive performance track record and there is stable or growing client demand for the strategy or asset class. When we believe that each of these factors is present with respect to an investment strategy, we say we have “realizable capacity” in that strategy. We believe that we currently have realizable capacity particularly in our non-U.S. and global strategies, where we believe we are well-positioned to take advantage of increasing client demand. We have leveraged our strength in these areas by launching new products from our Global Value team, which launched our Global Value strategy in July 2007, from our Growth Team, which launched our Global Opportunities strategy in February 2007, from our Emerging Markets team, which launched our Emerging Markets strategy in 2006, and from our Global Equity team, which launched our Global Equity strategy in March 2010. We also believe that we have realizable capacity in our Value Equity strategy, which is designed to appeal to client demand for strategies with greater investment flexibility. We intend to focus on attracting additional assets under management in these strategies from our current client base and through our existing intermediary relationships, as well as from the continued expansion of our distribution efforts.
Expand Distribution and Focus on Investment Strategies Generating Sustainable Demand
We will remain focused on institutional and institutional-like clients and intermediaries and will continue to offer high value-added investment strategies with market demand that we believe is sustainable, avoiding fad and niche products with limited long-term growth prospects. We expect to see growing interest among institutional investors in strategies focused on non-U.S. and global investments. We seek to further penetrate the defined contribution/401(k) market and the broker-dealer and the fee-based financial advisor markets with our style-oriented investment strategies, including our Value Equity strategy, which has an attractive performance track record and significant investment capacity. We are also expanding our distribution effort into non-U.S. markets, including the United Kingdom, other member countries of the European Union, Australia and certain Asian countries, among others, where we believe there is growing institutional demand for global and non-U.S. investment strategies, such as our Global Value, Global Equity and Global Opportunities strategies. As part of those efforts, we organized Artisan Global Funds, a family of Ireland-based UCITS funds that began operations during the first quarter of 2011 and offers shares to non-U.S. investors. We have seen strong results from these non-U.S. distribution efforts, as a significant part of our net client cash flows over the last three years through June 30, 2012 has come from clients domiciled outside the United States.
To support the consistent communication of our brand through our global distribution efforts and public relations activities, we are engaged in firm branding efforts that includes the expansion and customization of our websites, increasing our use of digital media including video, targeted client events and conferences, and tactical marketing campaigns. Recent campaigns have focused on our investment culture, the experience of our investment teams, third-party awards received by the firm and our portfolio managers, and our global investment capabilities. Our branding efforts are improved by our marketing intelligence program, through which we analyze the effectiveness and reach of our branding efforts through various marketing channels. The program is designed to help us allocate marketing resources efficiently by identifying and prioritizing marketing efforts that successfully reach our target audience most efficiently.
Continue to Develop Artisan Leadership
We will continue to develop additional leaders for the company and for each investment team. We will also continue to work with each of our investment teams to develop its talent so that each team’s investment
-135-
Table of Contents
capabilities are expanded and natural internal succession continues to be developed. We believe that our culture of equity ownership has been instrumental in supporting the development of seasoned investment and business leaders. We intend to continue to promote broad and substantial equity ownership of our company by our employees.
Continue Disciplined Approach to Growth
We intend to continue to manage our business with a long-term view. We will launch a new strategy only when we believe it has the potential to achieve superior investment performance in an area that we believe will have sustained client demand at attractive fee rates over the long term. We intend to continue to actively manage our investment capacity to protect our ability to manage client assets successfully, which protects the interests of our clients and our own long-term interests, and we will seek to continue to diversify our client base to enhance the stability of our assets under management.
Investment Strategies and Performance
Overview
We currently offer our clients 12 long-only, equity investment strategies spanning market capitalization segments and investing styles in both U.S. and non-U.S. markets. Each strategy is managed by one of our five investment teams: Global Equity (three investment strategies), U.S. Value (three investment strategies), Growth (three investment strategies), Global Value (two investment strategies) and Emerging Markets (one investment strategy). Each team operates autonomously to identify investment opportunities in order to generate strong, long-term investment performance.
The table below sets forth our total assets under management for each of our investment teams and strategies as of June 30, 2012, the inception date for each investment composite, the value-added by each strategy since inception date as of June 30, 2012, and the Overall Morningstar Rating™ for the series of Artisan Funds managed in that strategy.
| Investment Team and Strategy |
AUM as of |
Composite |
Value-Added |
Fund Rating(2) | ||||||||||
| (dollars in millions) | ||||||||||||||
| Global Equity Team |
||||||||||||||
| Non-U.S. Growth Strategy |
$ | 16,376 | January 1, 1996 | 697 | «««« | |||||||||
| Non-U.S. Small-Cap Growth Strategy |
864 | January 1, 2002 | 547 | «««« | ||||||||||
| Global Equity Strategy |
24 | April 1, 2010 | 545 | Not yet rated | ||||||||||
| U.S.Value Team |
||||||||||||||
| U.S. Small-Cap Value Strategy |
4,219 | June 1, 1997 | 599 | «««« | ||||||||||
| U.S. Mid-Cap Value Strategy |
10,714 | April 1, 1999 | 629 | «««« « | ||||||||||
| Value Equity Strategy |
1,223 | July 1, 2005 | 130 | ««« | ||||||||||
| Growth Team |
||||||||||||||
| U.S. Mid-Cap Growth Strategy |
11,288 | April 1, 1997 | 667 | «««« | ||||||||||
| Global Opportunities Strategy |
826 | February 1, 2007 | 709 | «««« « | ||||||||||
| U.S.Small-Cap Growth Strategy |
1,026 | April 1, 1995 | 107 | «««« | ||||||||||
| Global Value Team |
||||||||||||||
| Non-U.S. Value Strategy |
9,281 | July 1, 2002 | 727 | «««« « | ||||||||||
| Global Value Strategy |
5,620 | July 1, 2007 | 624 | «««« « | ||||||||||
| Emerging Markets Team |
||||||||||||||
| Emerging Markets Strategy |
2,589 | July 1, 2006 | (95 | ) | «« | |||||||||
| Total AUM as of June 30, 2012 |
$ | 64,072 | (3) | |||||||||||
-136-
Table of Contents
| (1) | Value-added since inception date is the amount in basis points by which the average annual gross composite return of each of our strategies has outperformed the market index most commonly used by our clients to compare the performance of the relevant strategy since its inception date. The market indices used to compute the value added since inception date for each of our strategies are as follows: Non-U.S. Growth strategy—MSCI EAFE® Index; Non-U.S. Small-Cap Growth strategy—MSCI EAFE® Small Cap Index; Global Equity strategy—MSCI ACWI® Index; U.S. Small-Cap Value strategy—Russell 2000® Index; U.S. Mid-Cap Value strategy—Russell Midcap® Index; Value Equity strategy—Russell 1000® Index; U.S. Mid-Cap Growth strategy—Russell Midcap® Index; Global Opportunities strategy—MSCI ACWI® Index; U.S. Small-Cap Growth strategy—Russell 2000® Index; Non-U.S. Value strategy—MSCI EAFE® Index; Global Value strategy—MSCI ACWI® Index; Emerging Markets strategy—MSCI Emerging Markets IndexSM. |
| (2) | The Morningstar RatingTM compares the risk-adjusted performance of the Artisan Funds series to other funds in a category assigned by Morningstar based on its analysis of the funds’ portfolio holdings. The top 10% of funds receive 5 stars, the next 22.5% receive 4 stars, the next 35% receive 3 stars, the next 22.5% receive 2 stars and the bottom 10% receive 1 star. The Overall Morningstar RatingTM is derived from a weighted average of the performance figures associated with the rated fund’s three-, five- and 10-year Morningstar Rating metrics. The Artisan Funds, the ratings of which are reflected in the table above, and the categories in which they are rated are: Artisan International Fund—Foreign Large Blend Funds Category; Artisan International Small Cap Fund—Foreign Small/Mid Growth Funds Category; Artisan Global Equity Fund—not yet rated; Artisan Small Cap Value Fund—Small Value Funds Category; Artisan Mid Cap Value Fund—Mid Cap Value Funds Category; Artisan Value Equity Fund—Large Value Funds Category; Artisan Mid Cap Fund—Mid Cap Growth Funds Category; Artisan Global Opportunities Fund—World Stock; Artisan Small Cap Fund—Small Growth Funds Category; Artisan International Value Fund—Foreign Small/Mid Funds Category; Artisan Global Value Fund—World Stock; Artisan Emerging Markets Fund—Diversified Emerging Markets Funds Category. Morningstar ratings are initially given on a fund’s three-year track record and change monthly. |
| (3) | Includes an additional $22 million in assets managed in a portfolio not currently made available to investors other than our employee-partners to evaluate its potential viability as a strategy to be offered to clients. |
We think our clients evaluate our performance over a full market cycle in order to reduce the influence of unusual market conditions that may skew results during any given period. The goal of each of our investment strategies is to achieve superior long-term investment performance. The chart below shows the consistency with which we have achieved that goal by showing the percentage of our assets under management managed in strategies that outperformed their benchmarks over the periods indicated.
-137-
Table of Contents
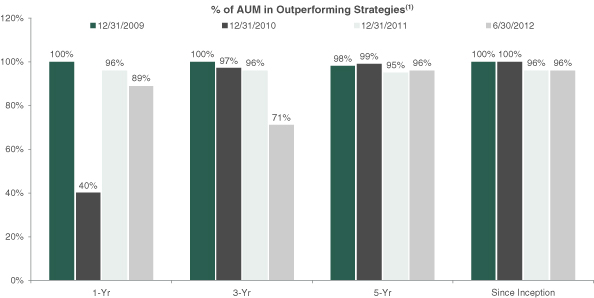
| (1) | Represents the percentage of our assets under management as of December 31, 2009, 2010 and 2011 and June 30, 2012 managed in strategies for which the average annual gross composite return of such strategies exceeded their respective benchmarks for the average annual periods ended on the indicated dates. Includes assets under management in all strategies in operation throughout the period. |
Each of our five investment teams has its own investment philosophy and research process, and makes its investment decisions independently of the investment decisions made by other teams. As a result, the region/country allocations, sector/industry exposures and portfolio characteristics (such as market capitalization and ratio of price to earnings) that stem from each team’s fundamental research and portfolio construction process vary. Those portfolio holdings, exposures and characteristics react differently to short-term market preferences and generate different performance patterns over the long-term.
Each of our investment teams and strategies is described in greater detail below.
Global Equity Team
Our Global Equity team, which was formed in 1996 and is based in San Francisco, California, currently manages three investment strategies: Non-U.S. Growth, Non-U.S. Small-Cap Growth and Global Equity. Mark Yockey is the portfolio manager for our Non-U.S. Growth and Non U.S. Small-Cap Growth strategies and Mr. Yockey and Barry Dargan (who is based in our U.K. office) are the portfolio co-managers of the Global Equity strategy. Mr. Yockey was Morningstar’s 1998 International-Stock Manager of the Year. Charles-Henri Hamker and Andrew Euretig became associate portfolio managers of the Non-U.S. Growth strategy in February 2012. Mr. Hamker also became portfolio manager of the Non-U.S. Small-Cap Growth strategy in February 2012. The Global Equity strategy began operations on March 29, 2010. The Global Equity team consists of Messrs. Yockey, Dargan, Hamker and Euretig, eight investment analysts with an average of 16 years of investment experience, nine research associates and a chief operating officer who manages administrative matters for the team, including the team’s research assistants and administrative staff. The team is supported by our nine-person non-U.S. trading desk. In addition, four marketing and client service professionals support institutional sales and client service for clients of the Global Equity team. As of June 30, 2012, the Global Equity team managed $17.3 billion of client assets.
-138-
Table of Contents
The Global Equity team’s strategies employ a fundamental stock selection process focused on identifying long-term growth opportunities. The investment team works to identify catalysts for commercial and economic change. Demographic and technological changes, increased privatization of economic resources and outsourcing are among the long-term catalysts for change that currently form the basis of the Global Equity team’s investment themes. The team incorporates these catalysts, along with sector and regional fundamentals, into a long-term global framework for investment analysis and decision-making. Finally, the team uses multiple valuation metrics to establish price targets and assesses the relationship between the team’s estimate of a company’s sustainable growth prospects and the company’s stock price.
The Non-U.S. Growth strategy invests primarily in stocks of non-U.S. companies, diversified by country, industry and issuer. The Non-U.S. Small-Cap Growth strategy invests in a diversified portfolio primarily in smaller non-U.S. companies. The Global Equity strategy invests in a diversified portfolio of U.S. and non-U.S. companies of all market capitalizations. For these and our other strategies, we generally consider a company to be from the country designated by MSCI Inc.
As of June 30, 2012, the Non-U.S. Growth strategy had $16.4 billion of assets under management, or 26% of our total assets under management, comprised of $9.0 billion in Artisan International Fund and $7.4 billion in separate accounts. As of the same date, the Non-U.S. Small-Cap Growth strategy had $863.9 million of assets under management, or 1% of our total assets under management, comprised of $620.9 million in Artisan International Small Cap Fund and $243.0 million in separate accounts. We have closed the Non-U.S. Small-Cap Growth strategy to most new investors and client relationships. As of the same date, the Global Equity strategy had $24.1 million of assets under management, or less than 1% of our total assets under management, comprised of $12.3 million in Artisan Global Equity Fund and $11.8 million in separate accounts.
The following table sets forth the changes in our assets under management in the Non-U.S. Growth, Non-U.S. Small-Cap Growth and Global Equity strategies for the six months ended June 30, 2012 and the years ended December 31, 2011 and 2010 (the changes in our assets under management in the Global Equity strategy for the year ended December 31, 2010 are since its inception on April 1, 2010):
| Six Months Ended June 30, 2012 |
Year Ended | |||||||||||
| December 31, 2011 | December 31, 2010 | |||||||||||
| (dollars in millions) | ||||||||||||
| Non-U.S. Growth Strategy |
||||||||||||
| Beginning assets under management |
$ | 15,385 | $ | 18,244 | $ | 18,509 | ||||||
| Gross client cash inflows |
1,461 | 2,316 | 2,819 | |||||||||
| Gross client cash outflows |
2,052 | 4,042 | 3,965 | |||||||||
| Net client cash flows |
(591 | ) | (1,726 | ) | (1,146 | ) | ||||||
| Market appreciation (depreciation) |
1,582 | (1,133 | ) | 881 | ||||||||
|
|
|
|
|
|
|
|||||||
| Ending assets under management |
$ | 16,376 | $ | 15,385 | $ | 18,244 | ||||||
| Non-U.S. Small-Cap Growth Strategy |
||||||||||||
| Beginning assets under management |
$ | 701 | $ | 942 | $ | 807 | ||||||
| Gross client cash inflows |
166 | 120 | 331 | |||||||||
| Gross client cash outflows |
80 | 237 | 303 | |||||||||
| Net client cash flows |
86 | (117 | ) | 28 | ||||||||
| Market appreciation (depreciation) |
77 | (124 | ) | 107 | ||||||||
|
|
|
|
|
|
|
|||||||
| Ending assets under management |
$ | 864 | $ | 701 | $ | 942 | ||||||
| Global Equity Strategy |
||||||||||||
| Beginning assets under management (as of April 1, 2010) |
$ | 21 | $ | 24 | $ | — | ||||||
| Gross client cash inflows |
1 | 3 | 21 | |||||||||
| Gross client cash outflows |
0 | 4 | 0 | |||||||||
| Net client cash flows |
1 | (1 | ) | 21 | ||||||||
| Market appreciation (depreciation) |
2 | (2 | ) | 3 | ||||||||
|
|
|
|
|
|
|
|||||||
| Ending assets under management |
$ | 24 | $ | 21 | $ | 24 | ||||||
-139-
Table of Contents
The following table sets forth the average annual returns, gross and net (which represent average annual returns prior to and after payment of the highest fee applicable to portfolios in the composite, respectively), as of June 30, 2012, for our Non-U.S. Growth, Non-U.S. Small-Cap Growth and Global Equity composites, along with the average annual returns of the market indices that are most commonly used by our clients to compare the performance of the strategies:
| As of June 30, 2012 | ||||||||||||||||||||
| Investment Strategy (Inception Date) |
1 Year | 3 Years | 5 Years | 10 Years | Inception | |||||||||||||||
| Non-U.S. Growth (January 1, 1996) |
||||||||||||||||||||
| Average Annual Gross Returns |
(2.77 | )% | 12.11 | % | (1.55 | )% | 6.98 | % | 10.59 | % | ||||||||||
| Average Annual Net Returns |
(3.67 | ) | 11.09 | (2.45 | ) | 6.00 | 9.57 | |||||||||||||
| MSCI EAFE® Index |
(13.83 | ) | 5.96 | (6.09 | ) | 5.14 | 3.63 | |||||||||||||
| MSCI EAFE® Growth Index |
(12.56 | ) | 7.61 | (4.60 | ) | 4.91 | 2.49 | |||||||||||||
| Non-U.S. Small-Cap Growth (January 1, 2002) |
||||||||||||||||||||
| Average Annual Gross Returns |
(8.44 | )% | 13.08 | % | (0.22 | )% | 14.71 | % | 14.53 | % | ||||||||||
| Average Annual Net Returns |
(9.59 | ) | 11.68 | (1.47 | ) | 13.29 | 13.12 | |||||||||||||
| MSCI EAFE® Small Cap Index |
(15.06 | ) | 9.16 | (5.31 | ) | 8.48 | 9.06 | |||||||||||||
| Global Equity (April 1, 2010) |
||||||||||||||||||||
| Average Annual Gross Returns |
1.42 | % | — | — | — | 8.48 | % | |||||||||||||
| Average Annual Net Returns |
0.41 | — | — | — | 7.40 | |||||||||||||||
| MSCI ACWI® Index |
(6.49 | ) | — | — | — | 3.03 | ||||||||||||||
The following table sets forth the gross and net returns (which represent returns prior to and after payment of the highest fee applicable to portfolios in the composite, respectively) for the six months ended June 30, 2012 and the years ended December 31, 2011, 2010, 2009, 2008 and 2007 for our Non-U.S. Growth, Non-U.S. Small-Cap Growth and Global Equity composites, along with the corresponding returns of the market indices that are most commonly used by our clients to compare the performance of the strategies:
| Six Months Ended June 30, 2012 |
Year Ended December 31, | |||||||||||||||||||||||
| 2011 | 2010 | 2009 | 2008 | 2007 | ||||||||||||||||||||
| Non-U.S. Growth Strategy |
||||||||||||||||||||||||
| Gross Returns |
10.63 | % | (6.19 | )% | 6.70 | % | 41.69 | % | (45.84 | )% | 20.90 | % | ||||||||||||
| Net Returns |
10.13 | (7.06 | ) | 5.73 | 40.44 | (46.36 | ) | 19.82 | ||||||||||||||||
| MSCI EAFE® Index |
2.96 | (12.14 | ) | 7.75 | 31.78 | (43.38 | ) | 11.17 | ||||||||||||||||
| MSCI EAFE® Growth Index |
3.86 | (12.11 | ) | 12.25 | 29.36 | (42.70 | ) | 16.45 | ||||||||||||||||
| Non-U.S. Small-Cap Growth Strategy |
||||||||||||||||||||||||
| Gross Returns |
12.34 | % | (13.99 | )% | 15.56 | % | 61.18 | % | (50.60 | )% | 26.88 | % | ||||||||||||
| Net Returns |
11.65 | (15.08 | ) | 14.14 | 59.25 | (51.26 | ) | 25.33 | ||||||||||||||||
| MSCI EAFE® Small Cap Index |
4.92 | (15.94 | ) | 22.04 | 46.78 | (47.01 | ) | 1.45 | ||||||||||||||||
| Global Equity (April 1, 2010) |
||||||||||||||||||||||||
| Gross Returns |
11.69 | % | (4.96 | )% | 13.16 | %(1) | — | — | — | |||||||||||||||
| Net Returns |
11.14 | (5.91 | ) | 12.31 | (1) | — | — | — | ||||||||||||||||
| MSCI ACWI® Index |
5.65 | (7.35 | ) | 9.25 | (1) | — | — | — | ||||||||||||||||
| (1) | From inception (April 1, 2010) to December 31, 2010. |
The composite returns shown in the tables above include the returns generated by all of the accounts invested in our Non-U.S. Growth, Non-U.S. Small-Cap Growth and Global Equity strategies, as applicable, for the periods indicated, except that with respect to the Non-U.S. Growth strategy, we exclude the returns of accounts imposing socially-based investment restrictions, which are included in a separate composite.
-140-
Table of Contents
U.S. Value Team
Our U.S. Value team, which was formed in 1997 and is based in Atlanta, Georgia, manages three investment strategies: U.S. Small-Cap Value, U.S. Mid-Cap Value and Value Equity (named Opportunistic Value until December 2010). Scott C. Satterwhite, James C. Kieffer, and George O. Sertl, Jr. are the portfolio co-managers for each of these strategies. Morningstar named Messrs. Satterwhite, Kieffer and Sertl its Domestic-Stock Fund Manager of the Year for 2011. Daniel Kane became associate portfolio manager of all three strategies in February 2012. The portfolio co-managers and associate portfolio manager have a combined average 22 years of investment experience. The U.S. Value team consists of Messrs. Satterwhite, Kieffer, Sertl, Jr. and Kane, and two research associates. The team is supported by our five-person domestic trading desk, including two traders primarily focused on executing the team’s trades. Four marketing and client service professionals support institutional sales and client service for clients of the U.S. Value team. As of June 30, 2012, the U.S. Value team managed $16.2 billion of client assets.
The U.S. Value team’s strategies employ a fundamental investment process used to construct diversified portfolios of companies that the investment team believes are undervalued, are in solid financial condition and have attractive business economics. The U.S. Value team believes companies with these characteristics are less likely to experience eroding values over the long term compared to companies without such characteristics.
The U.S. Value team focuses on investment opportunities in companies that are in turnaround situations or otherwise in transition, that have undervalued assets, lack an investor following, or that have suffered earnings shortfalls. Once an investment candidate has been identified, the research process includes an in-depth analysis of the company’s financial statements, an examination of the company’s competitive position within its industry, a thorough analysis and review of the company’s resources, and a review of its business economics and cash flows. The team sets buy and sell targets for a company’s securities based on the team’s assessment of the company’s intrinsic value, which is determined using multiple valuation tools.
While the U.S. Small-Cap Value strategy and U.S. Mid-Cap Value strategy invest in small-cap U.S. companies and mid-cap U.S. companies, respectively, the Value Equity strategy invests in the equity securities of companies across a broad capitalization range and has the flexibility to invest a portion of its assets in non-U.S. securities which may include investments in both developed and in emerging and less developed markets.
As of June 30, 2012, the U.S. Small-Cap Value strategy had $4.2 billion of assets under management, or 7% of our total assets under management, comprised of $2.8 billion in Artisan Small Cap Value Fund and $1.4 billion in separate accounts. As of the same date, the U.S. Mid-Cap Value strategy had $10.7 billion of assets under management, or 17% of our total assets under management, comprised of $7.8 billion in Artisan Mid Cap Value Fund and $2.9 billion in separate accounts. Currently, we have closed both the U.S. Small-Cap Value and the U.S. Mid-Cap Value strategies to most new investors and client relationships. As of June 30, 2012, the Value Equity strategy had $1.2 billion of assets under management, or 2% of our total assets under management, comprised of $745.1 million in Artisan Value Fund, $9.4 million in Artisan Global Funds – Artisan Value Fund and $468.9 million in separate accounts.
-141-
Table of Contents
The following table sets forth the changes in assets under management in the U.S. Small-Cap Value, U.S. Mid-Cap Value and Value Equity strategies for the six months ended June 30, 2012 and the years ended December 31, 2011 and 2010:
| Six Months Ended June 30, 2012 |
Year Ended | |||||||||||
| December 31, 2011 | December 31, 2010 | |||||||||||
| (dollars in millions) | ||||||||||||
| U.S. Small-Cap Value Strategy |
||||||||||||
| Beginning assets under management |
$ | 4,256 | $ | 4,633 | $ | 3,914 | ||||||
| Gross client cash inflows |
283 | 698 | 918 | |||||||||
| Gross client cash outflows |
429 | 934 | 916 | |||||||||
| Net client cash flows |
(146 | ) | (236 | ) | 2 | |||||||
| Transfers |
— | — | — | |||||||||
| Market appreciation (depreciation) |
109 | (141 | ) | 717 | ||||||||
|
|
|
|
|
|
|
|||||||
| Ending assets under management |
$ | 4,219 | $ | 4,256 | $ | 4,633 | ||||||
| U.S. Mid-Cap Value Strategy |
||||||||||||
| Beginning assets under management |
$ | 10,169 | $ | 9,465 | $ | 8,280 | ||||||
| Gross client cash inflows |
1,537 | 2,258 | 1,787 | |||||||||
| Gross client cash outflows |
1,105 | 2,170 | 1,803 | |||||||||
| Net client cash flows |
432 | 88 | (16 | ) | ||||||||
| Transfers |
(199 | ) | — | — | ||||||||
| Market appreciation (depreciation) |
312 | 616 | 1,201 | |||||||||
|
|
|
|
|
|
|
|||||||
| Ending assets under management |
$ | 10,714 | $ | 10,169 | $ | 9,465 | ||||||
| Value Equity Strategy |
||||||||||||
| Beginning assets under management |
$ | 634 | $ | 381 | $ | 246 | ||||||
| Gross client cash inflows |
485 | 416 | 173 | |||||||||
| Gross client cash outflows |
140 | 186 | 72 | |||||||||
| Net client cash flows |
345 | 230 | 101 | |||||||||
| Transfers |
199 | — | — | |||||||||
| Market appreciation (depreciation) |
45 | 23 | 34 | |||||||||
|
|
|
|
|
|
|
|||||||
| Ending assets under management |
$ | 1,223 | $ | 634 | $ | 381 | ||||||
The following table sets forth the average annual returns, gross and net (which represent average annual returns prior to and after payment of the highest fee applicable to portfolios in the composite, respectively), as of June 30, 2012, for our U.S. Small-Cap Value, U.S. Mid-Cap Value and Value Equity composites, along with the average annual returns of the market indices that are most commonly used by our clients to compare the performance of the strategies:
| As of June 30, 2012 | ||||||||||||||||||||
| Investment Strategy (Inception Date) |
1 Year | 3 Years | 5 Years | 10 Years | Inception | |||||||||||||||
| U.S. Small-Cap Value (June 1, 1997) |
||||||||||||||||||||
| Average Annual Gross Returns |
(6.19 | )% | 16.17 | % | 2.74 | % | 10.35 | % | 12.39 | % | ||||||||||
| Average Annual Net Returns |
(7.13 | ) | 15.07 | 1.76 | 9.31 | 11.33 | ||||||||||||||
| Russell 2000® Index |
(2.08 | ) | 17.78 | 0.54 | 7.00 | 6.40 | ||||||||||||||
| Russell 2000® Value Index |
(1.44 | ) | 17.41 | (1.05 | ) | 6.49 | 7.86 | |||||||||||||
| U.S. Mid-Cap Value (April 1, 1999) |
||||||||||||||||||||
| Average Annual Gross Returns |
0.60 | % | 17.67 | % | 3.97 | % | 12.15 | % | 13.68 | % | ||||||||||
| Average Annual Net Returns |
(0.34 | ) | 16.59 | 3.01 | 11.10 | 12.60 | ||||||||||||||
| Russell Midcap® Index |
(1.65 | ) | 19.42 | 1.05 | 8.44 | 7.40 | ||||||||||||||
| Russell Midcap® Value Index |
(0.37 | ) | 19.90 | (0.13 | ) | 8.17 | 8.18 | |||||||||||||
| Value Equity (July 1, 2005) |
||||||||||||||||||||
| Average Annual Gross Returns |
5.01 | % | 16.35 | % | 0.55 | % | — | 5.56 | % | |||||||||||
| Average Annual Net Returns |
4.26 | 15.43 | (0.30 | ) | — | 4.66 | ||||||||||||||
| Russell 1000® Index |
4.37 | 16.62 | 0.39 | — | 4.26 | |||||||||||||||
| Russell 1000® Value Index |
3.01 | 15.79 | (2.19 | ) | — | 2.91 | ||||||||||||||
-142-
Table of Contents
The following table sets forth the gross and net returns (which represent returns prior to and after payment of the highest fee applicable to portfolios in the composite, respectively) for the six months ended June 30, 2012 and the years ended December 31, 2011, 2010, 2009, 2008 and 2007 for our U.S. Small-Cap Value, U.S. Mid-Cap Value and Value Equity composites, along with the corresponding returns of the market indices that are most commonly used by our clients to compare the performance of the strategies:
| Six Months Ended June 30, 2012 |
Year Ended December 31, | |||||||||||||||||||||||
| 2011 | 2010 | 2009 | 2008 | 2007 | ||||||||||||||||||||
| U.S.Small-Cap Value Strategy |
||||||||||||||||||||||||
| Gross Returns |
3.08 | % | (1.88 | )% | 19.05 | % | 41.96 | % | (23.30 | )% | (4.70 | )% | ||||||||||||
| Net Returns |
2.57 | (2.82 | ) | 17.93 | 40.64 | (24.06 | ) | (5.58 | ) | |||||||||||||||
| Russell 2000® Index |
8.53 | (4.18 | ) | 26.85 | 27.17 | (33.79 | ) | (1.57 | ) | |||||||||||||||
| Russell 2000® Value Index |
8.23 | (5.50 | ) | 24.50 | 20.58 | (28.92 | ) | (9.78 | ) | |||||||||||||||
| U.S.Mid-Cap Value Strategy |
||||||||||||||||||||||||
| Gross Returns |
3.73 | % | 7.67 | % | 15.75 | % | 41.24 | % | (26.78 | )% | 2.85 | % | ||||||||||||
| Net Returns |
3.25 | 6.67 | 14.68 | 39.96 | (27.48 | ) | 1.91 | |||||||||||||||||
| Russell Midcap® Index |
7.97 | (1.55 | ) | 25.48 | 40.48 | (41.46 | ) | 5.60 | ||||||||||||||||
| Russell Midcap® Value Index |
7.78 | (1.38 | ) | 24.75 | 34.21 | (38.44 | ) | (1.42 | ) | |||||||||||||||
| Value Equity Strategy |
||||||||||||||||||||||||
| Gross Returns |
6.95 | % | 6.61 | % | 12.75 | % | 37.56 | % | (36.75 | )% | 3.54 | % | ||||||||||||
| Net Returns |
6.58 | 5.84 | 11.75 | 36.38 | (37.34 | ) | 2.61 | |||||||||||||||||
| Russell 1000® Index |
9.38 | 1.50 | 16.10 | 28.43 | (37.60 | ) | 5.77 | |||||||||||||||||
| Russell 1000® Value Index |
8.68 | 0.39 | 15.51 | 19.69 | (36.85 | ) | (0.17 | ) | ||||||||||||||||
The composite returns shown in the tables above include the returns generated by all of the accounts invested in our U.S. Small-Cap Value, U.S. Mid-Cap Value and Value Equity strategies, as applicable, for the periods indicated.
Growth Team
Our Growth team, which was formed in 1997 and is based in Milwaukee, Wisconsin, manages three investment strategies: U.S. Mid-Cap Growth, Global Opportunities and U.S. Small-Cap Growth. Andrew C. Stephens, James D. Hamel and Matthew A. Kamm are the portfolio co-managers for the U.S. Mid-Cap Growth strategy; Messrs. Stephens and Hamel are the portfolio managers for the Global Opportunities strategy; and Messrs. Stephens, Hamel and Craigh A. Cepukenas are the portfolio co-managers for the U.S. Small-Cap Growth strategy. Matthew A. Kamm became associate portfolio manager of our Global Opportunities and U.S. Small-Cap Growth strategies in January 2010. Jason L. White became associate portfolio manager of all three strategies in January 2011. Andrew C. Stephens and James D. Hamel were nominated for Morningstar’s Domestic-Stock Fund Manager of the Year for 2010. Their team consists of Messrs. Stephens, Hamel, Cepukenas, Kamm and White, five investment analysts with an average of 12 years of investment experience, and two research associates. The team is supported by our five-person domestic trading desk, including three traders primarily focused on executing the team’s trades. In addition, three senior marketing and client service professionals support institutional sales and client service for clients of the Growth team. As of June 30, 2012, the Growth team managed $13.1 billion of client assets.
The Growth team’s strategies employ a fundamental investment process used to construct diversified portfolios of growth companies. The investment team looks for opportunities across the entire economy in order to find sustainable growth regardless of the sector or industry.
The Growth team’s investment process begins by identifying companies that possess franchise characteristics such as strong competitive positions, have attractive valuations relative to similar companies and benefit from an accelerating profit cycle; companies that it believes are well positioned for long-term growth, driven by demand for their products and services, and at an early enough stage in their profit cycles to benefit from the increased cash flows produced by the profit cycle.
Based on the investment team’s fundamental analysis of a company’s profit cycle, the investment team classifies each portfolio holding in one of three stages. GardenSM investments are small positions in the early part
-143-
Table of Contents
of their profit cycle that may warrant a larger allocation once their profit cycle accelerates. CropSM investments are positions that are being increased to or maintained at a full weight because they are moving through the strongest part of their profit cycle. HarvestSM investments are positions that are being reduced as they near the investment team’s estimate of full valuation or their profit cycle begins to decelerate.
While the U.S. Mid-Cap Growth and U.S. Small-Cap Growth strategies invest in U.S. mid-cap and U.S. small-cap growth companies, respectively, the Global Opportunities strategy is a global strategy that invests across a broad capitalization range in U.S. and non-U.S. growth companies, including investments in both developed and in emerging and less developed markets.
As of June 30, 2012, the U.S. Mid-Cap Growth strategy had $11.3 billion of assets under management, or 18% of our total assets under management, comprised of $6.3 billion in Artisan Mid Cap Fund and $5.0 billion in separate accounts. We have closed the U.S. Mid-Cap Growth strategy to most new investors and client relationships.
As of June 30, 2012, the Global Opportunities strategy had $826.4 million of assets under management, or 1% of our total assets under management, comprised of $238.4 million in Artisan Global Opportunities Fund and $588.0 million in separate accounts. As of the same date, the U.S. Small-Cap Growth strategy had $1.0 billion of assets under management, or 2% of our total assets under management, comprised of $498.5 million in Artisan Small Cap Fund and $527.7 million in separate accounts.
Before October 1, 2009, our U.S. Small-Cap Growth strategy was managed by a separate team led by Mr. Cepukenas and Marina T. Carlson as the portfolio co-managers. The U.S. Small-Cap Growth team (except Ms. Carlson, who retired) was combined with the Growth team effective October 1, 2009, at which time Messrs. Stephens and Hamel joined Mr. Cepukenas as the portfolio co-managers of accounts managed in our U.S. Small-Cap Growth strategy.
The following table sets forth the changes in assets under management in the U.S. Mid-Cap Growth, Global Opportunities and U.S. Small-Cap Growth strategies for the six months ended June 30, 2012 and the years ended December 31, 2011 and 2010:
| Six Months Ended June 30, 2012 |
Year Ended | |||||||||||
| December 31, 2011 | December 31, 2010 | |||||||||||
| (dollars in millions) | ||||||||||||
| U.S. Mid-Cap Growth Strategy |
||||||||||||
| Beginning assets under management |
$ | 9,759 | $ | 10,773 | $ | 8,311 | ||||||
| Gross client cash inflows |
1,570 | 1,427 | 1,239 | |||||||||
| Gross client cash outflows |
1,167 | 2,288 | 1,381 | |||||||||
| Net client cash flows |
403 | (861 | ) | (142 | ) | |||||||
| Market appreciation (depreciation) |
1,126 | (153 | ) | 2,604 | ||||||||
|
|
|
|
|
|
|
|||||||
| Ending assets under management |
$ | 11,288 | $ | 9,759 | $ | 10,773 | ||||||
| Global Opportunities Strategy |
||||||||||||
| Beginning assets under management |
$ | 291 | $ | 103 | $ | 56 | ||||||
| Gross client cash inflows |
504 | 238 | 45 | |||||||||
| Gross client cash outflows |
13 | 30 | 16 | |||||||||
| Net client cash flows |
491 | 208 | 29 | |||||||||
| Market appreciation (depreciation) |
44 | (20 | ) | 18 | ||||||||
|
|
|
|
|
|
|
|||||||
| Ending assets under management |
$ | 826 | $ | 291 | $ | 103 | ||||||
| U.S. Small-Cap Growth Strategy |
||||||||||||
| Beginning assets under management |
$ | 828 | $ | 708 | $ | 1,016 | ||||||
| Gross client cash inflows |
364 | 345 | 115 | |||||||||
| Gross client cash outflows |
258 | 276 | 580 | |||||||||
| Net client cash flows |
106 | 69 | (465 | ) | ||||||||
| Market appreciation (depreciation) |
92 | 51 | 157 | |||||||||
|
|
|
|
|
|
|
|||||||
| Ending assets under management |
$ | 1,026 | $ | 828 | $ | 708 | ||||||
-144-
Table of Contents
The following table sets forth the average annual returns, gross and net (which represent average annual returns prior to and after payment of the highest fee applicable to portfolios in the composite, respectively), as of June 30, 2012, for our U.S. Mid-Cap Growth, Global Opportunities and U.S. Small-Cap Growth composites, along with the average annual returns of the market indices that are most commonly used by our clients to compare the performance of the strategies:
| As of June 30, 2012 | ||||||||||||||||||||
| Investment Strategy (Inception Date) |
1 Year | 3 Years | 5 Years | 10 Years | Inception | |||||||||||||||
| U.S. Mid-Cap Growth (April 1, 1997) |
||||||||||||||||||||
| Average Annual Gross Returns |
0.61 | % | 22.26 | % | 6.16 | % | 10.14 | % | 15.56 | % | ||||||||||
| Average Annual Net Returns |
(0.33 | ) | 21.14 | 5.19 | 9.13 | 14.49 | ||||||||||||||
| Russell Midcap® Index |
(1.65 | ) | 19.42 | 1.05 | 8.44 | 8.90 | ||||||||||||||
| Russell Midcap® Growth Index |
(2.99 | ) | 18.99 | 1.90 | 8.46 | 7.21 | ||||||||||||||
| Global Opportunities (February 1, 2007) |
||||||||||||||||||||
| Average Annual Gross Returns |
0.26 | % | 20.62 | % | 4.52 | % | — | 6.12 | % | |||||||||||
| Average Annual Net Returns |
(0.64 | ) | 19.56 | 3.67 | — | 5.28 | ||||||||||||||
| MSCI ACWI® Index |
(6.49 | ) | 10.79 | (2.69 | ) | — | (0.96 | ) | ||||||||||||
| Russell 1000 Index with Dividends |
4.37 | % | 16.62 | 0.39 | 1.29 | |||||||||||||||
| U.S. Small-Cap Growth (April 1, 1995) |
||||||||||||||||||||
| Average Annual Gross Returns |
4.03 | % | 23.58 | % | 3.49 | % | 8.61 | % | 9.20 | % | ||||||||||
| Average Annual Net Returns |
3.00 | 22.39 | 2.49 | 7.56 | 8.14 | |||||||||||||||
| Russell 2000® Index |
(2.08 | ) | 17.78 | 0.54 | 7.00 | 8.13 | ||||||||||||||
| Russell 2000® Growth Index® |
(2.71 | ) | 18.07 | 1.99 | 7.39 | 5.89 | ||||||||||||||
The following table sets forth the gross and net returns (which represent returns prior to and after payment of the highest fee applicable to portfolios in the composite, respectively) for the six months ended June 30, 2012 and the years ended December 31, 2011, 2010, 2009, 2008 and 2007 for our U.S. Mid-Cap Growth, Global Opportunities and U.S. Small-Cap Growth composites, along with the corresponding returns of the market indices that are most commonly used by our clients to compare the performance of the strategies:
| Six Months
Ended June 30, 2012 |
Year Ended December 31, | |||||||||||||||||||||||
| 2011 | 2010 | 2009 | 2008 | 2007 | ||||||||||||||||||||
| U.S. Mid-Cap Growth Strategy |
||||||||||||||||||||||||
| Gross Returns |
12.24 | % | (0.79 | )% | 33.17 | % | 51.86 | % | (43.40 | )% | 22.49 | % | ||||||||||||
| Net Returns |
11.72 | (1.72 | ) | 31.95 | 50.51 | (43.94 | ) | 21.36 | ||||||||||||||||
| Russell Midcap® Index |
7.97 | (1.55 | ) | 25.48 | 40.48 | (41.46 | ) | 5.60 | ||||||||||||||||
| Russell Midcap® Growth Index |
8.10 | (1.65 | ) | 26.38 | 46.29 | (44.32 | ) | 11.43 | ||||||||||||||||
| Global Opportunities Strategy |
||||||||||||||||||||||||
| Gross Returns |
15.59 | % | (5.27 | )% | 30.09 | % | 49.83 | % | (44.02 | )% | 15.48 | %(1) | ||||||||||||
| Net Returns |
15.09 | (6.12 | ) | 28.95 | 48.52 | (44.41 | ) | 14.88 | (1) | |||||||||||||||
| MSCI ACWI® Index |
5.65 | (7.35 | ) | 12.67 | 34.63 | (42.19 | ) | 10.56 | (1) | |||||||||||||||
| U.S. Small-Cap Growth Strategy |
||||||||||||||||||||||||
| Gross Returns |
12.38 | % | 8.22 | % | 22.01 | % | 46.20 | % | (42.83 | )% | 4.59 | % | ||||||||||||
| Net Returns |
11.38 | 7.15 | 20.84 | 44.83 | (43.40 | ) | 3.61 | |||||||||||||||||
| Russell 2000® Index |
8.53 | (4.18 | ) | 26.85 | 27.17 | (33.79 | ) | (1.57 | ) | |||||||||||||||
| Russell 2000® Growth Index |
8.81 | (2.91 | ) | 29.09 | 34.47 | (38.54 | ) | 7.05 | ||||||||||||||||
| (1) | From inception (February 1, 2007) to December 31, 2007. |
The composite returns shown in the tables above include the returns generated by all of the accounts invested in our U.S. Mid-Cap Growth, Global Opportunities and U.S. Small-Cap Growth strategies, as applicable, for the periods indicated, except that with respect to the U.S. Mid-Cap Growth strategy, we exclude the returns of accounts imposing socially-based investment restrictions, which are included in a separate composite.
-145-
Table of Contents
Global Value Team
Our Global Value team, which was formed in 2002 and is based in San Francisco, California, manages two investment strategies: Non-U.S. Value and Global Value. N. David Samra and Daniel J. O’Keefe are the portfolio co-managers of both strategies. Mr. Samra is the lead portfolio manager of the Non-U.S. Value strategy, and Mr. O’Keefe is the lead portfolio manager of the Global Value strategy. Messrs. Samra and O’Keefe were nominated for Morningstar’s 2011 International-Stock Manager of the Year. They previously won the award in 2008. The Global Value team consists of Mr. Samra and Mr. O’Keefe, and five investment analysts with an average of nine years of investment experience. The team is supported by our nine-person non-U.S. trading desk. In addition, two marketing and client service professional supports institutional sales and client service for clients of the Global Value team. As of June 30, 2012, the Global Value team managed $14.9 billion of client assets.
The Global Value team’s strategies employ a fundamental investment process to construct diversified portfolios of stocks of undervalued U.S. and non-U.S. companies of all sizes. The team’s investment process focuses on identifying high quality, undervalued businesses that offer the potential for superior risk/reward outcomes.
The investment team seeks to invest in companies with strong competitive positions in their industries and histories of generating strong free cash flow and improving returns on capital, at a price that is a significant discount from the team’s estimate of the intrinsic value of the business. The investment team believes these criteria help rule out businesses that may appear undervalued based on certain financial ratios but whose intrinsic values are deteriorating over time. The investment team also believes that investing in companies with strong balance sheets reduces the potential for investment losses and provides company management the ability to create stockholder value when attractive opportunities are available. The investment team’s research process also attempts to identify management teams with a history of building value for their stockholders.
As of June 30, 2012, the Non-U.S. Value strategy had $9.3 billion of assets under management, or 15% of our total assets under management, comprised of $5.7 billion in Artisan International Value Fund and $3.6 billion in separate accounts. We closed this strategy to most new separate account relationships in November 2010 and to most new mutual fund investors in March 2011. As of June 30, 2012, the Global Value strategy had $5.6 billion of assets under management, or 9% of our total assets under management, comprised of $176.9 million in Artisan Global Value Fund, $92.2 million in Artisan Global Funds – Artisan Global Value Fund and $5.4 billion in separate accounts.
The following table sets forth the changes in assets under management in the Non-U.S. Value and Global Value strategies for the six months ended June 30, 2012 and the years ended December 31, 2011 and 2010:
| Six Months
Ended June 30, 2012 |
Year Ended | |||||||||||
| December 31, 2011 |
December 31, 2010 |
|||||||||||
| (dollars in millions) | ||||||||||||
| Non-U.S. Value Strategy |
||||||||||||
| Beginning assets under management |
$ | 7,884 | $ | 7,013 | $ | 4,020 | ||||||
| Gross client cash inflows |
1,495 | 2,534 | 2,562 | |||||||||
| Gross client cash outflows |
404 | 993 | 610 | |||||||||
| Net client cash flows |
1,091 | 1,541 | 1,952 | |||||||||
| Transfers |
(134 | ) | (55 | ) | — | |||||||
| Market appreciation (depreciation) |
440 | (615 | ) | 1,041 | ||||||||
|
|
|
|
|
|
|
|||||||
| Ending assets under management |
$ | 9,281 | $ | 7,884 | $ | 7,013 | ||||||
| Global Value Strategy |
||||||||||||
| Beginning assets under management |
$ | 4,662 | $ | 2,620 | $ | 172 | ||||||
| Gross client cash inflows |
605 | 1,986 | 2,363 | |||||||||
| Gross client cash outflows |
70 | 56 | 30 | |||||||||
| Net client cash flows |
535 | 1,930 | 2,333 | |||||||||
| Transfers |
134 | 55 | — | |||||||||
| Market appreciation (depreciation) |
289 | 57 | 115 | |||||||||
|
|
|
|
|
|
|
|||||||
| Ending assets under management |
$ | 5,620 | $ | 4,662 | $ | 2,620 | ||||||
-146-
Table of Contents
The following table sets forth the average annual returns, gross and net (which represent average annual returns prior to and after payment of the highest fee applicable to portfolios in the composite, respectively), as of June 30, 2012, for our Non-U.S. Value and Global Value composites, along with the average annual returns of the market indices that are most commonly used by our clients to compare the performance of the strategies:
| As of June 30, 2012 | ||||||||||||||||
| Investment Strategy (Inception Date) |
1 Year | 3 Years | 5 Years | Inception | ||||||||||||
| Non-U.S. Value (July 1, 2002) |
||||||||||||||||
| Average Annual Gross Returns |
(5.89 | )% | 13.76 | % | 1.64 | % | 12.41 | % | ||||||||
| Average Annual Net Returns |
(6.77 | ) | 12.72 | 0.70 | 11.35 | |||||||||||
| MSCI EAFE® Index |
(13.83 | ) | 5.96 | (6.09 | ) | 5.14 | ||||||||||
| MSCI EAFE® Value Index |
(15.16 | ) | 4.23 | (7.65 | ) | 5.28 | ||||||||||
| Global Value Strategy (July 1, 2007) |
||||||||||||||||
| Average Annual Gross Returns |
3.98 | % | 17.39 | % | 3.54 | % | 3.54 | % | ||||||||
| Average Annual Net Returns |
2.96 | 16.24 | 2.54 | 2.54 | ||||||||||||
| MSCI ACWI® Index |
(6.49 | ) | 10.79 | (2.69 | ) | (2.69 | ) | |||||||||
The following table sets forth the gross and net returns (which represent returns prior to and after payment of the highest fee applicable to portfolios in the composite, respectively) for the six months ended June 30, 2012 and the years ended December 31, 2011, 2010, 2009, 2008 and 2007 for our Non-U.S. Value and Global Value composites, along with the corresponding returns of the market indices that are most commonly used by our clients to compare the performance of the strategies:
| Six Months
Ended June 30, 2012 |
Year Ended December 31, | |||||||||||||||||||||||
| 2011 | 2010 | 2009 | 2008 | 2007 | ||||||||||||||||||||
| Non-U.S. Value Strategy |
||||||||||||||||||||||||
| Gross Returns |
5.89 | % | (6.07 | )% | 20.18 | % | 35.29 | % | (29.06 | )% | 0.31 | % | ||||||||||||
| Net Returns |
5.40 | (6.95 | ) | 19.09 | 34.05 | (29.74 | ) | (0.62 | ) | |||||||||||||||
| MSCI EAFE® Index |
2.96 | (12.14 | ) | 7.75 | 31.78 | (43.38 | ) | 11.17 | ||||||||||||||||
| MSCI EAFE® Value Index |
1.98 | (12.17 | ) | 3.25 | 34.23 | (44.09 | ) | 5.96 | ||||||||||||||||
| Global Value Strategy |
||||||||||||||||||||||||
| Gross Returns |
6.98 | % | 3.22 | % | 17.34 | % | 35.14 | % | (28.53 | )% | (4.89 | )%(1) | ||||||||||||
| Net Returns |
6.46 | 2.19 | 16.20 | 33.84 | (29.26 | ) | (5.27 | )(1) | ||||||||||||||||
| MSCI ACWI® Index |
5.65 | (7.35 | ) | 12.67 | 34.63 | (42.19 | ) | 1.62 | (1) | |||||||||||||||
| (1) | From inception (July 1, 2007) to December 31, 2007. |
The composite returns shown in the tables above include the returns generated by all of the accounts invested in our Non-U.S. Value and Global Value strategies, as applicable, for the periods indicated, except that with respect to the Non-U.S. Value strategy, we exclude the returns of accounts imposing socially-based investment restrictions, which are included in a separate composite.
Emerging Markets Team
Our Emerging Markets team, which was formed in 2006 and is based in New York, New York, manages a single investment strategy. Maria Negrete-Gruson is the portfolio manager for the Emerging Markets strategy. Her team consists of four investment analysts with an average of over 17 years of investment experience. The team is supported by our nine-person non-U.S. trading desk. In addition, three marketing and client service professionals support institutional sales and client service for clients of the Emerging Markets team.
The Emerging Markets team believes that, over the long term, a company’s stock price is directly related to its ability to deliver sustainable earnings. Investment opportunities develop when businesses with sustainable
-147-
Table of Contents
earnings are undervalued relative to global peers and historical industry, country and regional valuations. Accordingly, the Emerging Markets strategy employs a fundamental research process focused on identifying companies that are priced at a discount relative to the investment team’s estimate of their sustainable earnings.
To estimate a company’s sustainable earnings, the investment team uses both financial and strategic analyses. The financial analysis focuses on a company’s balance sheet, income statement and statement of cash flows in order to identify historic drivers of return on equity. The business analysis examines a company’s competitive advantages and financial strength in order to assess sustainability. After conducting its strategic and financial analyses, the investment team incorporates company-specific and macroeconomic risks into its valuation analysis to develop a risk-adjusted target price. The risk assessment includes a review of currency, interest rate, monetary and fiscal policy and political risks to which a company is exposed. Using these methods, the investment team values a business and develops a price target which it uses to determine whether to make an investment.
As of June 30, 2012, the Emerging Markets strategy had $2.6 billion of client assets, or 4% of our total assets under management, comprised of $775.0 million in Artisan Emerging Markets Fund, $197.3 million in Artisan Global Funds — Artisan Emerging Markets Fund and $1.6 billion in separate accounts.
The following table sets forth the changes in assets under management in the Emerging Markets strategy for the six months ended June 30, 2012 and the years ended December 31, 2011 and 2010:
| Six Months
Ended June 30, 2012 |
Year Ended | |||||||||||
| December 31, 2011 | December 31, 2010 | |||||||||||
| Emerging Markets Strategy |
||||||||||||
| Beginning assets under management |
$ | 2,499 | $ | 2,554 | $ | 1,458 | ||||||
| Gross client cash inflows |
274 | 1,654 | 875 | |||||||||
| Gross client cash outflows |
274 | 834 | 161 | |||||||||
| Net client cash flows |
0 | 820 | 714 | |||||||||
| Transfers |
— | — | — | |||||||||
| Market appreciation (depreciation) |
90 | (875 | ) | 382 | ||||||||
|
|
|
|
|
|
|
|||||||
| Ending assets under management |
$ | 2,589 | $ | 2,499 | $ | 2,554 | ||||||
The following table sets forth the average annual returns, gross and net (which represent average annual returns prior to and after payment of the highest fee applicable to portfolios in the composite, respectively), as of June 30, 2012, for our Emerging Markets composite, along with the average annual returns of the market index that is most commonly used by our clients to compare the performance of the strategy:
| As of June 30, 2012 | ||||||||||||||||
| Investment Strategy (Inception Date) |
1 Year | 3 Years | 5 Years | Inception | ||||||||||||
| Emerging Markets (July 1, 2006) |
||||||||||||||||
| Average Annual Gross Returns |
(20.12 | )% | 7.05 | % | (2.07 | )% | 5.35 | % | ||||||||
| Average Annual Net Returns |
(20.97 | ) | 5.93 | (3.10 | ) | 4.25 | ||||||||||
| MSCI Emerging Markets IndexSM |
(15.95 | ) | 9.76 | (0.09 | ) | 6.30 | ||||||||||
The following table sets forth the gross and net returns (which represent returns prior to and after payment of the highest fee applicable to portfolios in the composite, respectively) for the six months ended June 30, 2012 and the years ended December 31, 2011, 2010, 2009, 2008 and 2007 for our Emerging Markets composite, along with the corresponding returns of the market index that is most commonly used by our clients to compare the performance of the strategy:
| Six Months
Ended June 30, 2012 |
Year Ended December 31, | |||||||||||||||||||||||
| 2011 | 2010 | 2009 | 2008 | 2007 | ||||||||||||||||||||
| Emerging Markets Strategy |
||||||||||||||||||||||||
| Gross Returns |
4.06 | % | (26.99 | )% | 20.49 | % | 85.70 | % | (53.15 | )% | 37.49 | % | ||||||||||||
| Net Returns |
3.52 | (27.77 | ) | 19.24 | 83.87 | (53.67 | ) | 36.07 | ||||||||||||||||
| MSCI Emerging Markets IndexSM |
3.93 | (18.42 | ) | 18.88 | 78.51 | (53.33 | ) | 39.39 | ||||||||||||||||
-148-
Table of Contents
The composite returns shown in the tables above include the returns generated by all of the accounts invested in our Emerging Markets strategy for the periods indicated.
Distribution, Investment Products and Client Relationships
The goal of our marketing, distribution and client service efforts is to establish and maintain a client base that is diversified by investment strategy, investment vehicle (for example, across mutual funds, collective trusts and separate accounts), distribution channel (for example, institutional, defined contribution/401(k), broker-dealer, financial adviser and retail) and geographic region. We focus our distribution and marketing efforts on institutions and on intermediaries that operate with institutional-like, centralized decision-making processes and longer-term investment horizons. This focus has enabled us to efficiently access and service large pools of capital and to develop a balanced and broadly diversified client base. We strive to provide premium client service to reduce client attrition and retain assets under management. Our superior long-term investment performance gives us credibility and creates opportunities for us to present new strategies, or strategies in which we have realizable capacity, to existing and potential clients as well as consultants and other intermediaries. We have designed our distribution strategies and structured our distribution teams to use knowledgeable, seasoned marketing and client service professionals in a way intended to limit the time our investment professionals are required to spend in marketing and client service activities. We believe that minimizing other demands allows our portfolio managers and other investment professionals to focus their energies and attention on the investment decision-making process, which we believe enhances the opportunity to achieve superior investment returns. Our distribution efforts are centrally managed by Dean J. Patenaude, Executive Vice President—Global Distribution, who oversees and coordinates the efforts of our marketing and client service professionals. In our institutional channel, we have one or more senior marketing and client service professionals dedicated to marketing the services and serving the clients of each of our investment teams and our defined contribution/401(k) clients, across all of our investment teams. These professionals, who have an average of 18 years of industry experience, serve as the primary point of contact with us for our institutional clients, as well as for consultants and prospective clients. In our intermediary channel (broker-dealers and financial advisors), we have marketing and client service professionals who are dedicated to a particular channel and have responsibility for marketing and servicing clients across all our investment strategies. We are expanding our distribution efforts into non-U.S. markets, with our primary non-U.S. efforts focused currently on the United Kingdom, other member countries of the European Union, Australia and certain Asian countries, among others, where we believe there is growing institutional demand for global and non-U.S. investment strategies. Our non-U.S. distribution efforts are overseen by a senior marketing and client service professional.
Institutional
Institutional Clients Sourced Directly and through Investment Consultants
As of June 30, 2012, we provided asset management services to approximately 173 separate accounts maintained by institutional clients, mutual funds and collective investment trusts, state and local governments, employee benefit plans including Taft-Hartley plans, foundations, endowments, hospital and healthcare systems and religious organizations. We offer our investment products to institutional clients directly and by marketing our services to the investment consultants that advise them. We have strong relationships with a number of investment consulting firms and believe that many of them rate our open investment strategies favorably. Institutional clients that do not use investment consultants typically operate in a similar fashion, but with employees performing the services often provided by consultants. As of June 30, 2012, approximately 35% of our assets under management were sourced through investment consultants, and no single consulting firm represented clients (including investors in Artisan Funds) having more than 6% of our assets under management. Whenever possible, we seek to develop direct relationships with clients sourced through consultant-led searches by our ongoing client service efforts, as described above.
Defined Contribution/401(k) Plan Assets
We believe that defined contribution/401(k) plan assets are particularly attractive both because of participants’ regular contributions to their individual accounts and because of the long-term nature of the defined contribution/401(k) investment horizon.
-149-
Table of Contents
Our defined contribution efforts are two-fold. First, many large defined contribution plans retain the services of a national institutional consulting firm for investment advice and recommendations. In many cases, these are the same institutional consulting firms serviced by our institutional marketing and client service team and those professionals service this segment of the market. Mid-sized and smaller defined contribution plans are often assisted by smaller—often regionally focused—investment consultants in the selection of appropriate investment options. Some plan sponsors rely on assistance from the administrator/recordkeeper for the plan. Many of these consultants and providers focus primarily on the defined contribution marketplace and maintain significant influence in the selection of plan investment options. We have two professionals dedicated to the investment consultants and providers we consider to be the most successful and influential in this marketplace. Focusing on these consultants and advisors represents an efficient way for us to reach a significant number of potential individual 401(k) investors.
An investor in the defined contribution marketplace may access our services via any of several vehicles—Artisan Funds shares (in the Investor Shares class, in connection with which both Artisan Funds and we pay compensation to recordkeeping partners, or in some cases in the Institutional Shares class without compensation to recordkeeping partners), collective investment trusts and separate accounts. Although the vehicle utilized in the defined contribution marketplace continues to evolve, most of our defined contribution /401(k) assets under management continue to be invested in Artisan Funds, shares of which are offered as an investment option on a number of 401(k) platforms, such as SchwabPlan and Fidelity Workplace Retirement Services, which provide investors in individual 401(k) and other defined contribution retirement plans with access to a range of mutual fund options.
As of June 30, 2012, approximately 79% of our assets under management in the defined contribution/401(k) channel were invested through 401(k) platforms, approximately 17% of our total assets under management were sourced through 401(k) platforms, and our largest 401(k) plan provider relationship accounted for approximately 6% of our assets under management.
Broker-Dealers
We maintain relationships with a number of major brokerage firms and larger private banks. More broker-dealers have moved to an open architecture model under which they strive to offer “best-in-breed” investment strategies to their clients, as do the larger private banks with which we have relationships. In those organizations, the process for identifying which funds to offer has been centralized to a relatively limited number of key decision-makers that exhibit institutional decision-making behavior, which we believe allows us to gain broad exposure to broker-dealer and private bank clients in a manner consistent with our marketing strategy. As of June 30, 2012, 17% of our assets under management were sourced through third-party broker-dealers and private banks, and our largest broker-dealer or private bank relationship represented approximately 3% of our assets under management.
Financial Advisors
We maintain relationships with a number of financial advisory firms that offer our investment products to their clients. These advisors range from relatively small firms to large organizations. We access high net worth individuals and other non-institutional or small institutional investors through these relationships. As of June 30, 2012, approximately 9% of our assets under management were sourced through financial advisors, and the financial advisor from whom we have received the largest portion of client assets accounted for less than 1% of our assets under management.
Retail
We primarily access retail investors indirectly through mutual fund supermarkets (including, for example, The Charles Schwab Mutual Fund MarketPlace® and Fidelity FundsNetwork®) through which investors have the ability to purchase and redeem shares without another intermediary. The providers of mutual fund supermarkets
-150-
Table of Contents
typically have recommended lists that are effective in promoting purchases of shares of mutual funds included in the list. We work with each of the supermarket providers to encourage the inclusion of series of Artisan Funds on such recommended lists where appropriate. Investors can also invest directly in the series of Artisan Funds that remain open to new investors. Our subsidiary, Artisan Partners Distributors LLC, a registered broker-dealer, distributes shares of Artisan Funds. Publicity and reviews and rankings from Morningstar, Lipper and others are important in building the Artisan brand, which is important in attracting retail investors. As a result, we publicize the ratings and rankings received by the series of Artisan Funds and work to ensure that potential retail investors have appropriate information to evaluate a potential investment in Artisan Funds. We do not generally use direct marketing campaigns as we believe that their cost outweighs their potential benefits. As of June 30, 2012, approximately 5% of our assets under management were sourced from investors we categorize as retail investors.
Access Through a Range of Investment Products
Our clients access our investment strategies through a range of investment products, including separate accounts and mutual funds. As of June 30, 2012, approximately 45% of our assets under management were in separate accounts, including U.S.-registered mutual funds other than Artisan Funds, non-U.S. funds and collective investment trusts we sub-advise, and approximately 55% were in Artisan Funds. As of June 30, 2012, we serviced approximately 173 institutional separate account clients and approximately 474 institutional shareholders of Artisan Funds.
We currently manage separate account assets within each of our investment strategies. A separately managed account is often necessary to meet the needs of our clients. We generally require a minimum account size of $20 million to $50 million, depending on the strategy, to manage a separate account. The separate accounts we manage include all or part of the portfolios of several U.S.-registered mutual funds, Canadian funds and Luxembourg- and UK-based funds pursuant to sub-advisory agreements with their primary advisers. The institutions with which we enter into sub-advisory relationships include financial services companies supplementing their own product offerings with products externally managed by managers in the investment strategies we provide. The U.S.-registered funds that we sub-advise are generally either multi-manager funds, in which we manage only a portion of the fund’s portfolio, or funds the shares of which are not generally offered broadly to the U.S. investing public. The non-U.S. funds that we sub-advise allow us to offer our strategies in markets to which we do not otherwise have access and may be multi-manager funds or we may be the only portfolio manager. In each case, the portfolio or sub-portfolio we manage is managed in accordance with one of our identified investment strategies. We also offer access to our Non-U.S. Growth, Value Equity and Global Opportunities strategies through collective investment trusts.
U.S. investors that do not meet our minimum account size for a separate account, or who otherwise prefer to invest through a mutual fund, can invest in our strategies through Artisan Funds. We serve as the investment adviser to each of the 12 series of Artisan Funds, SEC-registered mutual funds that offer no-load, open-end share classes designed to meet the needs of a range of institutional and other investors. Each series of Artisan Funds corresponds to one of our 12 investment strategies. In contrast to some mutual funds, investors in Artisan Funds pay no 12b-1 fees, which are fees charged to investors in addition to management fees to pay for marketing, advertising and distribution services associated with the mutual funds. Expenses for marketing, advertising and distribution services related to Artisan Funds, including payments to broker-dealers and other intermediaries for selling, servicing and administering accounts, are operating expenses that we pay out of the investment management fees we earn. As of June 30, 2012, nine series of Artisan Funds offered institutional share classes, which are available for purchase only by institutional-like investors. As of that date, investors we categorized as institutional-like investors had investments representing 15% of Artisan Funds’ assets, including 14% through Artisan Funds’ institutional classes of shares.
We also serve as investment manager and promoter of Artisan Global Funds, a family of Ireland-based funds organized pursuant to the European Union’s UCITS that began operations in the first quarter of 2011 and offers shares to non-U.S. investors.
-151-
Table of Contents
Marketing, Communication & Branding
To support the consistent communication of our brand through our global distribution efforts and public relations activities, we are engaged in a firm branding effort that includes the expansion and customization of our websites, increasing our use of digital media including video, targeted client events and conferences, and tactical marketing campaigns. Recent campaigns have focused on our investment culture, the experience of our investment teams, third party awards received by the firm and our portfolio managers, and our global investment capabilities. Our branding efforts are improved by our marketing intelligence program, through which we analyze the effectiveness and reach of our branding efforts through various marketing channels. The program is designed to help us allocate marketing resources efficiently by identifying and prioritizing marketing efforts that successfully reach our target audience most efficiently.
Trading
We maintain fully staffed trading desks in our Milwaukee and San Francisco (Pine Street) offices, using common systems and order management and execution platforms across both desks. The Milwaukee trading desk is currently staffed by five traders. Three of those traders primarily trade securities in strategies managed by our Growth team, and two of those traders primarily trade securities in strategies managed by our U.S. Value team, predominantly trading domestic securities and leveraging executing relationships across the Americas.
The San Francisco trading desk facilitates the execution of transactions in U.S. and non-U.S. securities, with primary responsibility for transactions in strategies managed by our Global Equity, Global Value and Emerging Markets teams. The San Francisco trading team may also execute transactions in non-U.S. securities on behalf of other strategies, capitalizing on its network of global executing relationships. Our San Francisco trading desk is staffed by five traders and four trading assistants who trade during all of the hours during which the global markets in which we invest are open for trading. While each of our investment teams has a trader who serves as its primary point of contact on the San Francisco trading desk, our traders operate with primarily regional responsibilities to ensure that trading professionals are available to all the investment teams throughout the global trading day.
We maintain written trade processing and allocation procedures that govern the allocation of investment opportunities among clients. We believe that potential conflicts of interest in the allocation of investment opportunities are managed by the consistent application of that policy and are minimized by the fact that each investment strategy is managed to a single model portfolio.
Operations, Systems and Technology
We generally use third-party software and technology for middle- and back-office functions such as trade confirmation, trade settlement, custodian reconciliations, corporate action processing, performance calculation and client reporting, customized as necessary to support our investment processes and operations. Artisan Funds and Artisan Global Funds outsource the functions of custodian, transfer agent and portfolio accounting agent to third parties whose services to Artisan Funds or Artisan Global Funds we supervise. We also have back-up and disaster recovery systems in place.
Competition
In order to grow our business, we must be able to compete effectively for assets under management. Historically, we have competed to attract assets to our management principally on the basis of:
| • | the performance of our investment strategies; |
| • | continuity of our investment professionals; |
| • | the quality of the service we provide to our clients; and |
| • | our brand recognition and reputation within the institutional investing community. |
-152-
Table of Contents
Our ability to continue to compete effectively will also depend upon our ability to retain our current investment professionals and employees and to attract highly qualified new investment professionals and employees. We compete in all aspects of our business with a large number of investment management firms, commercial banks, broker-dealers, insurance companies and other financial institutions. For additional information concerning the competitive risks that we face, see “Risks Factors—Risks Related to Our Industry—The investment management industry is intensely competitive”.
Employees
As of June 30, 2012, we employed 270 full-time and part-time employees, including nine members of our senior management team, 81 members of our investment teams, including portfolio managers and analysts, research associates, traders and support staff, 34 members of our sales and client service team, 29 members of our legal and compliance team, 31 members of our information technology team and 86 administrative, operations and support staff. None of our employees is subject to collective bargaining agreements. We consider our relationship with our employees to be good and have not experienced interruptions of operations due to labor disagreements.
Properties
We operate our businesses from offices in Milwaukee, Wisconsin; San Francisco, California; Atlanta, Georgia; New York, New York; Wilmington, Delaware; London and Singapore. Our Growth team, marketing and client service professionals and most of our business operations, including our Executive Chairman, are based in Milwaukee. Our offices in Milwaukee are subject to two leases that will expire in 2014 and 2016. Our Chief Executive Officer and Chief Financial Officer, our Global Equity team, our Global Value team and marketing and client service professionals are based in San Francisco, where we maintain two offices pursuant to leases expiring in 2019. Our U.S. Value team and marketing and client service professionals are based in Atlanta, where we maintain an office pursuant to a lease expiring in 2016. We also have investment professionals and support staff based in Wilmington (for our Emerging Markets team), New York (for our Emerging Markets and Global Equity teams), Singapore (for our Global Equity team) and London (for our Global Equity team). We maintain an office in each location pursuant to leases expiring in 2016, 2022, 2014 and 2015, respectively. We generally believe our existing and contracted-for facilities are adequate to meet our requirements.
Legal Proceedings
In the normal course of business, we may be subject to various legal and administrative proceedings. Currently, there are no legal proceedings pending or to our knowledge threatened against us.
-153-
Table of Contents
REGULATORY ENVIRONMENT AND COMPLIANCE
Our business is subject to extensive regulation in the United States at the federal level and, to a lesser extent, the state level, as well as by self-regulatory organizations and outside the United States. Under these laws and regulations, agencies that regulate investment advisers have broad administrative powers, including the power to limit, restrict or prohibit an investment adviser from carrying on its business in the event that it fails to comply with such laws and regulations. Possible sanctions that may be imposed include the suspension of individual employees, limitations on engaging in certain lines of business for specified periods of time, revocation of investment adviser and other registrations, censures and fines.
SEC Regulation
Artisan Partners Limited Partnership and Artisan Partners UK LLP are registered with the SEC as investment advisers under the Advisers Act, and Artisan Funds and several of the investment companies we sub-advise are registered under the 1940 Act. The Advisers Act and the 1940 Act, together with the SEC’s regulations and interpretations thereunder, impose substantive and material restrictions and requirements on the operations of advisers and mutual funds. The SEC is authorized to institute proceedings and impose sanctions for violations of the Advisers Act and the 1940 Act, ranging from fines and censures to termination of an adviser’s registration.
As an investment adviser, we have a fiduciary duty to our clients. The SEC has interpreted that duty to impose standards, requirements and limitations on, among other things: trading for proprietary, personal and client accounts; allocations of investment opportunities among clients; use of soft dollars; execution of transactions; and recommendations to clients. We manage accounts for all of our clients on a discretionary basis, with authority to buy and sell securities for each portfolio, select broker-dealers to execute trades and negotiate brokerage commission rates. In connection with certain of these transactions, we receive soft dollar credits from broker-dealers that have the effect of reducing certain of our expenses. All of our soft dollar arrangements are intended to be within the safe harbor provided by Section 28(e) of the Exchange Act. If our ability to use soft dollars were reduced or eliminated as a result of the implementation of statutory amendments or new regulations, our operating expenses would increase. For information about the reduction in our operating expenses in historical periods through the use of soft dollars, see “Management’s Discussion and Analysis of Financial Condition and Results of Operations—Financial Overview—Operating Expenses—Communication and Technology”.
As a registered adviser, we are subject to many additional requirements that cover, among other things, disclosure of information about our business to clients; maintenance of written policies and procedures; maintenance of extensive books and records; restrictions on the types of fees we may charge; custody of client assets; client privacy; advertising; and solicitation of clients. The SEC has authority to inspect any investment adviser and typically inspects a registered adviser periodically to determine whether the adviser is conducting its activities (i) in accordance with applicable laws, (ii) in a manner that is consistent with disclosures made to clients and (iii) with adequate systems and procedures to ensure compliance.
For the six months ended June 30, 2012, 69% of our revenues were derived from our advisory services to investment companies registered under the 1940 Act—i.e., mutual funds, including 66% from our advisory services to Artisan Funds. The 1940 Act imposes significant requirements and limitations on a registered fund, including with respect to its capital structure, investments and transactions. While we exercise broad discretion over the day-to-day management of the business and affairs of Artisan Funds and the investment portfolios of Artisan Funds and the funds we sub-advise, our own operations are subject to oversight and management by each fund’s board of directors. Under the 1940 Act, a majority of the directors must not be “interested persons” with respect to us (sometimes referred to as the “independent director” requirement). The responsibilities of the board include, among other things, approving our investment management agreement with the fund; approving other service providers; determining the method of valuing assets; and monitoring transactions involving affiliates. Our investment management agreements with these funds may be terminated by the funds on not more than 60 days’
-154-
Table of Contents
notice, and are subject to annual renewal by the fund’s board after the initial term of one to two years. The 1940 Act also imposes on the investment adviser to a mutual fund a fiduciary duty with respect to the receipt of the adviser’s investment management fees. That fiduciary duty may be enforced by the SEC, by administrative action or by litigation by investors in the fund pursuant to a private right of action. In June 2011, an action was filed naming Artisan Partners Limited Partnership as the defendant in a lawsuit challenging the investment advisory fees it charged to certain mutual fund series of Artisan Funds managed by it. In August 2012, the lawsuit was resolved and dismissed with prejudice without having a material adverse effect on our financial position or results of operations. For more information on this litigation, see Note 11 to “Notes to Unaudited Consolidated Financial Statements June 30, 2012 and 2011” contained elsewhere in this prospectus.
As required by the Advisers Act, our investment management agreements may not be assigned without the client’s consent. Under the 1940 Act, investment management agreements with registered funds (such as the mutual funds we manage) terminate automatically upon assignment. The term “assignment” is broadly defined and includes direct assignments as well as assignments that may be deemed to occur upon the transfer, directly or indirectly, of a controlling interest in us. Currently, AIC is the general partner of Artisan Partners Holdings, which is the general partner of Artisan Partners Limited Partnership. Upon the consummation of this offering, AIC, by virtue of its designee’s right to determine how the shares of our common stock subject to the stockholders agreement are voted (subject to the obligation of the stockholders committee under the terms of the stockholders agreement to vote in support of certain nominees), will continue to control Artisan Partners Limited Partnership for purposes of the 1940 Act and the Advisers Act. AIC will cease to have the right to determine how to vote the shares subject to the stockholders agreement upon the earliest to occur of: (i) Andrew A. Ziegler’s death or disability, (ii) the voluntary termination of Mr. Ziegler’s employment with us, including by reason of the scheduled expiration of his employment on the first anniversary of this offering, and (iii) 180 days after the effective date of Mr. Ziegler’s involuntary termination of employment with us. When AIC no longer has the right to determine how to vote the shares of our common stock subject to the stockholders agreement and therefore no longer controls Artisan Partners Limited Partnership, which we expect will occur on the first anniversary of this offering in connection with the scheduled expiration of Mr. Ziegler’s employment with us, or if there were an earlier change of control at AIC or ZFIC Inc. (an entity that owns all of AIC and is controlled by Mr. Ziegler and Carlene M. Ziegler, who are married to each other), it is expected that an assignment will be deemed to have occurred and we will be required to seek the necessary approvals for new mutual fund investment advisory agreements and consents from our separate account clients. See “Risk Factors—Risks Related to our Business—We expect a change of control of our company to occur approximately one year after the completion of this offering. A change of control, if it occurs, will result in termination of our investment advisory agreements with SEC-registered mutual funds and will trigger consent requirements in our other investment advisory agreements.” for more information.
Artisan Partners Distributors LLC, our SEC-registered broker-dealer subsidiary, is subject to the SEC’s Uniform Net Capital Rule, which requires that at least a minimum part of a registered broker-dealer’s assets be kept in relatively liquid form. At June 30, 2012, Artisan Partners Distributors LLC had net capital of $160,024, which was $135,024 in excess of its required net capital of $25,000.
ERISA-Related Regulation
We are a fiduciary under ERISA with respect to assets that we manage for benefit plan clients subject to ERISA. ERISA, regulations promulgated thereunder and applicable provisions of the Internal Revenue Code impose certain duties on persons who are fiduciaries under ERISA, prohibit certain transactions involving ERISA plan clients and provide monetary penalties for violations of these prohibitions.
Non-U.S. Regulation
In addition to the extensive regulation we are subject to in the United States, we are also subject to regulation internationally by the Financial Services Authority in the United Kingdom, the Central Bank of
-155-
Table of Contents
Ireland, as well as by the Australian Securities and Investments Commission, where we operate pursuant to an order of exemption, and by various Canadian regulatory authorities in the Canadian provinces where we operate pursuant to exemptions from registration. Our business is also subject to the rules and regulations of the countries in which we conduct investment activities.
Compliance
Our legal and compliance functions comprise two teams of 29 professionals as of June 30, 2012. This group is responsible for all legal and regulatory compliance matters, as well as monitoring adherence to client investment guidelines. Senior management is involved at various levels in all of these functions.
For information about our regulatory environment, see “Risk Factors—Risks Related to Our Industry—The regulatory environment in which we operate is subject to continual change and regulatory developments designed to increase oversight may adversely affect our business”.
-156-
Table of Contents
Executive Officers and Directors
The following table provides information regarding our directors, nominees to our board of directors and executive officers.
| Name |
Age | Position | ||
| Andrew A. Ziegler |
54 | Executive Chairman and Director | ||
| Eric R. Colson |
43 | President and Chief Executive Officer and Director | ||
| Charles J. Daley, Jr. |
50 | Executive Vice President, Chief Financial Officer and Treasurer | ||
| Janet D. Olsen |
56 | Executive Vice President, Chief Legal Officer and Secretary | ||
| Dean J. Patenaude |
49 | Executive Vice President—Global Distribution | ||
| Matthew R. Barger |
55 | Director Nominee | ||
| Tench Coxe |
54 | Director Nominee | ||
| Allen R. Thorpe |
41 | Director Nominee |
Andrew A. Ziegler has been our Executive Chairman since our organization and has been Executive Chairman of Artisan Partners Holdings since January 2010. As Executive Chairman, Mr. Ziegler shares with our Chief Executive Officer management’s responsibility for strategic planning; collaborates with our Chief Executive Officer on major initiatives, including, for example, new investment teams, major business initiatives and significant capital structure matters; assists our Chief Executive Officer and other members of our senior management team in matters relating to communications and relationships with our employee-partners, clients and consultants; and generally serves as a resource for our Chief Executive Officer. Mr. Ziegler is also Chairman of our board of directors. Mr. Ziegler has been President (chief executive officer) of AIC, our general partner prior to the reorganization transactions, since its organization in 1994 and served as a Managing Director and chief executive officer of Artisan Partners Holdings from its founding in 1994 through January 2010. Immediately prior to founding Artisan Partners Holdings, Mr. Ziegler was President and Chief Operating Officer of Strong Capital Management, Inc. and President of the Strong Capital Management, Inc. group of mutual funds. Mr. Ziegler holds a B.S. from the University of Wisconsin—Madison and a J.D. from the University of Wisconsin Law School. The employment of Mr. Ziegler is expected to terminate approximately one year from the consummation of this offering in accordance with the terms of his employment agreement.
Mr. Ziegler’s qualifications to serve on our board of directors include his operating and leadership experience as our Executive Chairman. As a founder of Artisan, Mr. Ziegler has extensive knowledge of our company’s business and the investment management industry. He gained further experience in the industry from his previous position at Strong Capital Management and has dealt with a wide range of issues that face the industry and this company in particular.
Eric R. Colson, CFA has been our President and Chief Executive Officer since our organization and currently serves as a member of our board of directors. Mr. Colson has served as chief executive officer of Artisan Partners Holdings since January 2010 when he became Vice President—Artisan Chief Executive Officer of AIC. Before serving as Artisan Partners Holdings’ chief executive officer, Mr. Colson served as chief operating officer for investment operations and was Vice President—Artisan Investment Operations of AIC from March 2007 through January 2010. Mr. Colson has been a Managing Director of Artisan Partners Holdings since he joined the company in January 2005. Before joining Artisan Partners Holdings, Mr. Colson was an Executive Vice President of Callan Associates, Inc. Mr. Colson holds a B.A. in economics from the University of California—Irvine.
Mr. Colson’s qualifications to serve on our board of directors include his operating, management and leadership experience as our President and Chief Executive Officer. Mr. Colson has extensive knowledge of and has made significant contributions to our company. Mr. Colson brings to our board of directors his expertise in finance, business development and the asset management industry.
-157-
Table of Contents
Charles J. Daley, Jr. has been our Executive Vice President, Chief Financial Officer and Treasurer since our organization. He has served as chief financial officer of Artisan Partners Holdings since August 2010, when he became Chief Financial Officer and Treasurer of AIC. He has been a Managing Director of Artisan Partners Holdings since July 2010. Prior to that, Mr. Daley was Chief Financial Officer, Executive Vice President and Treasurer of Legg Mason, Inc. Mr. Daley holds a B.S. in Accounting from the University of Maryland and holds a Series 27 license.
Janet D. Olsen has been our Executive Vice President, Chief Legal Officer and Secretary since our organization and has been Vice President and Secretary of AIC since January 2002. She has been a Managing Director of Artisan Partners Holdings and has served as its chief legal officer since joining Artisan Partners Holdings in November 2000. Prior to that, Ms. Olsen was a member of the law firm of Bell, Boyd & Lloyd LLC, Chicago, Illinois. Ms. Olsen holds a B.A. from Blackburn College and a J.D. from The University of Chicago Law School. Ms. Olsen has notified us of her intention to retire from our employment. Her retirement date is expected to be December 31, 2013.
Dean J. Patenaude, CFA has been Executive Vice President—Global Distribution of APAM since July 2012 and a Managing Director of Artisan Partners Holdings and Head of Global Distribution since joining Artisan in March 2009. Before joining Artisan, Mr. Patenaude was senior vice president and head of global distribution for Affiliated Managers Group, Inc., or AMG, where he liaised between AMG and the institutional investment consultant and global distribution channels, and assisted with product development and marketing and client service initiatives. Before joining AMG, Mr. Patenaude was vice president and director of global consultant marketing at Wellington Management Company. He began his career in investment management at Brinson Partners, Inc. as a partner in business development. Mr. Patenaude holds a B.S. in Business Administration from Georgetown University and an M.B.A. from the Kellogg School of Management at Northwestern University.
Matthew R. Barger will become a director in connection with this offering. He is currently Managing Member of MRB Capital, LLC, and he has been a Senior Advisor at Hellman & Friedman LLC since 2007. Prior to 2007, he served in a number of roles at Hellman & Friedman, including Managing General Partner and Chairman of the Investment Committee. Mr. Barger was a member of Artisan Partners Holdings’ Advisory Committee from January 1995 to the completion of the reorganization transactions. Prior to joining Hellman & Friedman LLC, Mr. Barger was an Associate in the Corporate Finance Department of Lehman Brothers Kuhn Loeb. Mr. Barger graduated from Yale University in 1979 and received an M.B.A. from the Stanford Graduate School of Business in 1983. He has been a Director of Hall Capital Partners LLC since August 2007.
Mr. Barger’s career at Hellman & Friedman LLC has provided him with expertise in the investment management industry. He will bring to our board of directors experience in public and private directorships, finance, corporate strategy and business development.
Allen R. Thorpe will become a director in connection with this offering. He has been a Managing Director of Hellman & Friedman LLC since 2004. Prior to joining that firm in 1999, he was a Vice President with Pacific Equity Partners and a Manager at Bain & Company. Mr. Thorpe was a member of Artisan Partners Holdings’ Advisory Committee from July 2006 to the completion of the reorganization transactions. Mr. Thorpe holds a B.A. in Public Policy from Stanford University and an M.B.A. from Harvard Business School, where he was a Baker Scholar. Mr. Thorpe currently serves on the board of directors of Emdeon, Inc., LPL Investment Holdings, Inc., Pharmaceutical Product Development, Inc. and Sheridan Holdings, Inc.
Mr. Thorpe’s qualifications to serve on our board of directors include his operating and leadership experience as a managing director in a private equity firm. In addition, through his involvement with Hellman & Friedman LLC, he has provided leadership to both public and private companies. Mr. Thorpe will bring to our board of directors extensive experience in the financial services industry, finance and business development.
-158-
Table of Contents
Tench Coxe will become a director in connection with this offering. He has been a managing director of Sutter Hill Ventures since 1989 and joined that firm in 1987 following his tenure with Digital Communications Associates in Atlanta. Prior to that, Mr. Coxe worked with Lehman Brothers in New York City, where he was a corporate financial analyst specializing in mergers and acquisitions as well as debt and equity financing. Mr. Coxe was a member of Artisan Partners Holdings’ Advisory Committee from January 1995 to the completion of the reorganization transactions. Mr. Coxe holds a B.A. in economics from Dartmouth College and an M.B.A. from Harvard Business School. He currently serves on the board of directors of Mattersight Corporation and Nvidia Corporation.
Mr. Coxe’s career at Sutter Hill Ventures provides him with wide-ranging leadership experience that will benefit our board of directors and our company. He will bring to our board of directors his experiences in various directorships and a technological background and will provide a unique perspective to the company’s business and opportunities.
Board Composition
Prior to the consummation of this offering, we intend to appoint Matthew R. Barger, Tench Coxe, Allen R. Thorpe , and to our board of directors, each of whom will be an independent director within the meaning of the applicable rules of the SEC and the NYSE. At least one member will be an audit committee financial expert within the meaning of the applicable rules of the SEC and the NYSE. Following these appointments, we expect that our board of directors will consist of seven directors.
Our amended and restated bylaws will provide that our board of directors will consist of no fewer than or more than persons, or such number of directors as fixed by our board of directors from time to time, provided that, as set forth in our restated certificate of incorporation, a vote of at least two-thirds of our board of directors will be required to increase the number of directors and, prior to December 31, 2016, the board may not increase the number of directors to more than nine. The directors will be elected for one-year terms to serve until the next annual meeting of our stockholders, or until their successors are duly appointed.
As described under “Our Structure and Reorganization—Stockholders Agreement”, each of our employee-partners and AIC, who collectively will hold % of the combined voting power of our capital stock immediately after this offering (or approximately % if the underwriters exercise in full their option to purchase additional shares), will enter into a stockholders agreement pursuant to which they will grant an irrevocable voting proxy with respect to all of the shares of our common stock they hold at such time or may acquire from us in the future to a stockholders committee consisting initially of a designee of AIC, who initially will be Mr. Ziegler, Mr. Colson and James C. Kieffer, a portfolio manager of our U.S. Value strategies. The AIC designee will have the sole right, in consultation with the other members of the stockholders committee, to determine how to vote all shares subject to the stockholders agreement until the earliest to occur of: (i) Mr. Ziegler’s death or disability, (ii) the voluntary termination of Mr. Ziegler’s employment with us, including by reason of the scheduled expiration of his employment on the first anniversary of this offering, and (iii) 180 days after the effective date of Mr. Ziegler’s involuntary termination of employment with us. The stockholders agreement will also provide that the stockholders committee will vote the shares subject to the stockholders agreement in support of:
| • | a director nominee designated by the holders of a majority of the preferred units (other than us), and convertible preferred stock (which at the completion of this offering will be the H&F holders) so long as the holders of the preferred units (other than us) and the holders of convertible preferred stock beneficially own at least 5% of the number of outstanding shares of our common stock and our convertible preferred stock; |
| • | Mr. Barger, or, unless Mr. Barger is removed from the board for cause, a successor selected by Mr. Barger who holds Class A common units, so long as the holders of the Class A common units beneficially own at least 5% of the number of outstanding shares of our common stock and convertible preferred stock; |
-159-
Table of Contents
| • | a director nominee designated by AIC so long as AIC owns shares of our capital stock constituting at least 5% of the number of outstanding shares of our common stock and our convertible preferred stock; and |
| • | a director nominee, initially Mr. Colson, who is a holder of Class B common units selected by the stockholders committee. |
Initially, the holders of the preferred units and convertible preferred stock have designated Mr. Thorpe and AIC has designated Mr. Ziegler for election to our board of directors.
Board Leadership Structure
Our initial board of directors includes our Chief Executive Officer and our Executive Chairman, who also serves as Chairman of the Board. Our board understands that there is no single, generally accepted approach to providing board leadership and that given the dynamic and competitive environment in which we operate, the right board leadership structure may vary as circumstances warrant. To this end, our board has no policy mandating the combination or separation of the roles of Chairman of the Board and Chief Executive Officer. The board will discuss and consider the matter from time to time as circumstances change and, subject to our amended and restated bylaws, will have the flexibility to modify our board structure as it deems appropriate. Our amended and restated bylaws require that if the board appoints an Executive Chairman, the board must appoint the same person as Chairman of the Board. Upon the completion of this offering, we will have a combined Executive Chairman and Chairman of the Board, which we believe provides strong leadership for us and promotes a close relationship between management and the board and assists in the development and implementation of corporate strategy. This leadership structure is also appropriate for us at this time as it permits our Chief Executive Officer to focus on management of our day-to-day operations, while allowing our Executive Chairman to lead our board in its fundamental role of providing advice to and independent oversight of management. We believe our company will be well-served by having a flexible leadership structure.
Board Oversight of Risk Management
Our board is responsible for overseeing management in the execution of its responsibilities and for assessing our general approach to risk management. In addition, an overall review of risk is inherent in our board’s consideration of our long-term strategies and other matters presented to our board. Our board exercises its responsibilities periodically as part of its meetings and also through our board’s three committees, each of which examines various components of enterprise risk as part of their responsibilities. For example, the Audit Committee has primary responsibility for addressing risks relating to financial matters, particularly financial reporting and accounting practices and policies. The Audit Committee has primary responsibility for reviewing and discussing our practices regarding financial risk assessment and management, including any guidelines or policies that govern the process by which we identify, monitor and handle major risks. The Nominating and Corporate Governance Committee oversees risks associated with the independence of our board and potential conflicts of interest. The Compensation Committee has primary responsibility for risks and exposures associated with our compensation policies, plans and practices, regarding both executive compensation and the compensation structure generally, including whether it provides appropriate incentives that do not encourage excessive risk taking. Senior management is responsible for assessing and managing our various exposures to risk on a day-to-day basis, including the creation of appropriate risk management programs and policies.
Our board’s role in risk oversight of the company is consistent with our leadership structure, with the Chief Executive Officer and other members of senior management having responsibility for assessing and managing our risk exposure, and our board and its committees providing oversight in connection with those efforts. We believe this division of risk management responsibilities presents a consistent, systemic and effective approach for identifying, managing and mitigating risks throughout the company.
-160-
Table of Contents
Board Committees
Prior to the consummation of this offering, we will establish an Audit Committee, a Nominating and Corporate Governance Committee and a Compensation Committee, each consisting only of independent directors.
Audit Committee
Our Audit Committee will assist our board of directors in its oversight of our internal audit function, the integrity of our financial statements, our independent registered public accounting firm’s qualifications and independence, the performance of our independent registered public accounting firm and our compliance with legal and regulatory requirements.
Our Audit Committee’s responsibilities will include, among others:
| • | reviewing audits and findings of our independent registered public accounting firm and our internal audit and risk review staff, as well as the results of regulatory examinations, and tracking management’s corrective action plans where necessary; |
| • | reviewing our financial statements, including any significant financial items and/or changes in accounting policies, with our senior management and independent registered public accounting firm; |
| • | reviewing our financial risk and control procedures, compliance programs and significant tax, legal and regulatory matters; |
| • | appointing annually our independent registered public accounting firm, evaluating its independence and performance, determining its compensation and setting clear hiring policies for employees or former employees of the independent registered public accounting firm; and |
| • | reviewing and approving any related party transaction in accordance with Artisan policies. |
We anticipate that , and will serve on the Audit Committee and that will serve as its chair. , and are independent under Rule 10A-3 under the Exchange Act. We anticipate that will be an audit committee financial expert within the meaning of the applicable rules of the SEC and the NYSE.
Our board of directors will adopt a new written charter for our Audit Committee, which will be available on our investor relations website, accessible through our principal corporate website at www.artisanpartners.com prior to the completion of this offering.
Nominating and Corporate Governance Committee
Our Nominating and Corporate Governance Committee will assist our board of directors in overseeing the effective corporate governance of our company.
Our Nominating and Corporate Governance Committee’s responsibilities will include, among others:
| • | making recommendations to the board regarding the selection of candidates, qualification and competency requirements for service on the board and the suitability of proposed nominees as directors; |
| • | developing and recommending to the board a set of corporate governance guidelines applicable to us; |
| • | overseeing the evaluation of the board and management; and |
| • | reviewing periodically the form and amounts of director compensation and making recommendations to the board with respect thereto. |
We anticipate that , and will serve on the Nominating and Corporate Governance Committee and that will serve as its chair.
-161-
Table of Contents
Our board of directors will adopt a new written charter for our Nominating and Corporate Governance Committee, which will be available on our investor relations website, accessible through our principal corporate website at www.artisanpartners.com prior to the completion of this offering.
Compensation Committee
Our Compensation Committee will assist our board of directors in discharging its responsibilities relating to the compensation of our executive officers.
Our Compensation Committee’s responsibilities will include, among others:
| • | reviewing and approving, or making recommendations to our board of directors with respect to, the compensation of our executive officers; |
| • | overseeing and administering, and making recommendations to our board of directors with respect to, our cash and equity incentive plans; |
| • | reviewing and making recommendations to the board of directors with respect to director compensation; and |
| • | evaluating post-service (including severance) arrangements and benefits of our executive officers. |
We anticipate that , and will serve on the Compensation Committee and that will serve as its chair.
Our board of directors will adopt a new written charter for our Compensation Committee, which will be available on our investor relations website, accessible through our principal corporate website at www.artisanpartners.com prior to the completion of this offering.
Compensation Committee Interlocks and Insider Participation
Upon the effectiveness of the registration statement of which this prospectus forms a part, our board of directors will form a compensation committee as described above. Prior to this offering, the compensation of our executive officers was determined by Artisan Partners Holdings’ general partner, with the approval of Artisan Partners Holdings’ Advisory Committee for the compensation of Mr. Ziegler. Following this offering, the Compensation Committee of our board of directors will have responsibility for establishing and administering compensation programs and practices with respect to our executive officers, including the named executive officers. None of our executive officers serves as a member of the board of directors or compensation committee, or other committee serving an equivalent function, of any entity that has one or more of its executive officers serving as a member of our board of directors or our Compensation Committee.
Code of Ethics
We will adopt a code of business conduct and ethics applicable to our principal executive, financial and accounting officers and all persons performing similar functions. A copy of that code will be available on our investor relations website, accessible through our principal corporate website at www.artisanpartners.com prior to completion of this offering. We expect that any amendments to the code, or any waivers of its requirements, will be disclosed on our principal corporate website at www.artisanpartners.com as required by applicable law or NYSE listing requirements.
Compensation Discussion and Analysis
In this section, we describe the principles, policies and practices that formed the foundation of our executive compensation program in fiscal 2011 and explain how they were applied to our named executive officers. This discussion should be read in conjunction with the tables and text under “—Executive Compensation” that describe the compensation awarded to, earned by, and paid to the named executive officers. As of the date of this
-162-
Table of Contents
offering, and as discussed above under “Management—Executive Officers and Directors”, our executive officers are our Executive Chairman (Andrew Ziegler); our President and Chief Executive Officer (Eric Colson); our principal financial officer (Charles Daley, Jr.); our Executive Vice President, Global Distribution (Dean Patenaude); and our Chief Legal Officer (Janet Olsen). For fiscal 2011, for purposes of this Compensation Discussion and Analysis, our named executive officers were Mr. Ziegler, Mr. Colson, Mr. Daley, our former Executive Vice President and Chief Operating Officer (Karen Guy) and Ms. Olsen. Ms. Guy ceased to be our Chief Operating Officer in July 2012 and we anticipate that she will retire during fiscal 2013. During 2011, we were a private company. We expect that some of our policies and practices will change when we are a public company. This section also highlights those expected changes.
Compensation and Equity Participation Programs Objectives
We believe that to create long-term value for our stockholders we need a strong and seasoned management team that is focused on our business objectives of achieving profitable and sustainable financial results, expanding our investment capabilities through disciplined growth, continuing to diversify sources of assets and delivering superior client service. Our named executive officers have strategic importance in supporting our business model of generating superior investment performance in high value-added investment strategies. We depend on our management team to recruit and manage our investment teams, determine which investment strategies we launch, manage our distribution channels and provide the operational infrastructure that allows our investment professionals to focus on achieving attractive investment returns for our clients. Our executive compensation program has been, and will continue to be, designed to (i) support our business strategy, (ii) provide opportunities for compensation and ownership participation that are superior over time to the opportunities afforded by our competitors, (iii) attract, motivate and retain highly talented, dedicated, results-oriented individuals with the skills necessary for us to achieve our business strategy, (iv) reward the achievement of superior and sustained performance by being linked directly to the company’s performance on both a short-term and long-term basis and the individual’s performance and (v) be flexible enough so we can respond to changing economic conditions.
Our compensation and equity participation programs provide opportunities, predominantly contingent upon performance, that we believe have determined our ability to attract and retain highly qualified professionals. We use, and expect to continue to use, cash compensation programs and equity participation in a combination that has been successful for us in the past and that we believe will continue to be successful for us as a public company. In addition to competitive cash compensation, we have historically recognized those employees whose performance created value, or enabled the creation of value, for the owners of our business by granting Class B limited partnership interests in Artisan Partners Holdings by which the employee shared in the future profits and growth of the business.
We believe that our cash compensation and equity participation programs align the interests of our named executive officers and other professionals with our stockholders and promote long-term stockholder value creation. In connection with our transition to a public company, we intend for overall compensation levels to remain commensurate with amounts paid to our key employees in the past. As a public company, we expect to include equity-based incentives (“compensation awards”) as a part of our regular compensation programs (which we have not done in the past), but also to continue our practice of making equity awards (“performance awards”) that are in addition to our regular compensation programs in circumstances we believe to be appropriate. We believe that the grant of a performance award that is in addition to, rather than in lieu of, regular compensation to an employee in recognition of value produced provides incentives and alignment of interests that result in even greater value, benefiting not only the recipient of the award but all other business owners. Our use of performance awards will reflect that belief. As a public company, we intend to focus our programs on rewarding the type of performance that increases long-term stockholder value, including growing revenues, retaining clients, developing new client relationships, improving operational efficiency and managing risks. As we develop as a public company, we intend to periodically evaluate the success of our compensation and equity participation programs in achieving these objectives and we expect that some of our policies and practices may change in order to enable us to better achieve these objectives.
-163-
Table of Contents
Determination of Compensation
Our executive compensation and equity participation programs were developed and implemented while we were a private company. We have historically used compensation programs that were designed to provide cash compensation that was equal or superior to the cash compensation paid by our competitors. We have not historically managed our firm to cause our aggregate compensation to be a particular percentage of revenues or another fixed measure, although we have sometimes used such measures as the basis for accruals of amounts pending subjective decision-making. Similarly, we have not historically identified a specific peer group of companies for comparative purposes and have not engaged in formal competitive benchmarking of compensation against specific peer companies. As a public company, we expect that our management team and our Compensation Committee (described below) will take into account appropriate metrics, which may include measures of our compensation expense as a percentage of revenues or other metrics, as well as comparisons with peer benchmarks. Historically, our general partner, which prior to the reorganization transactions in connection with this offering was AIC, had primary responsibility for all compensation decisions relating to our named executive officers and other professionals, subject to the approval of our Advisory Committee with respect to the compensation of Mr. Ziegler. The aggregate level of our executive compensation, as well as each named executive officer’s equity participation, was reviewed on an annual basis.
In connection with this offering, we will form a Compensation Committee comprised solely of independent directors to assist our board of directors in discharging its responsibilities relating to the compensation of our named executive officers. For a discussion of the Compensation Committee’s role and responsibility, see “—Board Committees—Compensation Committee” above. We also expect that, in the future, our Executive Chairman will continue to play a role in making recommendations regarding compensation matters involving our President and Chief Executive Officer, and our President and Chief Executive Officer will continue to play a role in making recommendations regarding compensation matters involving the other named executive officers, to the Compensation Committee, which will make the ultimate decision to approve, reject or modify those recommendations. The Compensation Committee will independently determine the performance of our Executive Chairman and approve his compensation.
We have not historically engaged a compensation consultant to assist in the annual review of our compensation practices or the development of compensation or equity participation programs for our named executive officers.
Elements of Named Executive Officers Compensation and Benefits
We believe that the use of relatively few, straightforward compensation components, without rigid annual incentive formulas or entitlements, promotes the effectiveness and transparency of our executive compensation program. In 2011, the elements of our executive compensation program were:
| • | base salary; |
| • | annual discretionary cash incentive compensation; |
| • | retirement benefits; and |
| • | other benefits and perquisites. |
In addition to those elements of compensation, each of our named executive officers other than Mr. Ziegler is the owner of Class B common units of Artisan Partners Holdings (which provide partners with distributions (or allocations) of profits on his or her units and the opportunity to benefit from the appreciation of (or suffer the depreciation of) the value of those units from and after the date of grant). Mr. Ziegler, who is one of Artisan’s founders, is the beneficial owner of a significant ownership interest in Artisan Partners Holdings through his ownership interest in AIC.
-164-
Table of Contents
Following this offering, we will operate as a corporation, and going forward, we intend to compensate all of our named executive officers, other than our Executive Chairman, with a combination of cash incentive and equity-based incentive compensation awards in order to continue to align our named executive officers’ interests with the interests of our stockholders. Mr. Ziegler, in light of his substantial existing ownership interest, is not expected to receive equity-based compensation. AIC and our named executive officers will continue to hold their common units of Artisan Partners Holdings immediately following the completion of this offering.
Base Salary
Base salaries are intended to provide our named executive officers with a degree of financial certainty and stability that does not depend on our performance and is not used to differentiate among the responsibilities, contributions or performance of our executives. Instead, we consider it a baseline compensation level that delivers some current cash income to our executives.
As is typical in the investment management industry, the base salaries for our named executive officers account for a relatively small portion of their overall annual compensation. We believe that the potential for substantial incentive compensation is seen by our named executive officers as the more important component. Further, we believe in a model of managed fixed costs and the potential for substantial upside to productive employees and view this compensation structure as promoting our business objectives.
Each of our named executive officers received an annual base salary of $250,000 in 2011.
Annual Discretionary Cash Incentive Compensation
Cash incentive compensation has been the most significant part of the overall annual compensation of our named executive officers, and its variability has been a crucial component of our philosophy of maximizing the variability of our most significant expenses. Annual cash incentive compensation is determined towards the end of each fiscal year and is based on a number of variables that are linked to individual and company-wide performance for that year and over the longer term. We have not historically used predetermined incentive formulas to evaluate performance. Instead, annual incentive compensation for our named executive officers has been entirely discretionary. We believe this has provided us the flexibility we need to support our success and to respond to changing market conditions. For example, we reduced annual cash incentive compensation for our named executive officers in 2008 to approximately 50% of the amount paid in 2007 (other than for Mr. Ziegler, who received no cash incentive compensation in 2008), as a reflection of the sharp deterioration of equity markets during 2008, which caused our assets under management and revenues to decline. That reduction was restored in part in 2009 because of the disproportionate burden the named executive officers bore in 2008 as compared with other executives and portfolio managers. Annual cash incentive compensation of our continuing named executive officers in 2011 remained relatively consistent with 2010 as the economy and stock markets continued to recover, but those compensation levels remain below the levels of 2007 for all of our named executive officers except for Mr. Colson, whose compensation for 2007 reflected the responsibilities of the position he then held. The annual cash incentive compensation awarded to our named executive officers for fiscal 2011 is set forth below under “—Executive Compensation—Summary Compensation Table”.
We expect to establish a compensation plan prior to the completion of this offering that provides for the payment of cash incentive compensation to our employees, including our named executive officers. These cash bonuses may be awarded with reference to performance benchmarks in a manner similar to that which would be required under Section 162(m) of the Internal Revenue Code as deductible compensation expenses for a public company. However, to the extent Section 162(m) is applicable to us, we intend to rely on an exemption from Section 162(m) of the Internal Revenue Code for a plan adopted prior to the time such company becomes a public company for a transition period as discussed below. See “Management—Bonus Plan”.
-165-
Table of Contents
Retirement Benefits
We believe that providing a cost-effective retirement benefit for the company’s employees is an important recruitment and retention tool. Accordingly, the company maintains a contributory defined contribution retirement plan for all U.S.-based employees, and matches 100% of each employee’s contributions (other than catch-up contributions by employees age 50 and older) up to the 2012 limit of $17,000 ($16,500 in 2011) and also maintains retirement plans or makes retirement plan contributions for our employees based outside the U.S.
Other Benefits and Perquisites
Our named executive officers participate in the employee health and welfare benefit programs we maintain, including medical, group life and long-term disability insurance, and health-care flexible spending, on the same basis as all employees, subject to satisfying any eligibility requirements and applicable law. We also generally provide employer-paid parking or transit assistance and one daily meal in each of our offices; our named executive officers enjoy those benefits on the same terms as all of our employees. The perquisites provided to our named executive officers in fiscal 2011 are described below under “—Executive Compensation—Summary Compensation Table”.
Equity Compensation Awards and Performance Awards in Artisan Partners Holdings
As discussed above, we strongly believe in the power of equity ownership to cause employees to think and act like owners of the business. We also strongly believe that broad equity ownership creates incentives that promote activity that will cause our business to grow and increase the value of those equity interests, creating value for all owners that will over time outweigh the dilutive effect of the equity grants. As a private company, we thought of equity awards not as elements of current compensation, but as an ownership tool reflecting our decision that the recipient had created value commensurate with becoming an owner of the business or had created incremental value commensurate with a greater ownership percentage. Many of our equity award recipients could expect to receive only one or a few such awards over the course of their careers, although some recipients have received several equity awards. Following our transition to a public company, we intend to continue to promote broad and substantial equity ownership by our employees by using both equity-based compensation awards, which may be granted on an annual basis, and performance awards that will be granted in appropriate circumstances.
Equity compensation awards to our named executive officers have historically been made in the form of Class B limited partnership interests in Artisan Partners Holdings. In July 2012, the limited partnership agreement of Artisan Partners Holdings was amended to reclassify the Class B limited partnership interests as “Class B common units”. As part of the reorganization transactions, the Class B common units will become exchangeable for Class A common stock pursuant to the terms of the exchange agreement. Following this offering, a substantial portion of the economic return of our employees who are partners will continue to be obtained through equity ownership in the partnership. We believe that the continued link between the amount of the economic return they realize and our performance will encourage their continued exceptional performance. In addition, we believe that the restrictions on transfer and the ownership requirements to which they will be subject will help to align their interests with the interests of our stockholders. The following subsection includes a description of those interests, and the economic consequences to the holders of those interests, prior to the reorganization.
Each of our named executive officers, other than Mr. Ziegler, holds Class B common units of Artisan Partners Holdings. Each common unit gives its holder the right to a percentage of Artisan Partners Holdings’ profits. Under the terms of its limited partnership agreement, Artisan Partners Holdings may retain profits for future needs of the partnership. Beginning in the third quarter of 2008, as a result of the deteriorating economic environment, Artisan Partners Holdings retained all profits (other than tax distributions) in order to improve our financial security. In addition, Artisan Partners Holdings was restricted from making distributions to its partners other than tax distributions from the third quarter of 2009 through the first quarter of 2010 because the
-166-
Table of Contents
deteriorating economic environment during that time caused its leverage ratio to exceed a limit specified in the term loan agreement, as in effect at that time. In March 2011, August 2012 and October 2012, Artisan Partners Holdings distributed a portion of its retained profits to its partners, including to each of our named executive officers in respect of their limited partnership interests (other than Mr. Ziegler, who received a portion of retained profits through AIC, through which Mr. Ziegler owns his interest in Artisan Partners Holdings), and in connection with this offering intends to distribute to its pre-offering partners substantially all of its remaining retained profits.
A Class B common unit also allows the holder to participate in the appreciation or depreciation in the value of Artisan Partners Holdings from and after the date of grant, by participating in certain capital or liquidity events (as defined in the limited partnership agreement) or by redemption following termination of employment. The redemption of Class B common units is described in detail below under “—Executive Compensation—Potential Payments upon Termination or Change in Control”.
In January 2011, Mr. Colson was granted additional Class B limited partnership interests (which were reclassified as Class B common units in July 2012). None of our other named executive officers received grants of Class B limited partnership interests in 2011. As of December 31, 2011, our named executive officers held Class B limited partnership interests with profits percentages and equity balances in Artisan Partners Holdings, as follows:
| Name & Principal Position |
Fully Diluted Profits Percentage(1) |
2011 Earned Profits(2) |
Equity Balance as of December 31, 2011(3) |
|||||||||
| Andrew A. Ziegler, Executive Chairman |
— | $ | — | $ | — | |||||||
| Eric R. Colson, President and Chief Executive Officer |
1.6279 | % | 2,614,243 | 11,494,015 | ||||||||
| Charles J. Daley, Jr., Chief Financial Officer |
0.2407 | % | 386,539 | 804,579 | ||||||||
| Karen L. Guy, Executive Vice President and Chief Operating Officer(4) |
0.8251 | % | 1,325,035 | 8,858,730 | ||||||||
| Janet D. Olsen, Executive Vice President, Chief Legal Officer and Secretary |
0.4118 | % | 661,258 | 4,420,944 | ||||||||
| (1) | The amounts in this column represent the fully diluted profits percentages of our named executive officers, other than Mr. Ziegler, as of December 31, 2011. In July 2012, the limited partnership agreement of Artisan Partners Holdings was amended to reclassify the Class B limited partnership interests as “Class B common units”. |
| (2) | The amounts in this column represent allocations of 2011 profits to our continuing named executive officers, other than Mr. Ziegler, pursuant to their respective limited partnership interests. Profits allocations were determined based on net income of Artisan Partners Holdings before equity-based compensation charges. No amounts are included for 2011 earned profits for interests Mr. Ziegler owns in Artisan Partners Holdings through AIC, as these amounts do not constitute executive compensation. For a discussion of Mr. Ziegler’s ownership, see “Principal Stockholders”. |
| (3) | The amounts in this column represent the respective equity account balances of our continuing named executive officers, other than Mr. Ziegler, as of December 31, 2011. In July 2012, the limited partnership agreement of Artisan Partners Holdings was amended to reclassify the Class B limited partnership interests as “Class B common units”. |
| (4) | Ms. Guy ceased to be our Chief Operating Officer in July 2012 and we anticipate that she will retire during fiscal year 2013. |
In July 2012, Mr. Colson and Mr. Daley were granted additional Class B limited partnership interests, which were subsequently reclassified as Class B common units. Our other named executive officers did not receive additional Class B limited partnership interests, or Class B common units, in 2012.
We believe that long-term performance is achieved through an ownership culture that encourages performance by our named executive officers through the use of equity and equity-based awards to ensure that our named executive officers have a continuing stake in our long-term success. Following this offering, we
-167-
Table of Contents
intend to grant equity-based compensation awards primarily based on shares of our Class A common stock as an element of compensation and performance awards that may be based on shares of our Class A common stock or Class B common units in Artisan Partners Holdings (accompanied by shares of our Class B common stock).
We intend to establish a long-term incentive compensation plan prior to the completion of this offering which will provide for a wide variety of equity awards, including stock options, shares of restricted stock, restricted stock units, stock appreciation rights, other stock-based awards based on our common stock, and common units of Artisan Partners Holdings to our named executive officers, other than Mr. Ziegler, and our other key employees, the non-employee members of our board of directors and certain consultants and advisors to the company. See “Management—2013 Omnibus Incentive Compensation Plan”.
Tax and Accounting Considerations
As discussed above, when it reviews compensation matters, our Compensation Committee will consider the anticipated tax and accounting treatment of various payments and benefits to Artisan and, when relevant, to its executives, although these considerations are not dispositive. Section 162(m) of the Internal Revenue Code generally disallows a tax deduction to a publicly-traded corporation that pays compensation in excess of $1 million to any of its named executive officers (other than the chief financial officer) in any taxable year, unless the compensation plan and awards meet certain requirements. As a private company, Section 162(m) does not currently apply to our compensation. Under the transition rules, in general, compensation paid under a plan that existed while we are private is exempt from the $1 million deduction limit until the earliest to occur of: (i) the expiration of the plan; (ii) the material modification of the plan; (iii) the issuance of all available shares and other compensation that has been allocated under the plan; and (iv) the first meeting of stockholders at which directors are to be elected that occurs after the close of the third calendar year following the calendar year in which the offering occurs (i.e., the first meeting of stockholders after December 31, 2016, assuming this offering is completed in 2013). To the extent Section 162(m) is applicable to us, we intend to rely on this exemption and will endeavor to structure other compensation to qualify as performance-based under Section 162(m) where it is reasonable to do so while meeting our compensation objectives. Notwithstanding the foregoing, we reserve the right to pay amounts that are not deductible under Section 162(m) during any period when Section 162(m) is applicable to us.
Risk Considerations in our Compensation Program
We have identified two primary risks relating to compensation: the risk that compensation will not be sufficient to retain talent, and the risk that compensation may provide unintended incentives. To combat the risk that our compensation might not be sufficient, we strive to use a compensation structure, and set compensation levels, for all employees in a way that we believe contributes to low rates of employee attrition. We also make equity awards subject to multi-year vesting schedules to provide a long-term component to our compensation program and impose on all our employees ongoing restrictions on their disposition of their holdings of our stock acquired through equity awards. We believe that both the structure and levels of compensation have aided us in retaining key personnel. To address the risk that our compensation programs might provide unintended incentives, we deliberately keep our compensation programs simple and we tie the long-term component of compensation to our firm-wide results. We have not seen any employee behaviors motivated by our compensation policies and practices that create increased risks for our stockholders or our clients.
Based on the foregoing, we do not believe that our compensation policies and practices motivate imprudent risk taking. Consequently, we are satisfied that any potential risks arising from our employee compensation policies and practices are not reasonably likely to have a material adverse effect on the company. In the future, when we are a public company, the Compensation Committee will monitor the effects of its compensation decisions to determine whether risks are being appropriately managed.
-168-
Table of Contents
Executive Compensation
The table below presents the annual compensation for services to us in all capacities for the periods shown for (i) our principal executive officer, (ii) our principal financial officer and (iii) the three most highly compensated executive officers other than our principal executive officer and principal financial officer who were serving as our executive officers on December 31, 2011. These officers are referred to as the “named executive officers”. All dollar amounts are in U.S. dollars.
Summary Compensation Table
| Name & Principal Position |
Year | Salary | Bonus(1) | Stock Awards |
Option Awards |
Non-Equity Incentive Plan Compensation(2) |
Change in Pension Value and Nonqualified Deferred Compensation Earnings |
All Other Compensation(3) |
Total | |||||||||||||||||||||||||||
| Andrew A. Ziegler, |
2011 | $ | 250,000 | $ | 1,000,000 | — | — | — | — | $ | 21,914 | $ | 1,271,914 | |||||||||||||||||||||||
| Executive Chairman |
2010 | 250,000 | 1,350,000 | — | — | — | — | 19,216 | 1,619,216 | |||||||||||||||||||||||||||
| Eric R. Colson, |
2011 | 250,000 | 3,000,000 | — | — | $ | 2,614,243 | — | 77,342 | 5,941,585 | ||||||||||||||||||||||||||
| Chief Executive Officer |
2010 | 250,000 | 3,150,000 | — | — | 2,000,277 | — | 19,216 | 5,419,493 | |||||||||||||||||||||||||||
| Charles J. Daley, Jr., |
2011 | 250,000 | 1,120,000 | — | — | 386,539 | — | 59,192 | 1,815,731 | |||||||||||||||||||||||||||
| Chief Financial Officer(4) |
2010 | 108,013 | 1,250,000 | — | — | 145,088 | — | 149,968 | 1,653,069 | |||||||||||||||||||||||||||
| Karen L. Guy, |
2011 | 250,000 | 1,540,000 | — | — | 1,325,035 | — | 56,783 | 3,171,818 | |||||||||||||||||||||||||||
| Chief Operating Officer(5) |
2010 | 250,000 | 1,400,000 | — | — | 1,194,866 | — | 19,216 | 2,864,082 | |||||||||||||||||||||||||||
| Janet D. Olsen, |
2011 | 250,000 | 1,240,000 | — | — | 661,258 | — | 52,237 | 2,203,495 | |||||||||||||||||||||||||||
| Chief Legal Officer |
2010 | 250,000 | 1,150,000 | — | — | 596,297 | — | 19,216 | 2,015,513 | |||||||||||||||||||||||||||
| (1) | Amounts shown in this column represent the annual discretionary cash incentive compensation earned by our named executive officers for 2011 and 2010. These amounts were paid in December 2011 and 2010, respectively. |
| (2) | Prior to this offering, we operated as a limited partnership and our named executive officers (other than Mr. Ziegler) held limited partnership interests (which were reclassified as Class B common units in July 2012) in Artisan Partners Holdings which provided partners with distributions of profits on their limited partnership interests and the opportunity to benefit from the appreciation of (or suffer the depreciation of) the value of those interests from and after the date of grant. Amounts shown in this column represent the amount of profits allocated (but not necessarily distributed) to each of the named executive officers on account of his or her limited partnership interests for the relevant year. Profits allocations were determined based on net income of Artisan Partners Holdings before equity-based compensation charges. No amounts are included in the table for profits allocated to AIC, through which Mr. Ziegler owns his interest in Artisan Partners Holdings, as these amounts do not constitute executive compensation. We incurred compensation charges for financial accounting purposes relating to distributions to our named executive officers pursuant to their partnership interests which totaled $3.1 million and $1.5 million for 2011 and 2010 in the aggregate, respectively. We also received compensation benefits or incurred compensation charges for financial accounting purposes for the changes in fair value of the Class B liability awards held by each of our named executive officers other than Mr. Ziegler. These amounts totaled a $14.6 million benefit and $14.2 million charge for 2011 and 2010 in the aggregate, respectively. |
| (3) | Amounts in this column represent the aggregate dollar amount of all other compensation received by our named executive officers. Under SEC rules, we are required to identify by type all perquisites and other personal benefits for a named executive officer if the total value for that individual equals or exceeds $10,000, and to report and quantify each perquisite or personal benefit that exceeds the greater of $25,000 or 10% of the total amount for that individual. In 2011 and 2010, we provided to our named executive officers perquisites consisting of employer-paid parking or transit assistance and daily meals, however, none of the named executive officers received perquisites with a total value of $10,000 or more. In 2011, we contributed $5,000 to each of our named executive officers’ accounts under our health savings benefit plan. In 2010, we contributed $2,500 to each of our named executive officers’ accounts under our flexible |
-169-
Table of Contents
| spending benefit plan ($833 on behalf of Mr. Daley in 2010) which allows all employees to pay certain health care insurance premiums on a pre-tax basis and to receive reimbursement on a pre-tax basis for certain non-covered health care expenses. We paid insurance premiums for life insurance benefiting our named executive officers in both 2011 and 2010 totaling $216 each year for each of our named executive officers ($90 for Mr. Daley based on his service in 2010 and $414 for Mr. Ziegler based on his service in 2011). We made company matching contributions to our named executive officers’ contributory defined contribution plan accounts equal to 100% of their pre-tax contributions (excluding catch-up contributions for named executive officers age 50 and older), up to the limitations imposed under applicable tax rules, which contributions in each of 2011 and 2010 totaled $16,500 for each named executive officer (other than Mr. Daley in 2010, for whom we made no contribution). We reimbursed Mr. Daley in 2010 for relocation and temporary housing expenses of $149,045, consisting of $98,945 in expenses and $50,100 to make Mr. Daley whole for the increased tax expense resulting from the expense reimbursement. In 2011, we reimbursed each of our named executive officers (other than Mr. Ziegler) for increased self-employment payroll tax expense as follows: $55,626 for Mr. Colson, $37,476 for Mr. Daley, $35,067 for Ms. Guy and $30,521 for Ms. Olsen. |
| (4) | Mr. Daley has served as our Chief Financial Officer since August 16, 2010. The amount reported in the salary column for Mr. Daley in 2010 represents the amount earned in 2010, but Mr. Daley’s annual base salary for 2010 was $250,000. Of the amount reported in the bonus column for Mr. Daley in 2010, $250,000 represents a cash sign-on bonus he received in connection with his hiring. |
| (5) | Ms. Guy ceased to be our Chief Operating Officer in July 2012 and we anticipate that she will retire during fiscal year 2013. |
Grants of Plan-Based Awards During 2011
The following table summarizes limited partnership interest awards granted to each of our named executive officers in the year ended December 31, 2011. The limited partnership interests held by our named executive officers were reclassified in July 2012 as Class B common units of Artisan Partners Holdings.
| All Other Share-Based Liability Awards | ||||||||||
| Name |
Grant Date | Profits Interests Granted(%) |
Grant Date Fair Value of Share-Based Liability Awards ($/Unit)(1) |
|||||||
| Andrew A. Ziegler |
— | — | — | |||||||
| Eric R. Colson |
January 1, 2011 | 0.25 | % | $ | 0 | |||||
| Charles J. Daley, Jr. |
— | — | — | |||||||
| Karen L. Guy |
— | — | — | |||||||
| Janet D. Olsen |
— | — | — | |||||||
| (1) | Class B limited partnership interests are classified as share-based liability awards for purposes of FASB ASC Topic 718—Stock Compensation. The Class B limited partnership interests are measured at fair value which varies depending on the circumstances of the holder’s termination of employment. At the time of grant, Class B limited partnership interests had no fair value and, accordingly, no grant date value has been recorded for grants of partnership interests in the table. For a more detailed description of the vesting and redemption of limited partnership interests held by our named executive officers, see “—Potential Payments upon Termination or Change in Control”. |
Narrative Disclosure to Summary Compensation Table and Grants of Plan-Based Awards During 2011
Employment Agreements
Mr. Ziegler has entered into an employment agreement with us to serve as Executive Chairman, pursuant to which he has agreed he will not hold a 5% or greater participation interest in any other investment management business. In connection with, and effective upon the occurrence of, this offering, Mr. Ziegler intends to enter into an employment agreement with us that will provide for an employment term of one year, commencing on the date of the consummation of this offering, and will provide for the payment of base salary and annual incentive compensation on terms similar to those currently in place. As of the date of this filing, Mr. Ziegler’s new employment agreement has not been executed.
-170-
Table of Contents
In August 2012, Ms. Olsen entered into an employment letter agreement with us providing for her continued employment through December 31, 2013 (beyond her previously scheduled retirement in July 2012) in the position of Chief Legal Officer. The letter agreement provides for a base salary at her current level of $250,000 and minimum annual bonus payments for each of fiscal years 2012 and 2013 of $1.75 million, provided she remains employed through the applicable payment dates. In addition, Ms. Olsen is eligible to receive a retention bonus in the amount of $500,000, payable at the earliest to occur of the consummation of this offering or December 31, 2013 (provided in each case she remains employed through the applicable payment date) or her involuntary termination by us without cause. The employment letter agreement specifies that the terms and conditions of Ms. Olsen’s employment prior to entering into the employment letter agreement remain unchanged.
We do not have employment agreements with any of our other named executive officers. Upon commencement of employment, each named executive officer (other than Mr. Ziegler) received an offer letter outlining the initial terms of employment, including base salary and the potential for cash incentive compensation, none of these terms affected compensation paid to our named executive officers in 2011 and, other than Ms. Olsen’s employment letter agreement, will not affect compensation paid in future years.
Ownership Interests in Artisan Partners Holdings
In 2011, we operated as a limited partnership and our named executive officers, other than Mr. Ziegler, held Class B limited partnership interests in Artisan Partners Holdings. In July 2012, those limited partnership interests held by our named executive officers were reclassified as Class B common units of Artisan Partners Holdings. For a detailed description of the common units held by our named executive officers, see “—Compensation Discussion and Analysis—Equity Compensation Awards and Performance Awards in Artisan Partners Holdings” and “—Potential Payments upon Termination or Change in Control”.
Outstanding Equity-Based Compensation Awards at December 31, 2011
The following table provides information about the partnership interests held by each of our named executive officers as of December 31, 2011.
| Name |
Unvested Profits Interests (%)(1) |
Fair Value of Unvested Interests ($)(2) |
||||||
| Andrew A. Ziegler(3) |
— | — | ||||||
| Eric R. Colson(3) |
0.8126 | % | $ | 2,601,496 | ||||
| Charles J. Daley, Jr. |
0.1926 | % | 353,182 | |||||
| Karen L. Guy(3) |
0.1460 | % | 1,282,207 | |||||
| Janet D. Olsen(3) |
— | — | ||||||
| (1) | Vesting of Class B limited partnership interests (which were reclassified as Class B common units in July 2012) is applicable in determining the redemption value upon a holder’s termination of employment prior to consummation of this offering. For this purpose, all currently unvested limited partnership interests typically vest in equal annual installments over the five-year period commencing on the grant date, provided that the holder remains employed by us on the vesting dates. A holder’s limited partnership interests would also vest upon a termination on account of the holder’s death or disability, or, subject to the holder’s continued employment through such date, upon the occurrence of a change in control (as defined in the applicable grant agreement). For interests that were granted to Mr. Colson, Ms. Guy and Ms. Olsen prior to May 1, 2009, vesting was reset in connection with the equity restructuring on May 1, 2009, however, the original vesting schedules continue to apply in the case of the occurrence of certain capital or liquidity events, or the holder’s death, disability or retirement. The figures shown in the table are based on the original vesting schedules and assume that the holder’s employment was terminated by retirement. |
| (2) | Class B limited partnership interests are classified as share-based liability awards for purposes of FASB ASC Topic 718—Stock Compensation. The Class B limited partnership interests are measured at fair value |
-171-
Table of Contents
| which varies depending on the circumstances of the holder’s termination. The values in the table assume employment was terminated by retirement. For a more detailed description of the vesting and redemption of limited partnership interests held by our named executive officers, see “—Compensation Discussion and Analysis—Equity Compensation Awards and Performance Awards in Artisan Partners Holdings”. Also, for a discussion of the assumptions made in the valuation of partnership interests, see Note 8 to our audited financial statements included elsewhere in this prospectus. |
| (3) | No amounts are included for interests Mr. Ziegler owns in Artisan Partners Holdings through AIC, as these amounts do not constitute executive compensation. For interests granted to Mr. Colson, Ms. Guy and Ms. Olsen prior to May 1, 2009, vesting was reset in connection with the equity restructuring on May 1, 2009. The original vesting schedule continues to apply in the case of the occurrence of certain capital or liquidity events, including the completion of this offering, or the holder’s death, disability or retirement. The amounts shown for Mr. Colson and Ms. Guy represent, as of December 31, 2011, their unvested limited partnership interests using the original vesting schedules and assuming termination of employment by reason of retirement. Mr. Colson and Ms. Guy vested in an additional 0.1820% and 0.0366%, respectively, of their limited partnership interests on January 1, 2012. In addition, in January 2011, Mr. Colson was granted additional Class B interests. |
Equity-Based Compensation Awards Exercised and Vested During the Year Ended December 31, 2011
The following table provides information about the value realized by each of our named executive officers during the year ended December 31, 2011 upon the vesting of partnership interests.
| Name |
Profits Interests Acquired Upon Vesting (%) |
Fair Value Realized on Vesting ($)(1) |
||||||
| Andrew A. Ziegler |
— | — | ||||||
| Eric R. Colson |
0.1950 | % | $ | 1,120,580 | ||||
| Charles J. Daley, Jr. |
0.0481 | % | 88,216 | |||||
| Karen L. Guy |
0.0810 | % | 711,912 | |||||
| Janet D. Olsen |
— | — | ||||||
| (1) | There was no public market for the partnership interests as of the vesting dates of January, February and September in the case of Ms. Guy and Mr. Colson and August in the case of Mr. Daley. Amounts are based on profits interests and fair value as of December 31, 2011. Class B limited partnership interests are classified as share-based liability awards for purposes of FASB ASC Topic 718—Stock Compensation. The value of Class B limited partnership interests is measured at fair value which varies depending on the circumstances of the holder’s termination. The figures shown in the table are based on the original vesting schedules and assume that the holder’s employment was terminated by retirement. |
Pension Benefits
We do not sponsor or maintain any defined benefit pension or retirement benefits for the benefit of our employees.
Nonqualified Defined Contribution and Other Nonqualified Deferred Compensation Plans
We do not sponsor or maintain any nonqualified defined contribution or other nonqualified deferred compensation plans for the benefit of our employees.
Potential Payments upon Termination or Change in Control
The following summaries describe and quantify the potential payments and benefits that we would provide to our named executive officers in connection with a termination of employment and/or a change in control. In determining amounts payable, we have assumed in all cases that the termination of employment and change in control occurred on December 31, 2011.
-172-
Table of Contents
Severance Benefits
Our named executive officers are all employed on an “at will” basis, which enables us to terminate their employment at any time. Our named executive officers do not have agreements that provide severance benefits. We do not offer or have in place any formal retirement, severance or similar compensation programs providing for additional benefits or payments in connection with a termination of employment, change in job responsibility or change in control (other than our contributory defined contribution plan). Under certain circumstances, a named executive officer may be offered severance benefits to be negotiated at the time of termination.
Vesting and Redemption of Artisan Limited Partnership Interests
Under the terms of the limited partnership interest grant agreements of each of our named executive officers other than Mr. Ziegler, their Class B limited partnership interests (which were reclassified as Class B common units in July 2012), if vested, are subject to mandatory redemption (or forfeiture, if unvested) upon the termination of their employment. For this purpose, the limited partnership interests typically vest in equal annual installments over the five-year period commencing on the grant date, provided that the holder remains employed by us on the vesting dates. A holder’s limited partnership interests would also vest upon a termination on account of the holder’s death or disability or, subject to the holder’s continued employment through such date, upon the occurrence of a change in control (as defined in the applicable grant agreement). For interests that were granted to Mr. Colson, Ms. Guy and Ms. Olsen prior to May 1, 2009, vesting was reset in connection with the equity restructuring on May 1, 2009. Even for those reset interests, the original vesting schedules continue to apply in the case of the occurrence of certain capital or liquidity events, including the completion of this offering, or the holder’s death, disability or retirement. Any portion of a holder’s limited partnership interests that are not vested as of the holder’s termination of employment will be forfeited without any payment in connection with that forfeiture. In order for a holder of limited partnership interests to receive a distribution of profits, they must be employed at the time of distribution, and former employees have no right to previously allocated, but undistributed, profits.
Prior to July 15, 2012, the redemption price for a holder’s limited partnership interests was based on the holder’s equity balance, which was a measure under the limited partnership agreement of each holder’s share of Artisan Partners Holdings’ equity value. If the holder’s employment was terminated on account of death, disability or retirement, the redemption value was equal to the terminated holder’s full equity balance. If the holder’s employment was terminated for other reasons, the redemption value was equal to one-half of the terminated holder’s equity balance. Subsequent to July 15, 2012, the redemption value of Class B common units continues to vary depending on the circumstances of the holder’s termination but is based on the fair market value of the firm determined by the general partner, and approved by the Advisory Committee, by reference to the value of comparable firms with publicly-traded equity securities. Prior to the offering and in connection with the reorganization transactions, we will further amend the Class B grant agreements to eliminate the cash redemption feature.
In the event of the termination of employment of a named executive officer, other than Mr. Ziegler, due to death or disability, and assuming such event occurred on December 31, 2011, the named executive officer’s payment upon redemption of his or her limited partnership interests would be approximately as follows: $804,579 for Mr. Daley, $11,494,015 for Mr. Colson, $8,858,730 for Ms. Guy and $4,420,944 for Ms. Olsen. In the event of the termination of employment of a named executive officer (other than Mr. Ziegler) due to retirement, and assuming such event occurred on December 31, 2011, the named executive officer’s payment upon redemption of his or her limited partnership interests would be approximately as follows: $160,799 for Mr. Daley, $8,122,574 for Mr. Colson, $7,291,517 for Ms. Guy and $4,420,944 for Ms. Olsen. In the event of the termination of employment of a named executive officer (other than Mr. Ziegler) for any other reason, and assuming such event occurred on December 31, 2011, the named executive officer’s payments upon redemption of his or her limited partnership interests would be approximately as follows: $80,400 for Mr. Daley, $4,061,287 for Mr. Colson, $3,645,758 for Ms. Guy and $2,210,472 for Ms. Olsen. Mr. Ziegler’s ownership interest in Artisan Partners Holdings through AIC is not subject to redemption.
-173-
Table of Contents
Each of the named executive officers other than Mr. Ziegler has agreed, pursuant to his or her Class B grant agreement, that he or she will not solicit our customers and employees while employed and for a period of two years following termination of employment. In addition, Mr. Ziegler will agree not to compete with us, and not to solicit our customers and employees, during the term of his employment with us and for a period of two years following termination of his employment with us.
2013 Omnibus Incentive Compensation Plan
Our board of directors expects to adopt, and we expect our stockholders to approve, the Artisan Partners Asset Management Inc. 2013 Omnibus Incentive Compensation Plan, or the 2013 Plan, in connection with this offering.
The purposes of the 2013 Plan are to align the long-term financial interests of employees, consultants and advisors of the company with those of our stockholders, to attract and retain those individuals by providing compensation opportunities that are consistent with our compensation philosophy, and to provide incentives to those individuals who contribute significantly to our long-term performance and growth. To accomplish these purposes, the 2013 Plan will provide for the grant of stock options (both stock options intended to be incentive stock options under Section 422 of the Internal Revenue Code and non-qualified stock options), stock appreciation rights, or SARs, restricted stock awards, restricted stock units, performance-based stock awards and other stock-based awards (collectively, stock awards) based on our Class A common stock, as well as Class B common units of Artisan Partners Holdings. In addition, the 2013 Plan will provide for the grant of cash awards. Incentive stock options may be granted only to employees; all other awards may be granted to employees, including officers, members, limited partners or partners who are engaged in the business of one or more of our subsidiaries and consultants. Our non-employee directors are not permitted to be participants in the 2013 Plan.
Shares Subject to the 2013 Plan. A total of shares of our Class A common stock will be reserved and available for issuance under the 2013 Plan. If a stock award granted under the 2013 Plan expires, is forfeited or otherwise terminates without being exercised in full, or is settled in cash, the shares of our Class A common stock not acquired pursuant to the stock award will again become available for subsequent issuance under the 2013 Plan. The following types of shares under the 2013 Plan shall not become available for the grant of new stock awards under the 2013 Plan: (i) shares withheld to satisfy income or employment withholding taxes, (ii) shares used to pay the exercise price of an option in a net exercise arrangement and (iii) shares tendered to us to pay the exercise price of an option.
The aggregate number of shares of our Class A common stock that may be granted to any single individual during a calendar year in the form of stock options may not exceed . The aggregate number of shares of our Class A common stock that may be granted to any single individual during a calendar year in the form of SARs may not exceed .
Administration of the 2013 Plan. The 2013 Plan will be administered by our Compensation Committee. Subject to the terms of the 2013 Plan, the Compensation Committee will determine which employees, consultants and advisors will receive grants under the 2013 Plan, the dates of grant, the numbers and types of stock awards to be granted, the exercise or purchase price of each award, and the terms and conditions of the stock awards, including the period of their exercisability and vesting and the fair market value applicable to a stock award. In addition, the Compensation Committee will interpret the 2013 Plan and may adopt any administrative rules, regulations, procedures and guidelines governing the 2013 Plan or any awards granted under the 2013 Plan as it deems to be appropriate. The Compensation Committee may also delegate any of its powers, responsibilities or duties to any person who is not a member of the Compensation Committee or any administrative group within the company.
Types of Equity-Based Awards. The types of awards that may be made under the 2013 Plan are described below. These awards may be made singly or in combination, as part of compensation awards or performance awards, or both. All of the awards described below are subject to the conditions, limitations, restrictions, vesting
-174-
Table of Contents
and forfeiture provisions determined by the Compensation Committee, in its sole discretion subject to certain limitations provided in the 2013 Plan. Each award granted under the 2013 Plan will be evidenced by an award agreement, which will govern that award’s terms and conditions.
Non-qualified Stock Options. A non-qualified stock option is an option that does not meet the qualifications of an incentive stock option as described below. An award of a non-qualified stock option grants a participant the right to purchase a certain number of shares of our Class A common stock during a specified term in the future, after a vesting period, at an exercise price equal to at least 100% of the fair market value of our Class A common stock on the grant date. The term of a non-qualified stock option may not exceed 10 years from the date of grant. The exercise price may be paid using (i) cash, check, bank draft or money order, (ii) a broker-assisted cashless exercise, (iii) shares of our Class A common stock previously owned by the participant, (iv) a net exercise of the stock option and (v) other legal consideration approved by the Compensation Committee.
Incentive Stock Options. An incentive stock option is a stock option that meets the requirements of Section 422 of the Internal Revenue Code. Incentive stock options may be granted only to our employees and must have an exercise price of no less than 100% of fair market value on the grant date, a term of no more than 10 years, and be granted from a plan that has been approved by our stockholders. The aggregate fair market value, determined at the time of grant, of our Class A common stock with respect to incentive stock options that are exercisable for the first time by a participant during any calendar year may not exceed $100,000. No incentive stock option may be granted to any person who, at the time of the grant, owns or is deemed to own stock possessing more than 10% of our total combined voting power or that of any of our affiliates unless (i) the option exercise price is at least 110% of the fair market value of the stock subject to the option on the date of grant and (ii) the term of the incentive stock option does not exceed five years from the date of grant.
Stock Appreciation Rights. A SAR entitles the participant to receive an amount equal to the difference between the fair market value of our Class A common stock on the exercise date and the exercise price of the SAR (which may not be less than 100% of the fair market value of a share of our Class A common stock on the grant date), multiplied by the number of shares subject to the SAR. The term of a SAR may not exceed 10 years from the date of grant. Payment to a participant upon the exercise of a SAR may be either in cash or shares of our Class A common stock as determined by the Compensation Committee.
Restricted Stock. A restricted stock award is an award of outstanding shares of our Class A common stock that does not vest until a specified period of time has elapsed, or other vesting conditions have been satisfied as determined by the Compensation Committee, and which will be forfeited if the conditions to vesting are not met. During the period that any restrictions apply, the transferability of stock awards is generally prohibited. Participants generally have all of the rights of a stockholder as to those shares, including the right to receive dividend payments on the shares subject to their award during the vesting period and the right to vote those shares. Dividends will be subject to the same vesting and forfeiture provisions as the underlying restricted stock unless otherwise provided by the Compensation Committee.
Restricted Stock Units. A restricted stock unit is an unfunded and unsecured obligation to issue a share of Class A common stock (or an equivalent cash amount) to the participant in the future. Restricted stock units become payable on terms and conditions determined by the Compensation Committee and will be settled either in cash or shares of our Class A common stock as determined by the Compensation Committee.
Dividend Equivalents. Dividend equivalents entitle the participant to receive amounts equal to ordinary cash dividends that are paid on the shares underlying a grant while the grant is outstanding and may be awarded in connection with grants other than stock options or SARs. The Compensation Committee will determine whether dividend equivalents will be paid currently or credited to a bookkeeping account as a dollar amount or in the form of restricted stock units. Dividend equivalents may be paid in cash, in shares of our Class A common stock or in a combination of the two. The Compensation Committee will determine whether dividend equivalents will be conditioned upon the vesting or payment of the grant to which they relate and the other terms and conditions of the grant.
-175-
Table of Contents
Other Stock-Based or Cash-Based Awards. Under the 2013 Plan, the Compensation Committee may grant other types of equity-based, equity-related or cash-based awards subject to such terms and conditions that the Compensation Committee may determine. Such awards may include the grant or offer for sale of unrestricted shares of our Class A common Stock, performance share awards, performance units settled in cash and other types of awards.
Class B Common Units of Artisan Partners Holdings. Under the 2013 Plan, the Compensation Committee may also grant equity-based incentives related to Class B common units of Artisan Partners Holdings. The Compensation Committee may grant the same types of awards available under the 2013 Plan related to our Class A common stock as awards related to the Class B common units of Artisan Partners Holdings, including options to purchase Class B common units and restricted Class B common units. The Compensation Committee may also grant profits interests related to Class B common units of Artisan Partners Holdings. Any award granted covering Class B common units will reduce the overall limit with respect to the number of shares of Class A common stock that may be granted under the 2013 Plan on a one-for-one basis.
Adjustments. In connection with stock splits, extraordinary dividends, stock dividends, recapitalizations and certain other events affecting our Class A common stock, the Compensation Committee will make adjustments as it deems appropriate in (i) the maximum number of shares of our Class A common stock reserved for issuance as grants, (ii) the maximum number of stock options and SARs that any individual participating in the 2013 Plan may be granted in any calendar year, (iii) the number and kind of shares covered by outstanding grants, (iv) the kind of shares that may be issued under the 2013 Plan and (v) the exercise price of all outstanding stock awards, if applicable.
Change of Control. Unless our Compensation Committee determines otherwise, if a participant’s employment is terminated by us without “cause” (as defined in the 2013 Plan) or the participant resigns his or her employment for “good reason” (as defined in the 2013 Plan), in either case, on or within two years after a “change in control” (as defined in the 2013 Plan), all outstanding awards will become fully vested (including lapsing of all restrictions and conditions), and, as applicable, exercisable. In connection with a change in control, the Compensation Committee may also (i) provide for the assumption of or the issuance of substitute awards, (ii) provide that for a period of at least 20 days prior to the change in control, stock options or SARs that would not otherwise become exercisable prior to a change in control will be exercisable as to all shares of Class A common stock or Class B common units, as the case may be, subject thereto and that any stock options or SARs not exercised prior to the consummation of the change in control will terminate and be of no further force or effect as of the consummation of the change in control or (iii) settle awards for an amount (as determined in the sole discretion of the Compensation Committee) of cash or securities (in the case of stock options and SARs that are settled, the amount paid shall be equal to the in-the-money spread value, if any, of such awards).
In general terms, except in connection with any initial public offering, a change of control under the 2013 Plan occurs:
| • | if a person becomes a beneficial owner of our capital stock representing 30% of the voting power of Artisan’s outstanding capital stock; |
| • | if the board of directors immediately after the initial public offering of our Class A common stock and directors whose appointment or election is endorsed by two-thirds of the incumbent directors no longer constitute a majority of the board; |
| • | if we merge into another entity, unless (i) more than 50% of the combined voting power of the merged entity or its parent is represented by Artisan voting securities that were outstanding immediately prior to the merger, (ii) the board prior to the merger constitutes at least a majority of the board of the merged entity or its parent following the merger and (iii) no person is or becomes the beneficial owner of 30% or more of the combined voting power of the outstanding capital stock eligible to elect directors of the merged entity or its parent; |
-176-
Table of Contents
| • | if we sell or dispose of all or substantially all of our assets; or |
| • | if we are liquidated or dissolved. |
Amendment; Termination. Our board of directors or our Compensation Committee may amend or terminate the 2013 Plan at any time. Our stockholders must approve any amendment if their approval is required in order to comply with the Internal Revenue Code, applicable laws, or applicable stock exchange requirements. Unless terminated sooner by our board of directors or extended with stockholder approval, the 2013 Plan will terminate on the day immediately preceding the tenth anniversary of the date on which the board of directors approved the 2013 Plan, but any outstanding award will remain in effect until the underlying shares are delivered or the award lapses.
Bonus Plan
Our board of directors expects to adopt, and we expect our stockholders to approve, the Artisan Partners Asset Management Inc. Bonus Plan, or the Bonus Plan, in connection with this offering.
The purpose of the Bonus Plan is to advance the interests of Artisan and its stockholders by providing incentives in the form of bonus awards to certain employees and other persons (other than non-employee directors of Artisan) who provide services to Artisan and any of its subsidiaries or other related business units or entities who contribute significantly to the strategic and long-term performance objectives and growth of Artisan and any of its subsidiaries or other related business units or entities.
Administration of the Bonus Plan. The Bonus Plan will be administered by our Compensation Committee. Subject to the terms of the Bonus Plan, the Compensation Committee will determine which employees, consultants and advisors will receive grants under the Bonus Plan, the dates of grant, the numbers and types of awards to be granted, and the terms and conditions of the awards. In addition, the Compensation Committee will interpret the Bonus Plan. The Compensation Committee generally may delegate its powers, responsibilities or duties to any person who is not a member of the Compensation Committee or any administrative group within the company.
Types of Awards. Awards made under the Bonus Plan will be payable in the discretion of the Compensation Committee in cash and/or an equity-based award. Bonuses under the Bonus Plan that are granted and denominated in cash may be paid under the Bonus Plan or any other plan maintained by Artisan or its affiliates. Bonuses under the Bonus Plan that are granted in the form of options, SARs or other equity-based awards will be granted under the Bonus Plan or any other plan providing for equity-based awards maintained by Artisan and its affiliates.
Award Limitations. Any award intended to qualify as “performance-based compensation” for purposes of Section 162(m) of the Internal Revenue Code shall be subject to the following per participant limitations for any calendar year:
| • | For an award that is granted and denominated in cash, the maximum dollar value of such award is $ . |
| • | For an award granted in the form of options with respect to Class A common stock or Class B common units of Artisan Partners Holdings, the limits are and , respectively. |
| • | For an award granted in the form of SARs with respect to Class A common stock or Class B common units of Artisan Partners Holdings, the limits are and , respectively. |
| • | For other equity-based awards granted, other than awards granted in the form of stock options and SARs, with respect to Class A common stock or Class B common units of Artisan Partners Holdings, the limits are and , respectively. |
-177-
Table of Contents
In connection with stock splits, extraordinary dividends, stock dividends, recapitalizations and certain other events affecting our Class A common stock or Class B common units of Artisan Partners Holdings, the Compensation Committee will make adjustments as it deems appropriate to the limits for stock options, SARs and other-equity based awards. Shares of Class A common stock and Class B common units of Artisan Partners Holdings issued in connection with an award that is granted and denominated in cash and paid in stock options, SARs or other equity-based awards will not count against the limits with respect to awards granted in the form of stock options, SARs or other equity-based awards.
Amendment; Termination. Our board of directors or our Compensation Committee may amend the Bonus Plan at any time. The Bonus Plan will continue to be in effect until such time that our board of directors decides to terminate the plan.
Section 162(m) Stockholder Approval Requirements. In compliance with the transition rules under Section 162(m) of the Internal Revenue Code, and after this offering, to the extent Section 162(m) is applicable to us, our stockholders will need to approve the Bonus Plan no later than the first occurrence of: (i) a material modification of the Bonus Plan; (ii) our first stockholders’ meeting (during which our directors are elected) that occurs after the end of the third calendar year following the year in which this offering occurred (i.e., the first meeting of stockholders after December 31, 2016, assuming this offering is completed in 2013); or (iii) such other date required by Section 162(m) of the Internal Revenue Code.
Director Compensation
Upon completion of this offering, we do not expect to pay our directors who are also our employees any compensation for their services as directors. We anticipate that our non-employee directors will initially be compensated with an annual retainer of $ and an equity grant on terms to be determined. We also anticipate that each non-employee chairman of a committee of our board of directors will be compensated with an additional annual retainer of $ . In addition, all directors will be reimbursed for reasonable out-of-pocket expenses incurred by them in connection with attending board of directors, committee and stockholder meetings, including those for travel, meals and lodging. We reserve the right to change the manner and amount of compensation to our non-employee directors at any time.
In connection with this offering, we intend to grant each of our non-employee directors equity awards based on shares of Class A common stock.
2013 Non-Employee Director Plan
Our board of directors expects to adopt, and we expect our stockholders to approve, the Artisan Partners Asset Management Inc. 2013 Non-Employee Director Compensation Plan, or the 2013 Non-Employee Director Plan, in connection with this offering. The description of the 2013 Non-Employee Director Plan is the same as the description for the 2013 Plan, except for the following key differences: (i) a total of shares of our Class A common stock will be reserved and available for issuance under the 2013 Non-Employee Director Plan; (ii) our non-employee directors are the only permitted participants in the 2013 Non-Employee Director Plan; (iii) incentive stock options may not be granted to non-employee directors; (iv) unless our Compensation Committee determines otherwise, in the event of a change in control, all outstanding awards will become fully vested (including lapsing of all restrictions and conditions), and, as applicable, exercisable; and (v) there is no calendar year limit with respect to the number of stock options or SARs that may be granted to a participant.
-178-
Table of Contents
RELATIONSHIPS AND RELATED PARTY TRANSACTIONS
Transactions in connection with the Reorganization
As part of the reorganization, we will engage in certain transactions with certain of our directors, director nominees, executive officers and other persons and entities that will become holders of 5% or more of our voting securities, through their ownership of shares of our Class B or Class C common stock, upon the consummation of the reorganization. These transactions are described in “Our Structure and Reorganization”.
In addition, we expect to enter into an indemnification agreement with each of our executive officers, directors and the members of our stockholders committee that provides, in general, that we will indemnify them to the fullest extent permitted by law in connection with their service in such capacities. Due to the nature of the indemnification agreements, they are not the type of agreements that are typically entered into with or available to unaffiliated third parties.
Transactions with AIC
Artisan Partners Holdings has cost sharing arrangements with its current general partner, AIC, as well as AIC’s beneficial owners, including our Executive Chairman, Andrew A. Ziegler, and Carlene M. Ziegler, pursuant to which Artisan Partners Holdings and certain of its employees provide certain administrative services to AIC and its owners, and AIC and its owners reimburse Artisan Partners Holdings for the costs related to such services. Pursuant to these arrangements, AIC and its owners paid Artisan Partners Holdings approximately $347,839, $508,735, $448,920 and $411,567 for the six months ended June 30, 2012 and the years ended December 31, 2011, 2010 and 2009, respectively. These arrangements will terminate no later than the date of termination of Mr. Ziegler’s employment by Artisan. We believe that the terms of these arrangements are reasonable and reflect the terms of agreements negotiated on an arm’s-length basis. In addition, Artisan Partners Holdings has obtained and paid for insurance policies covering potential liability AIC may incur as general partner of Artisan Partners Holdings.
Transactions with Artisan Funds
We have agreements to serve as the investment manager of Artisan Funds, an SEC-registered family of mutual funds, with which certain of our employees are affiliated. Under the terms of the agreements with the funds, the continuation of which is subject to annual review and approval by Artisan Funds’ board of directors, we earn investment management fees based on an annual percentage of the average daily net assets of each Artisan Fund, with the fee rates ranging from 0.64% to 1.25% of assets under management. Amounts earned from advising Artisan Funds, which are reported in investment management fees, are as follows:
| Six months ended June 30, 2012 |
$ | 159.1 million | ||
| Year ended December 31, 2011 |
$ | 303.9 million | ||
| Year ended December 31, 2010 |
$ | 261.6 million | ||
| Year ended December 31, 2009 |
$ | 197.2 million |
We have agreed to waive or reimburse expenses for certain of the Artisan Funds to the extent their expenses exceed certain levels. We have contractually agreed to waive our management fees or reimburse for expenses incurred to the extent necessary to cause the annual, ordinary operating expenses incurred by Artisan Emerging Markets Fund, Artisan Global Value Fund, Artisan Global Opportunities Fund and Artisan Global Equity Fund not to exceed 1.50% of that fund’s average assets through February 1, 2013. For periods prior to October 1, 2009, this agreement was voluntary. In addition, we may decide to voluntarily reduce additional fees or reimburse any Artisan Fund for other expenses. Amounts we waived or reimbursed for fees and expenses (including management fees) for Artisan Funds are as follows:
| Six months ended June 30, 2012 |
$ | 0.1 million | ||
| Year ended December 31, 2011 |
$ | 0.4 million | ||
| Year ended December 31, 2010 |
$ | 0.4 million | ||
| Year ended December 31, 2009 |
$ | 0.7 million |
-179-
Table of Contents
The officers and a director of Artisan Funds who are affiliated with us receive no compensation from Artisan Funds.
Transactions with Artisan Global Funds
We have agreements to serve as the investment manager of Artisan Global Funds, a family of Ireland-domiciled funds organized pursuant to the European Union’s Undertaking for Collective Investment in Transferable Securities, or UCITS, with which certain of our employees are affiliated. Under the terms of the agreements with Artisan Global Funds, we earn investment management fees based on an annual percentage of the average daily net assets of each sub-fund of Artisan Global Funds, with fee rates ranging from 0.85% to 0.95% of assets under management. In UCITS funds, it is permissible and in some circumstances customary for a portion of the management fee to be rebated to investors with accounts of a certain type or asset size. For the six months ended June 30, 2012 and the year ended December 31, 2011, we earned investment management fees of $1.2 million and $1.3 million, respectively, with effective fee rates, net of rebates, of 0.87% and 0.83%, respectively, from advising Artisan Global Funds. Artisan reimburses each sub-fund of Artisan Global Funds to the extent that sub-fund’s expenses exceed certain levels, which are not more than 0.20% for Emerging Markets Fund and not more than 0.35% for the Global Value Fund and Value Fund. Amounts we waived or reimbursed for fees and expenses for Artisan Global Funds were $0.4 and $0.7 million for the six months ended June 30, 2012 and the year ended December 31, 2011, respectively. The officers and a director of Artisan Global Funds who are affiliated with us receive no compensation from Artisan Global Funds.
Transactions with Private Fund
We have an agreement to serve as the investment manager of Artisan Partners Launch Equity LP, or Launch Equity, a private investment partnership the investors in which are certain of our employees. Under the terms of our agreement with Launch Equity, we earn a quarterly fee based on the value of the closing capital account of each limited partner for the quarter, at the rate of 1.00% (annualized). At our discretion, the fee may be waived and certain expenses reimbursed. Artisan waived the incentive fee for the six month period ended June 30, 2012 and the year ended December 31, 2011. Expense reimbursements totaled $81,446 for the six month period ended June 30, 2012 and $149,535 for the year ended December 31, 2011. Our wholly owned subsidiary, Artisan Partners Alternative Investments GP LLC, is the general partner of Launch Equity. Artisan Partners Alternative Investments GP LLC is entitled to receive an allocation of profits from Launch Equity equal to 20% of Launch Equity’s net capital appreciation as determined at the conclusion of its fiscal year, which also may be waived at our discretion. There was no net capital appreciation for the fiscal year ended December 31, 2011.
Statement Regarding Transactions with Affiliates
In connection with this offering, we will adopt a written policy regarding the approval of any transaction or series of transactions in which we or any of our subsidiaries is a participant, the amount involved exceeds $120,000, and a “related person” (as defined under SEC rules) has a direct or indirect material interest. Under the policy, a related person must promptly disclose to our chief legal officer any “related person transaction” (defined as any transaction that is required to be disclosed under Item 404(a) of Regulation S-K in which we were or are to be a participant and the amount involved exceeds $120,000 and in which any related person had or will have a direct or indirect material interest) and all material facts about the transaction. The chief legal officer will then assess and promptly communicate that information to the Nominating and Corporate Governance Committee of our board of directors. Based on its consideration of all of the relevant facts and circumstances, this board committee will decide whether or not to approve such transaction and will generally approve only those transactions that do not create a conflict of interest. If we become aware of an existing related person transaction that has not been pre-approved under this policy, the transaction will be referred to this board committee, which will evaluate all options available, including ratification, revision or termination of such transaction. Under the policy, any director who may be interested in a related person transaction must recuse himself or herself from any consideration of such related person transaction.
-180-
Table of Contents
The following table sets forth information regarding the beneficial ownership of our capital stock for:
| • | each person known by us to beneficially own more than 5% of any class of our outstanding shares; |
| • | each of our named executive officers; |
| • | each of our directors and director nominees; and |
| • | all of our named executive officers, directors and director nominees as a group. |
The number of shares of our capital stock outstanding and percentage of beneficial ownership set forth below is presented after giving effect to the reorganization transactions described in “Our Structure and Reorganization” and this offering.
Each share of our Class A common stock, Class C common stock and convertible preferred stock is entitled to one vote per share. Each share of Class B common stock initially entitles its holder to five votes per share. Each share of our Class C common stock corresponds to either a Class A common unit, Class D common unit or preferred unit of Artisan Partners Holdings, and each share of Class B common stock corresponds to a Class B common unit of Artisan Partners Holdings. Following the first anniversary of this offering (unless we grant a waiver prior to that time), subject to certain restrictions, (i) each common unit will be exchangeable for one share of our Class A common stock, and upon any such exchange, the corresponding share of Class C or Class B common stock, as applicable, will be cancelled, and (ii) each preferred unit will be exchangeable for either one share of our convertible preferred stock or a number of shares of Class A common stock equal to the conversion rate as described in “Our Structure and Reorganization—Reorganization Transactions and Post-IPO Structure—Preferential Distributions to Holders of Preferred Units and Convertible Preferred Stock—Convertible Preferred Stock Conversion Rate”, and upon any such exchange, the corresponding share of Class C common stock will be cancelled. From and after the automatic conversion of our convertible preferred stock into Class A common stock, each preferred unit will be exchangeable for a number of shares of our Class A common stock equal to the conversion rate. See “Our Structure and Reorganization—Offering Transactions—Exchange Agreement”. At the option of the holder beginning one year following this offering (unless we grant a waiver prior to that time with the consent of the holders of a majority of the convertible preferred stock), each share of our convertible preferred stock will be convertible into a number of shares of our Class A common stock equal to the conversion rate. After the reorganization, the individuals and the entities listed in the table below will collectively own limited partnership units, which will correspond to the aggregate number of shares of Class C and Class B common stock reflected below. The shares of Class A common stock underlying these limited partnership units are not reflected in the table below.
-181-
Table of Contents
Beneficial ownership is determined in accordance with the rules of the SEC. These rules generally attribute beneficial ownership of securities to persons who possess sole or shared voting power or investment power with respect to such securities. Except as otherwise indicated, all persons listed below have sole voting and investment power with respect to the shares beneficially owned by them, subject to applicable community property laws. Except as otherwise indicated, the address for each stockholder listed below is c/o Artisan Partners Asset Management Inc., 875 E. Wisconsin Avenue, Suite 800, Milwaukee, Wisconsin 53202.
| Class A | Class B | Class C | Convertible Preferred |
Aggregate % of Combined Voting Power After Offering | ||||||||||||||||||||||||||||||
| No. of Shares |
% of Class |
No. of Shares |
% of Class |
No. of Shares |
% of Class |
No. of Shares |
% of Class |
|||||||||||||||||||||||||||
| 5+% Stockholders: |
||||||||||||||||||||||||||||||||||
| Artisan Investment Corporation(1) |
— | — | — | — | — | — | ||||||||||||||||||||||||||||
| H&F Brewer AIV II, L.P.(2)(3) |
— | — | — | — | ||||||||||||||||||||||||||||||
| Mark L. Yockey(4) |
— | — | — | — | — | — | ||||||||||||||||||||||||||||
| James C. Kieffer(5) |
— | — | — | — | — | — | ||||||||||||||||||||||||||||
| Directors and Named Executive Officers: |
||||||||||||||||||||||||||||||||||
| Eric R. Colson(5) |
— | — | — | — | — | — | ||||||||||||||||||||||||||||
| Charles J. Daley, Jr.(4) |
— | — | — | — | — | — | ||||||||||||||||||||||||||||
| Janet D. Olsen(4) |
— | — | — | — | — | — | ||||||||||||||||||||||||||||
| Dean J. Patenaude(4) |
— | — | — | — | — | — | ||||||||||||||||||||||||||||
| Andrew A. Ziegler(6) |
— | — | — | — | ||||||||||||||||||||||||||||||
| Matthew R. Barger |
— | — | — | — | ||||||||||||||||||||||||||||||
| Tench Coxe(7) |
— | — | — | — | ||||||||||||||||||||||||||||||
| Allen R. Thorpe |
— | — | ||||||||||||||||||||||||||||||||
| Directors, director nominees and executive officers as a group (8 persons) |
||||||||||||||||||||||||||||||||||
| * | Less than 1%. |
| (1) | AIC is owned by ZFIC, Inc., an entity that is controlled by Andrew A. Ziegler and Carlene M. Ziegler, who are married to each other. AIC and each of our employee-partners will enter into a stockholders agreement pursuant to which they will grant an irrevocable voting proxy with respect to all of the shares of our common stock they hold at the close of this offering or may acquire from us in the future to a stockholders committee consisting initially of a designee of AIC, who will initially be Mr. Ziegler, Eric R. Colson and James C. Kieffer. The AIC designee will have the sole right, in consultation with the other members of the stockholders committee as required pursuant to the terms of the stockholders agreement, to determine how to vote all shares subject to the stockholders agreement until the earliest to occur of: (i) Mr. Ziegler’s death or disability, (ii) the voluntary termination of Mr. Ziegler’s employment with us, including by reason of the scheduled expiration of his employment on the first anniversary of this offering, and (iii) 180 days after the effective date of Mr. Ziegler’s involuntary termination of employment with us. AIC will retain investment power with respect to, and a pecuniary interest in, the shares of our common stock it holds, which are the shares reflected in this row. See “Our Structure and Reorganization—Stockholders Agreement” for additional information about the stockholders agreement. |
| (2) | H&F is the general partner of H&F Capital Associates and of H&F Investors V, L.P., or H&F Investors. H&F Investors is the sole general partner of H&F Brewer AIV II, L.P. and of H&F Brewer AIV, L.P. A four-person investment committee of H&F has the sole power to vote or to direct the vote of, and to dispose or to direct the disposition of, the securities that are held by H&F Brewer AIV II, L.P., H&F Brewer AIV, L.P. and H&F Capital Associates. Each member of the investment committee of H&F disclaims beneficial ownership of such securities. The address of H&F, H&F Investors, H&F Brewer AIV, L.P., H&F Brewer AIV II, L.P. and H&F Capital Associates is c/o Hellman & Friedman LLC, One Maritime Plaza, 12th Floor, San Francisco, California 94111. |
-182-
Table of Contents
| (3) | Includes shares of Class C common stock held by H&F Capital Associates and H&F Brewer AIV, L.P. and shares of convertible preferred stock that will be issued in the H&F Corp Merger immediately prior to the consummation of this offering. |
| (4) | Pursuant to the stockholders agreement, Mr. Yockey, Mr. Daley, Ms. Olsen and Mr. Patenaude will each grant an irrevocable voting proxy with respect to all of the shares of our common stock he or she holds at the close of this offering or may acquire from us in the future to the stockholders committee as described above. Each will retain investment power with respect to, and a pecuniary interest in, the shares of our common stock he or she holds, which are the shares reflected in the row applicable to each. |
| (5) | Pursuant to the stockholders agreement, Mr. Kieffer and Mr. Colson will each grant an irrevocable voting proxy with respect to all of the shares of our common stock he holds at the close of this offering or may acquire from us in the future to the stockholders committee as described above. The stockholders committee will initially consist of Mr. Ziegler, Mr. Kieffer and Mr. Colson, with Mr. Ziegler initially possessing the sole right, in consultation with the other two members of the committee, to determine how to vote all shares subject to the stockholders agreement. Mr. Kieffer and Mr. Colson each disclaim beneficial ownership of the shares of common stock subject to the stockholders agreement, other than those shares specified above held directly by Mr. Kieffer and Mr. Colson with respect to which Mr. Kieffer and Mr. Colson, respectively, will have investment power and a pecuniary interest. |
| (6) | Includes all shares of Class B common stock and Class C common stock held by our employee-partners and AIC that are subject to the stockholders agreement. As described above, each of our employee-partners and AIC will enter into a stockholders agreement pursuant to which they will grant an irrevocable voting proxy with respect to all of the shares of our common stock they hold at the close of this offering or may acquire from us in the future to a stockholders committee consisting initially of Mr. Ziegler, Mr. Colson and Mr. Kieffer, with Mr. Ziegler initially possessing the sole right, in consultation with the other two members of the committee, to determine how to vote all shares subject to the stockholders agreement. Mr. Ziegler will neither have investment power with respect to, nor a pecuniary interest in, any of the shares subject to the stockholders agreement, other than the shares owned by AIC. See also footnote 1. |
| (7) | Includes shares of Class C common stock held by Sutter Hill Ventures and shares of Class C common stock held by Rooster Partners, L.P. Mr. Coxe shares voting and investment power over, but disclaims beneficial ownership of, all of such shares of Class C common stock except to the extent of any pecuniary interest therein. |
-183-
Table of Contents
The following description of our capital stock is a summary and is qualified in its entirety by reference to our restated certificate of incorporation and amended and restated bylaws, which are filed as exhibits to the registration statement of which this prospectus forms a part, and by the Delaware General Corporation Law, or DGCL. This description assumes the effectiveness of our restated certificate of incorporation and amended and restated bylaws, which will take effect immediately prior to the consummation of this offering.
Our authorized capital stock consists of shares of Class A common stock, par value $0.01 per share, shares of Class B common stock, par value $0.01 per share, shares of Class C common stock, par value $0.01 per share, and shares of preferred stock (including shares designated as convertible preferred stock, par value $0.01 per share). Upon the consummation of this offering, shares of Class A common stock, shares of Class B common stock, shares of Class C common stock and shares of convertible preferred stock will be outstanding. All of our issued and outstanding shares of capital stock are, and the shares of capital stock to be issued in this offering will be, validly issued, fully paid and nonassessable.
Common Stock
Class A Common Stock
Holders of our Class A common stock are entitled to one vote for each share held of record on all matters submitted to a vote of stockholders.
Holders of our Class A common stock are entitled to receive dividends (including dividends payable in shares of our Class A common stock or in rights, options, warrants or other securities convertible or exercisable into or exchangeable for shares of Class A common stock paid proportionally with respect to each outstanding share of our Class A common stock), if declared by our board of directors, out of funds legally available therefor, subject to any statutory or contractual restrictions on the payment of dividends and to any restrictions on the payment of dividends imposed by the terms of any outstanding preferred stock. In the event that we receive any distributions on preferred units of Artisan Partners Holdings held by us, the terms of our convertible preferred stock prevent us from declaring or paying any dividend on our Class A common stock until we have paid to the convertible preferred stockholders an amount per share equal to the proceeds per preferred unit of any distributions we receive on the preferred units held by us plus the cumulative amount of any prior distributions made on the preferred units held by us which have not been paid to the convertible preferred stockholders, net of taxes, if any, payable by us on (without duplication) (i) allocations of taxable income related to such distributions and (ii) the distributions themselves, in each case in respect of the preferred units held by us. The rights of the holders of Class A common stock to distributions, including upon liquidation, are subject to the H&F preference, as described under “—Preferred Stock—Convertible Preferred Stock—Preferential Distributions to Holders of Preferred Units and Convertible Preferred Stock”. If the H&F preference is terminated, upon our dissolution or liquidation or the sale of all or substantially all of our assets, after payment in full of all amounts required to be paid to creditors and to the holders of preferred stock having liquidation preferences, if any, the holders of our Class A common stock will be entitled to receive, on a pro rata basis, our remaining assets available for distribution.
Holders of our Class A common stock do not have preemptive, subscription, redemption or conversion rights.
Immediately prior to the consummation of this offering we will enter into an exchange agreement with the holders of limited partnership units of Artisan Partners Holdings. Following the first anniversary of this offering, subject to certain restrictions set forth in the exchange agreement (including those intended to ensure that Artisan Partners Holdings is not treated as a “publicly traded partnership” for U.S. federal income tax purposes), holders of Artisan Partners Holdings units (other than us) and certain permitted transferees will have the right to exchange common units (together with an equal number of shares of Class B or Class C common stock, as applicable) for shares of our Class A common stock on a one-for-one basis and to exchange preferred units (together with an equal number of shares of Class C common stock) either for shares of our convertible preferred stock on a one-for-one basis or for shares of our Class A common stock at the conversion rate plus cash in lieu of fractional shares as described in “—Convertible Preferred Stock—Convertible Preferred Stock Conversion
-184-
Table of Contents
Rate”. From and after the automatic conversion of the convertible preferred stock, each preferred unit will be exchangeable for a number of shares of our Class A common stock equal to the conversion rate. Upon any such exchange, the shares of our Class B common stock or Class C common stock, as the case may be, will be automatically cancelled. See “Our Structure and Reorganization—Offering Transactions—Exchange Agreement”.
Class B Common Stock
Initially, holders of our Class B common stock are entitled to five votes for each share held of record on all matters submitted to a vote of stockholders. If and when the holders of our Class B common stock collectively hold less than 20% of the aggregate number of outstanding shares of our common stock and our convertible preferred stock, each share of Class B common stock will entitle its holder to only one vote per share held of record on all matters submitted to a vote of stockholders. See “Our Structure and Reorganization—Stockholders Agreement” for a description of the terms of the stockholders agreement that our employee-partners, the H&F Funds and AIC will enter into immediately prior to the consummation of this offering.
Initially, our employee-partners as the holders of the Class B common units of Artisan Partners Holdings will be the holders of all of the issued and outstanding shares of Class B common stock. Upon the termination of the employment of an employee-partner, such employee-partner’s Class B common stock and the associated Class B common units will automatically be exchanged for Class C common stock and Class E common units, respectively, and we will automatically cancel each share of such employee-partner’s Class B common stock.
Holders of our Class B common stock will not have any right to receive dividends (other than dividends payable in shares of our Class B common stock or in rights, options, warrants or other securities convertible or exercisable into or exchangeable for shares of Class B common stock paid proportionally with respect to each outstanding share of our Class B common stock) or to receive a distribution upon the dissolution, liquidation or sale of all or substantially all of our assets.
Holders of our Class B common stock do not have preemptive, subscription, redemption or conversion rights.
Class C Common Stock
Holders of our Class C common stock are entitled to one vote for each share held of record on all matters submitted to a vote of stockholders.
Initially, the holders of the Class A common units and preferred units of Artisan Partners Holdings, and AIC as the holder of the Class D common units, will be the holders of all of the issued and outstanding shares of Class C common stock.
Holders of our Class C common stock will not have any right to receive dividends (other than dividends consisting of shares of our Class C common stock or in rights, options, warrants or other securities convertible or exercisable into or exchangeable for shares of our Class C common stock paid proportionally with respect to each outstanding share of our Class C common stock) or to receive a distribution upon the dissolution, liquidation or sale of all or substantially all of our assets.
Holders of our Class C common stock do not have preemptive, subscription, redemption or conversion rights.
Preferred Stock
Our restated certificate of incorporation authorizes our board of directors to establish one or more series of preferred stock. Unless required by law or by any stock exchange, the authorized shares of preferred stock will be available for issuance without further action by the stockholders. Our board of directors is authorized to divide the preferred stock into series and, with respect to each series, to fix and determine the designation, terms, preferences,
-185-
Table of Contents
limitations and relative rights thereof, including the dividend rights, conversion or exchange rights, voting rights, redemption rights and terms, liquidation preferences, sinking fund provisions and the number of shares constituting the series.
Subject to the rights of the holders of any series of preferred stock, the number of authorized shares of any series of preferred stock may be increased (but not above the total number of shares of preferred stock authorized under our restated certificate of incorporation) or decreased (but not below the number of shares thereof then outstanding) by resolution of our board of directors. We could, without stockholder approval, issue preferred stock that could impede or discourage an acquisition attempt or other transaction that some, or a majority, of our stockholders may believe is in their best interests or in which they may receive a premium for their Class A common stock over the market price of the Class A common stock.
Convertible Preferred Stock
Holders of our convertible preferred stock are entitled to one vote for each share held of record on all matters submitted to a vote of stockholders.
Initially, holders of our convertible preferred stock will be certain of the H&F holders to whom such shares are issued as partial consideration in connection with the H&F Corp Merger. Shares of convertible preferred stock will also be issued upon exchange of preferred units of Artisan Partners Holdings on a one-for-one basis.
Holders of our convertible preferred stock are entitled to receive dividends, if declared by our board of directors, out of funds legally available therefor, subject to a maximum amount, per share, equal to the proceeds per preferred unit received by Artisan Partners Asset Management, net of taxes, if any, payable by Artisan Partners Asset Management on (without duplication) (i) allocations of taxable income related to such distributions and (ii) the distributions themselves, in each case in respect of the preferred units held by us (using an assumed tax rate based on the maximum combined corporate federal, state and local income tax rate applicable to us).
Holders of our convertible preferred stock do not have preemptive, subscription or redemption rights.
Preferential Distributions to Holders of Preferred Units and Convertible Preferred Stock
In accordance with its amended and restated limited partnership agreement, taxable income and loss and distributions of profits of Artisan Partners Holdings will be allocated and made to its partners pro rata in accordance with the number of partnership units of Artisan Partners Holdings they hold, except in the case of (i) a partial capital event, (ii) dissolution of Artisan Partners Holdings (as described below) or (iii) with respect only to the limited partners of Artisan Partners Holdings, the bonus reallocation adjustments as described under “Offering Transactions—Amended and Restated Limited Partnership Agreement of Artisan Partners Holdings—Economic Rights of Partners”. We refer in this prospectus to the preferential distributions in the case of partial capital events or dissolution of Artisan Partners Holdings, together with the preference rights of the convertible preferred stock, as the H&F preference. The H&F preference will terminate if either (i) the average daily VWAP of our Class A common stock for any period of 60 consecutive trading days, beginning no earlier than the 90th day after completion of the follow-on underwritten offering we plan to conduct as soon as possible after the first anniversary of this offering (or the 15-month anniversary of this offering, if we do not conduct the follow-on offering by that date), is at least $ divided by the then-applicable conversion rate, or (ii) Artisan Partners Holdings is required to and does make a payment in settlement of the partnership CVRs described under “Our Structure and Reorganization—Offering Transactions—Contingent Value Rights”.
We will always hold a number of preferred units of Artisan Partners Holdings equal to the number of shares of convertible preferred stock outstanding. We will be entitled to any distributions (including preferential distributions) paid on the preferred units we hold. Each share of convertible preferred stock will entitle its holder
-186-
Table of Contents
to dividends equal to the proceeds per preferred unit of such distributions plus the cumulative amount of any prior distributions made on the preferred units held by us which have not been paid to the convertible preferred stockholders, net of taxes, if any, payable by us on (without duplication) (i) allocations of taxable income related to such distributions and (ii) the distributions themselves, in each case in respect of the preferred units held by us (using an assumed tax rate based on the maximum combined corporate federal, state and local income tax rate applicable to us). Until we have declared and paid a dividend, or, in the case of a liquidation, distributed an amount equal to such proceeds to the holders of our convertible preferred stock, we may not declare or pay a dividend on any other class of our capital stock, including our Class A common stock.
Partial Capital Events. A “partial capital event” means any sale, transfer, conveyance or disposition of consolidated assets of Artisan Partners Holdings for cash or other liquid consideration (other than in a transaction (i) in the ordinary course of business, (ii) that involves assets with a fair market value of less than or equal to 1% of the consolidated assets of Artisan Partners Holdings or (iii) that is part of or would result in a dissolution of Artisan Partners Holdings), or the incurrence of indebtedness by Artisan Partners Holdings or its subsidiaries, the principal purpose of which is to distribute the proceeds to the partners or equity holders thereof. A “partial capital event” shall not include any payment from proceeds of this offering or any indebtedness that is refinancing indebtedness of Artisan Partners Holdings outstanding on or prior to the closing date of this offering.
The net proceeds of any partial capital event will be distributed:
| • | first, 60% to the holders of the preferred units and 40% to the holders of all of the classes of common units and GP units, in each case in proportion to their respective capital account balances, until the amount distributed on each preferred unit in respect of all partial capital events equals $357,194,316 divided by the number of preferred units outstanding immediately after the reorganization transactions, which we refer to as the per unit preference amount; |
| • | second, in the event that any amounts were ever distributed in accordance with the preceding bullet point, 100% to the holders of all of the classes of common units and GP units, in each case in proportion to their respective capital account balances, until the cumulative amount distributed on each such unit in respect of all partial capital events since the completion of this offering (not including any distributions made in connection with the offering) equals the cumulative amount the holders of all of the classes of common units and GP units would have received from all partial capital event distributions had all such distributions been made in proportion to the respective number of partnership units held by all partners; and |
| • | third, to the holders of all classes of partnership units (including GP units) in proportion to their respective capital account balances. |
Notwithstanding the foregoing, holders of the preferred units may decline all or any portion of a preferential distribution of the net proceeds of a partial capital event.
Dissolution. The assets of Artisan Partners Holdings will be distributed upon its dissolution, after satisfaction of its debts and liabilities:
| • | first, in the event Artisan Partners Holdings has accrued and undistributed profits, to the holders of all classes of partnership units (including GP units), in each case in proportion to each partner’s respective number of units at the time the accrued and undistributed profits were earned or accrued, until Artisan Partners Holdings has distributed all such accrued and undistributed profits; |
| • | second, to the holders of the preferred units in proportion to their respective capital account balances, until the amount distributed on each preferred unit (including any preferential distributions previously made in connection with any partial capital event) equals the per unit preference amount; |
| • | third, to the holders of all of the classes of common units and GP units, in each case in proportion to their respective capital account balances, until the cumulative amount distributed on each such unit (including distributions in respect of partial capital events since the completion of this offering, not including any |
-187-
Table of Contents
| distributions made in connection with the offering) equals the cumulative amount the holders of all of the classes of common units and GP units would have received from all partial capital event and dissolution distributions had all such distributions been made in proportion to the respective number of partnership units held by all partners; and |
| • | fourth, to the holders of all of the classes of partnership units (including the GP units) in proportion to their respective capital account balances. |
Convertible Preferred Stock Conversion Rate
At the election of the holder following the first anniversary of this offering, each share of our convertible preferred stock will be convertible into a number of shares of our Class A common stock equal to the conversion rate (as described below). When the holders of convertible preferred stock are no longer entitled to preferential distributions, as described above in “—Preferential Distributions to Holders of Preferred Units and Convertible Preferred Stock”, all shares of convertible preferred stock will automatically convert into shares of our Class A common stock at the then-applicable conversion rate plus cash in lieu of fractional shares (after aggregating all shares of our Class A common stock that would otherwise be received by such holder). Upon the conversion of a share of convertible preferred stock into a share of Class A common stock or the exchange of a preferred unit for a share of a Class A common stock, Artisan Partners Holdings will issue to us a number of GP units equal to the conversion rate.
The conversion rate will equal the excess, if any, of (a) one over (b) a fraction equal to (x) the cumulative excess distributions per preferred unit (as described below) divided by (y) the average daily VWAP per share of our Class A common stock for the 60 consecutive trading days immediately preceding the conversion date. The cumulative excess distributions per preferred unit will equal the excess, if any, of (a) the cumulative amount of distributions upon partial capital events made per preferred unit over (b) the cumulative amount of distributions upon partial capital events made, on a per unit basis, to the holders of the classes of units other than the preferred units. The conversion rate will equal one when either (i) no partial capital events have occurred or (ii) when the amount distributed in respect of all partial capital events on a per unit basis equals the amount distributed per preferred unit in respect of all partial capital events.
Voting
Generally, all matters to be voted on by stockholders must be approved by a majority (or, in the case of the election of directors, by a plurality) of the votes entitled to be cast by all shares of Class A common stock, Class B common stock, Class C common stock and convertible preferred stock present in person or represented by proxy, voting together as a single class. However, as set forth below under “—Anti-Takeover Effects of Provisions of Delaware Law and Our Restated Certificate of Incorporation and Amended and Restated Bylaws—Amendments to Our Governing Documents”, certain material amendments to our restated certificate of incorporation must be approved by at least 66 2/3% of the combined voting power of all of our outstanding capital stock entitled to vote in the election of our board, voting together as a single class. In addition, amendments to our restated certificate of incorporation, including in connection with a merger, that would alter or change the powers, preferences or special rights of the Class A common stock, Class B common stock, Class C common stock or convertible preferred stock so as to affect them adversely also must be approved by a majority of the votes entitled to be cast by the holders of the shares affected by the amendment, voting as a separate class or series, as applicable. With certain exceptions, any amendment to our restated certificate of incorporation to increase or decrease the authorized shares of any class of common stock or the convertible preferred stock must be approved by a majority of the votes entitled to be cast by the holders of the shares affected by the amendment, voting as a separate class or series, as applicable.
Additionally, under our restated certificate of incorporation, if a plan of merger contains a provision that, if contained in a proposed amendment to our restated certificate of incorporation, would require a separate class or series vote by one or more classes or series of our capital stock on the proposed amendment under the DGCL or the restated certificate of incorporation, then separate class or series voting is also required on the plan of merger, whether or not we are the surviving entity in the merger.
-188-
Table of Contents
Authorized but Unissued Capital Stock
The DGCL does not generally require stockholder approval for the issuance of authorized shares. These additional shares may be used for a variety of corporate purposes, including future public offerings, to raise additional capital or to facilitate acquisitions. However, the listing requirements of the NYSE, which would apply so long as the Class A common stock remains listed on the NYSE, require stockholder approval of certain issuances equal to or exceeding 20% of the then outstanding voting power or then outstanding number of shares of Class A common stock.
One of the effects of the existence of unissued and unreserved common stock or preferred stock may be to enable our board of directors to issue shares to persons friendly to current management, which issuance could render more difficult or discourage an attempt to obtain control of our company by means of a merger, tender offer, proxy contest or otherwise, and thereby protect the continuity of our management and possibly deprive our stockholders of opportunities they may believe are in their best interests or in which they may receive a premium for their Class A common stock over the market price of the Class A common stock.
Anti-Takeover Effects of Provisions of Delaware Law and Our Restated Certificate of Incorporation and Amended and Restated Bylaws
Business combination statute
We are a Delaware corporation subject to Section 203 of the DGCL. Section 203 provides that, subject to certain exceptions specified in the law, a Delaware corporation shall not engage in any “business combination” with any “interested stockholder” for a three-year period following the time such stockholder became an interested stockholder unless:
| • | prior to such time, our board of directors approved either the business combination or the transaction that resulted in the stockholder becoming an interested stockholder; |
| • | upon consummation of the transaction that resulted in the stockholder becoming an interested stockholder, the interested stockholder owned at least 85% of our voting stock outstanding at the time the transaction commenced, excluding certain shares as specified in Section 203; or |
| • | at or subsequent to such time the business combination is approved by our board of directors and authorized at a meeting of stockholders by the affirmative vote of at least 66 2/3% of the outstanding voting stock that is not owned by the interested stockholder. |
Generally, a “business combination” includes a merger, asset or stock sale or other transaction resulting in a financial benefit to the interested stockholder. Subject to certain exceptions, an “interested stockholder” is a person who, together with that person’s affiliates and associates, owns, or within the previous three years did own, 15% or more of our voting stock.
Under certain circumstances, Section 203 makes it more difficult for a person who would be an “interested stockholder” to effect various business combinations with a corporation for a three-year period. The provisions of Section 203 may encourage companies interested in acquiring our company to negotiate in advance with our board of directors because the stockholder approval requirement described above would be avoided if our board of directors approves either the business combination or the transaction that results in the stockholder becoming an interested stockholder. These provisions also may make it more difficult to accomplish transactions that stockholders may otherwise deem to be in their best interests.
Corporate Opportunities
Our restated certificate of incorporation provides that, to the fullest extent permitted by applicable law, H&F, Sutter Hill Ventures and their respective affiliates have no obligation to offer us an opportunity to participate in business opportunities presented to H&F, Sutter Hill Ventures or their respective affiliates even if the opportunity is one that we might reasonably have pursued (and therefore may be free to compete with us in
-189-
Table of Contents
the same business or similar business), and we renounce and waive and agree not to assert any claim for breach of any fiduciary or other duty relating to any such opportunity against H&F or Sutter Hill Ventures or their respective affiliates by reason of any such activities unless, in the case of any person who is a director or officer of our company, such opportunity is expressly offered to such director or officer in writing solely in his or her capacity as an officer or director of our company. Stockholders will be deemed to have notice of and consented to this provision of our restated certificate of incorporation.
Requirements for Advance Notification of Stockholder Nominations and Proposals
Our amended and restated bylaws establish advance notice procedures with respect to stockholder proposals and nomination of candidates for election as directors. These procedures provide that notice of such stockholder approval must be timely given in writing to our secretary prior to the meeting at which the action is to be taken. Generally, to be timely, notice must be received at our principal executive offices not less than 90 days nor more than 120 days prior to the first anniversary date of the annual meeting for the preceding year. The notice must contain certain information required to be provided by the amended and restated bylaws.
Limits on Written Consents
Our restated certificate of incorporation provides that any action required or permitted to be taken by the stockholders must be effected at a duly called annual or special meeting of stockholders or may be effected by a unanimous consent in writing in lieu of a meeting of such stockholders, subject to the rights of the holders of our Class B and Class C common stock or our preferred stock to act by written consent in connection with actions that require their vote as a separate class.
Limits on Special Meetings
Subject to the rights of the holders of any series of preferred stock, special meetings of the stockholders may be called only by (i) our board of directors, (ii) our Executive Chairman, or (iii) our Chief Executive Officer.
Amendments to Our Governing Documents
Generally, the amendment of our restated certificate of incorporation requires approval by our board of directors and a majority vote of stockholders; however, certain material amendments (including amendments with respect to provisions governing board composition, actions by written consent and special meetings) require the approval of at least 66 2/3% of the votes entitled to be cast by the outstanding capital stock in the elections of our board. Any amendment to our amended and restated bylaws requires the approval of either a majority of our board of directors or holders of at least 66 2/3% of the votes entitled to be cast by the outstanding capital stock in the election of our board. Such a super majority vote shall be required for the board to amend the bylaws to increase the number of directors and, prior to December 31, 2016, no such amendment shall increase the number of directors to more than nine. In addition, amendments to our restated certificate of incorporation that would alter or change the powers, preferences or special rights of the Class A common stock, Class B common stock, Class C common stock or convertible preferred stock so as to affect them adversely also must be approved by a majority of the votes entitled to be cast by the holders of the shares affected by the amendment, voting as a separate class or series, as applicable. With certain exceptions, any amendment to our restated certificate of incorporation to increase or decrease the authorized shares of any class of common stock or the convertible preferred stock must be approved by a majority of the votes entitled to be cast by the holders of the shares affected by the amendment, voting as a separate class or series, as applicable.
Additionally, under our restated certificate of incorporation, if a plan of merger contains a provision that, if contained in a proposed amendment to our restated certificate of incorporation, would require a separate class or series vote by one or more classes or series of our capital stock on the proposed amendment under the DGCL or the restated certificate of incorporation, then separate class or series voting is also required on the plan of merger, whether or not we are the surviving entity in the merger.
-190-
Table of Contents
Amended and Restated Limited Partnership Agreement of Artisan Partners Holdings LP
We will depend upon distributions from Artisan Partners Holdings to fund any dividends or other distributions. For a description of the material terms of the amended and restated limited partnership agreement of Artisan Partners Holdings, see “Our Structure and Reorganization—Offering Transactions—Amended and Restated Limited Partnership Agreement of Artisan Partners Holdings”.
Listing
We have applied to list our Class A common stock on the NYSE under the symbol “APAM”.
Transfer Agent and Registrar
The transfer agent and registrar for our Class A common stock is .
-191-
Table of Contents
SHARES ELIGIBLE FOR FUTURE SALE
Prior to this offering, there has been no market for our Class A common stock. Future sales of substantial amounts of our Class A common stock in the public market, or the perception that such sales may occur, could adversely affect the prevailing market price of our Class A common stock.
Upon the consummation of this offering, we will have shares of our Class A common stock and shares of our convertible preferred stock outstanding. At the election of the holder following the first anniversary of this offering (unless we grant a waiver prior to that time with the consent of the holders of a majority of the convertible preferred stock), each share of our convertible preferred stock is convertible into a number of shares of our Class A common stock equal to the conversion rate as described in “Our Structure and Reorganization—Reorganization Transactions and Post-IPO Structure—Preferential Distributions to Holders of Preferred Units and Convertible Preferred Stock—Convertible Preferred Stock Conversion Rate”. When the holders of convertible preferred stock are no longer entitled to preferential distributions, as described under “Our Structure and Reorganization—Reorganization Transactions and Post-IPO Structure—Preferential Distributions to Holders of Preferred Units and Convertible Preferred Stock”, all shares of convertible preferred stock will automatically convert into shares of our Class A common stock at the conversion rate plus cash in lieu of fractional shares. In addition, common units and preferred units of Artisan Partners Holdings will be outstanding upon the consummation of this offering. Unless we were to grant a waiver to permit earlier exchanges, following the first anniversary of this offering, subject to certain restrictions, holders of Artisan Partners Holdings units (other than us) and certain permitted transferees will have the right to exchange common units (together with an equal number of shares of corresponding Class B or Class C common stock, as applicable) for shares of our Class A common stock on a one-for-one basis and to exchange preferred units (together with an equal number of corresponding shares of Class C common stock) either for shares of our convertible preferred stock on a one-for-one basis or for shares of our Class A common stock at the conversion rate as described in “Our Structure and Reorganization—Reorganization Transactions and Post-IPO Structure—Preferential Distributions to Holders of Preferred Units and Convertible Preferred Stock—Convertible Preferred Stock Conversion Rate”. Following the automatic conversion of our convertible stock into Class A common stock, each preferred unit will be exchangeable only for Class A common stock at the conversion rate. See “Our Structure and Reorganization—Offering Transactions—Exchange Agreement”. These shares of our Class A common stock issued upon exchange of units or upon conversion of shares of our convertible preferred stock would be “restricted securities”, as defined in Rule 144. However, we will enter into a resale and registration rights agreement with the holders of the limited partnership units of Artisan Partners Holdings and our convertible preferred stock that will require us to register under the Securities Act the issuance of these shares of Class A common stock. See “Our Structure and Reorganization—Resale and Registration Rights Agreement—Restrictions on Sale”.
Of the shares of common stock outstanding following this offering, shares of Class A common stock (or shares of Class A common stock if the underwriters exercise their option to purchase additional shares) sold in this offering will be freely tradable without restriction or further registration under the Securities Act. Any shares of Class A common stock held by our employees or our “affiliates”, as defined in Rule 144 under the Securities Act, which would be subject to the limitations and restrictions described below under “—Rule 144”. As described above, holders of our convertible preferred stock and the partnership units of Artisan Partners Holdings will not have the right to convert into or exchange for shares of our Class A common stock until the first anniversary of this offering.
Subject to underwriter cutbacks and assuming that the then-applicable conversion rate is one, shares of our Class A common stock issuable upon exchange of limited partnership units of Artisan Partners Holdings or upon conversion of shares of our convertible preferred stock may be sold as part of the follow-on underwritten offering we plan to conduct as soon as possible after the first anniversary of this offering, pursuant to the resale and registration rights agreement. Such shares will be comprised of the following:
| • | shares of our Class A common stock received upon exchange of Class D common units that AIC may sell; |
-192-
Table of Contents
| • | shares of our Class A common stock received upon exchange of preferred units or conversion of shares of our convertible preferred stock that the H&F holders may sell, assuming that the then-applicable conversion rate is one; |
| • | shares of our Class A common stock received upon exchange of Class A common units that holders of our Class A common units may sell; and |
| • | shares of our Class A common stock received upon exchange of Class B common units that employee-partners may sell, assuming that all employee-partners remain employed by us through the date of the follow-on offering. |
Following (i) the 15-month anniversary of this offering or (ii) the expiration of any lock-up period in connection with the follow-on offering, if such follow-on offering is completed prior to the 15-month anniversary, all of such shares may be sold in any manner of sale permitted under the securities laws. AIC and the H&F holders will have the right to use the shelf registration statement to sell their shares of Class A common stock from time to time.
The number of shares of our Class A common stock listed above do not include any additional shares that (i) holders may sell in order to cover taxes due upon exchange of limited partnership units under certain circumstances or (ii) the estate of any deceased holder or the beneficiaries thereof may sell to cover applicable estate and inheritance taxes.
Shares of our Class A common stock issuable upon exchange of common units held by employee-partners and former employee-partners are subject to restrictions on transfer as described under “Our Structure and Reorganization—Resale and Registration Rights Agreement—Restrictions on Sale” and “Management—2011 Omnibus Incentive Compensation Plan”.
Additionally, the original H&F holders will have the right to distribute preferred units, shares of convertible preferred stock or shares of Class A common stock to any one or more of their partners or stockholders, as applicable, at any time following (i) the 15-month anniversary of this offering or (ii) the expiration of any lock-up period in connection with the follow-on offering, if such follow-on offering is completed prior to the 15-month anniversary. Similarly, following the same applicable time period, Sutter Hill Ventures and Frog & Peach LLC may distribute their Class A common units or Class A common stock received in exchange for Class A common units to their partners or members, respectively. The transferees in any such distribution by the original H&F holders, Sutter Hill Ventures or Frog & Peach LLC will not be subject to contractual resale restrictions and will not have any rights under the registration rights agreements.
We may at any time waive any restrictions (i) on exchange of limited partnership units of Artisan Partners Holdings for our capital stock, or (ii) on sale of our Class A common stock.
Rule 144
In general, under Rule 144 as currently in effect, beginning 90 days after the completion of this offering, our affiliates who own shares for at least six months or own shares purchased in the open market are entitled to sell these shares as follows. Within any three-month period, each person may sell a number of shares that does not exceed the greater of 1% of our then-outstanding shares of Class A common stock, which will equal approximately shares immediately after this offering, or the average weekly trading volume of our Class A common stock on the NYSE during the four calendar weeks preceding the filing of a notice of the sale on Form 144. Sales under Rule 144 by affiliates will also be subject to manner of sale provisions, notice requirements and the availability of current public information about us.
A person who is not deemed to have been one of our affiliates at any time during the three months preceding a sale, and who owns shares of Class A common stock within the definition of “restricted securities” under Rule
-193-
Table of Contents
144 that were acquired from us, or any affiliate, at least six months previously, would, beginning 90 days after the completion of this offering, also be entitled to sell shares under Rule 144. Such sales would be permitted without regard to the volume limitations, manner of sale provisions or notice requirements described above and, after one year, without any limits, including the public information requirement.
Lock-up Agreements
We and our officers, directors and certain of our stockholders (other than our public stockholders) will agree with the underwriters not to dispose of or hedge any shares of our Class A common stock, or securities convertible into or exchangeable for our Class A common stock, subject to certain exceptions, for the 180-day period following the date of this prospectus, without the prior consent of Citigroup Global Markets Inc. and Goldman, Sachs & Co. See “Underwriting; Conflicts of Interest”.
Equity Awards
Upon completion of this offering, we intend to file a registration statement on Form S-8 under the Securities Act covering all shares of our Class A common stock issued and issuable pursuant to the 2013 Omnibus Incentive Compensation Plan, as well as all shares of our Class A common stock issuable upon exchange of common units reserved for issuance under the 2013 Omnibus Incentive Compensation Plan. Shares of our Class A common stock registered under that registration statement will be available for sale in the open market, subject to Rule 144 volume limitations applicable to affiliates, vesting restrictions with us or the contractual restrictions described under “Management—2013 Omnibus Incentive Compensation Plan”.
Registration Rights Agreement
As discussed above, as part of the reorganization transactions, we will enter into a resale and registration rights agreement with each of the holders of the limited partnership units of Artisan Partners Holdings and each of the holders of our convertible preferred stock pursuant to which the shares of our Class A common stock issued upon exchange or conversion of their limited partnership units or convertible preferred stock, as applicable, will be eligible for resale, subject to the resale timing and manner limitations described under “Our Structure and Reorganization—Offering Transactions—Resale and Registration Rights Agreement—Restrictions on Sale”. The restrictions on resale imposed by the resale and registration rights agreement will be in addition to restrictions on resale imposed by federal securities laws and regulations, including Rule 144, which is described above.
-194-
Table of Contents
MATERIAL U.S. FEDERAL TAX CONSIDERATIONS FOR NON-U.S. HOLDERS OF
OUR CLASS A COMMON STOCK
This section summarizes the material United States federal income and estate tax consequences of the ownership and disposition of Class A common stock by a non-U.S. holder. It applies to you only if you acquire your Class A common stock in this offering and you hold the Class A common stock as a capital asset for U.S. federal income tax purposes. You are a non-U.S. holder if you are, for United States federal income tax purposes:
| • | a nonresident alien individual, |
| • | a foreign corporation, or |
| • | an estate or trust that in either case is not subject to United States federal income tax on a net income basis on income or gain from the Class A common stock. |
This section does not consider the specific facts and circumstances that may be relevant to a particular non-U.S. holder and does not address the treatment of a non-U.S. holder under the laws of any state, local or foreign taxing jurisdiction. In addition, it does not represent a detailed description of the United States federal income tax consequences applicable to you if you are subject to special treatment under the United States federal income tax laws (including if you are a United States expatriate, “controlled foreign corporation”, “passive foreign investment company” or a partnership or other pass-through entity for United States federal income tax purposes). This section is based on the tax laws of the United States, including the Internal Revenue Code, as amended, or the Code, existing and proposed regulations, and administrative and judicial interpretations, all as currently in effect. These laws are subject to change, possibly on a retroactive basis.
If a partnership holds the Class A common stock, the United States federal income tax treatment of a partner will generally depend on the status of the partner and the tax treatment of the partnership. A partner in a partnership holding the Class A common stock should consult its tax adviser with regard to the United States federal income tax treatment of an investment in the common stock.
You should consult a tax adviser regarding the United States federal tax consequences of acquiring, holding and disposing of Class A common stock in your particular circumstances, as well as any tax consequences that may arise under the laws of any state, local or foreign taxing jurisdiction.
Dividends
Except as described below, if you are a non-U.S. holder of Class A common stock, dividends paid to you are subject to withholding of United States federal income tax at a 30% rate or at a lower rate if you are eligible for the benefits of an income tax treaty that provides for a lower rate. Even if you are eligible for a lower treaty rate, we and other payors will generally be required to withhold at a 30% rate (rather than the lower treaty rate) on dividend payments to you, unless you have furnished to us or another payor:
| • | a valid Internal Revenue Service Form W-8BEN or an acceptable substitute form upon which you certify, under penalties of perjury, your status as a non-United States person and your entitlement to the lower treaty rate with respect to such payments, or |
| • | in the case of payments made outside the United States to an offshore account (generally, an account maintained by you at an office or branch of a bank or other financial institution at any location outside the United States), other documentary evidence establishing your entitlement to the lower treaty rate in accordance with U.S. Treasury regulations. |
If you are eligible for a reduced rate of United States withholding tax under a tax treaty, you may obtain a refund of any amounts withheld in excess of that rate by filing a refund claim with the United States Internal Revenue Service.
-195-
Table of Contents
If dividends paid to you are “effectively connected” with your conduct of a trade or business within the United States, and, if required by a tax treaty, the dividends are attributable to a permanent establishment that you maintain in the United States, we and other payors generally are not required to withhold tax from the dividends, provided that you have furnished to us or another payor a valid Internal Revenue Service Form W-8ECI or an acceptable substitute form upon which you represent, under penalties of perjury, that:
| • | you are a non-United States person, and |
| • | the dividends are effectively connected with your conduct of a trade or business within the United States and are includible in your gross income. |
“Effectively connected” dividends are taxed at rates applicable to United States citizens, resident aliens and domestic United States corporations.
If you are a corporate non-U.S. holder, “effectively connected” dividends that you receive may, under certain circumstances, be subject to an additional “branch profits tax” at a 30% rate or at a lower rate if you are eligible for the benefits of an income tax treaty that provides for a lower rate.
Gain on Disposition of Common Stock
If you are a non-U.S. holder, you generally will not be subject to United States federal income tax on gain that you recognize on a disposition of Class A common stock unless:
| • | the gain is “effectively connected” with your conduct of a trade or business in the United States, and the gain is attributable to a permanent establishment that you maintain in the United States, if that is required by an applicable income tax treaty as a condition for subjecting you to United States taxation on a net income basis, |
| • | you are an individual, you hold the Class A common stock as a capital asset, you are present in the United States for 183 or more days in the taxable year of the sale and certain other conditions exist, or |
| • | we are or have been a United States real property holding corporation for federal income tax purposes and you held, directly or indirectly, at any time during the five-year period ending on the date of disposition, more than 5% of the Class A common stock and you are not eligible for any treaty exemption. |
If you are a non-U.S. holder and the gain from the disposition of the Class A common stock is effectively connected with your conduct of a trade or business in the United States (and the gain is attributable to a permanent establishment that you maintain in the United States, if that is required by an applicable income tax treaty as a condition for subjecting you to United States taxation on a net income basis), you will be subject to tax on the net gain derived from the sale at rates applicable to United States citizens, resident aliens and domestic United States corporations. If you are a corporate non-U.S. holder, “effectively connected” gains that you recognize may also, under certain circumstances, be subject to an additional “branch profits tax” at a 30% rate or at a lower rate if you are eligible for the benefits of an income tax treaty that provides for a lower rate. If you are an individual non-U.S. holder described in the second bullet point immediately above, you will be subject to a flat 30% tax or a lower rate if you are eligible for the benefits of an income tax treaty that provides for a lower rate, on the gain derived from the sale, which may be offset by United States source capital losses, even though you are not considered a resident of the United States.
We have not been, are not and do not anticipate becoming a United States real property holding corporation for United States federal income tax purposes.
Federal Estate Taxes
Class A common stock held by a non-U.S. holder at the time of death will be included in the holder’s gross estate for United States federal estate tax purposes, unless an applicable estate tax treaty provides otherwise.
-196-
Table of Contents
Backup Withholding and Information Reporting
In general (except as described below), backup withholding and information reporting will not apply to a distribution of dividends on the Class A common stock paid to you or to proceeds from the disposition of the Class A common stock by you, in each case, if you certify under penalties of perjury that you are a non-United States person, and neither we nor our paying agent (or other payor) have actual knowledge or reason to know to the contrary. In general, if the Class A common stock is not held through a qualified intermediary, the amount of dividends, the name and address of the beneficial owner and the amount, if any, of tax withheld may be reported to the Internal Revenue Service.
Any amounts withheld under the backup withholding rules will generally be allowed as a credit against your United States federal income tax liability or refunded, provided the required information is timely furnished to the Internal Revenue Service.
Withholdable Payments to Foreign Financial Entities and Other Foreign Entities
A 30% withholding tax will be imposed on certain payments to certain foreign financial institutions, investment funds and other non-U.S. persons that fail to comply with information reporting requirements in respect of their direct and indirect U.S. stockholders and/or U.S. accountholders. Such payments will include U.S.-source dividends and the gross proceeds from the sale or other disposition of stock that can produce U.S.-source dividends. Under administrative guidance and proposed regulations, withholding would only be made to payments of dividends made on or after January 1, 2014, and to payments of gross proceeds from a sale or other disposition of our Class A common stock occurring on or after January 1, 2017.
-197-
Table of Contents
UNDERWRITING; CONFLICTS OF INTEREST
Artisan Partners Asset Management and the underwriters named below have entered into an underwriting agreement with respect to the shares of Class A common stock being offered. Subject to certain conditions, each underwriter has severally agreed to purchase the number of shares indicated in the following table. Citigroup Global Markets Inc. and Goldman, Sachs & Co. are acting as joint book-running managers of this offering and are acting as the representatives of the underwriters.
| Underwriters |
Number of Shares of Class A Common Stock | |
| Citigroup Global Markets Inc. |
||
| Goldman, Sachs & Co. |
||
| Merrill Lynch, Pierce, Fenner & Smith Incorporated |
||
| Morgan Stanley & Co. Incorporated |
||
| Scotia Capital (USA) Inc. |
||
| Total |
The underwriters are committed to take and pay for all of the shares being offered, if any are taken, other than the shares covered by the option described below unless and until this option is exercised.
If the underwriters sell more shares than the total number set forth in the table above, the underwriters have an option to buy up to an additional shares from us. They may exercise that option for 30 days. If any shares are purchased pursuant to this option, the underwriters will severally purchase shares in approximately the same proportion as set forth in the table above.
The following table shows the per share and total underwriting discounts and commissions to be paid to the underwriters by Artisan Partners Asset Management. Such amounts are shown assuming both no exercise and full exercise of the underwriters’ option to purchase additional shares.
| No Exercise | Full Exercise | |||||||
| Per Share |
$ | $ | ||||||
| Total |
$ | $ | ||||||
Shares sold by the underwriters to the public will initially be offered at the initial public offering price set forth on the cover of this prospectus. Any shares sold by the underwriters to securities dealers may be sold at a discount of up to $ per share from the initial public offering price. If all the shares are not sold at the initial public offering price, the representatives may change the offering price and the other selling terms. The offering of the shares by the underwriters is subject to receipt and acceptance and subject to the underwriters’ right to reject any order in whole or in part.
Artisan Partners Asset Management, its officers and directors and certain of its other stockholders have agreed with the underwriters, subject to certain exceptions, not to dispose of or hedge any of their Class A common stock or securities convertible into or exchangeable for shares of Class A common stock during the period from the date of this prospectus continuing through the date 180 days after the date of this prospectus, except with the prior written consent of Citigroup Global Markets Inc. and Goldman, Sachs & Co. This agreement does not apply to any existing employee benefit plans and is subject to certain exceptions. See “Shares Eligible for Future Sale” for a discussion of certain transfer restrictions.
Prior to this offering, there has been no public market for the shares. The initial public offering price will be negotiated among Artisan Partners Asset Management and the representatives. Among the factors to be considered in determining the initial public offering price of the shares, in addition to prevailing market conditions, will be Artisan Partners Asset Management’s historical performance, estimates of the business
-198-
Table of Contents
potential and earnings prospects of Artisan Partners Asset Management, an assessment of Artisan Partners Asset Management’s management and the consideration of the above factors in relation to market valuation of companies in related businesses.
Artisan Partners Asset Management has applied to list the common stock on the NYSE under the symbol “APAM”. In order to meet one of the requirements for listing the Class A common stock on the NYSE, the underwriters have undertaken to sell lots of 100 or more shares to a minimum of 400 U.S. beneficial holders.
In connection with this offering, the underwriters may purchase and sell shares of Class A common stock in the open market. These transactions may include short sales, stabilizing transactions and purchases to cover positions created by short sales. Short sales involve the sale by the underwriters of a greater number of shares than they are required to purchase in this offering. “Covered” short sales are sales made in an amount not greater than the underwriters’ option to purchase additional shares from Artisan Partners Asset Management in this offering. The underwriters may close out any covered short position by either exercising their option to purchase additional shares or purchasing shares in the open market. In determining the source of shares to close out the covered short position, the underwriters will consider, among other things, the price of shares available for purchase in the open market as compared to the price at which they may purchase additional shares pursuant to the option granted to them. “Naked” short sales are any sales in excess of such option. The underwriters must close out any naked short position by purchasing shares in the open market. A naked short position is more likely to be created if the underwriters are concerned that there may be downward pressure on the price of the Class A common stock in the open market after pricing that could adversely affect investors who purchase in this offering. Stabilizing transactions consist of various bids for or purchases of Class A common stock made by the underwriters in the open market prior to the completion of this offering.
The underwriters may also impose a penalty bid. This occurs when a particular underwriter repays to the underwriters a portion of the underwriting discount received by it because the representatives have repurchased shares sold by or for the account of such underwriter in stabilizing or short covering transactions.
Purchases to cover a short position and stabilizing transactions, as well as other purchases by the underwriters for their own accounts, may have the effect of preventing or retarding a decline in the market price of the Class A common stock, and together with the imposition of the penalty bid, may stabilize, maintain or otherwise affect the market price of the Class A common stock. As a result, the price of the Class A common stock may be higher than the price that otherwise might exist in the open market. If these activities are commenced, they may be discontinued at any time. These transactions may be effected on the NYSE, in the over-the-counter market or otherwise.
The underwriters do not expect sales to discretionary accounts that they or their affiliates manage to exceed five percent of the total number of shares offered.
Artisan Partners Asset Management estimates that the total expense of this offering, excluding underwriting discounts and commissions, will be approximately $ .
Artisan Partners Asset Management has agreed to indemnify the several underwriters against certain liabilities, including liabilities under the Securities Act of 1933, as amended.
The underwriters and their respective affiliates are full service financial institutions engaged in various activities, which may include securities trading, commercial and investment banking, financial advisory, investment management, investment research, principal investment, hedging, financing and brokerage activities. Certain of the underwriters and their respective affiliates have, from time to time, performed, and may in the future perform, various financial advisory and investment banking services for Artisan Partners Asset Management and its affiliates, for which they received or will receive customary fees and expenses. Under our revolving credit agreement, Citigroup Global Markets Inc. is a lead arranger and bookrunner, and Citibank, N.A., an affiliate of Citigroup Global Markets Inc., is administrative agent.
-199-
Table of Contents
In the ordinary course of their various business activities, the underwriters and their respective affiliates may make or hold a broad array of investments and actively trade debt and equity securities (or related derivative securities) and financial instruments (including bank loans) for their own account and for the accounts of their customers and such investment and securities activities may involve securities and/or instruments of the issuer. The underwriters and their respective affiliates also may make investment recommendations and/or publish or express independent research views in respect of such securities or instruments and may at any time hold, or recommend to clients that they acquire, long and/or short positions in such securities and instruments of Artisan Partners Asset Management.
Conflicts of Interest
An affiliate of Citigroup Global Markets Inc., an underwriter in this offering, is the administrative agent and a lender under our revolving credit agreement and may receive more than 5% of the net proceeds of this offering in connection with the repayment of all or a portion of the then-outstanding loans under our revolving credit agreement. See “Use of Proceeds”. Accordingly, this offering is being made in compliance with the requirements of FINRA Rule 5121. In accordance with this rule, has assumed the responsibilities of acting as a qualified independent underwriter. In its role as qualified independent underwriter, has participated in due diligence and the preparation of this prospectus and the registration statement of which this prospectus is a part. will not receive any additional fees for serving as a qualified independent underwriter in connection with this offering. Citigroup Global Markets Inc. will not confirm sales of the shares to any account over which it exercises discretionary authority without the prior written approval of the customer.
Member States of the European Economic Area
In relation to each Member State of the European Economic Area that has implemented the Prospectus Directive (each, a relevant Member State), with effect from and including the date on which the Prospectus Directive is implemented in that relevant Member State (the relevant implementation date), an offer of shares described in this prospectus may not be made to the public in that relevant Member State prior to the publication of a prospectus in relation to the shares that has been approved by the competent authority in that relevant Member State or, where appropriate, approved in another relevant Member State and notified to the competent authority in that relevant Member State, all in accordance with the Prospectus Directive, except that, with effect from and including the relevant implementation date, an offer of securities may be offered to the public in that relevant Member State at any time:
| a) | to any legal entity that is authorized or regulated to operate in the financial markets or, if not so authorized or regulated, whose corporate purpose is solely to invest in securities; |
| b) | to fewer than 100 or, if that Member State has implemented the relevant provision of the 2010 PD Amending Directive, 150 natural or legal persons (other than “qualified investors” as defined below) subject to obtaining the prior consent of the representative; or |
| c) | in any other circumstances that do not require the publication of a prospectus pursuant to Article 3 of the Prospectus Directive. |
provided that no such offer of securities shall require us or any underwriter to publish a prospectus pursuant to Article 3 of the Prospectus Directive.
Each purchaser of shares described in this prospectus located within a relevant Member State will be deemed to have represented, acknowledged and agreed that it is a “qualified investor” within the meaning of Article 2(1)(e) of the Prospectus Directive.
For the purposes of the above, the expression an “offer of securities to the public” in relation to any securities in any Member State means the communication in any form and by any means of sufficient
-200-
Table of Contents
information on the terms of the offer and the securities to be offered so as to enable an investor to decide to purchase or subscribe for the securities, as the same may be varied in that Member State by any measure implementing the Prospectus Directive in that Member State (and amendments thereto, including the 2010 PD Amending Directive, to the extent implemented in that Member State), and the expression “Prospectus Directive” means Directive 2003/71/EC and includes any relevant implementing measure in that Member State, and the expression “2010 PD Amending Directive” means Directive 2010/73/EU.
Artisan Partners Asset Management has not authorized and does not authorize the making of any offer of shares through any financial intermediary on its behalf, other than offers made by the underwriters with a view to the final placement of the shares as contemplated in this prospectus. Accordingly, no purchaser of the shares, other than the underwriters, is authorized to make any further offer of the shares on behalf of the sellers or the underwriters.
Dubai International Financial Centre
This prospectus relates to an Exempt Offer in accordance with the Offered Securities Rules of the Dubai Financial Services Authority, or DFSA. This prospectus is intended for distribution only to persons of a type specified in the Offered Securities Rules of the DFSA. It must not be delivered to, or relied on by, any other person. The DFSA has no responsibility for reviewing or verifying any documents in connection with Exempt Offers. The DFSA has not approved this prospectus nor taken steps to verify the information set forth herein and has no responsibility for the prospectus. The securities to which this prospectus relates may be illiquid and/or subject to restrictions on their resale. Prospective purchasers of the securities offered should conduct their own due diligence on the securities. If you do not understand the contents of this prospectus you should consult an authorized financial advisor.
Hong Kong
The shares may not be offered or sold by means of any document other than (i) in circumstances which do not constitute an offer to the public within the meaning of the Companies Ordinance (Cap.32, Laws of Hong Kong), (ii) to “professional investors” within the meaning of the Securities and Futures Ordinance (Cap.571, Laws of Hong Kong) and any rules made thereunder, or (iii) in other circumstances which do not result in the document being a “prospectus” within the meaning of the Companies Ordinance (Cap.32, Laws of Hong Kong), and no advertisement, invitation or document relating to the shares may be issued or may be in the possession of any person for the purpose of issue (in each case whether in Hong Kong or elsewhere), which is directed at, or the contents of which are likely to be accessed or read by, the public in Hong Kong (except if permitted to do so under the laws of Hong Kong) other than with respect to shares which are or are intended to be disposed of only to persons outside Hong Kong or only to “professional investors” within the meaning of the Securities and Futures Ordinance (Cap. 571, Laws of Hong Kong) and any rules made thereunder.
Japan
The shares have not been and will not be registered under the Financial Instruments and Exchange Law of Japan, or the Financial Instruments and Exchange Law, and each underwriter has agreed that it will not offer or sell any shares, directly or indirectly, in Japan or to, or for the benefit of, any resident of Japan (which term as used herein means any person resident in Japan, including any corporation or other entity organized under the laws of Japan), or to others for re-offering or resale, directly or indirectly, in Japan or to a resident of Japan, except registration requirements of, and otherwise in compliance with, the Financial Instruments and Exchange Law and any other applicable laws, regulations and ministerial guidelines of Japan.
Singapore
This prospectus has not been registered as a prospectus with the Monetary Authority of Singapore. Accordingly, this prospectus and any other document or material in connection with the offer or sale, or invitation for subscription or purchase, of the shares may not be circulated or distributed, nor may the shares be offered or sold, or be made the subject of an invitation for subscription or purchase, whether directly or
-201-
Table of Contents
indirectly, to persons in Singapore other than (i) to an institutional investor under Section 274 of the Securities and Futures Act, Chapter 289 of Singapore, or the SFA, (ii) to a relevant person, or any person pursuant to Section 275(1A), and in accordance with the conditions, specified in Section 275 of the SFA or (iii) otherwise pursuant to, and in accordance with the conditions of, any other applicable provision of the SFA.
Where the shares are subscribed or purchased under Section 275 by a relevant person who is: (a) a corporation (which is not an accredited investor) the sole business of which is to hold investments and the entire share capital of which is owned by one or more individuals, each of whom is an accredited investor; or (b) a trust (where the trustee is not an accredited investor) whose sole purpose is to hold investments and each beneficiary is an accredited investor, shares, debentures and units of shares and debentures of that corporation or the beneficiaries’ rights and interest in that trust shall not be transferable for six months after that corporation or that trust has acquired the shares under Section 275 except: (1) to an institutional investor under Section 274 of the SFA or to a relevant person, or any person pursuant to Section 275(1A), and in accordance with the conditions, specified in Section 275 of the SFA; (2) where no consideration is given for the transfer; or (3) by operation of law.
Switzerland
The shares may not be publicly offered in Switzerland and will not be listed on the SIX Swiss Exchange, or SIX, or on any other stock exchange or regulated trading facility in Switzerland. This document has been prepared without regard to the disclosure standards for issuance prospectuses under art. 652a or art. 1156 of the Swiss Code of Obligations or the disclosure standards for listing prospectuses under art. 27 ff. of the SIX Listing Rules or the listing rules of any other stock exchange or regulated trading facility in Switzerland. Neither this document nor any other offering or marketing material relating to the shares or the offering may be publicly distributed or otherwise made publicly available in Switzerland.
Neither this document nor any other offering or marketing material relating to the offering, the issuer or the shares have been or will be filed with or approved by any Swiss regulatory authority. In particular, this document will not be filed with, and the offer of shares will not be supervised by, the Swiss Financial Market Supervisory Authority FINMA, and the offer of shares has not been and will not be authorized under the Swiss Federal Act on Collective Investment Schemes, or CISA. The investor protection afforded to acquirers of interests in collective investment schemes under CISA does not extend to acquirers of shares.
United Kingdom
This prospectus is only being distributed to, and is only directed at, persons in the United Kingdom that are qualified investors within the meaning of Article 2(1)(e) of the Prospectus Directive that are also (i) investment professionals falling within Article 19(5) of the Financial Services and Markets Act 2000 (Financial Promotion) Order 2005, or the Order, or (ii) high net worth entities, and other persons to whom it may lawfully be communicated, falling within Article 49(2)(a) to (d) of the Order (each such person being referred to as a “relevant person”).
An invitation or inducement to engage in investment activity (within the meaning of Section 21 of the Financial Services and Markets Act 2000, or FSMA) in connection with the issue or sale of any shares which are the subject of the offering contemplated by this prospectus will only be communicated or caused to be communicated in circumstances in which Section 21(1) of FSMA does not apply to us.
This prospectus and its contents are confidential and should not be distributed, published or reproduced (in whole or in part) or disclosed by recipients to any other persons in the United Kingdom. Any person in the United Kingdom that is not a relevant person should not act or rely on this document or any of its contents.
-202-
Table of Contents
VALIDITY OF CLASS A COMMON STOCK
The validity of the issuance of the shares of Class A common stock offered hereby will be passed upon for Artisan Partners Asset Management by Sullivan & Cromwell LLP, New York, New York and for the underwriters by Simpson Thacher & Bartlett LLP, New York, New York.
EXPERTS
The (i) consolidated financial statements of Artisan Partners Holdings and Subsidiaries as of December 31, 2011 and 2010 and for the years ended December 31, 2011, 2010 and 2009, and (ii) the financial statements of Artisan Partners Asset Management as of and for the period ended December 31, 2011, included in this prospectus and registration statement, have been so included in reliance upon the reports of PricewaterhouseCoopers LLP, an independent registered public accounting firm, appearing elsewhere herein, given upon the authority of such firm as experts in auditing and accounting.
WHERE YOU CAN FIND MORE INFORMATION
We have filed with the SEC a registration statement on Form S-1 under the Securities Act with respect to the Class A common stock we are offering. This prospectus does not contain all of the information in the registration statement and the exhibits to the registration statement. For further information with respect to us and our Class A common stock, we refer you to the registration statement and the exhibits thereto. With respect to documents described in this prospectus, we refer you to the copy of the document if it is filed as an exhibit to the registration statement.
You may read and copy the registration statement of which this prospectus is a part at the SEC’s Public Reference Room, which is located at 100 F Street, N.E., Washington, D.C. 20549. You can request copies of the registration statement by writing to the SEC and paying a fee for the copying cost. Please call the SEC at 1-800-SEC-0330 for more information about the operation of the SEC’s Public Reference Room. In addition, the SEC maintains an Internet website, which is located at http://www.sec.gov, that contains reports, proxy and information statements and other information regarding issuers that file electronically with the SEC. You may access the registration statement, of which this prospectus is a part, at the SEC’s Internet website. Upon completion of this offering, we will be subject to the information reporting requirements of the Exchange Act and we will file reports, proxy statements and other information with the SEC.
-203-
Table of Contents
INDEX TO CONSOLIDATED FINANCIAL STATEMENTS
| Artisan Partners Asset Management Inc. |
||||
| F-2 | ||||
| F-3 | ||||
| F-4 | ||||
| F-5 | ||||
| F-6 | ||||
| Notes to Financial Statements as of and for the period ended December 31, 2011 |
F-7 | |||
| Unaudited Statements of Financial Condition as of June 30, 2012 |
F-8 | |||
| F-9 | ||||
| F-10 | ||||
| F-11 | ||||
| F-12 | ||||
| Artisan Partners Holdings LP and Subsidiaries |
||||
| F-13 | ||||
| Consolidated Statements of Financial Condition as of December 31, 2011 and 2010 |
F-14 | |||
| Consolidated Statements of Operations for the years ended December 31, 2011, 2010 and 2009 |
F-15 | |||
| F-16 | ||||
| Consolidated Statements of Cash Flows for the years ended December 31, 2011, 2010 and 2009 |
F-17 | |||
| F-18 | ||||
| Unaudited Consolidated Statements of Financial Condition as of June 30, 2012 |
F-38 | |||
| Unaudited Consolidated Statements of Operations for the six months ended June 30, 2012 and 2011 |
F-39 | |||
| F-40 | ||||
| F-41 | ||||
| Unaudited Consolidated Statements of Cash Flows for the six months ended June 30, 2012 and 2011 |
F-42 | |||
| Notes to Unaudited Consolidated Financial Statements – June 30, 2012 and 2011 |
F-43 | |||
F-1
Table of Contents
Report of Independent Registered Public Accounting Firm
To Board of Directors and Stockholder of
Artisan Partners Asset Management Inc.:
In our opinion, the accompanying statement of financial condition and the related statements of operations, of changes in stockholder’s equity (deficit), and of cash flows presents fairly, in all material respects, the financial position of Artisan Partners Asset Management Inc. (the “Company”) at December 31, 2011, and the results of its operations and its cash flows for the period March 29, 2011 (commencement of operations) through December 31, 2011, in conformity with accounting principles generally accepted in the United States of America. These financial statements are the responsibility of the Company’s management; our responsibility is to express an opinion on these financial statements based on our audit. We conducted our audit of these statements in accordance with the standards of the Public Company Accounting Oversight Board (United States). Those standards require that we plan and perform the audit to obtain reasonable assurance about whether the financial statements are free of material misstatement. An audit includes examining, on a test basis, evidence supporting the amounts and disclosures in the financial statements, assessing the accounting principles used and significant estimates made by management, and evaluating the overall financial statement presentation. We believe that our audit provides a reasonable basis for our opinion.
/s/ PRICEWATERHOUSECOOPERS LLP
Milwaukee, Wisconsin
February 29, 2012
F-2
Table of Contents
ARTISAN PARTNERS ASSET MANAGEMENT INC.
Statement of Financial Condition
(U.S. dollars)
| At December 31, 2011 | ||||
| ASSETS | ||||
| Cash |
$ | 100 | ||
| Prepaid expenses |
29,025 | |||
|
|
|
|||
| Total assets |
$ | 29,125 | ||
|
|
|
|||
| LIABILITIES AND STOCKHOLDER’S EQUITY (DEFICIT) | ||||
| Due to Artisan Partners Holdings LP |
$ | 83,550 | ||
| Accrued expenses |
3,000 | |||
|
|
|
|||
| Total liabilities |
86,550 | |||
|
|
|
|||
| Common Stock, $0.01 par value — 1,000 shares authorized, 100 shares issued and outstanding |
$ | 1 | ||
| Additional paid-in capital |
99 | |||
| Retained loss |
(57,525 | ) | ||
|
|
|
|||
| Total stockholder’s equity (deficit) |
(57,425 | ) | ||
|
|
|
|||
| Total liabilities and stockholder’s equity (deficit) |
$ | 29,125 | ||
|
|
|
|||
The accompanying notes are an integral part of the financial statements.
F-3
Table of Contents
ARTISAN PARTNERS ASSET MANAGEMENT INC.
Statement of Operations
(U.S. dollars)
| For the Period Ended December 31, 2011 |
||||
| Expenses |
||||
| General and administrative |
$ | 57,525 | ||
|
|
|
|||
| Total expenses |
57,525 | |||
|
|
|
|||
| Net loss |
$ | (57,525 | ) | |
|
|
|
|||
The accompanying notes are an integral part of the financial statements.
F-4
Table of Contents
ARTISAN PARTNERS ASSET MANAGEMENT INC.
Statement of Changes in Stockholder’s Equity (Deficit)
(U.S. dollars)
| Common Stock | Paid-In Capital | Retained Loss | Total Stockholder’s Equity (Deficit) |
|||||||||||||
| Net loss |
$ | — | $ | — | $ | (57,525 | ) | $ | (57,525 | ) | ||||||
| Issuance of new shares |
1 | 99 | — | 100 | ||||||||||||
|
|
|
|
|
|
|
|
|
|||||||||
| Balance at December 31, 2011 |
$ | 1 | $ | 99 | $ | (57,525 | ) | $ | (57,425 | ) | ||||||
|
|
|
|
|
|
|
|
|
|||||||||
The accompanying notes are an integral part of the financial statements.
F-5
Table of Contents
ARTISAN PARTNERS ASSET MANAGEMENT INC.
Statement of Cash Flows
(in U.S. dollars)
| For the Period Ended December 31, 2011 |
||||
| Cash flows from operating activities |
||||
| Net loss |
$ | (57,525 | ) | |
| Adjustments to reconcile net loss to net cash provided by operating activities: |
||||
| Change in assets and liabilities resulting in an increase (decrease) in cash: |
||||
| Prepaid expenses |
(29,025 | ) | ||
| Due to Artisan Partners Holdings LP |
83,550 | |||
| Accrued expenses |
3,000 | |||
|
|
|
|||
| Net cash provided by operating activities |
— | |||
| Cash flows from financing activities |
||||
| Capital contributions |
100 | |||
|
|
|
|||
| Net cash provided by financing activities |
100 | |||
|
|
|
|||
| Net increase in cash and cash equivalents |
100 | |||
| Cash |
||||
| Beginning of period |
— | |||
|
|
|
|||
| End of year |
$ | 100 | ||
|
|
|
|||
The accompanying notes are an integral part of the financial statements.
F-6
Table of Contents
ARTISAN PARTNERS ASSET MANAGEMENT INC.
Notes to Financial Statements
| 1. | Organization and description of business |
Artisan Partners Asset Management Inc. (“APAM”) was formed in March 2011 in anticipation of completing an initial public offering. APAM is wholly owned by Artisan Partners Holdings LP (“Artisan Partners Holdings”). Upon completion of a restructuring anticipated to occur immediately prior to consummation of that offering, APAM will serve as general partner of Artisan Partners Holdings. As general partner, APAM will operate and control all of the business and affairs of Artisan Partners Holdings and its subsidiaries and as a result of this control will consolidate the financial results of Artisan Partners Holdings and its subsidiaries with its own financial results.
Artisan Partners Holdings is a holding company for the investment management businesses conducted by its subsidiaries under the name “Artisan Partners”. Artisan Partners offers twelve equity investment strategies spanning different market capitalization segments and investing styles in both U.S. and non-U.S. markets. Artisan Partners offers investment management services primarily to institutions and through intermediaries that operate with institutional-like decision-making processes and have longer-term investment horizons, by means of separate account and mutual funds. Artisan Partners Holdings conducts its business activities through its operating subsidiaries.
| 2. | Summary of Significant Accounting Policies |
Basis of presentation
The accompanying statement of financial condition is prepared in accordance with accounting principles generally accepted in the United States of America (“U.S. GAAP”). The preparation of financial statements in conformity with U.S. GAAP requires management to make estimates or assumptions that affect the reported amounts and disclosures in the financial statements. Actual future results could differ from these estimates and assumptions.
Cash
Cash consists of cash on deposit with a financial institution. At December 31, 2011, no funds were restricted.
Prepaid expenses
Prepaid expenses consist of registration fees associated with APAM becoming a public reporting company.
Due to Artisan Partners Holdings
Due to Artisan Partners Holdings primarily consists of the liability related to funding the registration fees associated with APAM becoming a public reporting company.
Accrued expenses
Accrued expenses consist of the liability related to our public reporting requirements.
| 3. | Related-party transactions |
APAM engages in transactions with its affiliates in the ordinary course of business. APAM’s parent, Artisan Partners Holdings, provides funding to APAM in order for APAM to pay certain expenses. At December 31, 2011, the amount owed to Artisan Partners Holdings is recorded on the Statement of Financial Condition as Due to Artisan Partners Holdings in the amount of $83,550.
| 4. | Subsequent events |
APAM evaluated subsequent events through the issuance date of its financial statements, and determined that no subsequent events had occurred that would require additional disclosures.
F-7
Table of Contents
ARTISAN PARTNERS ASSET MANAGEMENT INC.
Unaudited Statements of Financial Condition
(U.S. dollars)
| At June 30, 2012 | At December 31, 2011 | |||||||
| ASSETS | ||||||||
| Cash |
$ | 100 | $ | 100 | ||||
| Prepaid expenses |
29,025 | 29,025 | ||||||
|
|
|
|
|
|||||
| Total assets |
$ | 29,125 | $ | 29,125 | ||||
|
|
|
|
|
|||||
| LIABILITIES AND STOCKHOLDER’S EQUITY | ||||||||
| Due to Artisan Partners Holdings LP |
$ | 86,550 | $ | 83,550 | ||||
| Accrued expenses |
1,575 | 3,000 | ||||||
|
|
|
|
|
|||||
| Total liabilities |
88,125 | 86,550 | ||||||
|
|
|
|
|
|||||
| Common stock, $0.01 par value — 1,000 shares authorized, 100 shares issued and outstanding |
1 | 1 | ||||||
| Additional paid-in capital |
99 | 99 | ||||||
| Retained loss |
(57,525 | ) | (57,525 | ) | ||||
|
|
|
|
|
|||||
| Total stockholder’s equity |
(59,100 | ) | (57,425 | ) | ||||
|
|
|
|
|
|||||
| Total liabilities and stockholder’s equity |
$ | 29,125 | $ | 29,125 | ||||
|
|
|
|
|
|||||
The accompanying notes are an integral part of the financial statements.
F-8
Table of Contents
ARTISAN PARTNERS ASSET MANAGEMENT INC.
Unaudited Statements of Operations
(U.S. dollars)
| For the Period Ended June 30, 2012 |
For the Period Ended June 30, 2011 |
|||||||
| Expenses |
||||||||
| General and administrative |
$ | 1,575 | $ | — | ||||
|
|
|
|
|
|||||
| Total expenses |
1,575 | — | ||||||
|
|
|
|
|
|||||
| Net loss |
$ | (1,575 | ) | $ | — | |||
|
|
|
|
|
|||||
The accompanying notes are an integral part of the financial statements.
F-9
Table of Contents
ARTISAN PARTNERS ASSET MANAGEMENT INC.
Unaudited Statements of Changes in Stockholder’s Equity (Deficit)
(U.S. dollars)
| Common Stock | Paid-In Capital | Retained Loss | Total Stockholder’s Equity (Deficit) |
|||||||||||||
| Balance at March 29, 2011 |
$ | — | $ | — | $ | — | $ | — | ||||||||
|
|
|
|
|
|
|
|
|
|||||||||
| Issuance of new shares |
$ | 1 | $ | 99 | $ | — | $ | 100 | ||||||||
|
|
|
|
|
|
|
|
|
|||||||||
| Balance at June 30, 2011 |
$ | 1 | $ | 99 | $ | — | $ | 100 | ||||||||
|
|
|
|
|
|
|
|
|
|||||||||
| Balance at December 31, 2011 |
$ | 1 | $ | 99 | $ | (57,525 | ) | $ | (57,425 | ) | ||||||
|
|
|
|
|
|
|
|
|
|||||||||
| Net loss |
— | — | (1,575 | ) | (1,575 | ) | ||||||||||
|
|
|
|
|
|
|
|
|
|||||||||
| Balance at June 30, 2012 |
$ | 1 | $ | 99 | $ | (59,100 | ) | $ | (59,000 | ) | ||||||
|
|
|
|
|
|
|
|
|
|||||||||
The accompanying notes are an integral part of the financial statements.
F-10
Table of Contents
ARTISAN PARTNERS ASSET MANAGEMENT INC.
Unaudited Statements of Cash Flows
(expressed in U.S. dollars)
| For the Six Months Ended June 30, 2012 |
For the
Period Ended June 30, 2011 |
|||||||
| Cash flows from operating activities |
||||||||
| Net loss |
$ | (1,575 | ) | $ | — | |||
| Adjustments to reconcile net losses to net cash provided by operating activities: |
||||||||
| Change in assets and liabilities resulting in an increase (decrease) in cash: |
||||||||
| Prepaid expenses |
— | (29,025 | ) | |||||
| Due to Artisan Partners Holdings LP |
3,000 | 83,550 | ||||||
| Accrued expenses |
(1,425 | ) | — | |||||
| Other assets |
— | (54,525 | ) | |||||
| Net cash provided by operating activities |
— | — | ||||||
| Cash flows from financing activities |
||||||||
| Capital contributions |
— | 100 | ||||||
|
|
|
|
|
|||||
| Net cash provided by financing activities |
— | 100 | ||||||
|
|
|
|
|
|||||
| Net increase in cash and cash equivalents |
— | 100 | ||||||
| Cash |
||||||||
| Beginning of period |
100 | — | ||||||
|
|
|
|
|
|||||
| End of year |
$ | 100 | $ | 100 | ||||
|
|
|
|
|
|||||
The accompanying notes are an integral part of the financial statements.
F-11
Table of Contents
ARTISAN PARTNERS ASSET MANAGEMENT INC.
Notes to Unaudited Financial Statements
| 1. | Organization and description of business |
Artisan Partners Asset Management Inc. (“APAM”) was formed in March 2011 in anticipation of completing an initial public offering. APAM is wholly owned by Artisan Partners Holdings LP (“Artisan Partners Holdings”). Upon completion of a restructuring anticipated to occur immediately prior to consummation of that offering, APAM will serve as general partner of Artisan Partners Holdings. As general partner, APAM will operate and control all of the business and affairs of Artisan Partners Holdings and its subsidiaries and as a result of this control will consolidate the financial results of Artisan Partners Holdings and its subsidiaries with its own financial results.
Artisan Partners Holdings is a holding company for the investment management businesses conducted by its subsidiaries under the name “Artisan Partners”. Artisan Partners offers twelve equity investment strategies spanning different market capitalization segments and investing styles in both U.S. and non-U.S. markets. Artisan Partners offers investment management services primarily to institutions and through intermediaries that operate with institutional-like decision-making processes and have longer-term investment horizons, by means of separate account and mutual funds. Artisan Partners Holdings conducts its business activities through its operating subsidiaries.
| 2. | Summary of Significant Accounting Policies |
Basis of presentation
The accompanying statement of financial condition is prepared in accordance with accounting principles generally accepted in the United States of America (“U.S. GAAP”). The preparation of financial statements in conformity with U.S. GAAP requires management to make estimates or assumptions that affect the reported amounts and disclosures in the financial statements. Actual future results could differ from these estimates and assumptions.
Cash
Cash consists of cash on deposit with a financial institution. At June 30, 2012, no funds were restricted.
Prepaid expenses
Prepaid expenses consist of registration fees associated with APAM becoming a public reporting company.
Due to Artisan Partners Holdings
Due to Artisan Partners Holdings primarily consists of the liability related to funding the registration fees associated with APAM becoming a public reporting company.
Accrued expenses
Accrued expenses consist of the liability related to our public reporting requirements.
| 3. | Related-party transactions |
APAM engages in transactions with its affiliates in the ordinary course of business. APAM’s parent, Artisan Partners Holdings, provides funding to APAM in order for APAM to pay certain expenses. At June 30, 2012 and December 31, 2011, the amount owed to Artisan Partners Holdings is recorded on the Statement of Financial Condition as Due to Artisan Partners Holdings in the amount of $86,550 and $83,550, respectively.
| 4. | Subsequent events |
APAM evaluated subsequent events through the issuance date of its financial statements, and determined that no subsequent events had occurred that would require additional disclosures.
F-12
Table of Contents
Report of Independent Registered Public Accounting Firm
To the Partners of Artisan Partners Holdings LP and Subsidiaries:
In our opinion, the accompanying consolidated statements of financial condition and the related consolidated statements of operations, of changes in partners’ equity (deficit), accumulated other comprehensive income (loss) and redeemable Class C interests, and of cash flows present fairly, in all material respects, the financial condition of Artisan Partners Holdings LP and Subsidiaries (the “Company”) at December 31, 2011 and 2010, and the consolidated results of their operations and their cash flows for each of the three years in the period ended December 31, 2011 in conformity with accounting principles generally accepted in the United States of America. These financial statements are the responsibility of the Company’s management. Our responsibility is to express an opinion on these financial statements based on our audits. We conducted our audits of these statements in accordance with the standards of the Public Company Accounting Oversight Board (United States). Those standards require that we plan and perform the audit to obtain reasonable assurance about whether the financial statements are free of material misstatement. An audit includes examining, on a test basis, evidence supporting the amounts and disclosures in the financial statements, assessing the accounting principles used and significant estimates made by management, and evaluating the overall financial statement presentation. We believe that our audits provide a reasonable basis for our opinion.
/s/ PRICEWATERHOUSECOOPERS LLP
Milwaukee, Wisconsin
February 29, 2012
F-13
Table of Contents
ARTISAN PARTNERS HOLDINGS LP AND SUBSIDIARIES
Consolidated Statements of Financial Condition
(U.S. dollars in thousands)
| At December 31, | ||||||||
| 2011 | 2010 | |||||||
| ASSETS | ||||||||
| Cash and cash equivalents |
$ | 126,956 | $ | 158,987 | ||||
| Cash and cash equivalents of consolidated investment products |
5,142 | — | ||||||
| Accounts receivable |
39,454 | 36,732 | ||||||
| Investment in securities |
17,262 | 1,177 | ||||||
| Investment in securities of consolidated investment products |
24,265 | — | ||||||
| Prepaid expenses |
3,280 | 2,870 | ||||||
| Debt issuance costs |
1,090 | 1,816 | ||||||
| Property and equipment, net |
5,572 | 5,223 | ||||||
| Restricted cash |
1,040 | — | ||||||
| Other |
790 | 3,073 | ||||||
|
|
|
|
|
|||||
| Total assets |
$ | 224,851 | $ | 209,878 | ||||
|
|
|
|
|
|||||
| LIABILITIES, REDEEMABLE CLASS C INTERESTS AND PARTNERS’ EQUITY (DEFICIT) | ||||||||
| Accounts payable and accrued expenses |
$ | 7,468 | $ | 8,169 | ||||
| Accrued incentive compensation |
3,920 | 1,381 | ||||||
| Accrued interest payable |
940 | 5,628 | ||||||
| Deferred lease obligations |
2,340 | 1,713 | ||||||
| Interest rate swap |
1,066 | 6,130 | ||||||
| Note payable |
324,789 | 380,000 | ||||||
| Class B liability awards |
146,175 | 168,801 | ||||||
| Class B redemptions payable |
14,909 | 17,221 | ||||||
| Other liabilities |
866 | 219 | ||||||
| Securities sold, not yet purchased of consolidated investment products |
6,276 | — | ||||||
|
|
|
|
|
|||||
| Total liabilities |
508,749 | 589,262 | ||||||
|
|
|
|
|
|||||
| Commitments and contingencies |
||||||||
| Redeemable Class C interests |
357,194 | 357,194 | ||||||
| Partners’ deficit |
(664,259 | ) | (736,578 | ) | ||||
|
|
|
|
|
|||||
| Total deficit attributable to Artisan Partners Holdings LP |
(307,065 | ) | (379,384 | ) | ||||
| Noncontrolling interest in consolidated entities |
23,167 | — | ||||||
|
|
|
|
|
|||||
| Total equity (deficit) |
(283,898 | ) | (379,384 | ) | ||||
|
|
|
|
|
|||||
| Total liabilities, redeemable Class C interests and partners’ equity (deficit) |
$ | 224,851 | $ | 209,878 | ||||
|
|
|
|
|
|||||
The accompanying notes are an integral part of the consolidated financial statements.
F-14
Table of Contents
ARTISAN PARTNERS HOLDINGS LP AND SUBSIDIARIES
Consolidated Statements of Operations
(U.S. dollars in thousands)
| For the Years Ended December 31, | ||||||||||||
| 2011 | 2010 | 2009 | ||||||||||
| Revenues |
||||||||||||
| Management fees |
$ | 450,949 | $ | 379,350 | $ | 292,653 | ||||||
| Performance fees |
4,145 | 2,936 | 3,526 | |||||||||
|
|
|
|
|
|
|
|||||||
| Total revenues |
455,094 | 382,286 | 296,179 | |||||||||
|
|
|
|
|
|
|
|||||||
| Operating Expenses |
||||||||||||
| Compensation and benefits |
||||||||||||
| Salaries, incentive compensation and benefits |
198,601 | 166,629 | 132,888 | |||||||||
| Distributions on Class B liability awards |
55,714 | 17,578 | 2,503 | |||||||||
| Change in value of Class B liability awards |
(21,082 | ) | 79,071 | 41,783 | ||||||||
|
|
|
|
|
|
|
|||||||
| Total compensation and benefits |
233,233 | 263,278 | 177,174 | |||||||||
| Distribution and marketing |
26,174 | 23,022 | 17,783 | |||||||||
| Occupancy |
8,962 | 8,105 | 8,026 | |||||||||
| Communication and technology |
10,605 | 9,876 | 10,111 | |||||||||
| General and administrative |
21,825 | 12,807 | 9,986 | |||||||||
|
|
|
|
|
|
|
|||||||
| Total operating expenses |
300,799 | 317,088 | 223,080 | |||||||||
|
|
|
|
|
|
|
|||||||
| Total operating income |
154,295 | 65,198 | 73,099 | |||||||||
| Non-operating income (loss) |
||||||||||||
| Interest expense |
(18,386 | ) | (22,961 | ) | (24,941 | ) | ||||||
| Interest and dividend income |
202 | 32 | 70 | |||||||||
| Net capital gains on investments |
58 | 673 | — | |||||||||
| Net losses on consolidated investment products |
(3,102 | ) | — | — | ||||||||
| Gain (loss) on interest rate swap |
(1,933 | ) | 866 | — | ||||||||
|
|
|
|
|
|
|
|||||||
| Total non-operating loss |
(23,161 | ) | (21,390 | ) | (24,871 | ) | ||||||
|
|
|
|
|
|
|
|||||||
| Income before income taxes |
131,134 | 43,808 | 48,228 | |||||||||
| Provision for income taxes |
1,162 | 1,281 | — | |||||||||
|
|
|
|
|
|
|
|||||||
| Net income before noncontrolling interests |
129,972 | 42,527 | 48,228 | |||||||||
|
|
|
|
|
|
|
|||||||
| Less: Net loss attributable to noncontrolling interests |
(3,101 | ) | — | — | ||||||||
|
|
|
|
|
|
|
|||||||
| Net income attributable to Artisan Partners Holdings LP |
$ | 133,073 | $ | 42,527 | $ | 48,228 | ||||||
|
|
|
|
|
|
|
|||||||
The accompanying notes are an integral part of the consolidated financial statements.
F-15
Table of Contents
ARTISAN PARTNERS HOLDINGS LP AND SUBSIDIARIES
Consolidated Statements of Changes in Partners’ Equity (Deficit),
Accumulated Other Comprehensive Income (Loss) and
Redeemable Class C Interests
(U.S. dollars in thousands)
| Partners’ Equity (Deficit) |
Noncontrolling Interest In Consolidated Entities |
Accumulated Other Comprehensive Income (Loss) |
Redeemable Class C Interests |
Total Equity (Deficit) |
||||||||||||||||
| Balance at December 31, 2008 |
$ | (764,879 | ) | $ | — | $ | (29,705 | ) | $ | 357,194 | $ | (437,390 | ) | |||||||
|
|
|
|
|
|
|
|
|
|
|
|||||||||||
| Net income |
48,228 | — | — | — | 48,228 | |||||||||||||||
| Change in net unrealized gains (losses): |
||||||||||||||||||||
| Investments |
— | — | 876 | — | 876 | |||||||||||||||
| Interest rate swaps |
— | — | 7,673 | — | 7,673 | |||||||||||||||
|
|
|
|
|
|
|
|
|
|
|
|||||||||||
| Total comprehensive income |
48,228 | — | 8,549 | — | 56,777 | |||||||||||||||
| Partnership distributions |
(19,349 | ) | — | — | — | (19,349 | ) | |||||||||||||
|
|
|
|
|
|
|
|
|
|
|
|||||||||||
| Balance at December 31, 2009 |
$ | (736,000 | ) | $ | — | $ | (21,156 | ) | $ | 357,194 | $ | (399,962 | ) | |||||||
|
|
|
|
|
|
|
|
|
|
|
|||||||||||
| Net income |
42,527 | — | — | — | 42,527 | |||||||||||||||
| Change in net unrealized gains (losses): |
||||||||||||||||||||
| Investments |
— | — | (461 | ) | — | (461 | ) | |||||||||||||
| Interest rate swaps |
— | — | 15,313 | — | 15,313 | |||||||||||||||
| Foreign currency translation adjustments |
— | — | (57 | ) | — | (57 | ) | |||||||||||||
|
|
|
|
|
|
|
|
|
|
|
|||||||||||
| Total comprehensive income |
42,527 | — | 14,795 | — | 57,322 | |||||||||||||||
| Partnership distributions |
(36,760 | ) | — | — | — | (36,760 | ) | |||||||||||||
| Capital contribution |
16 | — | — | — | 16 | |||||||||||||||
|
|
|
|
|
|
|
|
|
|
|
|||||||||||
| Balance at December 31, 2010 |
$ | (730,217 | ) | $ | — | $ | (6,361 | ) | $ | 357,194 | $ | (379,384 | ) | |||||||
|
|
|
|
|
|
|
|
|
|
|
|||||||||||
| Net income |
133,073 | (3,101 | ) | — | — | 129,972 | ||||||||||||||
| Change in net unrealized gains (losses): |
||||||||||||||||||||
| Investments |
— | — | (62 | ) | — | (62 | ) | |||||||||||||
| Interest rate swaps |
— | — | 6,434 | — | 6,434 | |||||||||||||||
| Foreign currency translation adjustments |
— | — | (18 | ) | — | (18 | ) | |||||||||||||
|
|
|
|
|
|
|
|
|
|
|
|||||||||||
| Total comprehensive income |
133,073 | (3,101 | ) | 6,354 | — | 136,326 | ||||||||||||||
| Change in noncontrolling interest in consolidated entities, net |
— | 26,268 | — | — | 26,268 | |||||||||||||||
| Partnership distributions |
(67,108 | ) | — | — | — | (67,108 | ) | |||||||||||||
|
|
|
|
|
|
|
|
|
|
|
|||||||||||
| Balance at December 31, 2011 |
$ | (664,252 | ) | $ | 23,167 | $ | (7 | ) | $ | 357,194 | $ | (283,898 | ) | |||||||
|
|
|
|
|
|
|
|
|
|
|
|||||||||||
The accompanying notes are an integral part of the consolidated financial statements.
F-16
Table of Contents
ARTISAN PARTNERS HOLDINGS LP AND SUBSIDIARIES
Consolidated Statements of Cash Flows
(in U.S. dollars in thousands)
| For the Years Ended December 31, | ||||||||||||
| 2011 | 2010 | 2009 | ||||||||||
| Cash flows from operating activities |
||||||||||||
| Net income before noncontrolling interests |
$ | 129,972 | $ | 42,527 | $ | 48,228 | ||||||
| Adjustments to reconcile net income to net cash provided by operating activities: |
||||||||||||
| Depreciation and amortization |
2,360 | 2,287 | 2,388 | |||||||||
| Reinvested dividends |
(190 | ) | ||||||||||
| Capital gains on sale of investments |
(58 | ) | (665 | ) | — | |||||||
| Losses of consolidated investment products, net |
3,102 | — | — | |||||||||
| Proceeds from sale of investments by consolidated investment products |
(18,899 | ) | — | — | ||||||||
| Purchase of investments by consolidated investment products |
17,188 | — | — | |||||||||
| Loss on disposal of property and equipment |
11 | 11 | 14 | |||||||||
| (Gain) loss on interest rate swaps |
1,933 | (866 | ) | — | ||||||||
| Amortization of debt issuance costs |
726 | 548 | 512 | |||||||||
| Change in assets and liabilities resulting in an increase (decrease) in cash: |
||||||||||||
| Net change in operating assets and liabilities of consolidated investment products |
(5,204 | ) | — | — | ||||||||
| Accounts receivable |
(2,685 | ) | (5,081 | ) | (9,503 | ) | ||||||
| Prepaid expenses |
(410 | ) | 161 | 372 | ||||||||
| Other assets |
1,691 | (2,350 | ) | 60 | ||||||||
| Accounts payable and accrued expenses |
(1,991 | ) | 1,572 | 3,549 | ||||||||
| Class B liability awards |
(24,936 | ) | 78,218 | 40,682 | ||||||||
| Deferred lease obligations |
627 | (382 | ) | 47 | ||||||||
|
|
|
|
|
|
|
|||||||
| Net cash provided by operating activities |
103,237 | 115,980 | 86,349 | |||||||||
| Cash flows from investing activities |
||||||||||||
| Acquisition of property and equipment |
(1,614 | ) | (1,148 | ) | (651 | ) | ||||||
| Leasehold improvements |
(1,122 | ) | (313 | ) | (534 | ) | ||||||
| Proceeds from sale of property and equipment |
27 | — | 2 | |||||||||
| Proceeds from sale of investment securities |
4,101 | 2,204 | — | |||||||||
| Purchase of investment securities |
(20,000 | ) | (1,025 | ) | (14 | ) | ||||||
| Change in restricted cash |
(1,040 | ) | — | — | ||||||||
|
|
|
|
|
|
|
|||||||
| Net cash used in investing activities |
(19,648 | ) | (282 | ) | (1,197 | ) | ||||||
| Cash flows from financing activities |
||||||||||||
| Partnership distributions |
(67,108 | ) | (36,760 | ) | (19,349 | ) | ||||||
| Payments on other liabilities |
(214 | ) | (218 | ) | (288 | ) | ||||||
| Debt issuance costs |
— | (1,593 | ) | — | ||||||||
| Principal payments on note payable |
(55,211 | ) | (20,000 | ) | — | |||||||
| Capital contribution |
— | 16 | — | |||||||||
| Other liabilities |
— | — | 403 | |||||||||
| Capital invested into consolidated investment products |
6,913 | — | — | |||||||||
|
|
|
|
|
|
|
|||||||
| Net cash used in financing activities |
(115,620 | ) | (58,555 | ) | (19,234 | ) | ||||||
|
|
|
|
|
|
|
|||||||
| Net increase (decrease) in cash and cash equivalents |
(32,031 | ) | 57,143 | 65,918 | ||||||||
| Cash and cash equivalents |
||||||||||||
| Beginning of year |
158,987 | 101,844 | 35,926 | |||||||||
|
|
|
|
|
|
|
|||||||
| End of year |
$ | 126,956 | $ | 158,987 | $ | 101,844 | ||||||
|
|
|
|
|
|
|
|||||||
| Supplementary information |
||||||||||||
| Cash paid for: |
||||||||||||
| Interest on note payable |
$ | 12,420 | $ | 7,324 | $ | 12,674 | ||||||
| Interest on interest rate swap |
9,794 | 14,926 | 12,313 | |||||||||
| Interest on other obligations |
71 | — | 36 | |||||||||
| Income taxes |
2,475 | — | — | |||||||||
| Noncash activity: |
||||||||||||
| Contribution of securities in-kind into consolidated investment products |
$ | (19,355 | ) | $ | — | $ | — | |||||
| Capital invested into consolidated investment products |
19,355 | — | — | |||||||||
The accompanying notes are an integral part of the consolidated financial statements.
F-17
Table of Contents
ARTISAN PARTNERS HOLDINGS LP AND SUBSIDIARIES
Notes to Consolidated Financial Statements
(U.S. currencies in thousands)
| 1. | Organization and Description of Business |
Artisan Partners Holdings LP (“Artisan Partners Holdings” or the “Partnership”), known as Artisan Partners Limited Partnership until June 2009, is a holding company for the investment management business conducted under the name “Artisan Partners”. The partnership interests in Artisan Partners Holdings consist of a general partnership interest and Class A, Class B and Class C limited partnership interests. Initial outside investors hold the Class A limited partnership interests. Artisan employees hold the Class B limited partnership interests. Non-employee investors hold the Class C limited partnership interests. The general partner interest is held by Artisan Investment Corporation (“AIC”), all of the outstanding voting stock of which is owned by ZFIC, Inc.
Artisan Partners Holdings was formed as a limited partnership in the State of Delaware on December 9, 1994 and commenced operations on January 1, 1995. Artisan Partners Holdings, together with its wholly-owned subsidiary, Artisan Investments GP LLC (“AIGP”), controls a 100% interest in Artisan Partners Limited Partnership (“APLP”), a multi-product investment management firm that is the principal operating subsidiary of Artisan Partners Holdings. APLP is registered as an investment adviser with the U.S. Securities and Exchange Commission under the Investment Advisers Act of 1940. APLP provides investment advisory services to separate accounts and pooled investment vehicles, including Artisan Partners Funds, Inc. (“Artisan Funds” or the “Funds”), known as Artisan Funds, Inc. until July 2011. Artisan Funds is a series of twelve open-end, diversified mutual funds registered under the Investment Company Act of 1940, as amended, that are distributed to both institutional and retail investors on a no-load basis and to which APLP also provides certain administrative services.
Investment management operations are also conducted through Artisan Partners UK LLP (“Artisan UK”), a limited liability partnership organized under the laws of England and Wales that is controlled by its founder member, Artisan Partners Limited (“UKCo”), a private limited company incorporated under the laws of England and Wales, which is wholly-owned by Artisan Partners Holdings. Artisan UK is registered as an investment adviser with the U.S. Securities and Exchange Commission under the Investment Advisers Act of 1940 and is authorized by the United Kingdom Financial Services Authority. Artisan UK provides investment sub-advisory services to APLP, including to Artisan Partners Global Equity Fund, a series of Artisan Funds.
APLP has an agreement to serve as the investment manager of Artisan Partners Launch Equity LP (“Launch Equity”), which is a private investment partnership in which the investors are certain partners and employees (or entities beneficially owned by such persons) of Artisan Partners Holdings. Artisan Partners Alternative Investments GP LLC (“Artisan Alternatives”), a wholly-owned subsidiary of Artisan Partners Holdings, is the general partner of Launch Equity. Launch Equity commenced operations on July 25, 2011.
Artisan Partners Distributors LLC (“ADLLC”) is a wholly-owned subsidiary of Artisan Partners Holdings. ADLLC is a limited purpose broker/dealer registered with the Financial Industry Regulatory Authority and serves solely as principal distributor of the shares of Artisan Funds and does not execute trades on behalf of clients.
The consolidated financial statements include the accounts of Artisan Partners Holdings and all of its majority owned and controlled subsidiaries. Artisan Partners Holdings and its subsidiaries are hereafter referred to collectively as “Artisan”.
2009 reorganization
In June 2009, Artisan Partners Holdings (then named Artisan Partners Limited Partnership) reorganized into a holding company/operating company structure. Artisan Partners Holdings established (i) APLP as a new limited partnership subsidiary to serve as the U.S. operating company in Artisan’s organizational structure,
F-18
Table of Contents
and (ii) AIGP, a new limited liability company to serve as the general partner of APLP. Artisan Partners Holdings owns all of the limited partner interests of APLP and all of the membership interests of AIGP. In June 2009, certain of Holdings’ assets and liabilities were contributed to APLP via a Contribution Agreement by and among Artisan Partners Holdings, APLP and AIGP. Concurrent with the execution of the Contribution Agreement, Artisan Partners Holdings’ name was changed from Artisan Partners Limited Partnership to Artisan Partners Holdings LP, and the new operating company and its general partner were given their current names, Artisan Partners Limited Partnership and Artisan Investments GP LLC, respectively. During a transition period that extended through mid-2010, both Artisan Partners Holdings and APLP were registered with the U.S. Securities and Exchange Commission as investment advisers and provided investment management services to clients. The transition of Artisan Partners Holdings’ investment management business to APLP was completed and the registration of Artisan Partners Holdings as an investment adviser was terminated in August 2010.
2006 recapitalization
On July 3, 2006, Artisan Partners Holdings (then operating as Artisan Partners Limited Partnership) and its partners entered into the following series of transactions (the “Recapitalization Transactions”): (i) a $400 million borrowing by Artisan Partners Holdings, (ii) redemption by Artisan Partners Holdings of Class A, Class B, and general partner interests from certain partners with the proceeds from the borrowing, and (iii) the purchase of Class A, Class B, and general partner interests by private equity funds (the “H&F Funds”) controlled by their sole general partner, Hellman & Friedman Investors V, L.P., which is, in turn, controlled by Hellman & Friedman LLC, and the conversion of those purchased interests to Class C limited partnership interests.
The borrowing by Artisan Partners Holdings was recorded as a liability incurred based on the principal amount of the borrowing; the subsequent redemption of a portion of the general and limited partnership interests of certain partners by Artisan Partners Holdings was recorded as a partnership interest repurchase (akin to a treasury stock repurchase) and a reduction of equity. The conversion to Class C interests of the Class A, Class B and general partner interests acquired by the H&F Funds was recorded as a contribution of capital and partnership interest repurchase (akin to a treasury stock repurchase). The initial measurement of the capital contribution from the H&F Funds was the amount of the cash consideration paid to our partners, which was negotiated between our partners and the H&F Funds taking into account the rights of the Class C interests. The Class C interests were recorded in temporary equity pursuant to ASC 480 as they were redeemable in 2016 at the option of the holder.
Partnership interests
Artisan Partners Holdings has outstanding general partner interests and Class A, Class B and Class C limited partner interests.
All interests in Artisan Partners Holdings share ratably in the net income of Artisan Partners Holdings. Net income and related distributions of such income to the partners are allocated in accordance with their interests in net income, which were approximately as follows:
| At December 31, | ||||||||||||
| 2011 | 2010 | 2009 | ||||||||||
| General Partner interests |
17.78 | % | 18.72 | % | 19.03 | % | ||||||
| Class A interests |
24.46 | % | 25.76 | % | 26.19 | % | ||||||
| Class B interests |
40.94 | % | 37.80 | % | 36.76 | % | ||||||
| Class C interests |
16.82 | % | 17.72 | % | 18.02 | % | ||||||
|
|
|
|
|
|
|
|||||||
| 100.00 | % | 100.00 | % | 100.00 | % | |||||||
|
|
|
|
|
|
|
|||||||
Class B interests are granted under the terms of the Agreement of Limited Partnership of Artisan Partners Holdings (the “Partnership Agreement”) and pursuant to written grant agreements to certain employees of
F-19
Table of Contents
APLP and other subsidiaries of Artisan Partners Holdings. As further described in Note 2, Summary of significant accounting policies – Equity-based compensation, and Note 8, Compensation and benefits, a Class B interest entitles the holder thereof to share ratably in the net income of Artisan Partners Holdings, and in appreciation and depreciation of the value of Artisan Partners Holdings, from and after the date of grant. During the years ended December 31, 2011 and December 31, 2010, Class B interests representing 5.35% and 3.00%, respectively, of the interests in the net income of Artisan Partners Holdings were granted at no cost to Class B limited partners.
The Class C limited partnership interests are preferred interests that enjoy certain preferential rights to distributions upon the full or partial liquidation of Artisan Partners Holdings, including following any Partial Capital Event (as defined in the Partnership Agreement). The holders of Class C interests also have the right to cause Artisan Partners Holdings to redeem such interests in 2016 for cash for an aggregate amount of $357,194.
| 2. | Summary of Significant Accounting Policies |
Basis of Presentation
The accompanying Consolidated Financial Statements were prepared in accordance with accounting principles generally accepted in the United States of America (“U.S. GAAP”) and related rules and regulations of the U.S. Securities and Exchange Commission. The preparation of financial statements in conformity with U.S. GAAP requires management to make estimates or assumptions that affect the reported amounts and disclosures in the Consolidated Financial Statements. Actual results could differ from these estimates or assumptions.
Principles of Consolidation
Artisan’s policy is to consolidate all subsidiaries in which it has a controlling financial interest and variable interest entities (“VIEs”) where Artisan is deemed to be the primary beneficiary. The primary beneficiary is deemed to be the entity that has the power to govern the financial and operating policies of the subsidiary so as to obtain benefits from its activities. The Consolidated Financial Statements include the accounts of Artisan Partners Holdings and its subsidiaries. All material intercompany balances have been eliminated in consolidation.
At December 31, 2011 our wholly-owned subsidiary, Artisan Alternatives, was the general partner of Launch Equity, a private investment partnership that is considered a VIE. Launch Equity is considered an investment company and therefore accounted for under Accounting Standard Codification Topic 946, “Financial Services – Investment Companies”. The Company has retained the specialized industry accounting principles of this investment product in its Consolidated Financial Statements. See Note 7, “Consolidated Investment Products” for additional details. At December 31, 2010, Artisan did not have any VIEs.
Operating Segments
Artisan operates in one segment, the investment management industry. Artisan provides investment management services to separate accounts and sponsored mutual funds and other pooled investment vehicles. Management assesses the financial performance of these vehicles on a combined basis.
Cash and cash equivalents
Artisan defines cash and cash equivalents as money market funds and other highly liquid investments with original maturities of 90 days or less. Cash and cash equivalents are stated at cost, which approximates fair value. Cash and cash equivalents are subject to credit risk and were primarily maintained in demand deposit accounts with financial institutions. At December 31, 2011, all non-interest bearing accounts were fully insured by the Federal Deposit Insurance Company.
F-20
Table of Contents
Cash and cash equivalents of consolidated investment products
Cash and cash equivalents of consolidated investment products represent cash and equivalents of Launch Equity, a private investment partnership that is considered a VIE. Launch Equity defines cash and cash equivalents as highly liquid investments that have original maturities of 60 days or less. Cash and cash equivalents of consolidated investment products are stated at cost, which approximates fair value. See Note 7, “Consolidated investment products”, for additional details.
Foreign currency translation
Assets and liabilities of foreign operations whose functional currency is not the U.S. dollar are translated at prevailing year-end exchange rates. Revenue and expenses of such foreign operations are translated at average exchange rates during the year. The net effect of the translation adjustment for foreign operations is included in Accumulated other comprehensive income (loss) on the Consolidated Statements of Changes in Partners’ Equity (Deficit), Accumulated Other Comprehensive Income (Loss) and Redeemable Class C Interests.
Accounts receivable
Accounts receivable primarily reflects investment management fees receivable from clients other than Artisan Funds, the fees from which are received on the last business day of each month. Artisan’s accounts receivable balances do not include any allowance for doubtful accounts nor has any bad debt expense attributable to accounts receivable been recorded for the years ended December 31, 2011, 2010 and 2009. Artisan believes all accounts receivable balances are fully collectible.
Investment securities
Investment in securities consists of investments in equity mutual funds for which Artisan is the investment adviser and are classified as available-for-sale. These securities primarily represent securities held in connection with an incentive compensation plan established during 2011. This incentive compensation plan provides certain portfolio managers with additional cash compensation over a three-year period based on the then-current value of the investment securities, which are shares of mutual funds managed by such portfolio managers. Artisan is not required to purchase additional securities as part of this plan. Investments provide exposure to various risks, including price risk (the risk of a potential future decline in value of the investment), credit risk, and foreign currency risk. Investments in registered mutual funds are carried at fair value at their respective net asset values as of the valuation date. Fair value is defined as the price that Artisan Partners Holdings would expect to have received in the sale of an asset or paid to transfer a liability in an orderly transaction between market participants at the measurement date.
Unrealized gains (losses) on available-for-sale securities are recorded as a component of Total comprehensive income (loss). Dividend income from these investments is recognized when earned and is included in Interest and dividend income in the Consolidated Statements of Operations. Realized gains (losses) are computed on a specific identification basis and are recorded in Net capital gains (losses) on investments in the Consolidated Statements of Operations.
Investment in securities of consolidated investment products
Investment in securities of consolidated investment products represents investments held by Launch Equity. The carrying value of consolidated investment products is also their fair value. Long and short positions in equity securities are valued based upon closing market prices of the security on the principal exchange on which the security is traded. See Note 7, “Consolidated investment products”, for additional details.
Property and equipment
Property and equipment are carried at cost, less accumulated depreciation. Depreciation for office furniture is recognized over the applicable life of the asset class, typically seven years. Depreciation for computer
F-21
Table of Contents
hardware and equipment is recognized over the applicable life of the asset class, typically five years. Depreciation for leasehold improvements is recognized over the applicable life of the asset class, typically the lesser of the economic useful life of the improvement or the remaining term of the lease. Depreciation for computer software is recognized over the applicable life of the asset class, typically three years.
Restricted Cash
Restricted cash represents cash that is restricted as collateral on a standby letter of credit related to a lease obligation at December 31, 2011. No funds were restricted at December 31, 2010.
Derivative instruments
Artisan attempts to manage its exposure to changes in market rates of interest on its term loan through the use of derivative instruments. Artisan’s use of derivative instruments is limited to interest rate swaps used to manage the interest rate exposure related to its variable rate term loan. As of and for the years ended December 31, 2010 and 2009, Artisan designated its interest rate swaps as a hedge of the benchmark interest rate on future interest payments to remove the exposure to variations in cash flows related to interest expense. Artisan monitors its position and the credit rating of the counterparties and does not anticipate non-performance by any party to the interest rate swaps.
The interest rate swaps are carried at fair value. For the years ended December 31, 2010 and 2009, changes in fair value that related to the effective portion of the cash flow hedge were recorded as a component of Total comprehensive income (loss) and the ineffective portion recorded as Gain (loss) on interest rate swap.
During the year ended December 31, 2011, Artisan discontinued the hedge accounting relationship related to the cash flow hedge. As such, cumulative amounts recorded in Total comprehensive income (loss) were reclassified to current earnings as Gain (loss) on interest rate swap. Changes in fair value occurring after the date of discontinuance were recorded as Gain (loss) on interest rate swap. See Note 6, “Derivative instruments”, for additional details.
Securities sold, not yet purchased of consolidated investment products
Securities sold, not yet purchased of consolidated investment products represent securities sold short, at fair value, held by Launch Equity. See Note 7, “Consolidated investment products”, for additional details.
Revenue recognition
Investment management fees are generally computed as a percentage of assets under management and recognized as earned. Fees for providing investment advisory services are computed and billed in accordance with the provisions of the applicable investment management agreements. The investment management agreements for a small number of accounts provide for performance-based fees. Performance-based fees, if earned, are recognized on the contractually determined measurement date. Performance-based fees generally are not subject to claw back as a result of performance declines subsequent to the most recent measurement date.
Equity-based compensation
In accordance with the provisions of the Partnership Agreement and the terms of the corresponding grant agreements, Class B interests granted to the Class B limited partners provide for an interest in future net income (generally determined based upon Artisan Partners Holdings’ net income before equity-based compensation charges) as well as an interest in the overall appreciation or depreciation of Artisan Partners Holdings based on a valuation formula as stated in the Partnership Agreement, in each case from and after the date of grant. Class B interests vest ratably over a five-year vesting period, beginning on the date of grant. Vesting is accelerated upon the occurrence of certain events, including a change in control as defined in the grant agreements.
F-22
Table of Contents
Vested Class B interests are classified as share-based liability awards. Vested Class B interests of a terminated partner are redeemed in cash, generally in annual installments over the five years following termination of employment. The Partnership redeems the vested Class B limited partner interests at a value determined in accordance with the terms of the grant agreement pursuant to which the interest was granted, which includes a premium in the case of employment terminated by reason of death, disability or retirement. The redemption value of Class B interests has been calculated assuming a holder’s termination of employment was the result of resignation or involuntary termination by Artisan and has been recorded as Class B liability award on the Consolidated Statements of Financial Condition. For individuals who have given notice of retirement in accordance with their grant agreements and such notice has been accepted by Artisan, the redemption value of the Class B interests has been calculated using the retirement valuation as of the notice date. Prior to April 6, 2011, compensation cost was measured based on the intrinsic value of the interests granted. Intrinsic value was determined using the redemption formula of the Class B awards. Effective April 6, 2011, compensation cost is measured based on the fair value of the interests granted. Compensation cost is recognized as expense over the requisite service period for vesting, typically five years. Compensation cost is re-measured each period with any incremental changes in value subsequent to the grant date expensed over the remaining vesting period. Changes in value that occur after the end of the vesting period are recorded as compensation cost in the period in which the changes occur through settlement of the interests.
Distributions of the Partnership’s net income associated with Class B interests is recorded to Compensation and benefits expense
Distribution fees
Artisan Funds has authorized certain financial services companies, broker-dealers, banks or other authorized agents, and in some cases, other organizations designated by an authorized agent (with their designees, collectively “authorized agents”) to accept purchase, exchange, and redemption orders for shares of Artisan Funds on the Funds’ behalf. Many authorized agents charge a fee for accounting and shareholder services provided to Fund shareholders on the Fund’s behalf. Those services typically include recordkeeping, transaction processing for shareholders’ accounts, and other services. The fee is either based on the number of accounts to which the intermediary provides such services or a percentage of the average daily value of Fund shares held in such accounts. The Funds pay a portion of such fees, which are intended to compensate the authorized agent for its provision of services of the type that would be provided by the Fund’s transfer agent or other service providers if the shares were registered directly on the books of the Fund’s transfer agent. Artisan pays the balance of those fees which includes compensation to the authorized agent for its distribution and marketing of Artisan Funds shares.
Distribution fees paid to authorized agents were as follows:
| For the years ended December 31, | ||||||||||||
| 2011 | 2010 | 2009 | ||||||||||
| Total fees paid to authorized agents |
$ | 86,166 | $ | 74,929 | $ | 55,854 | ||||||
| Less: Fees paid by Artisan Funds |
61,431 | 52,843 | 39,036 | |||||||||
|
|
|
|
|
|
|
|||||||
| Fees paid by Artisan |
24,735 | 22,086 | 16,818 | |||||||||
| Other marketing expenses |
1,439 | 936 | 965 | |||||||||
|
|
|
|
|
|
|
|||||||
| Total distribution and marketing |
$ | 26,174 | $ | 23,022 | $ | 17,783 | ||||||
|
|
|
|
|
|
|
|||||||
Accrued fees to intermediaries as of December 31, 2011 and 2010 were $3,075 and $2,044, respectively.
Leases
Rent under non-cancelable operating leases with scheduled rent increases is accounted for on a straight-line basis over the lease term, beginning on the date of initial possession or the effective date of the lease
F-23
Table of Contents
agreement. Allowances and other lease incentives provided by Artisan’s landlords are amortized on a straight-line basis as a reduction of rent expense. The difference between straight-line rent expense and rent paid and the unamortized deferred lease costs and build-out allowances are recorded as Deferred lease obligations in the Consolidated Statements of Financial Condition. As of December 31, 2011 and 2010, Artisan did not have any capital leases.
Loss contingencies
Artisan considers the assessment of loss contingencies as a significant accounting policy because of the significant uncertainty relating to the outcome of any potential legal actions and other claims and the difficulty of predicting the likelihood and range of the potential liability involved, coupled with the material impact on our results of operations that could result from legal actions or other claims and assessments. Artisan recognizes estimated costs to defend as incurred. Potential loss contingencies are reviewed at least quarterly and are adjusted to reflect the impact and status of settlements, rulings, advice of counsel and other information pertinent to a particular matter. Significant differences could exist between the actual cost required to investigate, litigate and/or settle a claim or the ultimate outcome of a suit and management’s estimate. These differences could have a material impact on Artisan’s results of operations, financial position, or cash flows. Recoveries of losses are recognized in the Consolidated Statements of Operations when receipt is deemed probable. At December 31, 2011, APLP has been named as defendant in a lawsuit challenging the investment advisory fees it charged to certain Artisan Funds managed by it. See Note 10, “Indemnifications”, for additional details. No loss contingencies were recorded at December 31, 2011, 2010, and 2009.
Commitments and contingencies
Under the terms of the Partnership Agreement, the Class C limited partnership interests entitle their holders to preferential distributions upon the occurrence of certain events and a right to require the Partnership to redeem the Class C limited partnership interests for an aggregate amount of $357,194 on July 3, 2016 under certain circumstances.
Income taxes
Artisan Partners Holdings is organized as a limited partnership and is taxed as a partnership for United States income tax purposes and therefore, files federal and state flow through income tax returns. As a result, no U.S. current or deferred income tax assets or liabilities are reflected in these financial statements. Each of Artisan Partners Holdings’ partners is obligated to report that partner’s proportionate share of Artisan Partners Holdings’ taxable income or loss. The income tax provision consists of foreign income taxes of UKCo. UKCo is the founder member of Artisan UK. UKCo is a private limited corporation and pays corporate tax in the United Kingdom. UKCo records a tax liability for corporation tax at the current rates on the excess of taxable income over allowable expenses. During the years ended December 31, 2011, 2010 and 2009, UKCo incurred $1,162, $1,281 and $0 in UK corporate tax, respectively.
Artisan accounts for uncertain income tax positions by recognizing the impact of a tax position in its consolidated financial statements when Artisan believes it is more likely than not that the tax position would not be sustained upon examination by the appropriate tax authorities based on the technical merits of the position. Interest and penalties relating to tax liabilities are recognized on actual tax liabilities and exposure items. Interest is accrued according to the provisions of the relevant tax law and is reported as Interest expense in the Consolidated Statements of Operations. Penalties are accrued when Artisan expects to take the related position in its tax return and are reported as Other income (loss) within the Non-operating income (loss) section of the Consolidated Statements of Operations.
Comprehensive income (loss)
Total comprehensive income (loss) includes all changes in equity except those resulting from investments by partners and distributions to partners and is reported in the Consolidated Statements of Changes in
F-24
Table of Contents
Partners’ Equity (Deficit), Accumulated Other Comprehensive Income (Loss) and Redeemable Class C Interests. Total comprehensive income (loss) includes net income and other comprehensive income. Other comprehensive income consists of the change in unrealized gains (losses) on available-for-sale investments, the change in unrealized net gain (loss) on the interest rate swaps and foreign currency translation.
Accumulated Other Comprehensive Income (Loss) in the accompanying Consolidated Statements of Changes in Partners’ Equity (Deficit), Accumulated Other Comprehensive Income (Loss) and Redeemable Class C Interests consists of the following:
| As of December 31, | ||||||||||||
| 2011 | 2010 | 2009 | ||||||||||
| Unrealized gain on investments |
$ | 68 | $ | 130 | $ | 591 | ||||||
| Unrealized loss on interest rate swap |
— | (6,434 | ) | (21,747 | ) | |||||||
| Foreign currency translation |
(75 | ) | (57 | ) | — | |||||||
|
|
|
|
|
|
|
|||||||
| $ | (7 | ) | $ | (6,361 | ) | $ | (21,156 | ) | ||||
|
|
|
|
|
|
|
|||||||
Partnership distributions
Artisan makes distributions of its net income to its partners for income taxes as required under the terms of the Partnership Agreement. Tax distributions are calculated utilizing the highest combined individual federal, state and local income tax rate among the various locations in which the partners, as a result of owning their interests in the Partnership, are subject to tax, assuming maximum applicability of the phase-out of itemized deductions contained in the Internal Revenue Code, multiplied by each partner’s share of taxable income. Artisan also makes distributions of its net income under the terms of the Partnership Agreement. Distributions are recorded in the financial statements on the payment date. Partnership distributions totaled $122,822, $54,338 and $21,852 for the years ended December 31, 2011, 2010 and 2009, respectively, and are reported as the sum of Distributions on Class B liability awards within the Consolidated Statements of Operations and Partnership distributions within the Consolidated Statements of Changes in Partners’ Equity (Deficit), Accumulated Other Comprehensive Income (Loss) and Redeemable Class C Interests. Partnership distributions totaling $19,808 were made in January 2012.
Recent accounting pronouncements
In June 2011, the Financial Accounting Standards Board (“FASB”) issued ASU 2011-05 which amends the Presentation of Comprehensive Income Topic, or Topic 220, of the FASB Accounting Standards Codification (“ASC”). This update, which was further amended by ASU 2011-12, eliminates the option to present other comprehensive income in the Statement of Changes in Partners’ Equity (Deficit) and Accumulated Other Comprehensive Income (Loss). Two alternatives are provided; an entity can elect to present items of net income and other comprehensive income in one continuous financial statement or in two separate, but consecutive financial statements. In both choices, an entity is required to present each component of net income along with total net income, each component of other comprehensive income along with a total for other comprehensive income, and a total amount for comprehensive income. The amendments in this update do not change the items that must be reported in other comprehensive income or when an item of other comprehensive income must be reclassified to net income. This is not applicable until interim periods starting in 2012, but early adoption is permitted. Artisan has chosen not to adopt the amendments to this Topic before the required compliance date.
In May 2011, the FASB issued ASU 2011-04, which updates the disclosure guidance in the Fair Value Measurements and Disclosures Topic, or ASU Topic 820. This update clarifies the application of existing fair value measurement requirements, changes certain principles related to measuring fair value, and requires additional disclosures about fair value measurements. Required disclosures are expanded under the new guidance, particularly for fair value measurements that are categorized within Level 3 of the fair value hierarchy, for which quantitative information about the unobservable inputs used and a narrative description
F-25
Table of Contents
of the valuation processes in place will be required. ASU 2011-04 is effective for annual periods beginning after December 15, 2011 and is to be applied prospectively. Artisan is currently assessing the impact of this guidance on its financial statements.
| 3. | Investment securities |
The disclosures below include details of Artisan’s investments. Investments held by consolidated investment products are detailed in Note 7, “Consolidated Investment Products”.
| Cost | Unrealized Gains |
Unrealized Losses |
Fair Value | |||||||||||||
| At December 31, 2011: |
$ | 17,194 | $ | 68 | $ | — | $ | 17,262 | ||||||||
| Equity mutual funds |
||||||||||||||||
| At December 31, 2010: |
||||||||||||||||
| Equity mutual funds |
$ | 1,047 | $ | 131 | $ | (1 | ) | $ | 1,177 | |||||||
Artisan’s investments in equity mutual funds consist of Artisan Funds and are considered to be available-for-sale securities. As a result, unrealized gains (losses) are recorded to Accumulated other comprehensive income (loss), a component of Partners’ Equity (Deficit).
Upon sale of available-for-sale securities, net realized gains of $58, $673, and $0 were transferred from accumulated other comprehensive income into the Consolidated Statements of Operations during the years ended December 31, 2011, 2010, and 2009, respectively. The specific identification method is used to determine the realized gain or loss on securities sold. See the Consolidated Statements of Cash Flows for proceeds from the sale of investment securities.
As of December 31, 2011, Artisan held no available-for-sale securities in an unrealized loss position.
As of December 31, 2010, available-for-sale securities in an unrealized loss position were considered temporary and were attributable to deteriorating market conditions as a result of the global recession, the ongoing credit crisis, and a loss of global investor confidence. Since Artisan had the ability and intent to hold those investments for a reasonable period of time sufficient for a forecasted recovery of fair value, these investments were not considered to be other-than-temporarily impaired. No impairment losses were recorded on these available-for-sale securities.
For securities in unrealized loss positions for which other-than-temporary impairments have not been recognized, the aggregate amount of unrealized losses, the aggregate related fair value, and the length of time that these securities have remained in unrealized loss positions were as follows:
| Less than 12 Months | 12 Months or More | Total | ||||||||||||||||||||||
| Fair Value |
Unrealized Losses |
Fair Value |
Unrealized Losses |
Fair Value |
Unrealized Losses |
|||||||||||||||||||
| At December 31, 2010: |
||||||||||||||||||||||||
| Equity mutual funds |
$ | — | $ | — | $ | 12 | $ | (1 | ) | $ | 12 | $ | (1 | ) | ||||||||||
| 4. | Fair value measurements |
The fair value of Artisan’s financial instruments is presented in the table below. The fair value of financial instruments held by consolidated investment products is presented in Note 7, “Consolidated Investment Products”.
In accordance with ASC 820, fair value is defined as the price that Artisan would receive upon selling an investment in an orderly transaction to an independent buyer in the principal or most advantageous market of the investment. The following three-tier fair value hierarchy prioritizes the inputs used in measuring fair value: Level 1—observable inputs such as quoted prices in active markets for identical securities; Level 2—other significant observable inputs (including but not limited to quoted prices for similar securities, interest rates, prepayment speeds, credit risk, etc.); Level 3—significant unobservable inputs (including Artisan’s
F-26
Table of Contents
own assumptions in determining the fair value of investments). For investments recorded at fair value, Artisan measures fair value using quoted market prices for identical assets. For interest rate swaps and the note payable, Artisan measures fair value using a calculation of the expected cash flows under the terms of each specific contract discounted to a present value. The calculation may include numerical procedures such as interpolation of LIBOR yield curves when input values do not directly correspond to the observable market data.
The following provides the hierarchy of inputs used to derive fair value of Artisan’s assets and liabilities as of December 31, 2011 and 2010:
| Assets and Liabilities at Fair Value: |
||||||||||||||||
| Total | (Level 1) | (Level 2) | (Level 3) | |||||||||||||
| December 31, 2011 |
||||||||||||||||
| Assets |
||||||||||||||||
| Cash and cash equivalents |
$ | 126,956 | $ | 126,956 | $ | — | $ | — | ||||||||
| Equity mutual funds |
17,262 | 17,262 | — | — | ||||||||||||
| Liabilities |
||||||||||||||||
| Interest rate swaps |
$ | 1,066 | $ | — | $ | 1,066 | $ | — | ||||||||
| Note payable |
324,268 | — | 324,268 | — | ||||||||||||
| December 31, 2010 |
||||||||||||||||
| Assets |
||||||||||||||||
| Cash and cash equivalents |
$ | 158,987 | $ | 158,987 | $ | — | $ | — | ||||||||
| Equity mutual funds |
1,177 | 1,177 | — | — | ||||||||||||
| Interest rate swaps |
563 | — | 563 | — | ||||||||||||
| Liabilities |
||||||||||||||||
| Interest rate swaps |
$ | 6,130 | $ | — | $ | 6,130 | $ | — | ||||||||
| Note payable |
378,251 | — | 378,251 | — | ||||||||||||
There were no transfers between Level 1 and Level 2 securities during the years ended December 31, 2011 and 2010. There were no Level 3 investments held during the years ended December 31, 2011 and 2010.
| 5. | Note payable |
On July 3, 2006, as part of the Recapitalization Transactions, Artisan Partners Holdings entered into an unsecured $400,000 five-year term loan agreement with a syndicate of lenders (the “Term Loan agreement” or “Term Loan”).
In November 2010, Artisan amended the Term Loan agreement. The aggregate outstanding principal amount of the loan was reduced to $380,000. The maturity date of the loan was extended to July 1, 2013 for $363,000 of the loan outstanding. The remaining $17,000 of the loan matured on July 1, 2011. Under the amended agreement, the Term Loan generally bears interest at a rate equal to, at Artisan’s election, (i) LIBOR plus an applicable margin depending on Artisan Partners Holdings’ leverage ratio or (ii) an alternate base rate plus an applicable margin depending on Artisan Partners Holdings’ leverage ratio. As of December 31, 2011 and 2010, the interest rate on the note payable was 2.77% and 3.21%, respectively.
Beginning with the fiscal quarter ended March 31, 2011, the amended Term Loan agreement requires principal payments of $10,000 on the last business day of each fiscal quarter in which the aggregate principal amount of the loan is greater than $250,000. Following the repayment in full of the $17,000 of the loan that matured on July 1, 2011, the amount of each quarterly payment was reduced by the portion that would have been allocated to that portion of the loan. Since the fiscal quarter ended September 30, 2011, Artisan has been required to make additional principal payments in an amount equal to 50% of excess cash flow (as defined in the Term Loan agreement) for such fiscal quarter and will continue to be required to do so until the outstanding principal amount is equal to or less than $250,000. There was excess cash flow as defined in the Term Loan agreement for the quarter ended December 31, 2011, which will result in an additional principal payment of $16,311 to be paid on or before April 9, 2012.
F-27
Table of Contents
Interest expense incurred on the note payable was $10,645, $8,086, and $9,289 for the years ended December 31, 2011, 2010, and 2009, respectively.
The Term Loan agreement includes various restrictive covenants regarding the Partnership’s leverage ratio and interest coverage ratio, and imposes restrictions on additional indebtedness. Artisan Partners Holdings has been in compliance with all loan covenants since inception of the Term Loan. Pursuant to the Term Loan agreement, Artisan Partners Holdings is generally restricted from making cash distributions to its partners in respect of their partnership interests therein (other than to fund the payment of taxes owed by the partners as a result of their partnership interests) when Artisan Partners Holdings’ leverage ratio exceeds 2.75 to 1.00. Artisan’s leverage ratio was 1.64 and 2.27 as of December 31, 2011 and 2010, respectively. There were no restrictions on cash distributions as of December 31, 2011.
The aggregate scheduled maturities of long-term debt obligations of the Partnership’s long-term debt obligations are as follows at December 31, 2011:
| 2012 |
$ | 54,521 | ||
| 2013 |
270,268 | |||
|
|
|
|||
| $ | 324,789 | |||
|
|
|
| 6. | Derivative instruments |
Effective July 7, 2006, Artisan Partners Holdings executed 5-year amortizing interest rate swap contracts with two counterparties that had a combined total notional value of $400,000 upon issuance. The total notional value of these swap contracts amortized to $350,000 on April 7, 2008, to $300,000 on April 7, 2009, to $250,000 on April 7, 2010, and to $200,000 on April 7, 2011. These interest rate swaps matured on July 1, 2011. The counterparties under these interest rate swap contracts paid Artisan Partners Holdings variable interest at the three-month LIBOR rate ( 0.29% as of December 31, 2010), and Artisan Partners Holdings paid the counterparties a fixed interest rate of 5.689%.
Effective November 22, 2010, Artisan Partners Holdings executed a forward starting interest rate swap with a counterparty that had a total notional value of $200,000 upon issuance, a start date of July 1, 2011, and a final maturity date of July 1, 2013. The counterparty under this forward starting interest rate swap contract pays Artisan Partners Holdings variable interest at the three-month LIBOR rate (0.38% and 0.29% as of December 31, 2011 and 2010, respectively), and Artisan Partners Holdings pays the counterparty a fixed interest rate of 1.04%. This forward starting interest rate swap was entered into to convert the amended Term Loan into fixed rate debt to the extent of the notional value of the swap contract to manage interest rate risk on the amended Term Loan. Based on the terms of the forward starting interest rate swap contract and the amended Term Loan, the forward starting interest rate swap contract was determined to qualify as a cash flow hedge.
On December 14, 2011, Artisan discontinued the hedge accounting relationship related to its $200,000 notional interest rate swap as the hedged forecasted transaction was no longer probable of occurring. During the year ended December 31, 2011, the net impact of the discontinued hedge accounting relationship was an increase of $1,933 to Loss on interest rate swap, inclusive of a $2,264 cumulative unrealized loss that was reclassified from Accumulated other comprehensive income (loss) into current earnings. All future fair value changes of the derivative will be recognized in current earnings. Artisan continues to hold the derivative instrument as it generally provides an economic hedge of the benchmark interest rate, enabling Artisan to convert the amended Term Loan into fixed rate debt to the extent of the notional value of the swap contract to manage interest rate risk on the amended Term Loan.
Net interest expense incurred on the interest rate swaps were $6,884, $14,277, and $15,054 for the years ended 2011, 2010 and 2009, respectively.
F-28
Table of Contents
Fair Values of Derivative Instruments
| Asset Derivatives | Liability Derivatives | |||||||||||
|
Derivatives designated as hedging instruments under FASB ASC 815-20 (a) |
Balance Sheet Location |
Fair Value |
Balance Sheet Location |
Fair Value |
||||||||
| As of December 31, 2011 |
||||||||||||
| Interest rate swap |
$ | — | Interest rate swap | $ | 1,066 | |||||||
|
|
|
|
|
|||||||||
| Total derivatives not designated as hedging |
$ | $ | 1,066 | |||||||||
|
|
|
|
|
|||||||||
| Derivatives designated as hedging instruments under FASB ASC 815-20 |
||||||||||||
| As of December 31, 2010 |
||||||||||||
| Interest rate swap |
$ | — | Interest rate swap | $ | 6,130 | |||||||
| Forward starting interest rate swap |
Other assets | 563 | — | |||||||||
|
|
|
|
|
|||||||||
| Total derivatives designated as hedging |
$ | 563 | $ | 6,130 | ||||||||
|
|
|
|
|
|||||||||
| (a) | Refer to disclosures within this footnote for additional information on Artisan’s purpose for holding derivative instruments not designated as hedging instruments under FASB ASC 815-20. |
The Effect of Derivative Instruments on the Statements of Operations
| Derivatives in Subtopic 815-20 Cash |
Amount of Gain or (Loss) Recognized in Other Comprehensive Income on Derivative (Effective Portion) |
Location of Gain |
Amount of Gain or (Loss) Reclassified from Accumulated Other Comprehensive Income into Income (Effective Portion) |
Location of Gain |
Amount of Gain or (Loss) recognized in Income on Derivative (Ineffective Portion) |
|||||||||||
| For the Year Ended December 31, 2011 |
||||||||||||||||
| Interest rate swap |
$ | 6,130 | Interest expense | $ | (6,139 | ) | $ | — | ||||||||
| Interest rate swap (b) |
304 | Interest expense | (745 | ) | Gain (loss) on swap fair value |
(1,933 | ) | |||||||||
|
|
|
|
|
|
|
|||||||||||
| Total |
$ | 6,434 | $ | (6,884 | ) | $ | (1,933 | ) | ||||||||
|
|
|
|
|
|
|
|||||||||||
| For the Year Ended December 31, 2010 |
||||||||||||||||
| Interest rate swap |
$ | 15,617 | Interest expense | $ | (14,277 | ) | $ | — | ||||||||
| Forward starting interest rate swap |
(304 | ) | — | Gain (loss) on swap fair value | 866 | |||||||||||
|
|
|
|
|
|
|
|||||||||||
| Total |
$ | 15,313 | $ | (14,277 | ) | $ | 866 | |||||||||
|
|
|
|
|
|
|
|||||||||||
| For the Year Ended December 31, 2009 |
||||||||||||||||
| Interest rate swap |
$ | 7,673 | Interest expense | $ | (15,054 | ) | $ | — | ||||||||
| Forward starting interest rate swap |
— | — | — | |||||||||||||
|
|
|
|
|
|
|
|||||||||||
| Total |
$ | 7,673 | $ | (15,054 | ) | $ | — | |||||||||
|
|
|
|
|
|
|
|||||||||||
| (b) | On December 14, 2011 Artisan discontinued the hedge accounting relationship under FASB ASC 815-20 for the interest rate swap with a start date of July 1, 2011. |
F-29
Table of Contents
| 7. | Consolidated investment products |
Launch Equity commenced operations on July 25, 2011. Artisan’s variable interest represents its equity interest in the fund. Artisan receives management and incentive fees for the services it provides as investment advisor to Launch Equity. These fees may also be considered variable interests. In the ordinary course of business, Artisan may choose to waive certain fees or assume operating expenses of the fund.
In determining whether it is the primary beneficiary of Launch Equity, Artisan considered both qualitative and quantitative factors such as voting rights of the equity holders, economic participation of all parties, including how fees are earned by Artisan, related party ownership and the level of involvement Artisan had in the design of the VIE. Artisan concluded it was the primary beneficiary of the private investment fund since, although it holds a minimal equity interest in the fund, it retains all control in the management and affairs of the fund and the fund was designed to attract third party investors to provide an economic benefit to Artisan.
Artisan’s risk with respect to investments in consolidated investment products is limited to its equity ownership of $1. Therefore, the gains or losses of consolidated investment products have not had a significant impact on Artisan’s results of operations, liquidity or capital resources. Artisan has no right to the benefits from, nor does it bear the risks associated with these investments, beyond Artisan’s minimal direct investments in the investment products. If Artisan were to liquidate, these investments (other than our direct investment of $1) would not be available to the general creditors of the company and as a result, Artisan does not consider investments held by consolidated investment products to be company assets.
The following tables reflect the impact of consolidation of investment products into the Consolidated Statement of Financial Condition and Consolidated Statement of Operations as of and for the year ended December 31, 2011.
Condensed Consolidating Statement of Financial Condition
| Before Consolidation |
Launch Equity | Eliminations | As Reported | |||||||||||||
| As of December 31, 2011: |
||||||||||||||||
| Cash and cash equivalents |
$ | 126,956 | $ | — | $ | — | $ | 126,956 | ||||||||
| Cash and cash equivalents of consolidated investment products |
— | 5,142 | — | 5,142 | ||||||||||||
| Accounts receivable |
39,417 | 37 | 39,454 | |||||||||||||
| Investment securities of consolidated investment products |
1 | 24,265 | (1 | ) | 24,265 | |||||||||||
| Other assets |
29,034 | — | — | 29,034 | ||||||||||||
|
|
|
|
|
|
|
|
|
|||||||||
| Total assets |
$ | 195,408 | $ | 29,444 | $ | (1 | ) | $ | 224,851 | |||||||
|
|
|
|
|
|
|
|
|
|||||||||
| Liabilities of consolidated investment products |
$ | — | $ | 6,276 | $ | — | $ | 6,276 | ||||||||
| Other liabilities |
502,473 | — | — | 502,473 | ||||||||||||
|
|
|
|
|
|
|
|
|
|||||||||
| Total liabilities |
502,473 | 6,276 | — | 508,749 | ||||||||||||
| Total equity attributable to Artisan Partners Holdings |
(307,065 | ) | 1 | (1 | ) | (307,065 | ) | |||||||||
| Noncontrolling interest in consolidated investment products |
— | 23,167 | — | 23,167 | ||||||||||||
|
|
|
|
|
|
|
|
|
|||||||||
| Total liabilities and equity |
$ | 195,408 | $ | 29,444 | $ | (1 | ) | $ | 224,851 | |||||||
|
|
|
|
|
|
|
|
|
|||||||||
F-30
Table of Contents
Condensed Consolidating Statement of Operations
| Before Consolidation |
Launch Equity | Eliminations | As Reported | |||||||||||||
| Twelve Months Ended December 31, 2011: |
||||||||||||||||
| Total revenues |
$ | 455,191 | $ | — | $ | (97 | ) | $ | 455,094 | |||||||
| Total operating expenses |
300,896 | — | (97 | ) | 300,799 | |||||||||||
|
|
|
|
|
|
|
|
|
|||||||||
| Operating income |
154,295 | — | — | 154,295 | ||||||||||||
| Non-operating expenses |
(20,059 | ) | — | — | (20,059 | ) | ||||||||||
| Net losses of consolidated investment products |
— | (3,102 | ) | — | (3,102 | ) | ||||||||||
|
|
|
|
|
|
|
|
|
|||||||||
| Total non-operating expenses |
(20,059 | ) | (3,102 | ) | — | (23,161 | ) | |||||||||
| Income before income taxes |
134,237 | (3,102 | ) | — | 131,134 | |||||||||||
| Provision for income taxes |
1,162 | — | — | 1,162 | ||||||||||||
|
|
|
|
|
|
|
|
|
|||||||||
| Net income |
133,074 | (3,102 | ) | — | 129,972 | |||||||||||
| Net income attributable to noncontrolling interests |
— | 3,101 | — | 3,101 | ||||||||||||
|
|
|
|
|
|
|
|
|
|||||||||
| Net income attributable to Artisan Partners Holdings |
$ | 133,074 | $ | (1 | ) | $ | — | $ | 133,073 | |||||||
|
|
|
|
|
|
|
|
|
|||||||||
The carrying value of consolidated investment products is also their fair value. Short and long positions on equity securities are valued based upon closing market prices of the security on the principal exchange on which they are traded. The following table presents the fair value hierarchy levels of investments and liabilities held which are measured at fair value as of December 31, 2011:
| Assets and Liabilities at Fair Value as of: | ||||||||||||||||
| Total | (Level 1) | (Level 2) | (Level 3) | |||||||||||||
| December 31, 2011 |
||||||||||||||||
| Assets |
||||||||||||||||
| Equity securities – long position |
$ | 24,265 | $ | 24,265 | $ | — | $ | — | ||||||||
| Liabilities |
||||||||||||||||
| Equity securities – short position |
$ | 6,276 | $ | 6,276 | $ | — | $ | — | ||||||||
| 8. | Compensation and benefits |
Compensation and benefits expense is comprised of the following:
| For the Year Ended December 31, | ||||||||||||
| 2011 | 2010 | 2009 | ||||||||||
| Salaries, incentive compensation, and benefits |
$ | 198,601 | $ | 166,629 | $ | 132,888 | ||||||
| Distributions on Class B liability awards |
55,714 | 17,578 | 2,503 | |||||||||
| Change in value of Class B liability awards |
(21,082 | ) | 79,071 | 41,783 | ||||||||
|
|
|
|
|
|
|
|||||||
| Total compensation and benefits expense |
$ | (233,233 | ) | $ | 263,278 | $ | 177,174 | |||||
|
|
|
|
|
|
|
|||||||
Class B liability awards are granted to certain employees of APLP and a member of Artisan UK at the discretion of Artisan Partners Holdings’ general partner. All vested Class B liability awards are subject to mandatory redemption on termination of employment for any reason; unvested Class B liability awards are forfeited on termination of employment. Vested Class B liability awards of a terminated employee are redeemed in cash in annual installments generally over the five years following termination of employment. Prior to April 6, 2011, Class B liability awards were classified as share-based liability awards with
F-31
Table of Contents
measurement at intrinsic value under ASC 718. Intrinsic value was determined using the redemption formula of the Class B awards. Under the terms of the grant agreements, the redemption value of Class B interests was determined upon the termination of the holder’s employment and varied depending on the circumstances of the holder’s termination. As described later in this note, the redemption value of Class B interests was calculated assuming a holder’s termination of employment was the result of resignation or involuntary termination by Artisan. For individuals who had given notice of retirement in accordance with the terms of their grant agreements, the redemption value of the Class B liability awards was calculated using the retirement valuation.
As of December 31, 2011, the Class B limited partnership interests are reflected as liabilities measured at fair value, which is a significant estimate. As part of the calculation to estimate the fair value of each Class B partnership interest, we first determined the value of the business based on the probability weighted expected return method. This approach considers the value of the business, calculated using a discounted cash flow analysis and a market approach using earnings multiples of comparable entities, under various scenarios. Significant inputs included historical revenues and expenses, future revenue and expense projections, discount rates and market prices of comparable entities. The value of the business as determined is then adjusted to take into account working capital, debt and noncurrent liabilities associated with Class B partner redemptions and allocated to individual partnership interests based on their respective terms. The use of the discounted cash flow and market approaches to derive the fair value of the liability at a point in time can result in volatility to the financial statements as our current and projected financial results, and the results and earnings multiples of comparable entities, will change over time. The process for determining fair value has significant subjective elements and involves a high degree of management judgment and assumptions. These assumptions may have a significant effect on our estimates of fair value, and the use of different assumptions as well as changes in market conditions could have a material effect on our results of operations or financial condition. The aggregate redemption values and liabilities of this obligation are as follows:
| As of December 31, | ||||||||
| 2011 | 2010 | |||||||
| Redemption value: |
||||||||
| Vested Class B liability awards |
$ | 146,175 | $ | 168,801 | ||||
| Unvested Class B liability awards |
31,825 | 61,468 | ||||||
| Purchased Class B liability awards |
2,328 | 2,762 | ||||||
|
|
|
|
|
|||||
| Aggregate redemption value |
$ | 180,328 | $ | 233,031 | ||||
|
|
|
|
|
|||||
| Liabilities: |
||||||||
| Class B liability awards |
$ | 146,175 | $ | 168,801 | ||||
| Redeemed Class B liability awards |
14,909 | 17,221 | ||||||
At December 31, 2011 and 2010, the aggregate fair value and intrinsic value of unrecognized compensation cost for the unvested Class B interests was $31,825 and $61,468, respectively, with weighted average recognition periods of 2.38 years and 3.40 years remaining, respectively.
The Partnership redeems the Class B limited partner interests of partners whose employment by the Partnership terminates at a value determined in accordance with the terms of the grant agreement pursuant to which the interest was granted, which includes a premium in the case of employment terminated by reason of death, disability or retirement. Termination of employment by reason of death or disability is not probable and therefore, the premium is not included in the redemption value. In order for a termination of employment to qualify as a retirement, the retiring employee must have 10 years or more of service as of the date of retirement and must have given Artisan written notice of the intention to retire at least three years prior to the date of retirement, subject to Artisan’s right, at its discretion, to accept a period of notice that is shorter, but not less than one year. However, in the event the employee is terminated for any reason during the additional period of employment, the retirement premium is no longer applicable. As a result of the
F-32
Table of Contents
terms described above, the redemption value of the Class B limited partner interests classified as liabilities does not reflect the premium until Artisan has accepted the individual’s retirement notification and effectively becomes obligated to pay the premium. Prior to that event, the redemption value of Class B interests has been calculated assuming a holder’s termination of employment was the result of resignation or involuntary termination by Artisan and has been recorded as Class B liability award on the Consolidated Statements of Financial Condition. For individuals who have given notice of retirement in accordance with their grant agreements and such notification has been accepted by Artisan, the redemption value of the Class B interests has been calculated using the retirement valuation as of the notice date.
As of December 31, 2011, two partners had given notice of their intention to retire pursuant to the terms of their grant agreements. The Class B limited partner interests of partners whose services to the Partnership terminated on or before December 31, 2011, will be redeemed for payments totaling $14,909, paid over the next five years.
In connection with the two announced retirements as described above and in accordance with the Partnership Agreement and each Class B Partner’s grant agreement, the redemption value of the Class B interests was increased to reflect the premium associated with the anticipated redemptions by reason of retirement. Since this premium applies only upon retirement in accordance with the terms of the grant agreement and notice, the increase in redemption value is treated as a modification of a liability award as of the date Artisan receives the notice of intended retirement and effectively becomes obligated to pay the premium on redemption. This modification resulted in an initial increase in compensation expense of $7,621 for the year ended December 31, 2010, affecting the two Class B Partners. This expense will be recognized over the remaining period of employment of the partners giving notice of retirement (generally, three years from the date of Artisan’s receipt of written notice of retirement, subject to Artisan’s right, at its discretion, to accept a period of notice that is shorter, but not less than one year). The Class B interests continued to be carried at intrinsic value, reflecting the retirement premium, from the date of Artisan’s acceptance of the retirement notification through the date of the individual’s retirement and the payment obligation is fixed. Assuming all Class B holders’ redemption values were determined by retirement, death or disability, the redemption value of Class B interests would have been $276,517 and $317,373 at December 31, 2011 and 2010, respectively.
| 9. | Benefit plans |
Artisan has a 401(k) plan for its employees, under which it provides a matching contribution on employees’ pre-tax contributions. Expenses related to Artisan’s match for 2011, 2010 and 2009 were $3,367, $3,001 and $2,925, respectively, and are included in Compensation and benefits in the Consolidated Statements of Operations.
Artisan has an Equity Incentive Plan, which enables eligible employees to participate in Artisan’s financial growth and success. Designated employees receive an annual award of units. The appreciation of the units, if any, is based upon a stated formula and paid to vested participants three years after the award date. Expenses related to this plan for 2011, 2010 and 2009 were $645, $220 and $0, respectively, and are included in Compensation and benefits in the Consolidated Statements of Operations. The accrual at December 31, 2011 and 2010 for this plan was $865 and $220, respectively.
| 10. | Indemnifications |
In the normal course of business, Artisan enters into agreements that include indemnities in favor of third parties. Artisan Partners Holdings has also agreed to indemnify its general partner, the directors and officers of its general partner, its partners, employees and agents, and the members of Artisan Partners Holdings’ Advisory Committee in certain cases. Artisan Partners Holdings’ subsidiaries may also have similar agreements to indemnify their respective general partner(s), directors and officers of their general partner(s), partners, members, employees, and agents. Artisan’s maximum exposure under these arrangements is
F-33
Table of Contents
unknown, as this would involve future claims that may be made against Artisan that have not yet occurred. Artisan maintains insurance policies that may provide coverage against certain claims under these indemnities.
| 11. | Property and equipment |
The composition of property and equipment at December 31, 2011 and 2010 are as follows:
| December 31, | ||||||||
| 2011 | 2010 | |||||||
| Computers and equipment |
$ | 4,831 | $ | 4,205 | ||||
| Computer software |
4,255 | 3,922 | ||||||
| Furniture and fixtures |
2,500 | 2,052 | ||||||
| Leasehold improvements |
7,949 | 6,827 | ||||||
|
|
|
|
|
|||||
| Total cost |
19,535 | 17,007 | ||||||
| Less: Accumulated depreciation |
(13,963 | ) | (11,784 | ) | ||||
|
|
|
|
|
|||||
| Property and equipment, net of accumulated depreciation |
$ | 5,572 | $ | 5,223 | ||||
|
|
|
|
|
|||||
Depreciation expense for the years ended December 31, 2011, 2010 and 2009 amounted to $2,350, $2,281 and $2,381, respectively.
| 12. | Lease Commitments |
Artisan has lease commitments for office space, furniture, and equipment, which are accounted for as operating leases. Certain lease agreements provide for scheduled rent increases over the lease term. Artisan records rent expense for operating leases with scheduled rent increases on a straight-line basis over the term of the respective agreement. In addition, Artisan has received certain lease incentives, which are amortized on a straight-line basis over the term of the lease agreement. Rental expense for the years ended December 31, 2011, 2010 and 2009 was $7,476, $7,090 and $7,192, respectively.
At December 31, 2011, the aggregate future minimum payments for non-cancelable operating leases for each of the following five years and thereafter are as follows:
| 2012 |
$ | 6,958 | ||
| 2013 |
7,211 | |||
| 2014 |
4,453 | |||
| 2015 |
3,230 | |||
| 2016 and thereafter |
13,631 | |||
|
|
|
|||
| Total |
$ | 35,483 | ||
|
|
|
| 13. | Related party transactions |
Artisan engages in transactions with its affiliates in the ordinary course of business.
Affiliate transactions—Artisan Funds
Artisan has agreements to serve as the investment manager of Artisan Funds, with which certain Artisan employees are affiliated. Under the terms of the agreements with the Funds, which are generally reviewed and continued by the Funds’ board of directors at least annually, a fee is paid to Artisan based on an annual percentage of the average daily net assets of each Fund ranging from 0.64% to 1.25%. Revenues related to these services are generally collected by Artisan on the last business day of each month and are recorded in Management fees in the
F-34
Table of Contents
Consolidated Statement of Operations. Artisan has contractually agreed to waive its management fees or reimburse for expenses incurred to the extent necessary to limit annualized ordinary operating expenses incurred by Artisan Emerging Markets Fund, Artisan Global Value Fund, Artisan Growth Opportunities Fund and Artisan Global Equity Fund to not more than 1.50% of average daily net assets through February 1, 2013. In addition, Artisan may voluntarily waive fees or reimburse any of the Artisan Funds for other expenses. The officers and a director of Artisan Funds who are affiliated with Artisan receive no compensation from the Funds. At December 31, 2011 and 2010, respectively, accounts receivable included $195 and $792 due from the Funds.
Fees for managing the Funds and amounts waived or reimbursed by Artisan for fees and expenses (including management fees) are as follows:
| For the years ended December 31, | ||||||||||||
| 2011 | 2010 | 2009 | ||||||||||
| Investment management fees: |
||||||||||||
| Artisan Funds |
$ | 303,919 | $ | 261,535 | $ | 197,196 | ||||||
| Fee waiver / expense reimbursement: |
||||||||||||
| Artisan Funds |
$ | 374 | $ | 441 | $ | 689 | ||||||
Affiliate transactions—Artisan Global Funds
Artisan has agreements to serve as the investment manager and promoter of Artisan Partners Global Funds Public Limited Company (“Artisan Global Funds”), with which certain Artisan employees are affiliated. Artisan Global Funds is an open-ended investment company with variable capital and segregated liability between its sub-funds, organized under the laws of Ireland. Artisan Global Funds is authorized as a UCITS and offers shares to non-U.S. investors. Under the terms of the agreements with Artisan Global Funds, a fee is paid to Artisan based on an annual percentage of the average daily net assets of each fund ranging from 0.90% to 1.45%. Artisan earned no revenue from Artisan Global Funds in 2010 or 2009. Artisan reimburses each sub-fund of Artisan Global Funds to the extent that sub-fund’s expenses, not including Artisan’s fee, exceed certain levels, which are not more than 0.20% for the Emerging Markets Fund, not more than 0.35% for the Global Value Fund, and not more than 1.45% for the Value Fund. The directors of Artisan Global Funds who are affiliated with Artisan receive no compensation from the Artisan Global Funds. At December 31, 2011 and 2010, respectively, accounts receivable included $709 and $379 due from Artisan Global Funds.
Fees for managing Artisan Global Funds and amounts reimbursed to Artisan Global Funds by Artisan are as follows:
| For the years ended December 31, | ||||||||||||
| 2011 | 2010 | 2009 | ||||||||||
| Investment management fees: |
||||||||||||
| Artisan Global Funds |
$ | 1,255 | $ | — | $ | — | ||||||
| Fee waiver / expense reimbursement: |
||||||||||||
| Artisan Global Funds |
$ | 660 | $ | — | $ | — | ||||||
Affiliate transactions—Launch Equity
APLP has an agreement to serve as the investment manager of Launch Equity. Under the terms of APLP’s agreement with Launch Equity, Artisan earns a quarterly fee based on the value of the closing capital account of each limited partner for the quarter, at the rate of 1.00% (annualized). At Artisan’s discretion, the fee may be waived and certain expenses reimbursed to the extent they exceed a certain level. Artisan expects to waive 100% of Artisan’s quarterly fee and reimburse Launch Equity for all operating expenses, and Artisan may waive other expenses at Artisan’s discretion. Artisan Alternatives is entitled to receive an allocation of profits from Launch Equity equal to 20% of Launch Equity’s net capital appreciation
F-35
Table of Contents
(“incentive fee”) as determined at the conclusion of its fiscal year, which also may be waived at Artisan’s discretion. Artisan waived the incentive fee for the year ended December 31, 2011. Expense reimbursements totaled $150 for the year ended December 31, 2011.
Affiliate transactions—AIC
Artisan Partners Holdings has cost sharing arrangements with its current general partner, AIC, as well as AIC’s beneficial owners, Andrew A. Ziegler, and Carlene M. Ziegler, who is an employee of APLP, pursuant to which Artisan Partners Holdings and certain of its employees provide certain administrative services to AIC and its owners, and AIC and its owners reimburse Artisan Partners Holdings for the costs related to such services. In addition, Artisan Partners Holdings has obtained and paid for insurance policies covering potential liability AIC may incur as general partner of Artisan Partners Holdings. At December 31, 2011 and 2010, accounts receivable included $189 and $236 due from AIC, respectively.
| 14. | Income taxes |
As a limited partnership, Artisan Partners Holdings has not made a provision for income taxes because it is not subject to Federal or state income tax. It is the responsibility of Artisan Partners Holdings’ partners to separately report their proportionate share of Artisan Partners Holdings’ taxable income or loss.
Accounting standards establish a minimum threshold for recognizing, and a system for measuring, the benefits of income tax return positions in financial statements. The impact of recognizing expense related to uncertain tax positions was immaterial to the consolidated financial statements.
Artisan files income tax returns in the U.S. federal jurisdiction and various state and foreign jurisdictions. Artisan has open tax years for which the company could be subject to income tax examination by U.S. federal and state tax authorities for years 2007 through 2011, depending on the jurisdiction. In addition, Artisan has open tax years in its primary foreign jurisdiction for the 2010 and 2011 years. The Company is currently under audit by one local jurisdiction.
| 15. | Litigation matters |
In the normal course of business, Artisan may be subject to various legal proceedings from time to time. As of December 31, 2011, APLP is the defendant in a lawsuit challenging the investment advisory fees it charged to certain Artisan Funds managed by it. Reso v. Artisan Partners Limited Partnership, (E.D. Wis. Case No. 2:11-cv-873-JPS). The action was filed in June 2011 by a fund investor asserting breach of fiduciary duty under Section 36(b) of the Investment Company Act of 1940, as amended, with respect to Artisan International Fund, Artisan International Value Fund and Artisan Mid Cap Value Fund. The plaintiff seeks declaratory and injunctive relief, rescission and restitution, as well as an award of compensatory damages in an unspecified amount. APLP is defending the lawsuit vigorously. The Partnership is unable to predict the outcome of this proceeding or its effect on the Partnership, or estimate the range of potential liability, if any. Artisan maintains an insurance policy providing coverage for certain claims first made while the policy is in force. That policy provides coverage for Costs of Defense, as defined in the policy, incurred by Artisan in excess of a retention of $1,000, which retention amount was reached during 2011. Costs of Defense are paid by Artisan and recorded as expenses as incurred on the Statement of Operations as General and administrative expense. As reimbursement for Costs of Defense in excess of the retention amount is probable, Artisan has recorded a receivable on the Statement of Financial Condition in Accounts receivable to reflect the offsetting recovery.
F-36
Table of Contents
| 16. | Quarterly information (unaudited) |
The following table presents unaudited quarterly results of operations for 2011 and 2010. These quarterly results reflect all normal recurring adjustments that are, in the opinion of management, necessary for a fair statement of the results. Revenues and net income can vary significantly from quarter to quarter due to the nature of Artisan’s business activities.
| For the Quarter Ended | ||||||||||||||||
| March 31, 2010 | June 30, 2010 | Sept. 30, 2010 | Dec. 31, 2010 | |||||||||||||
| Total Revenues |
$ | 91,053 | $ | 91,883 | $ | 92,483 | $ | 106,867 | ||||||||
| Operating Income (Loss) |
$ | 23,828 | $ | 12,625 | $ | 30,551 | $ | (1,806 | ) | |||||||
| Net Income (Loss) |
$ | 18,263 | $ | 7,319 | $ | 25,307 | $ | (8,362 | ) | |||||||
| For the Quarter Ended | ||||||||||||||||
| March 31, 2011 | June 30, 2011 | Sept. 30, 2011 | Dec. 31, 2011 | |||||||||||||
| Total Revenues |
$ | 112,945 | $ | 120,210 | $ | 110,284 | $ | 111,655 | ||||||||
| Operating Income (Loss) |
$ | 17,150 | $ | 39,988 | $ | 70,462 | $ | 26,695 | ||||||||
| Net Income (Loss) |
$ | 10,115 | $ | 34,068 | $ | 67,141 | $ | 21,749 | ||||||||
| 17. | Subsequent Events |
Artisan evaluated subsequent events through the issuance date of its financial statements, and determined that no subsequent events had occurred that would require additional disclosures, other than partnership distributions disclosed in Note 2.
F-37
Table of Contents
ARTISAN PARTNERS HOLDINGS LP AND SUBSIDIARIES
Unaudited Consolidated Statements of Financial Condition
(U.S. dollars in thousands)
| Pro
forma June 30, 2012 (Note 12) |
At June
30, 2012 |
At December
31, 2011 |
||||||||||
| ASSETS | ||||||||||||
| Cash and cash equivalents |
$ | $ | 172,084 | $ | 126,956 | |||||||
| Cash and cash equivalents of consolidated investment products |
7,949 | 5,142 | ||||||||||
| Accounts receivable |
43,090 | 39,454 | ||||||||||
| Investment securities |
18,500 | 17,262 | ||||||||||
| Investment securities of consolidated investment products |
28,575 | 24,265 | ||||||||||
| Prepaid expenses |
3,692 | 3,280 | ||||||||||
| Debt issuance costs |
726 | 1,090 | ||||||||||
| Property and equipment, net |
6,215 | 5,572 | ||||||||||
| Restricted cash |
1,040 | 1,040 | ||||||||||
| Other |
938 | 790 | ||||||||||
|
|
|
|
|
|
|
|||||||
| Total assets |
$ | $ | 282,809 | $ | 224,851 | |||||||
|
|
|
|
|
|
|
|||||||
| LIABILITIES, REDEEMABLE CLASS C INTERESTS AND PARTNERS’ EQUITY (DEFICIT) | ||||||||||||
| Accounts payable, accrued expenses, and other liabilities |
$ | $ | 12,624 | $ | 9,274 | |||||||
| Accrued incentive compensation |
50,322 | 3,920 | ||||||||||
| Deferred lease obligations |
2,995 | 2,340 | ||||||||||
| Interest rate swap |
1,118 | 1,066 | ||||||||||
| Note payable |
289,373 | 324,789 | ||||||||||
| Class B liability awards |
171,822 | 146,175 | ||||||||||
| Class B redemptions payable |
15,422 | 14,909 | ||||||||||
| Partner distributions payable |
$ | 178,030 | ||||||||||
| Payables of consolidated investment products |
1,453 | — | ||||||||||
| Securities sold, not yet purchased of consolidated investment products |
6,375 | 6,276 | ||||||||||
|
|
|
|
|
|
|
|||||||
| Total liabilities |
$ | 729,534 | 551,504 | 508,749 | ||||||||
|
|
|
|
|
|
|
|||||||
| Commitments and contingencies |
||||||||||||
| Redeemable Class C interests |
357,194 | 357,194 | ||||||||||
| Partners’ deficit |
(832,625 | ) | (654,595 | ) | (664,259 | ) | ||||||
|
|
|
|
|
|
|
|||||||
| Total deficit attributable to Artisan Partners Holdings LP |
(475,431 | ) | (297,401 | ) | (307,065 | ) | ||||||
| Noncontrolling interest in consolidated entities |
28,706 | 23,167 | ||||||||||
|
|
|
|
|
|
|
|||||||
| Total equity (deficit) |
(446,725 | ) | (268,695 | ) | (283,898 | ) | ||||||
|
|
|
|
|
|
|
|||||||
| Total liabilities, redeemable Class C interests and partners’ equity (deficit) |
$ | 282,809 | $ | 282,809 | $ | 224,851 | ||||||
|
|
|
|
|
|
|
|||||||
The accompanying notes are an integral part of the consolidated financial statements.
F-38
Table of Contents
ARTISAN PARTNERS HOLDINGS LP AND SUBSIDIARIES
Unaudited Consolidated Statements of Operations
(U.S. dollars in thousands)
| For the Six Months Ended June 30, |
||||||||
| 2012 | 2011 | |||||||
| Revenues |
||||||||
| Management fees |
$ | 240,147 | $ | 232,521 | ||||
| Performance fees |
312 | 634 | ||||||
|
|
|
|
|
|||||
| Total revenues |
240,459 | 233,155 | ||||||
|
|
|
|
|
|||||
| Operating Expenses |
||||||||
| Compensation and benefits |
||||||||
| Salaries, incentive compensation and benefits |
109,254 | 103,881 | ||||||
| Distributions on Class B liability awards |
21,895 | 48,071 | ||||||
| Change in value of Class B liability awards |
29,884 | (6,740 | ) | |||||
|
|
|
|
|
|||||
| Total compensation and benefits |
161,033 | 145,212 | ||||||
| Distribution and marketing |
14,208 | 13,394 | ||||||
| Occupancy |
4,515 | 4,351 | ||||||
| Communication and technology |
6,419 | 4,909 | ||||||
| General and administrative |
8,412 | 8,147 | ||||||
|
|
|
|
|
|||||
| Total operating expenses |
194,587 | 176,013 | ||||||
|
|
|
|
|
|||||
| Total operating income |
45,872 | 57,142 | ||||||
| Non-operating income (loss) |
||||||||
| Interest expense |
(5,232 | ) | (12,405 | ) | ||||
| Interest and dividend income |
— | 7 | ||||||
| Net gains on consolidated investment products |
1,539 | — | ||||||
| Gain (loss) on interest rate swap |
(52 | ) | 22 | |||||
|
|
|
|
|
|||||
| Total non-operating loss |
(3,745 | ) | (12,376 | ) | ||||
|
|
|
|
|
|||||
| Income before income taxes |
42,127 | 44,766 | ||||||
| Provision for income taxes |
579 | 580 | ||||||
|
|
|
|
|
|||||
| Net income before noncontrolling interests |
41,548 | 44,186 | ||||||
|
|
|
|
|
|||||
| Less: Net gain attributable to noncontrolling interests |
1,539 | — | ||||||
|
|
|
|
|
|||||
| Net income attributable to Artisan Partners Holdings LP |
$ | 40,009 | $ | 44,186 | ||||
|
|
|
|
|
|||||
The accompanying notes are an integral part of the consolidated financial statements.
F-39
Table of Contents
ARTISAN PARTNERS HOLDINGS LP AND SUBSIDIARIES
Unaudited Consolidated Statements of Comprehensive Income (Loss)
(U.S. dollars in thousands)
| For the Six Months Ended June 30, |
||||||||
| 2012 | 2011 | |||||||
| Net income before noncontrolling interests |
$ | 41,548 | $ | 44,186 | ||||
| Other comprehensive income |
||||||||
| Unrealized gain on investment in securities |
1,238 | 736 | ||||||
| Unrealized gain on interest rate swap |
— | 4,142 | ||||||
| Foreign currency translation gains (loss) |
29 | (31 | ) | |||||
|
|
|
|
|
|||||
| Other comprehensive income |
1,267 | 4,847 | ||||||
| Comprehensive income |
42,815 | 49,033 | ||||||
| Comprehensive income attributable to noncontrolling interests in consolidated investment products |
1,539 | — | ||||||
|
|
|
|
|
|||||
| Comprehensive income attributable to Artisan Partners Holdings LP |
$ | 41,276 | $ | 49,033 | ||||
|
|
|
|
|
|||||
The accompanying notes are an integral part of the consolidated financial statements.
F-40
Table of Contents
ARTISAN PARTNERS HOLDINGS LP AND SUBSIDIARIES
Unaudited Consolidated Statements of Changes in Partners’ Equity (Deficit),
Accumulated Other Comprehensive Income (Loss) and
Redeemable Class C Interests
(U.S. dollars)
| Partners’ Equity (Deficit) |
Noncontrolling Interest in Consolidated Entities |
Accumulated Other Comprehensive Income (Loss) |
Redeemable Class C Interests |
Total Equity (Deficit) |
||||||||||||||||
| Balance at December 31, 2010 |
$ | (730,217 | ) | $ | — | $ | (6,361 | ) | $ | 357,194 | $ | (379,384 | ) | |||||||
|
|
|
|
|
|
|
|
|
|
|
|||||||||||
| Net income |
44,186 | — | — | — | 44,186 | |||||||||||||||
| Other comprehensive income |
— | — | 4,847 | — | 4,847 | |||||||||||||||
|
|
|
|
|
|
|
|
|
|
|
|||||||||||
| Total comprehensive income |
44,186 | — | 4,847 | — | 49,033 | |||||||||||||||
| Change in noncontrolling interest in consolidated entities, net |
— | — | — | — | — | |||||||||||||||
| Partnership distributions |
(56,134 | ) | — | — | — | (56,134 | ) | |||||||||||||
|
|
|
|
|
|
|
|
|
|
|
|||||||||||
| Balance at June 30, 2011 |
$ | (742,165 | ) | $ | — | $ | (1,514 | ) | $ | 357,194 | $ | (386,485 | ) | |||||||
|
|
|
|
|
|
|
|
|
|
|
|||||||||||
| Balance at December 31, 2011 |
$ | (664,252 | ) | $ | 23,167 | $ | (7 | ) | $ | 357,194 | $ | (283,898 | ) | |||||||
|
|
|
|
|
|
|
|
|
|
|
|||||||||||
| Net income |
40,009 | 1,539 | — | — | 41,548 | |||||||||||||||
| Other comprehensive income |
— | — | 1,267 | — | 1,267 | |||||||||||||||
|
|
|
|
|
|
|
|
|
|
|
|||||||||||
| Total comprehensive income |
40,009 | 1,539 | 1,267 | — | 42,815 | |||||||||||||||
| Change in noncontrolling interest in consolidated entities, net |
— | 4,000 | — | — | 4,000 | |||||||||||||||
| Partnership distributions |
(31,612 | ) | — | — | — | (31,612 | ) | |||||||||||||
|
|
|
|
|
|
|
|
|
|
|
|||||||||||
| Balance at June 30, 2012 |
$ | (655,855 | ) | $ | 28,706 | $ | 1,260 | $ | 357,194 | $ | (268,695 | ) | ||||||||
|
|
|
|
|
|
|
|
|
|
|
|||||||||||
The accompanying notes are an integral part of the consolidated financial statements.
F-41
Table of Contents
ARTISAN PARTNERS HOLDINGS LP AND SUBSIDIARIES
Unaudited Consolidated Statements of Cash Flows
(U.S. dollars in thousands)
| For the Six Months Ended June 30, |
||||||||
| 2012 | 2011 | |||||||
| Cash flows from operating activities |
||||||||
| Net income before noncontrolling interests |
$ | 41,548 | $ | 44,186 | ||||
| Adjustments to reconcile net income to net cash provided by operating activities: |
||||||||
| Depreciation and amortization |
1,060 | 1,085 | ||||||
| (Gains) losses of consolidated investment products, net |
(1,539 | ) | — | |||||
| Proceeds from sale of investments by consolidated investment products |
(20,235 | ) | — | |||||
| Purchase of investments by consolidated investment products |
17,598 | — | ||||||
| Loss (gain) on interest rate swap |
52 | (22 | ) | |||||
| Amortization of debt issuance costs |
363 | 363 | ||||||
| Change in assets and liabilities resulting in an increase (decrease) in cash: |
||||||||
| Net change in operating assets and liabilities of consolidated investment products |
(1,362 | ) | — | |||||
| Accounts receivable |
(3,662 | ) | (3,567 | ) | ||||
| Prepaid expenses |
(411 | ) | (63 | ) | ||||
| Other assets |
(128 | ) | (1,188 | ) | ||||
| Accounts payable and accrued expenses |
49,617 | 50,689 | ||||||
| Class B liability awards |
26,160 | (10,435 | ) | |||||
| Deferred lease obligations |
655 | (124 | ) | |||||
|
|
|
|
|
|||||
| 109,716 | 80,924 | |||||||
| Cash flows from investing activities |
||||||||
| Acquisition of property and equipment |
(1,110 | ) | (775 | ) | ||||
| Leasehold improvements |
(586 | ) | (18 | ) | ||||
| Purchase of investment securities |
— | (20,000 | ) | |||||
| Change in restricted cash |
— | (1,040 | ) | |||||
|
|
|
|
|
|||||
| (1,696 | ) | (21,833 | ) | |||||
| Cash flows from financing activities |
||||||||
| Partnership distributions |
(31,612 | ) | (56,134 | ) | ||||
| Payments on other liabilities |
(74 | ) | (150 | ) | ||||
| Change in other liabilities |
211 | — | ||||||
| Principal payments on note payable |
(35,417 | ) | (20,000 | ) | ||||
| Capital invested into consolidated investment products |
4,000 | — | ||||||
|
|
|
|
|
|||||
| (62,892 | ) | (76,284 | ) | |||||
|
|
|
|
|
|||||
| Net increase (decrease) in cash and cash equivalents |
45,128 | (17,193 | ) | |||||
| Cash and cash equivalents |
||||||||
| Beginning of period |
126,956 | 158,987 | ||||||
|
|
|
|
|
|||||
| End of period |
$ | 172,084 | $ | 141,794 | ||||
|
|
|
|
|
|||||
| Supplementary information |
||||||||
| Cash paid for: |
||||||||
| Interest on note payable |
$ | 4,437 | $ | 5,689 | ||||
| Interest on interest rate swap |
577 | 6,816 | ||||||
| Interest on other obligations |
1 | 71 | ||||||
The accompanying notes are an integral part of the consolidated financial statements.
F-42
Table of Contents
ARTISAN PARTNERS HOLDINGS LP AND SUBSIDIARIES
Notes to Unaudited Consolidated Financial Statements
June 30, 2012 and 2011
(U.S. currencies in thousands)
| 1. | Organization and description of business |
Artisan Partners Holdings LP (“Artisan Partners Holdings” or the “Partnership”), known as Artisan Partners Limited Partnership until June 2009, is a holding company for the investment management business conducted under the name “Artisan Partners”. The partnership interests in Artisan Partners Holdings consist of a general partnership interest and Class A, Class B and Class C limited partnership interests. Initial outside investors hold the Class A limited partnership interests. Artisan employees hold the Class B limited partnership interests. Non-employee investors hold the Class C limited partnership interests. The general partner interest is held by Artisan Investment Corporation (“AIC”), all of the outstanding voting stock of which is owned by ZFIC, Inc.
Artisan Partners Holdings was formed as a limited partnership in the State of Delaware on December 9, 1994 and commenced operations on January 1, 1995. Artisan Partners Holdings, together with its wholly-owned subsidiary, Artisan Investments GP LLC (“AIGP”), controls a 100% interest in Artisan Partners Limited Partnership (“APLP”), a multi-product investment management firm that is the principal operating subsidiary of Artisan Partners Holdings. APLP is registered as an investment adviser with the U.S. Securities and Exchange Commission under the Investment Advisers Act of 1940. APLP provides investment advisory services to separate accounts and pooled investment vehicles, including Artisan Partners Funds, Inc. (“Artisan Funds” or the “Funds”), known as Artisan Funds, Inc. until July 2011. Artisan Funds is a series of twelve open-end, diversified mutual funds registered under the Investment Company Act of 1940, as amended, that are distributed to both institutional and retail investors on a no-load basis and to which APLP also provides certain administrative services.
Investment management operations are also conducted through Artisan Partners UK LLP (“Artisan UK”), a limited liability partnership organized under the laws of England and Wales that is controlled by its founder member, Artisan Partners Limited (“UKCo”), a private limited company incorporated under the laws of England and Wales, which is wholly-owned by Artisan Partners Holdings. Artisan UK is registered as an investment adviser with the U.S. Securities and Exchange Commission under the Investment Advisers Act of 1940 and is authorized by the United Kingdom Financial Services Authority. Artisan UK provides investment sub-advisory services to APLP, including to Artisan Partners Global Equity Fund, a series of Artisan Funds.
APLP has an agreement to serve as the investment manager of Artisan Partners Launch Equity LP (“Launch Equity”), which is a private investment partnership in which the investors are certain partners and employees (or entities beneficially owned by such persons) of Artisan Partners Holdings. Artisan Partners Alternative Investments GP LLC (“Artisan Alternatives”), a wholly-owned subsidiary of Artisan Partners Holdings, is the general partner of Launch Equity. Launch Equity commenced operations on July 25, 2011.
Artisan Partners Distributors LLC (“ADLLC”) is a wholly-owned subsidiary of Artisan Partners Holdings. ADLLC is a limited purpose broker/dealer registered with the Financial Industry Regulatory Authority and serves solely as principal distributor of the shares of Artisan Funds and does not execute trades on behalf of clients.
The consolidated financial statements include the accounts of Artisan Partners Holdings and all of its majority owned and controlled subsidiaries. Artisan Partners Holdings and its subsidiaries are hereafter referred to collectively as “Artisan”.
Partnership interests
Artisan Partners Holdings has outstanding general partner interests and Class A, Class B and Class C limited partner interests.
F-43
Table of Contents
All interests in Artisan Partners Holdings share ratably in the net income of Artisan Partners Holdings. Net income and related distributions of such income to the partners are allocated in accordance with their interests in net income, which were approximately as follows:
| At June 30, 2012 |
At December 31, 2011 |
|||||||
| General Partner interests |
17.79 | % | 17.78 | % | ||||
| Class A interests |
24.48 | % | 24.46 | % | ||||
| Class B interests |
40.89 | % | 40.94 | % | ||||
| Class C interests |
16.84 | % | 16.82 | % | ||||
|
|
|
|
|
|||||
| 100.00 | % | 100.00 | % | |||||
|
|
|
|
|
|||||
Class B interests are granted under the terms of the Agreement of Limited Partnership of Artisan Partners Holdings (the “Partnership Agreement”) and pursuant to written grant agreements to certain employees of APLP and other subsidiaries of Artisan Partners Holdings. As further described in Note 2, Summary of significant accounting policies – Equity-based compensation, and Note 8, Compensation and benefits, a Class B interest entitles the holder thereof to share ratably in the net income of Artisan Partners Holdings, and in appreciation and depreciation of the value of Artisan Partners Holdings, from and after the date of grant. During the six months ended June 30, 2012 and the year ended December 31, 2011, Class B interests representing 0% and 5.35%, respectively, of the interests in the net income of Artisan Partners Holdings were granted at no cost to Class B limited partners.
The Class C limited partnership interests are preferred interests that enjoy certain preferential rights to distributions upon the full or partial liquidation of Artisan Partners Holdings, including following any Partial Capital Event (as defined in the Partnership Agreement). The holders of Class C interests also have the right to cause Artisan Partners Holdings to redeem such interests in 2016 for cash for an aggregate amount of $357,194.
| 2. | Summary of significant accounting policies |
Basis of presentation
The accompanying Consolidated Financial Statements of Artisan for the six months ended June 30, 2012 and 2011 are unaudited. In the opinion of management, all adjustments, consisting only of normal recurring adjustments, necessary for a fair statement of such consolidated financial statements have been included. Such interim results are not necessarily indicative of full year results. The consolidated financial statements have been prepared in accordance with generally accepted accounting principles for interim financial reporting and accordingly they do not include all of the information and footnotes required in the annual consolidated financial statements and accompanying footnotes. The consolidated financial statements should be read in conjunction with the audited consolidated financial statements and accompanying notes hereto included in Artisan’s financial statements for the year ended December 31, 2011.
The accompanying Consolidated Financial Statements were prepared in accordance with accounting principles generally accepted in the United States of America (“U.S. GAAP”) and related rules and regulations of the U.S. Securities and Exchange Commission. The preparation of financial statements in conformity with U.S. GAAP requires management to make estimates or assumptions that affect the reported amounts and disclosures in the Consolidated Financial Statements. Actual results could differ from these estimates or assumptions.
Principles of consolidation
Artisan’s policy is to consolidate all subsidiaries in which it has a controlling financial interest and variable interest entities (“VIEs”) where Artisan is deemed to be the primary beneficiary. The primary beneficiary is deemed to be the entity that has the power to govern the financial and operating policies of the subsidiary so
F-44
Table of Contents
as to obtain benefits from its activities. The Consolidated Financial Statements include the accounts of Artisan Partners Holdings and its subsidiaries. All material intercompany balances have been eliminated in consolidation.
At June 30, 2012 and December 31, 2011 our wholly-owned subsidiary, Artisan Alternatives, is the general partner of Launch Equity, a private investment partnership that is considered a VIE. Launch Equity is considered an investment company and therefore accounted for under Accounting Standard Codification Topic 946, “Financial Services – Investment Companies”. The Company has retained the specialized industry accounting principles of this investment product in its Consolidated Financial Statements. See Note 7, “Consolidated Investment Products” for additional details.
Comprehensive income (loss)
Total comprehensive income (loss) includes all changes in equity except those resulting from investments by partners and distributions to partners and is reported in the Consolidated Statements of Comprehensive Income (Loss). Total comprehensive income (loss) includes net income and other comprehensive income. Other comprehensive income consists of the change in unrealized gains (losses) on available-for-sale investments and foreign currency translation.
Accumulated Other Comprehensive Income (Loss) in the accompanying Consolidated Statements of Changes in Partners’ Equity (Deficit), Accumulated Other Comprehensive Income (Loss) and Redeemable Class C Interests consists of the following:
| As of June 30, 2012 |
As of December 31, 2011 |
|||||||
| Unrealized gain on investments |
$ | 1,306 | $ | 68 | ||||
| Foreign currency translation |
(46 | ) | (75 | ) | ||||
|
|
|
|
|
|||||
| $ | 1,260 | $ | (7 | ) | ||||
|
|
|
|
|
|||||
Partnership distributions
Artisan makes distributions of its net income to its partners for income taxes as required under the terms of the Partnership Agreement. Tax distributions are calculated utilizing the highest combined individual federal, state and local income tax rate among the various locations in which the partners, as a result of owning their interests in the Partnership, are subject to tax, assuming maximum applicability of the phase-out of itemized deductions contained in the Internal Revenue Code, multiplied by each partner’s share of taxable income. Artisan also makes distributions of its net income under the terms of the Partnership Agreement. Distributions are recorded in the financial statements on the payment date. Partnership distributions totaled $53,507 and $104,205 for the periods ended June 30, 2012 and 2011, respectively, and are reported as the sum of Distributions on Class B liability awards within the Consolidated Statements of Operations and Partnership distributions within the Consolidated Statements of Changes in Partners’ Equity (Deficit), Accumulated Other Comprehensive Income (Loss) and Redeemable Class C Interests.
Recent accounting pronouncements
In June 2011, the Financial Accounting Standards Board (“FASB”) issued ASU 2011-05 which amends the Presentation of Comprehensive Income Topic, or Topic 220, of the FASB Accounting Standards Codification (“ASC”). This update, which was further amended by ASU 2011-12, eliminates the option to present other comprehensive income in the Statement of Changes in Partners’ Equity (Deficit) and Accumulated Other Comprehensive Income (Loss). Two alternatives are provided; an entity can elect to present items of net income and other comprehensive income in one continuous financial statement or in two separate, but consecutive financial statements. In both choices, an entity is required to present each
F-45
Table of Contents
component of net income along with total net income, each component of other comprehensive income along with a total for other comprehensive income, and a total amount for comprehensive income. The amendments in this update do not change the items that must be reported in other comprehensive income or when an item of other comprehensive income must be reclassified to net income. Artisan has chosen to adopt the amendments to this Topic and they are accordingly reflected in the new financial statement, “Consolidated Statements of Comprehensive Income”.
In May 2011, the FASB issued ASU 2011-04, which updates the disclosure guidance in the Fair Value Measurements and Disclosures Topic, or ASU Topic 820. This update clarifies the application of existing fair value measurement requirements, changes certain principles related to measuring fair value, and requires additional disclosures about fair value measurements. Required disclosures are expanded under the new guidance, particularly for fair value measurements that are categorized within Level 3 of the fair value hierarchy, for which quantitative information about the unobservable inputs used and a narrative description of the valuation processes in place will be required. ASU 2011-04 is effective in interim and annual periods beginning after December 15, 2011 and is to be applied prospectively. Artisan has adopted this Topic and this did not impact the Consolidated Financial Statements.
| 3. | Investment securities |
The disclosures below include details of Artisan’s investments. Investments held by consolidated investment products are detailed in Note 7, “Consolidated Investment Products”.
| Cost | Unrealized Gains |
Unrealized Losses |
Fair Value | |||||||||||||
| At June 30, 2012: |
||||||||||||||||
| Equity mutual funds |
$ | 17,194 | $ | 1,306 | $ | — | $ | 18,500 | ||||||||
| At December 31, 2011: |
||||||||||||||||
| Equity mutual funds |
$ | 17,194 | $ | 68 | $ | — | $ | 17,262 | ||||||||
Artisan’s investments in equity mutual funds consist of Artisan Funds and are considered to be available-for-sale securities. As a result, unrealized gains (losses) are recorded to Accumulated other comprehensive income (loss), a component of Partners’ Equity (Deficit).
As of June 30, 2012 and December 31, 2011, Artisan held no available-for-sale securities in an unrealized loss position.
| 4. | Fair value measurements |
The fair value of Artisan’s financial instruments is presented in the table below. The fair value of financial instruments held by consolidated investment products is presented in Note 7, “Consolidated Investment Products”.
In accordance with ASC 820, fair value is defined as the price that Artisan would receive upon selling an investment in an orderly transaction to an independent buyer in the principal or most advantageous market of the investment. The following three-tier fair value hierarchy prioritizes the inputs used in measuring fair value: Level 1—observable inputs such as quoted prices in active markets for identical securities; Level 2—other significant observable inputs (including but not limited to quoted prices for similar securities, interest rates, prepayment speeds, credit risk, etc.); Level 3—significant unobservable inputs (including Artisan’s own assumptions in determining the fair value of investments). For investments recorded at fair value, Artisan measures fair value using quoted market prices for identical assets. For interest rate swaps and the note payable, Artisan measures fair value using a calculation of the expected cash flows under the terms of each specific contract discounted to a present value. The calculation may include numerical procedures such as interpolation of LIBOR yield curves when input values do not directly correspond to the observable market data.
F-46
Table of Contents
The following provides the hierarchy of inputs used to derive fair value of Artisan’s assets and liabilities as of June 30, 2012 and December 31, 2011:
| Assets and Liabilities at Fair Value: | ||||||||||||||||
| Total | (Level 1) | (Level 2) | (Level 3) | |||||||||||||
| June 30, 2012 |
||||||||||||||||
| Assets |
||||||||||||||||
| Cash and cash equivalents |
$ | 172,084 | $ | 172,084 | $ | — | $ | — | ||||||||
| Equity mutual funds |
18,500 | 18,500 | — | — | ||||||||||||
| Liabilities |
||||||||||||||||
| Interest rate swaps |
$ | 1,118 | $ | — | $ | 1,118 | $ | — | ||||||||
| Note payable |
289,109 | — | 289,109 | — | ||||||||||||
| December 31, 2011 |
||||||||||||||||
| Assets |
||||||||||||||||
| Cash and cash equivalents |
$ | 126,956 | $ | 126,956 | $ | — | $ | — | ||||||||
| Equity mutual funds |
17,262 | 17,262 | — | — | ||||||||||||
| Liabilities |
||||||||||||||||
| Interest rate swaps |
$ | 1,066 | $ | — | $ | 1,066 | $ | — | ||||||||
| Note payable |
324,268 | — | 324,268 | — | ||||||||||||
There were no transfers between Level 1 and Level 2 securities.
| 5. | Note payable |
On July 3, 2006, Artisan Partners Holdings entered into an unsecured $400,000 five-year term loan agreement with a syndicate of lenders (the “Term Loan agreement” or “Term Loan”).
In November 2010, Artisan amended the Term Loan agreement. The aggregate outstanding principal amount of the loan was reduced to $380,000. The maturity date of the loan was extended to July 1, 2013 for $363,000 of the loan outstanding. The remaining $17,000 of the loan matured on July 1, 2011. Under the amended agreement, the Term Loan generally bears interest at a rate equal to, at Artisan’s election, (i) LIBOR plus an applicable margin depending on Artisan Partners Holdings’ leverage ratio or (ii) an alternate base rate plus an applicable margin depending on Artisan Partners Holdings’ leverage ratio. As of June 30, 2012 and December 31, 2011, the interest rate on the note payable was 2.74% and 2.77%, respectively.
Beginning with the fiscal quarter ended March 31, 2011, the amended Term Loan agreement requires principal payments of $10,000 on the last business day of each fiscal quarter in which the aggregate principal amount of the loan is greater than $250,000. Following the repayment in full of the $17,000 of the loan that matured on July 1, 2011, the amount of each quarterly payment was reduced by the portion that would have been allocated to that portion of the loan. Since the fiscal quarter ended September 30, 2011, Artisan has been required to make additional principal payments in an amount equal to 50% of excess cash flow (as defined in the Term Loan agreement) for such fiscal quarter and will continue to be required to do so until the outstanding principal amount is equal to or less than $250,000.
Interest expense incurred on the note payable was $4,318 and $5,805 for the periods ended June 30, 2012 and 2011, respectively.
The Term Loan agreement includes various restrictive covenants regarding the Partnership’s leverage ratio and interest coverage ratio, and imposes restrictions on additional indebtedness. Artisan Partners Holdings has been in compliance with all loan covenants since inception of the Term Loan. Pursuant to the Term Loan agreement, Artisan Partners Holdings is generally restricted from making cash distributions to its partners in respect of their partnership interests therein (other than to fund the payment of taxes owed by the
F-47
Table of Contents
partners as a result of their partnership interests) when Artisan Partners Holdings’ leverage ratio exceeds 2.75 to 1.00. Artisan’s leverage ratio was 1.48 and 1.64 as of June 30, 2012 and December 31, 2011, respectively. There were no restrictions on cash distributions as of June 30, 2012.
On August 16, 2012, Artisan issued $200 million in unsecured notes and entered into a $100 million five-year revolving credit agreement, the proceeds of which were used to prepay all of the then-outstanding principal amount of our term loan. See Note 12, Subsequent Events, for further information.
The aggregate scheduled maturities of long-term debt obligations of the Partnership’s long-term debt obligations are as follows at June 30, 2012:
| 2012 |
$ | 40,309 | ||
| 2013 |
249,064 | |||
|
|
|
|||
| $ | 289,373 | |||
|
|
|
| 6. | Derivative instruments |
Effective July 7, 2006, Artisan Partners Holdings executed 5-year amortizing interest rate swap contracts with two counterparties that had a combined total notional value of $400,000 upon issuance. The total notional value of these swap contracts amortized to $350,000 on April 7, 2008, to $300,000 on April 7, 2009, to $250,000 on April 7, 2010, and to $200,000 on April 7, 2011. These interest rate swaps matured on July 1, 2011. The counterparties under these interest rate swap contracts paid Artisan Partners Holdings variable interest at the three-month LIBOR rate, and Artisan Partners Holdings paid the counterparties a fixed interest rate of 5.689%.
Effective November 22, 2010, Artisan Partners Holdings executed a forward starting interest rate swap with a counterparty that had a total notional value of $200,000 upon issuance, a start date of July 1, 2011, and a final maturity date of July 1, 2013. The counterparty under this forward starting interest rate swap contract pays Artisan Partners Holdings variable interest at the three-month LIBOR rate (0.47% and 0.38% as of June 30, 2012 and December 31, 2011, respectively), and Artisan Partners Holdings pays the counterparty a fixed interest rate of 1.04%. This forward starting interest rate swap was entered into to convert the amended Term Loan into fixed rate debt to the extent of the notional value of the swap contract to manage interest rate risk on the amended Term Loan. Based on the terms of the forward starting interest rate swap contract and the amended Term Loan, the forward starting interest rate swap contract was determined to qualify as a cash flow hedge.
On December 14, 2011, Artisan discontinued the hedge accounting relationship related to its $200,000 notional interest rate swap as the hedged forecasted transaction was no longer probable of occurring. All future fair value changes of the derivative will be recognized in current earnings. Artisan continues to hold the derivative instrument as it generally provides an economic hedge of the benchmark interest rate, enabling Artisan to convert the amended Term Loan into fixed rate debt to the extent of the notional value of the swap contract to manage interest rate risk on the amended Term Loan.
Net interest expense incurred on the interest rate swaps was $520 and $6,139 for the periods ended June 30, 2012 and 2011, respectively.
F-48
Table of Contents
Fair Values of Derivative Instruments
| Asset | Liability | |||||||||||
| Derivatives not designated as hedging instruments under FASB |
Balance Sheet Location |
Fair Value | Balance Sheet Location |
Fair Value | ||||||||
| As of June 30, 2012 |
||||||||||||
| Interest rate swap |
$ | — | Interest rate swap | $ | 1,118 | |||||||
|
|
|
|
|
|||||||||
| Total derivatives not designated as hedging |
$ | — | $ | 1,118 | ||||||||
|
|
|
|
|
|||||||||
| Derivatives not designated as hedging instruments under FASB ASC 815-20 (a) As of December 31, 2011 |
||||||||||||
| Interest rate swap |
$ | — | Interest rate swap | $ | 1,066 | |||||||
|
|
|
|
|
|||||||||
| Total derivatives not designated as hedging |
$ | — | $ | 1,066 | ||||||||
|
|
|
|
|
|||||||||
| (a) | Refer to disclosures within this footnote for additional information on Artisan’s purpose for holding derivative instruments not designated as hedging instruments under FASB ASC 815-20. |
The Effect of Derivative Instruments on the Statements of Operations
| Derivatives in Subtopic 815-20 Cash |
Amount of Gain or (Loss) Recognized in Other Comprehensive Income on Derivative (Effective Portion) |
Location of Gain or (Loss) Reclassified from Accumulated Other Comprehensive Income into Income (Effective Portion) |
Amount of Gain or (Loss) Reclassified from Accumulated Other Comprehensive Income into Income (Effective Portion) |
Location of Gain |
Amount of Gain or (Loss) Recognized in Income on Derivative (Ineffective Portion) |
|||||||||||||
| For the Six Months Ended June 30, 2012 |
||||||||||||||||||
| Interest rate swap (b) |
$ | — | $ | — | Gain (loss) on swap fair value | $ | (52 | ) | ||||||||||
|
|
|
|
|
|
|
|||||||||||||
| Total |
$ | — | $ | — | $ | (52 | ) | |||||||||||
|
|
|
|
|
|
|
|||||||||||||
| For the Six Months Ended June 30, 2011 |
||||||||||||||||||
| Interest rate swap |
$ | 6,115 | Interest expense | $ | (6,139 | ) | $ | — | ||||||||||
| Interest rate swap (b) |
(1,973 | ) | Interest expense | — | Gain (loss) on swap fair value | 22 | ||||||||||||
|
|
|
|
|
|
|
|||||||||||||
| Total |
$ | 4,142 | $ | (6,139 | ) | $ | 22 | |||||||||||
|
|
|
|
|
|
|
|||||||||||||
| (b) | On December 14, 2011 Artisan discontinued the hedge accounting relationship under FASB ASC 815-20 for the interest rate swap with a start date of July 1, 2011. |
| 7. | Consolidated investment products |
Launch Equity commenced operations on July 25, 2011. Artisan’s variable interest represents its equity interest in the fund. Artisan receives management and incentive fees for the services it provides as investment advisor to Launch Equity. These fees may also be considered variable interests. In the ordinary course of business, Artisan may choose to waive certain fees or assume operating expenses of the fund.
F-49
Table of Contents
In determining whether it is the primary beneficiary of Launch Equity, Artisan considered both qualitative and quantitative factors such as voting rights of the equity holders, economic participation of all parties, including how fees are earned by Artisan, related party ownership and the level of involvement Artisan had in the design of the VIE. Artisan concluded it was the primary beneficiary of the private investment fund since, although it holds a minimal equity interest in the fund, it retains all control in the management and affairs of the fund and the fund was designed to attract third party investors to provide an economic benefit to Artisan.
Artisan’s risk with respect to investments in consolidated investment products is limited to its equity ownership of $1. Therefore, the gains or losses of consolidated investment products have not had a significant impact on Artisan’s results of operations, liquidity or capital resources. Artisan has no right to the benefits from, nor does it bear the risks associated with these investments, beyond Artisan’s minimal direct investments in the investment products. If Artisan were to liquidate, these investments (other than our direct investment of $1) would not be available to the general creditors of the company and as a result, Artisan does not consider investments held by consolidated investment products to be company assets.
The following tables reflect the impact of consolidation of investment products into the Consolidated Statement of Financial Condition and Consolidated Statement of Operations as of and for the six months ended June 30, 2012.
Condensed Consolidating Statement of Financial Condition
| Before Consolidation |
Launch Equity | Eliminations | As Reported | |||||||||||||
| As of June 30, 2012: |
||||||||||||||||
| Cash and cash equivalents |
$ | 172,084 | $ | — | $ | — | $ | 172,084 | ||||||||
| Cash and cash equivalents of consolidated investment products |
— | 7,949 | — | 7,949 | ||||||||||||
| Accounts receivable |
43,079 | 11 | — | 43,090 | ||||||||||||
| Investment securities of consolidated investment products |
1 | 28,575 | (1 | ) | 28,575 | |||||||||||
| Other assets |
31,111 | — | — | 31,111 | ||||||||||||
|
|
|
|
|
|
|
|
|
|||||||||
| Total assets |
$ | 246,275 | $ | 36,535 | $ | (1 | ) | $ | 282,809 | |||||||
|
|
|
|
|
|
|
|
|
|||||||||
| Payables of consolidated investment products |
$ | — | $ | 1,453 | $ | — | $ | 1,453 | ||||||||
| Securities sold, not yet purchased of consolidated investment products |
— | 6,375 | — | 6,375 | ||||||||||||
| Other liabilities |
543,676 | — | — | 543,676 | ||||||||||||
|
|
|
|
|
|
|
|
|
|||||||||
| Total liabilities |
543,676 | 7,828 | — | 551,504 | ||||||||||||
| Total equity attributable to Artisan Partners Holdings |
(297,401 | ) | 1 | (1 | ) | (297,401 | ) | |||||||||
| Noncontrolling interest in consolidated investment products |
— | 28,706 | — | 28,706 | ||||||||||||
|
|
|
|
|
|
|
|
|
|||||||||
| Total liabilities and equity |
$ | 246,275 | $ | 36,535 | $ | (1 | ) | $ | 282,809 | |||||||
|
|
|
|
|
|
|
|
|
|||||||||
F-50
Table of Contents
Condensed Consolidating Statement of Operations
| Before Consolidation |
Launch Equity | Eliminations | As Reported | |||||||||||||
| Six Months Ended June 30, 2012: |
||||||||||||||||
| Total revenues |
$ | 240,598 | $ | — | $ | (139 | ) | $ | 240,459 | |||||||
| Total operating expenses |
194,726 | — | (139 | ) | 194,587 | |||||||||||
|
|
|
|
|
|
|
|
|
|||||||||
| Operating income |
45,872 | — | — | 45,872 | ||||||||||||
| Non-operating expenses |
(5,284 | ) | — | — | (5,284 | ) | ||||||||||
| Net gains of consolidated investment products |
— | 1,539 | — | 1,539 | ||||||||||||
|
|
|
|
|
|
|
|
|
|||||||||
| Total non-operating expenses |
(5,284 | ) | 1,539 | — | (3,745 | ) | ||||||||||
| Income before income taxes |
40,588 | 1,539 | — | 42,127 | ||||||||||||
| Provision for income taxes |
579 | — | — | 579 | ||||||||||||
|
|
|
|
|
|
|
|
|
|||||||||
| Net income |
40,009 | 1,539 | — | 41,548 | ||||||||||||
| Net income attributable to noncontrolling interests |
— | 1,539 | — | 1,539 | ||||||||||||
|
|
|
|
|
|
|
|
|
|||||||||
| Net income attributable to Artisan Partners Holdings |
$ | 40,009 | $ | — | $ | — | $ | 40,009 | ||||||||
|
|
|
|
|
|
|
|
|
|||||||||
The carrying value of consolidated investment products is also their fair value. Short and long positions on equity securities are valued based upon closing market prices of the security on the principal exchange on which they are traded. The following table presents the fair value hierarchy levels of investments and liabilities held which are measured at fair value as of June 30, 2012:
| Assets and Liabilities at Fair Value: | ||||||||||||||||
| Total | Level 1 | Level 2 | Level 3 | |||||||||||||
| June 30, 2012 |
||||||||||||||||
| Assets |
||||||||||||||||
| Equity securities – long position |
$ | 28,575 | $ | 28,575 | $ | — | $ | — | ||||||||
| Liabilities |
||||||||||||||||
| Equity securities – short position |
$ | 6,375 | $ | 6,375 | $ | — | $ | — | ||||||||
| 8. | Compensation and benefits |
Compensation and benefits expense is comprised of the following:
| For the Six Months Ended June 30 | ||||||||
| 2012 | 2011 | |||||||
| Salaries, incentive compensation, and benefits |
$ | 109,254 | $ | 103,881 | ||||
| Distributions on Class B liability awards |
21,895 | 48,071 | ||||||
| Change in value of Class B liability awards |
29,884 | (6,740 | ) | |||||
|
|
|
|
|
|||||
| Total compensation and benefits expense |
$ | 161,033 | $ | 145,212 | ||||
|
|
|
|
|
|||||
Incentive compensation paid to members of our portfolio management teams and members of our marketing and client service teams is based on a formula that is tied directly to revenues. These payments are made in the quarter following the quarter in which the incentive was earned with the exception of fourth quarter payments which are paid in the fourth quarter of the year. Incentive compensation paid to other employees is discretionary and subjectively determined based on individual performance and our overall results during the applicable year and is paid in the fourth quarter of the year.
Class B liability awards are granted to certain employees of APLP and a member of Artisan UK at the discretion of Artisan Partners Holdings’ general partner. All vested Class B liability awards are subject to
F-51
Table of Contents
mandatory redemption on termination of employment for any reason; unvested Class B liability awards are forfeited on termination of employment. Vested Class B liability awards of a terminated employee are redeemed in cash in annual installments generally over the five years following termination of employment. Prior to April 6, 2011, Class B liability awards were classified as share-based liability awards with measurement at intrinsic value under ASC 718. Intrinsic value was determined using the redemption formula of the Class B awards. Under the terms of the grant agreements, the redemption value of Class B interests was determined upon the termination of the holder’s employment and varied depending on the circumstances of the holder’s termination. As described later in this note, the redemption value of Class B interests was calculated assuming a holder’s termination of employment was the result of resignation or involuntary termination by Artisan. For individuals who had given notice of retirement in accordance with the terms of their grant agreements, the redemption value of the Class B liability awards was calculated using the retirement valuation.
As of June 30, 2011, the Class B limited partnership interests are reflected as liabilities measured at fair value, which is a significant estimate. As part of the calculation to estimate the fair value of each Class B partnership interest, we first determined the value of the business based on the probability weighted expected return method. This approach considers the value of the business, calculated using a discounted cash flow analysis and a market approach using earnings multiples of comparable entities, under various scenarios. Significant inputs included historical revenues and expenses, future revenue and expense projections, discount rates and market prices of comparable entities. The value of the business as determined is then adjusted to take into account working capital, debt and noncurrent liabilities associated with Class B partner redemptions and allocated to individual partnership interests based on their respective terms. The use of the discounted cash flow and market approaches to derive the fair value of the liability at a point in time can result in volatility to the financial statements as our current and projected financial results, and the results and earnings multiples of comparable entities, will change over time. The process for determining fair value has significant subjective elements and involves a high degree of management judgment and assumptions. These assumptions may have a significant effect on our estimates of fair value, and the use of different assumptions as well as changes in market conditions could have a material effect on our results of operations or financial condition. The aggregate redemption values and liabilities of this obligation are as follows:
| As of June 30, 2012 |
As of December 31, 2011 |
|||||||
| Redemption value: |
||||||||
| Vested Class B liability awards |
$ | 171,822 | $ | 146,175 | ||||
| Unvested Class B liability awards |
28,178 | 31,825 | ||||||
| Purchased Class B liability awards |
2,584 | 2,328 | ||||||
|
|
|
|
|
|||||
| Aggregate redemption value |
$ | 202,584 | $ | 180,328 | ||||
|
|
|
|
|
|||||
| Liabilities: |
||||||||
| Class B liability awards |
$ | 171,822 | $ | 146,175 | ||||
| Redeemed Class B liability awards |
15,422 | 14,909 | ||||||
At June 30, 2012 and December 31, 2011, the aggregate fair value of unrecognized compensation cost for the unvested Class B interests was $28,178 and $31,825, respectively, with weighted average recognition periods of 1.90 years and 2.38 years remaining, respectively.
The Partnership redeems the Class B limited partner interests of partners whose employment by the Partnership terminates at a value determined in accordance with the terms of the grant agreement pursuant to which the interest was granted, which includes a premium in the case of employment terminated by reason of death, disability or retirement. Termination of employment by reason of death or disability is not probable and therefore, the premium is not included in the redemption value. In order for a termination of employment to qualify as a retirement, the retiring employee must have 10 years or more of service as of the
F-52
Table of Contents
date of retirement and must have given Artisan written notice of the intention to retire at least three years prior to the date of retirement, subject to Artisan’s right, at its discretion, to accept a period of notice that is shorter, but not less than one year. However, in the event the employee is terminated for any reason during the additional period of employment, the retirement premium is no longer applicable. As a result of the terms described above, the redemption value of the Class B limited partner interests classified as liabilities does not reflect the premium until Artisan has accepted the individual’s retirement notification and effectively becomes obligated to pay the premium. Prior to that event, the redemption value of Class B interests has been calculated assuming a holder’s termination of employment was the result of resignation or involuntary termination by Artisan and has been recorded as Class B liability award on the Consolidated Statements of Financial Condition. For individuals who have given notice of retirement in accordance with their grant agreements and such notification has been accepted by Artisan, the redemption value of the Class B interests has been calculated using the retirement valuation as of the notice date.
As of June 30, 2012, three partners had given notice of their intention to retire pursuant to the terms of their grant agreements. The Class B limited partner interests of partners whose services to the Partnership terminated on or before June 30, 2012, will be redeemed for payments totaling $15,422, paid over the next five years.
In connection with the three announced retirements as described above and in accordance with the Partnership Agreement and each Class B Partner’s grant agreement, the redemption value of the Class B interests was increased to reflect the premium associated with the anticipated redemptions by reason of retirement. Since this premium applies only upon retirement in accordance with the terms of the grant agreement and notice, the increase in redemption value is treated as a modification of a liability award as of the date Artisan receives the notice of intended retirement and effectively becomes obligated to pay the premium on redemption. The premium for those partners giving notice of retirement resulted in a $12,160 and $7,621 cumulative increase in the award liability as of June 30, 2012 and December 31, 2011, respectively. The Class B interests continued to be carried at fair value, reflecting the retirement premium, from the date of Artisan’s acceptance of the retirement notification through the date of the individual’s retirement and the payment obligation is fixed. Assuming all Class B holders’ redemption values were determined by retirement, the redemption value of Class B interests would have been $319,686 and $276,517 at June 30, 2012 and December 31, 2011, respectively.
| 9. | Indemnifications |
In the normal course of business, Artisan enters into agreements that include indemnities in favor of third parties. Artisan Partners Holdings has also agreed to indemnify its general partner, the directors and officers of its general partner, its partners, employees and agents, and the members of Artisan Partners Holdings’ Advisory Committee in certain cases. Artisan Partners Holdings’ subsidiaries may also have similar agreements to indemnify their respective general partner(s), directors and officers of their general partner(s), partners, members, employees, and agents. Artisan’s maximum exposure under these arrangements is unknown, as this would involve future claims that may be made against Artisan that have not yet occurred. Artisan maintains insurance policies that may provide coverage against certain claims under these indemnities.
| 10. | Related party transactions |
Artisan engages in transactions with its affiliates in the ordinary course of business.
Affiliate transactions—Artisan Funds
Artisan has agreements to serve as the investment manager of Artisan Funds, with which certain Artisan employees are affiliated. Under the terms of the agreements with the Funds, which are generally reviewed and continued by the Funds’ board of directors at least annually, a fee is paid to Artisan based on an annual percentage of the average daily net assets of each Fund ranging from 0.64% to 1.25%. Revenues related to
F-53
Table of Contents
these services are generally collected by Artisan on the last business day of each month and are recorded in Management fees in the Consolidated Statement of Operations. Artisan has contractually agreed to waive its management fees or reimburse for expenses incurred to the extent necessary to limit annualized ordinary operating expenses incurred by Artisan Emerging Markets Fund, Artisan Global Value Fund, Artisan Global Opportunities Fund and Artisan Global Equity Fund to not more than 1.50% of average daily net assets through February 1, 2013. In addition, Artisan may voluntarily waive fees or reimburse any of the Artisan Funds for other expenses. The officers and a director of Artisan Funds who are affiliated with Artisan receive no compensation from the Funds. At June 30, 2012 and December 31, 2011, respectively, accounts receivable included $0 and $195 due from the Funds.
Fees for managing the Funds and amounts waived or reimbursed by Artisan for fees and expenses (including management fees) are as follows:
| For the six months ended June 30, | ||||||||
| 2012 | 2011 | |||||||
| Investment management fees: |
||||||||
| Artisan Funds |
$ | 159,082 | $ | 156,821 | ||||
| Fee waiver / expense reimbursement: |
||||||||
| Artisan Funds |
$ | 115 | $ | 165 | ||||
Affiliate transactions—Artisan Global Funds
Artisan has agreements to serve as the investment manager and promoter of Artisan Partners Global Funds Public Limited Company (“Artisan Global Funds”), with which certain Artisan employees are affiliated. Artisan Global Funds is an open-ended investment company with variable capital and segregated liability between its sub-funds, organized under the laws of Ireland. Artisan Global Funds is authorized as a UCITS and offers shares to non-U.S. investors. Under the terms of the agreements with Artisan Global Funds, a fee is paid to Artisan based on an annual percentage of the average daily net assets of each fund ranging from 0.85% to 0.95%. Artisan reimburses each sub-fund of Artisan Global Funds to the extent that sub-fund’s expenses, not including Artisan’s fee, exceed certain levels, which are not more than 0.20% for the Emerging Markets Fund and not more than 0.35% for the Global Value Fund and the Value Fund. The directors of Artisan Global Funds who are affiliated with Artisan receive no compensation from the Artisan Global Funds. At June 30, 2012 and December 31, 2011, respectively, accounts receivable included $762 and $709 due from Artisan Global Funds.
Fees for managing Artisan Global Funds and amounts reimbursed to Artisan Global Funds by Artisan are as follows:
| For the six months ended June 30, | ||||||||
| 2012 | 2011 | |||||||
| Investment management fees: |
||||||||
| Artisan Global Funds |
$ | 1,217 | $ | 448 | ||||
| Fee waiver / expense reimbursement: |
||||||||
| Artisan Global Funds |
$ | 379 | $ | 385 | ||||
Affiliate transactions—Launch Equity
APLP has an agreement to serve as the investment manager of Launch Equity. Under the terms of APLP’s agreement with Launch Equity, Artisan earns a quarterly fee based on the value of the closing capital account of each limited partner for the quarter, at the rate of 1.00% (annualized). At Artisan’s discretion, the fee may be waived and certain expenses reimbursed to the extent they exceed a certain level. Artisan expects to waive 100% of Artisan’s quarterly fee and reimburse Launch Equity for all operating expenses, and Artisan may waive other expenses at Artisan’s discretion. Artisan Alternatives is entitled to receive an
F-54
Table of Contents
allocation of profits from Launch Equity equal to 20% of Launch Equity’s net capital appreciation (“incentive fee”) as determined at the conclusion of its fiscal year, which also may be waived at Artisan’s discretion. Artisan has waived the incentive fee for the six month period ended June 30, 2012. Expense reimbursements totaled $81 for the six month period ended June 30, 2012.
Affiliate transactions—AIC
Artisan Partners Holdings has cost sharing arrangements with its current general partner, AIC, as well as AIC’s beneficial owners, Andrew A. Ziegler, and Carlene M. Ziegler, who is an employee of APLP, pursuant to which Artisan Partners Holdings and certain of its employees provide certain administrative services to AIC and its owners, and AIC and its owners reimburse Artisan Partners Holdings for the costs related to such services. In addition, Artisan Partners Holdings has obtained and paid for insurance policies covering potential liability AIC may incur as general partner of Artisan Partners Holdings. At June 30, 2012 and December 31, 2011, accounts receivable included $31 and $189 due from AIC, respectively.
| 11. | Litigation matters |
In the normal course of business, Artisan may be subject to various legal proceedings from time to time. As of June 30, 2012, APLP was the defendant in a lawsuit challenging the investment advisory fees it charged to certain Artisan Funds managed by it. Reso v. Artisan Partners Limited Partnership, (E.D. Wis. Case No. 2:11-cv-873-JPS). The action was filed in June 2011 by a fund investor asserting breach of fiduciary duty under Section 36(b) of the Investment Company Act of 1940, as amended, with respect to Artisan International Fund, Artisan International Value Fund and Artisan Mid Cap Value Fund. In August 2012, the lawsuit was resolved and dismissed with prejudice without a material adverse effect on Artisan’s financial position or results of operations. Artisan maintains an insurance policy providing coverage for certain claims first made while the policy is in force. That policy provides coverage for Costs of Defense, as defined in the policy, incurred by Artisan in excess of a retention of $1,000, which retention amount was reached during 2011. Costs of Defense are paid by Artisan and recorded as expenses as incurred on the Statement of Operations as General and administrative expense. As reimbursement for Costs of Defense exceeded the retention amount, Artisan recorded a receivable on the Statement of Financial Condition in Accounts receivable to reflect the offsetting recovery.
| 12. | Subsequent events |
Artisan evaluated subsequent events through the issuance date of its financial statements, and determined that no subsequent events had occurred that would require additional disclosures, other than as described below and in Note 11, Litigation matters.
During July 2012, Artisan granted Class B interests representing 13.06% of the interests in the net income of Artisan Partners Holdings at no cost to Class B limited partners. Immediately subsequent to this grant, the partnership interests were restructured into units and the redemption value of Class B common units was modified to be based on the fair market value of the Partnership determined by the general partner, by reference to the value of comparable firms with publicly-traded equity securities. Redemption value represents one of the assumptions that drives the fair value of the Class B liability awards. The grant of profits interests and subsequent restructuring into partnership units and change in redemption value will result in an overall increase of compensation expense.
On August 16, 2012, Artisan terminated the $200,000 notional interest rate swap contract in connection with the repayment of all of the then-outstanding principal amount of our term loan. Final settlement of the swap contract was $1,135.
On August 16, 2012, Artisan issued $200 million in unsecured notes and entered into a $100 million five-year revolving credit agreement, the proceeds of which were used to prepay all of the then-outstanding principal amount of our term loan. The $200 million in unsecured notes consists of $60 million 4.98%
F-55
Table of Contents
Series A notes maturing August 16, 2017, $50 million 5.32% Series B notes maturing August 16, 2019 and $90 million 5.82% Series C notes maturing August 16, 2022. Outstanding loans under the revolving credit agreement bear interest at a rate equal to, at our election, (i) LIBOR adjusted by a statutory reserve percentage plus an applicable margin ranging from 1.50% to 3.00%, depending on Artisan’s leverage ratio (as defined in the agreement) or (ii) an alternate base rate equal to the highest of prime rate plus 0.50% and the daily one-month LIBOR adjusted by a statutory reserve percentage plus 1.00%, plus an applicable margin ranging from 0.50% to 2.00%, depending on Artisan’s leverage ratio (as defined in the agreement). Unused commitments under the revolving credit agreement bear interest at a rate that ranges from 0.175% to 0.625%, depending on Artisan’s leverage ratio (as defined in the agreement).
Artisan distributed to its partners profits totaling $50,000 in August 2012, $18,563 in September 2012, and $12,500 in October 2012.
Pro Forma Impact of Distributions in Connection with Initial Public Offering
Artisan expects to make a distribution of retained profits to its partners as of the date of the closing of APAM’s public offering. A portion of this distribution will be paid from Artisan’s available cash and a portion will be paid with proceeds from the public offering. If the closing date of APAM’s public offering had been June 30, 2012, the total amount of the distribution would have been $178,030, the amount of Artisan’s retained profits through that date. Excluding the portion that would have been paid with proceeds from the public offering, the total amount of the distribution would have been $172,084. The actual amount of the distribution will be determined based upon retained profits as of the date of the closing of APAM’s public offering and will be different than the amounts as calculated as of June 30, 2012.
F-56
Table of Contents
Shares
Artisan Partners Asset Management Inc.
Class A Common Stock
| Citigroup | Goldman, Sachs & Co. |
| BofA Merrill Lynch | Morgan Stanley |
Scotiabank
Through and including , 2013 (the 25th day after the date of this prospectus), all dealers effecting transactions in these securities, whether or not participating in this offering, may be required to deliver a prospectus. This is in addition to a dealer’s obligation to deliver a prospectus when acting as an underwriter and with respect to an unsold allotment or subscription.
Table of Contents
PART II
INFORMATION NOT REQUIRED IN PROSPECTUS
| Item 13. | Other Expenses of Issuance and Distribution. |
The following is a statement of the estimated expenses, to be paid solely by the Registrant, to be incurred in connection with the distribution of the securities registered under this Registration Statement:
| Amount to be Paid | ||||
| SEC registration fee |
$ | 34,100 | ||
| Financial Industry Regulatory Authority, Inc. filing fee |
$ | 25,500 | ||
| New York Stock Exchange listing fee |
* | |||
| Blue sky fees and expenses |
* | |||
| Printing fees and expenses |
* | |||
| Legal fees and expenses |
* | |||
| Accounting fees and expenses |
* | |||
| Transfer agent’s fees |
* | |||
| Miscellaneous |
* | |||
| Total |
$ | * | ||
| * | To be included by amendment |
| Item 14. | Indemnification of Directors and Officers. |
Section 145 of the Delaware General Corporation Law, or DGCL, grants each corporation organized thereunder the power to indemnify any person who is or was a director, officer, employee or agent of a corporation or enterprise, against expenses (including attorneys’ fees), judgments, fines and amounts paid in settlement actually and reasonably incurred by him in connection with any threatened, pending or completed action, suit or proceeding, whether civil, criminal, administrative or investigative, by reason of being or having been in any such capacity, if he acted in good faith and in a manner he reasonably believed to be in or not opposed to the best interests of the corporation, and, with respect to any criminal action or proceeding had no reasonable cause to believe his conduct was unlawful, except that with respect to an action or suit brought by or in the right of the corporation such indemnification is limited to expenses (including attorneys’ fees) in connection with the defense or settlement of such action or suit. The Registrant’s restated certificate of incorporation provides that it shall indemnify its directors and officers to the fullest extent permitted by Delaware law.
Section 102(b)(7) of the DGCL enables a corporation, in its certificate of incorporation or an amendment thereto, to eliminate or limit the personal liability of a director to the corporation or its stockholders for monetary damages for breach of fiduciary duty as a director, except (i) for any breach of the director’s duty of loyalty to the corporation or its stockholders, (ii) for acts or omissions not in good faith or which involve intentional misconduct or a knowing violation of law, (iii) under Section 174 of the DGCL (providing for liability of directors for unlawful payment of dividends or unlawful stock purchases or redemptions) or (iv) for any transaction from which the director derived an improper personal benefit. The Registrant’s restated certificate of incorporation provides for such limitations on liability for its directors.
The Registrant currently maintains liability insurance for its directors and officers. In connection with this offering, the Registrant will obtain additional liability insurance for its directors and officers. Such insurance would be available to its directors and officers in accordance with its terms.
Reference is made to the form of underwriting agreement to be filed as Exhibit 1.1 hereto for provisions providing that the underwriters are obligated, under certain circumstances, to indemnify the Registrant’s directors, officers and controlling persons against certain liabilities under the Securities Act of 1933, as amended.
The Registrant expects to enter into an indemnification agreement with each of its executive officers, directors and the members of its stockholders committee that provides, in general, that it will indemnify them to the fullest extent permitted by law in connection with their service in such capacities.
II-1
Table of Contents
| Item 15. | Recent Sales of Unregistered Securities. |
Except as set forth below, in the three years preceding the filing of this Registration Statement, the Registrant has not issued any securities that were not registered under the Securities Act.
On March 28, 2011, the Registrant issued 100 shares of its common stock, par value $0.01 per share, to Artisan Partners Holdings in exchange for $100.
Prior to the completion of this offering, shares of Class B common stock and shares of Class C common stock will be issued to Artisan Partners Holdings LP. Also prior to the completion of this offering, H&F Corp, a wholly owned subsidiary of H&F Brewer AIV II, L.P., will merge with and into the Registrant and H&F Brewer AIV II, L.P. will receive shares of convertible preferred stock in exchange for its shares of H&F Corp.
The securities issued in each of the foregoing transactions were issued in reliance upon the exemption from the registration requirement of the Securities Act provided for by Section 4(2) thereof for transactions not involving a public offering.
| Item 16. | Exhibits and Financial Statement Schedules. |
(a) Exhibits: The following exhibits are filed as part of this Registration Statement:
| 1.1 | Form of Underwriting Agreement* | |
| 2.1 | Form of Agreement and Plan of Merger between Artisan Partners Asset Management Inc. and H&F Brewer Blocker Corp.* | |
| 3.1 | Form of Restated Certificate of Incorporation of Artisan Partners Asset Management Inc.* | |
| 3.2 | Form of Amended and Restated Bylaws of Artisan Partners Asset Management Inc.* | |
| 5.1 | Opinion of Sullivan & Cromwell LLP* | |
| 10.1 | Form of Amended and Restated Limited Partnership Agreement of Artisan Partners Holdings LP* | |
| 10.2 | Form of Resale and Registration Rights Agreement* | |
| 10.3 | Form of Exchange Agreement* | |
| 10.4 | Form of Tax Receivable Agreement with Certain Holders of Convertible Preferred Stock* | |
| 10.5 | Form of Tax Receivable Agreement with Holders of Limited Partnership Units* | |
| 10.6 | Form of Stockholders Agreement* | |
| 10.7 | Form of Public Company Contingent Value Rights Agreement* | |
| 10.8 | Form of Partnership Contingent Value Rights Agreement* | |
| 10.9 | 2013 Omnibus Incentive Compensation Plan* | |
| 10.10 | 2013 Non-Employee Director Plan* | |
| 10.11 | Artisan Partners Asset Management Inc. Bonus Plan* | |
| 10.12 | Form of Amended and Restated Artisan Partners Holdings LP Class B Limited Partnership Interest Grant Agreement* | |
| 10.13 | Employment Agreement of Andrew A. Ziegler* | |
| 10.14 | Retention Agreement of Janet D. Olsen* | |
II-2
Table of Contents
| 10.15 | Form of Indemnification Agreement* | |
| 10.16 | Form of Indemnification Priority Agreement* | |
| 10.17 | Five-Year Revolving Credit Agreement, dated as of August 16, 2012, among Artisan Partners Holdings LP, the lenders named therein and Citibank, N.A., as Administrative Agent* | |
| 10.18 | Note Purchase Agreement, dated as of August 16, 2012, among Artisan Partners Holdings LP and the purchasers listed therein* | |
| 10.19 | Investment Advisory Agreement between Artisan Partners Limited Partnership and Artisan Funds Inc. for Artisan International Fund | |
| 10.20 | Investment Advisory Agreement between Artisan Partners Limited Partnership and Artisan Funds Inc. for Artisan Mid Cap Value Fund | |
| 10.21 | Investment Advisory Agreement between Artisan Partners Limited Partnership and Artisan Funds Inc. for Artisan Mid Cap Fund | |
| 21.1 | Subsidiaries of the Registrant | |
| 23.1 | Consent of PricewaterhouseCoopers LLP | |
| 23.2 | Consent of Sullivan & Cromwell LLP (included in Exhibit 5.1)* | |
| 23.3 | Consent of Matthew R. Barger | |
| 23.4 | Consent of Tench Coxe | |
| 23.5 | Consent of Allen R. Thorpe | |
| 24.1 | Power of Attorney (included on signature page) | |
| * | To be filed by amendment. |
(b) Consolidated Financial Statement Schedules: All schedules are omitted because the required information is inapplicable or the information is presented in the consolidated financial statements and the related notes.
| Item 17. | Undertakings |
The undersigned hereby undertakes:
(a) The undersigned Registrant hereby undertakes to provide to the underwriter at the closing specified in the underwriting agreement certificates in such denominations and registered in such names as required by the underwriter to permit prompt delivery to each purchaser.
(b) Insofar as indemnification for liabilities arising under the Securities Act of 1933 may be permitted to directors, officers and controlling persons of the registrant pursuant to the foregoing provisions, or otherwise, the Registrant has been advised that in the opinion of the Securities and Exchange Commission such indemnification is against public policy as expressed in the Act and is, therefore, unenforceable. In the event that a claim for indemnification against such liabilities (other than the payment by the registrant of expenses incurred or paid by a director, officer, or controlling person of the registrant in the successful defense of any action, suit or proceeding) is asserted by such director, officer or controlling person in connection with the securities being registered, the registrant will, unless in the opinion of its counsel the matter has been settled by controlling precedent, submit to a court of appropriate jurisdiction the question whether such indemnification by it is against public policy as expressed in the Act and will be governed by the final adjudication of such issue.
II-3
Table of Contents
(c) The undersigned Registrant hereby undertakes that:
(1) For purposes of determining any liability under the Securities Act of 1933, the information omitted from the form of prospectus filed as part of this Registration Statement in reliance upon Rule 430A and contained in a form of prospectus filed by the Registrant pursuant to Rule 424(b)(1) or (4) or 497(h) under the Securities Act shall be deemed to be part of this Registration Statement as of the time it was declared effective.
(2) For the purpose of determining any liability under the Securities Act of 1933, each post-effective amendment that contains a form of prospectus shall be deemed to be a new Registration Statement relating to the securities offered therein, and the offering of such securities at that time shall be deemed to be the initial bona fide offering thereof.
II-4
Table of Contents
SIGNATURES
Pursuant to the requirements of the Securities Act of 1933, the Registrant has duly caused this Registration Statement to be signed on its behalf by the undersigned, thereunto duly authorized, in the City of Milwaukee, State of Wisconsin, on October 31, 2012.
| Artisan Partners Asset Management Inc. | ||
| By: |
/s/ Eric R. Colson | |
| Name: Eric R. Colson | ||
| Title: President and Chief Executive Officer | ||
The undersigned directors and officers do hereby constitute and appoint Janet D. Olsen and Charles J. Daley, Jr. and either of them, with full power of substitution, our true and lawful attorneys-in-fact and agents to do any and all acts and things in our name and behalf in our capacities as directors and officers, and to execute any and all instruments for us and in our names in the capacities indicated below, that such person may deem necessary or advisable to enable the Registrant to comply with the Securities Act of 1933 (the “Act”) and any rules, regulations and requirements of the Securities and Exchange Commission in connection with this registration statement, including specifically, but not limited to, power and authority to sign for us, or any of us, in the capacities indicated below, any and all amendments hereto (including pre-effective and post-effective amendments or any other registration statement filed pursuant to the provisions of Rule 462(b) under the Act); and we do hereby ratify and confirm all that such person or persons shall do or cause to be done by virtue hereof.
Pursuant to the requirements of the Act, this Registration Statement has been signed by the following persons in the capacities indicated on the 31st day of October, 2012.
| Signature |
Title | |
| /s/ Eric R. Colson |
President and Chief Executive Officer and Director (principal executive officer) | |
| Eric R. Colson | ||
| /s/ Charles J. Daley, Jr. |
Executive Vice President, Chief Financial Officer and Treasurer (principal financial and accounting officer) | |
| Charles J. Daley, Jr. | ||
| /s/ Andrew A. Ziegler |
Executive Chairman and Director | |
| Andrew A. Ziegler | ||
II-5