Attached files
| file | filename |
|---|---|
| 8-K - FORM 8-K - Piedmont Office Realty Trust, Inc. | d428353d8k.htm |
| EX-99.1 - EX-99.1 - Piedmont Office Realty Trust, Inc. | d428353dex991.htm |
Exhibit 99.2

Quarterly Supplemental Information
September 30, 2012
| Corporate Headquarters | Institutional Analyst Contact | Investor Relations | ||
| 11695 Johns Creek Parkway, Suite 350 | Telephone: 770.418.8592 | Telephone: 866.354.3485 | ||
| Johns Creek, GA 30097 | research.analysts@piedmontreit.com | investor.services@piedmontreit.com | ||
| Telephone: 770.418.8800 | www.piedmontreit.com | |||
Piedmont Office Realty Trust, Inc.
Quarterly Supplemental Information
Index
Notice to Readers:
Please refer to page 44 for a discussion of important risks related to the business of Piedmont Office Realty Trust, Inc., as well as an investment in its securities, including risks that could cause actual results and events to differ materially from results and events referred to in the forward-looking information. Considering these risks, uncertainties, assumptions, and limitations, the forward-looking statements about leasing, financial operations, leasing prospects, etc. contained in this supplemental reporting package might not occur.
Certain prior period amounts have been reclassified to conform to the current period financial statement presentation. In addition, many of the schedules herein contain rounding to the nearest thousands or millions and, therefore, the schedules may not total due to this rounding convention. When the Company sells properties, it restates historical income statements with the financial results of the sold assets presented in discontinued operations.
Piedmont Office Realty Trust, Inc.
Corporate Data
Piedmont Office Realty Trust, Inc. (also referred to herein as “Piedmont” or the “Company”) (NYSE: PDM) is a fully-integrated and self-managed real estate investment trust (“REIT”) specializing in the acquisition, ownership, management, development and disposition of primarily high-quality Class A office buildings located predominantly in large U.S. office markets and leased principally to high-credit-quality tenants. Approximately 82% of our Annualized Lease Revenue (“ALR”)(1) is derived from our office properties located within the ten largest U.S. office markets, including Chicago, Washington, D.C., the New York metropolitan area, Boston and greater Los Angeles. Since its first acquisition in 1998, the Company has acquired $5.9 billion of office and industrial properties (inclusive of joint ventures) through September 30, 2012. Rated as an investment-grade company by Standard & Poor’s and Moody’s, Piedmont has maintained a low-leverage strategy while acquiring its properties.
This data supplements the information provided in our reports filed with the Securities and Exchange Commission and should be reviewed in conjunction with such filings.
| As
of September 30, 2012 |
As
of December 31, 2011 |
|||||||||
| Number of consolidated office properties (2) |
74 | 79 | ||||||||
| Rentable square footage (in thousands) (2) |
20,488 | 20,942 | ||||||||
| Percent leased (3) |
87.0% | 86.5% | ||||||||
| Percent leased - stabilized portfolio (4) |
90.1% | 89.1% | ||||||||
| Capitalization (in thousands): |
||||||||||
| Total debt - principal amount outstanding |
$1,436,025 | $1,472,525 | ||||||||
| Equity market capitalization (5) |
$2,913,889 | $2,941,611 | ||||||||
| Total market capitalization (5) |
$4,349,914 | $4,414,136 | ||||||||
| Total debt / Total market capitalization |
33.0% | 33.4% | ||||||||
| Total debt / Total gross assets |
27.5% | 27.5% | ||||||||
| Common stock data |
||||||||||
| High closing price during quarter |
$17.92 | $17.50 | ||||||||
| Low closing price during quarter |
$16.64 | $15.42 | ||||||||
| Closing price of common stock at period end |
$17.34 | $17.04 | ||||||||
| Weighted average fully diluted shares outstanding (in thousands) (6) |
171,295 | 172,981 | ||||||||
| Shares of common stock issued and outstanding (in thousands) |
168,044 | 172,630 | ||||||||
| Rating / outlook |
||||||||||
| Standard & Poor’s |
BBB / Stable | BBB / Stable | ||||||||
| Moody’s |
Baa2 / Stable | Baa2 / Stable | ||||||||
| Employees |
118 | 116 | ||||||||
| (1) | The definition for Annualized Lease Revenue can be found on page 35. |
| (2) | As of September 30, 2012, our consolidated office portfolio consisted of 74 properties (exclusive of our equity interests in five properties owned through unconsolidated joint ventures). During the first quarter of 2012, we sold our portfolio of assets in Portland, OR, comprised of four office properties totaling 326,000 square feet and developable land totaling 18.2 acres. During the second quarter of 2012, we sold 26200 Enterprise Way, a 145,000 square foot office building located in Lake Forest, CA, and we purchased approximately 2.0 acres of developable land in Atlanta, GA. For additional detail on asset transactions during 2012, please refer to page 32. Until September 21, 2012, we owned two industrial properties located in Duncan, SC. Information regarding these industrial assets is excluded from this line item. |
| (3) | Calculated as leased square footage on September 30, 2012 plus square footage associated with executed new leases for currently vacant spaces divided by total rentable square footage (defined in note 2 above), expressed as a percentage. This measure is presented for our 74 consolidated office properties and excludes unconsolidated joint venture properties. Please refer to page 22 for additional analyses regarding Piedmont's leased percentage. |
| (4) | Please refer to page 33 for information regarding value-add properties, data for which is removed from stabilized portfolio totals. |
| (5) | Based on a share price of $17.34 as of September 28, 2012. |
| (6) | Weighted average fully diluted shares outstanding are presented on a year-to-date basis for each period. |
3
Piedmont Office Realty Trust, Inc.
Investor Information
Corporate
11695 Johns Creek Parkway, Suite 350, Johns Creek, Georgia 30097
770.418.8800
www.piedmontreit.com
Executive Management
| Donald A. Miller, CFA | Robert E. Bowers | Laura P. Moon | ||
| Chief Executive Officer, President and Director |
Chief Financial Officer, Executive Vice President, Secretary, and Treasurer |
Chief Accounting Officer and Senior Vice President | ||
| Raymond L. Owens | Carroll A. Reddic, IV | |||
| Executive Vice President - Capital Markets |
Executive Vice President - Real Estate Operations, Assistant Secretary |
|||
Board of Directors
| W. Wayne Woody | Frank C. McDowell | Donald A. Miller, CFA | ||
| Director, Chairman of the Board of Directors and Chairman of Governance Committee |
Director, Vice Chairman of the Board of Directors and Chairman of Compensation Committee |
Chief Executive Officer, President and Director | ||
| Raymond G. Milnes, Jr. | Jeffery L. Swope | Michael R. Buchanan | ||
| Director and Chairman of Audit Committee |
Director and Chairman of Capital Committee |
Director | ||
| Wesley E. Cantrell | William H. Keogler, Jr. | Donald S. Moss | ||
| Director | Director | Director | ||
| Transfer Agent |
Corporate Counsel | |||
| Computershare | King & Spalding | |||
| P.O. Box 358010 Pittsburgh, PA 15252-8010 Phone: 866.354.3485 |
1180 Peachtree Street, NE Atlanta, GA 30309 Phone: 404.572.4600 | |||
4
Piedmont Office Realty Trust, Inc.
Financial Highlights
As of September 30, 2012
| Financial Results (1) |
| - Funds from operations (FFO) for the quarter ended September 30, 2012 was $55.2 million, or $0.33 per share (diluted), compared to $68.9 million, or $0.40 per share (diluted), for the same quarter in 2011. FFO for the nine months ended September 30, 2012 was $175.5 million, or $1.03 per share (diluted), compared to $205.4 million, or $1.19 per share (diluted), for the same period in 2011. The decrease in FFO for the three months and the nine months ended September 30, 2012 as compared to the same periods in 2011 was principally related to the following factors: 1) decreased operating income due to the disposition of certain assets with meaningful operating income contributions, notably 35 West Wacker Drive, offset somewhat by operating income contributions from newly acquired assets, 2) lower overall occupancy in 2012 as compared to 2011, 3) accrued potential litigation settlement expenses of $7.5 million in 2012 and 4) for the nine months only, reduced termination fee income in 2012 as compared to 2011. The reduction in FFO in 2012 as compared to 2011 was offset somewhat by reduced interest expense attributable to decreased total debt outstanding due to the repayment of several loans during the last twelve months.
- Core funds from operations (Core FFO) for the quarter ended September 30, 2012 was $62.7 million, or $0.37 per share (diluted), compared to $69.2 million, or $0.40 per share (diluted), for the same quarter in 2011. Core FFO for the nine months ended September 30, 2012 was $183.1 million, or $1.07 per share (diluted), compared to $206.3 million, or $1.19 per share (diluted), for the same period in 2011. The decrease in Core FFO for the three months and the nine months ended September 30, 2012 as compared to the same periods in 2011 was principally related to the items described above for changes in FFO, with the exception of the accrued potential litigation settlement expenses, which were added back to Core FFO since they were related to significant non-recurring items.
- Adjusted funds from operations (AFFO) for the quarter ended September 30, 2012 was $20.4 million, or $0.12 per share (diluted), compared to $51.0 million, or $0.29 per share (diluted), for the same quarter in 2011. AFFO for the nine months ended September 30, 2012 was $106.7 million, or $0.62 per share (diluted), compared to $157.9 million, or $0.91 per share (diluted), for the same period in 2011. The decrease in AFFO for the three months and the nine months ended September 30, 2012 as compared to the same periods in 2011 was primarily related to the items described above for changes in FFO, as well as increased non-incremental capital expenditures in 2012 as compared to 2011 attributable to the high volume of recent leasing activity. The decrease in AFFO for the nine months ended September 30, 2012 as compared to the same period in 2011 was also affected by increased straight line rent adjustments associated with rental abatements on newly commenced leases in 2012 as compared to 2011. |
|
Operations |
| - On a square footage leased basis, our total office portfolio was 87.0% leased as of September 30, 2012, as compared to 86.5% as of December 31, 2011 and 85.0% as of June 30, 2012. During the twelve-month period ending September 30, 2012, our same store stabilized leased percentage increased from 87.9% at September 30, 2011 to 90.0% at September 30, 2012. The same store stabilized leased percentage excludes the impact of value-add acquisitions completed in 2010 and 2011 (see page 33) from our same store portfolio. The primary reason for the increase in the leased percentage for our same store stabilized assets during that period is positive net absorption associated with several recent large lease transactions for previously vacant space, notably the Catamaran lease at Windy Point II in Schaumburg, IL and the US Foods lease at River Corporate Center in Tempe, AZ. Please refer to page 22 for additional leased percentage information.
- The weighted average remaining lease term of our portfolio was 7.0 years(2) as of September 30, 2012 as compared to 6.4 years at December 31, 2011.
- During the three months ended September 30, 2012, the Company completed 1,052,000 square feet of total leasing. Of the total office leasing activity during the quarter, we signed renewal leases for 39,000 square feet and new tenant leases for 1,013,000 square feet (including a 396,000 square foot direct lease with Aon Corporation). A new lease for 26,000 square feet was signed at a joint venture asset during the quarter. During the first nine months of the year, we completed 2,068,000 square feet of leasing for our consolidated office properties and 2,467,000 square feet of leasing inclusive of activity associated with our industrial and unconsolidated joint venture assets. The average committed capital cost for leases signed during the first nine months of the year at our consolidated office properties was $5.52 per square foot per year of lease term. Average committed capital cost per square foot per year of lease term for renewal leases signed during the nine months ended September 30, 2012 was $2.48 and average committed capital cost per square foot per year of lease term for new leases signed during the same time period was $5.95 (see page 28). |
| (1) FFO, Core FFO and AFFO are supplemental non-GAAP financial measures. See pages 35-36 for definitions of non-GAAP financial measures. See pages 13 and 38 for reconciliations of FFO, Core FFO and AFFO to Net Income. (2) Remaining lease term (after taking into account leases for vacant spaces which had been executed but not commenced as of September 30, 2012) is weighted based on Annualized Lease Revenue, as defined on page 35. |
5
Piedmont Office Realty Trust, Inc.
Financial Highlights
As of September 30, 2012
| - | During the three months ended September 30, 2012, we executed eight leases greater than 20,000 square feet at our consolidated office properties. Please see information on those leases listed below. |
| Tenant Name | Property | Property Location | Square Feet Leased |
Expiration Year | Lease Type | |||||
| Aon Corporation | Aon Center | Chicago, IL | 396,406 | 2028 | New (former sub-tenant) | |||||
| Catamaran, Inc. |
Windy Point II | Schaumburg, IL | 300,686 | 2024 | New | |||||
| Guidance Software, Inc. |
1055 East Colorado Boulevard | Pasadena, CA | 86,790 | 2024 | New | |||||
| General Electric Company |
500 West Monroe Street | Chicago, IL | 53,972 | 2027 | New | |||||
| BGC Brokers US, LP |
500 West Monroe Street | Chicago, IL | 31,999 | 2028 | New | |||||
| Starr Indemnity & Liability Company, Inc. |
500 West Monroe Street | Chicago, IL | 26,966 | 2028 | Renewal / Expansion | |||||
| Schlumberger Technology Corp. | 1200 Enclave Parkway | Houston, TX | 26,358 | 2024 | Expansion | |||||
|
Hospital Management Services of Florida, Inc. |
Sarasota Commerce Center II | Sarasota, FL | 21,821 | 2020 | Expansion |
Leasing Update
| - | As of September 30, 2012, there were three tenants whose leases contributed greater than 1% to our Annualized Lease Revenue (ALR) and were in holdover or were scheduled to expire during the eighteen month period following the end of the third quarter of 2012. Information regarding the leasing status of the spaces associated with those tenants’ leases is presented below. |
| Tenant Name | Property | Property Location | Square Footage (1) |
Percentage of Current Quarter ALR (%) |
Expiration (2) | Current Leasing Status | ||||||
| United States of America (National Park Service) |
1201 Eye Street | Washington, D.C. | 219,750 | 1.8% | Holdover | National Park Service is now in holdover status. The Company anticipates that the National Park Service will sign a medium-term lease renewal for its existing space at the building. | ||||||
| Comptroller of the Currency | One Independence Square |
Washington, D.C. | 333,815 | 3.8% | Q1 2013 | The tenant is expected to vacate at lease expiration. The Company is actively marketing the space for lease. | ||||||
| BP | Aon Center | Chicago, IL | 776,359 | 5.8% | Q4 2013 | During the third quarter, Aon Corporation signed a 396,000 square foot, 15-year lease for space it currently subleases from BP. There will be no downtime between the expiration of the BP lease and the commencement of the Aon lease. Additionally, long-term leases comprising approximately 37% of the square footage leased by BP have been entered into with: Thoughtworks, Integrys Energy Group, and Federal Home Loan Bank. In total, leases comprising approximately 88% of the square footage leased by BP have been signed. |
(1) Square footage represents the total square footage leased by the tenant at the building expiring during the expiration quarter.
(2) The lease expiration date presented is that of the majority of the space leased to the tenant at the building.
6
Piedmont Office Realty Trust, Inc.
Financial Highlights
As of September 30, 2012
| - | Piedmont typically signs leases several months in advance of their anticipated lease commencement dates. Presented below is a schedule of uncommenced leases greater than 50,000 square feet and their anticipated commencement dates. Lease renewals are excluded from this schedule. |
| Tenant Name | Property | Property Location | Square Feet Leased |
Space Status | Estimated Commencement Date |
New / Expansion | ||||||
| GE Capital (1) | 500 West Monroe Street | Chicago, IL | 86,028 | Vacant | Q4 2012 - Q4 2014 | Expansion | ||||||
| General Electric Company |
500 West Monroe Street | Chicago, IL | 53,972 | Vacant | Q1 2013 | New | ||||||
| Catamaran, Inc. |
Windy Point II | Schaumburg, IL | 300,686 | Vacant | Q1 2013 | New | ||||||
| Brother International Corporation | 200 Bridgewater Crossing | Bridgewater, NJ | 101,724 | Vacant | Q1 2013 | New | ||||||
| Guidance Software, Inc. | 1055 East Colorado Boulevard | Pasadena, CA | 66,489 | Vacant | Q3 2013 | New | ||||||
| Guidance Software, Inc. | 1055 East Colorado Boulevard | Pasadena, CA | 20,301 | Not Vacant | Q3 2013 | New | ||||||
| Aon Corporation | Aon Center | Chicago, IL | 396,406 | Not Vacant | Q4 2013 | New | ||||||
| Thoughtworks, Inc. |
Aon Center | Chicago, IL | 52,529 | Not Vacant | Q4 2013 | New | ||||||
|
Federal Home Loan Bank of Chicago |
Aon Center | Chicago, IL | 79,054 | Not Vacant | Q4 2013 | New | ||||||
| Integrys Business Support, LLC |
Aon Center | Chicago, IL | 159,432 | Not Vacant | Q2 2014 | New | ||||||
| Piper Jaffray & Co. |
US Bancorp Center | Minneapolis, MN | 123,882 | Not Vacant | Q2 2014 | New |
(1) The square footage presented includes the 19th floor premises, which is leased through fourth quarter 2012. GE is required to lease that space one year after the commencement of the renewal term.
Occupancy versus NOI Analysis
| - | Piedmont has been in a period of high lease rollover since 2010. This high lease rollover has resulted in a decrease in leased percentage and economic leased percentage. This, in turn, has effected a lower Same Store NOI than might otherwise be anticipated given the overall leased percentage and the historical relationship between leased percentage and Same Store NOI. The decreased economic leased percentage is attributable to two factors: |
1) leases which have been contractually entered into for currently vacant space which have not commenced (amounting to approximately 706,000 square feet of leases as of September 30, 2012, or 3.4% of the office portfolio); and
2) leases which have commenced but the tenants have not commenced paying full rent due to rental abatements (amounting to 1.6 million square feet of leases as of September 30, 2012, or a 5.7% impact to leased percentage on an economic basis). Please see the chart below for a listing of major contributors.
As the executed but not commenced leases become effective and as the rental abatement periods expire, there will be greater Same Store NOI growth than might otherwise be expected based on changes in overall leased percentage alone during that time period.
| - | Due to the current economic environment, many new leases provide for rental abatement concessions to tenants. Those rental abatements typically occur at the beginning of a new lease's term. Since 2010, Piedmont has withstood a period of concentrated lease expirations. Due to the large number of new leases in the Company's portfolio, abatements provided under those new leases have impacted the Company's cash net operating income and AFFO. Presented below is a schedule of leases greater than 50,000 square feet that are currently under some form of rent abatement. |
| Tenant Name | Property | Property Location | Square Feet Leased |
Abatement Structure | Abatement Expiration | |||||
| US Foods, Inc. | River Corporate Center | Tempe, AZ | 133,225 | Base Rent | Q1 2013 | |||||
| State Street Bank |
1200 Crown Colony Drive | Quincy, MA | 234,668 | Base Rent | Q1 2013 | |||||
| KPMG |
Aon Center | Chicago, IL | 238,701 | Gross Rent | Q3 2013 | |||||
| United HealthCare | Aon Center | Chicago, IL | 55,059 | Gross Rent | Q4 2013 | |||||
| Synchronoss Technologies |
200 Bridgewater Crossing | Bridgewater, NJ | 78,581 | Base Rent (Partial) | Q4 2012 | |||||
| HD Vest |
Las Colinas Corporate Center I | Irving, TX | 81,069 | Base Rent | Q1 2013 | |||||
| Schlumberger Technology Corporation |
1200 Enclave Parkway | Houston, TX | 131,790 | Gross Rent / Base Rent (Partial) | Q1 2014 |
Financing and Capital Activity
| - | As of September 30, 2012, our ratio of debt to total gross assets was 27.5%, our ratio of debt to gross real estate assets was 31.6%, and our ratio of debt to total market capitalization was 33.0%. These debt ratios are based on total principal amount outstanding for our various loans at September 30, 2012. |
| - | On September 21, 2012, Piedmont completed the sale of its two remaining industrial properties, located at 110 and 112 Hidden Lake Circle in Duncan, SC. The buildings are comprised of 787,380 square feet and are 100% leased. The properties were sold for $25.9 million, or $33 per square foot. Piedmont recorded a loss on the sale of the assets of approximately $0.25 million. The sale allowed the Company to divest its only remaining industrial properties in order to focus its operations on the ownership and management of office properties, achieving one of the Company's stated strategic objectives. |
7
Piedmont Office Realty Trust, Inc.
Financial Highlights
As of September 30, 2012
| - | On August 21, 2012, Piedmont closed on a new $500 million unsecured line of credit in order to replace an expiring credit facility of equal size. The revolver has a term of four years, with two six-month extension options, for a total potential term of five years. The interest rate for LIBOR-based loans is LIBOR + 117.5 basis points and the annual facility fee is 22.5 basis points. The facility is structured to allow for an increase in size up to a total commitment of $1.0 billion at the election of Piedmont; however, no existing bank has an obligation to participate in any such increase. JP Morgan Securities and RBC Capital Markets were Joint Lead Arrangers for the loan. The syndicate consists of a total of 11 banks. The Company's previous revolver was terminated concurrently with the closing of the new facility. |
| - | On August 1, 2012, the Board of Directors of Piedmont declared dividends for the third quarter of 2012 in the amount of $0.20 per common share outstanding to stockholders of record as of the close of business on August 31, 2012. The dividends were paid on September 21, 2012. The Company's dividend payout percentage for the nine months ended September 30, 2012 was 56.0% of Core FFO and 96.2% of AFFO. |
| - | During the third quarter of 2012, the Company repurchased approximately 2.2 million shares of common stock at an average purchase price of $16.95 per share, or approximately $37.1 million in aggregate (before consideration of transaction costs). Since the stock repurchase program's inception last fall, the Company has repurchased a total of 5.0 million shares at an average price of $16.77 per share, or approximately $83.2 million in aggregate (before consideration of transaction costs). Any future repurchases of the Company's common stock will be made at the discretion of the Company. As of quarter end, there was Board-approved capacity for additional repurchases totaling approximately $217 million under the stock repurchase plan. |
Subsequent Events
| - | On October 15, 2012, Piedmont completed the purchase of approximately 3.0 acres of land adjacent to Glenridge Highlands II, one of the Company’s properties in Atlanta, GA. Commonly referred to as Glenridge Highlands III, the site is located within the Central Perimeter submarket of Atlanta and is well located adjacent to the intersection of Interstate 285 and state highway Georgia 400. The location offers ease of access for commuter traffic and the ability for tenants to attract employees from across the northern portion of the Atlanta metropolitan area. The site is zoned for office development and will accommodate a building consisting of approximately 113,000 square feet. The acquisition adds to the Company's developable land holdings and allows the Company to control a site that is directly competitive to Glenridge Highlands II. |
| - | On October 30, 2012, the Board of Directors of Piedmont declared dividends for the fourth quarter of 2012 in the amount of $0.20 per common share outstanding to stockholders of record as of the close of business on November 30, 2012. The dividends are to be paid on December 21, 2012. |
| - | Since 2007, the Company has been a defendant in two class action lawsuits alleging inadequate disclosures in 2007 in SEC filings related to its internalization, response to a tender offer, and amendments to the Company’s charter. In August 2012, the court ruling in one of the cases granted Piedmont's motion for dismissal, and, in October 2012, the court ruling in the other case granted summary judgment in Piedmont’s favor and dismissed all charges. The plaintiffs appealed both rulings. Subsequent to the appeals, the Company reached tentative settlements with the plaintiffs in both cases totaling $7.5 million. The claims are within available insurance limits and the Company will seek recovery of these settlements from its insurance carriers after approval of the settlements by the court. See Piedmont’s Form 10-Q dated as of September 30, 2012 for further disclosure. |
| - | Subsequent to quarter end, Piedmont entered into a lease renewal with US Bancorp for 395,000 square feet at US Bancorp Center in Minneapolis, MN. The lease renewal is for a term of 10 years and further mitigates lease expiration exposure for the Company in 2014. As of the signing of this lease renewal, of the 635,000 square feet currently leased by US Bancorp at US Bancorp Center, a total of approximately 519,000 square feet has been released under long-term leases. |
Guidance for 2012
| - | The Company is adjusting its financial guidance for calendar year 2012 to the upper end of its previously published range as follows: |
| Low High | ||
| Core Funds from Operations |
$240 - $250 million | |
| Core Funds from Operations per diluted share |
$1.40 - $1.45 |
These estimates reflect management’s view of current market conditions and incorporate certain economic and operational assumptions and projections, including the disposition of 35 West Wacker Drive, which contributed approximately $0.13 per share of funds from operations in 2011. Actual results could differ from these estimates. Note that individual quarters may fluctuate on both a cash and an accrual basis due to the timing of lease commencements and expirations, repairs and maintenance, capital expenditures, capital markets activities and one-time revenue or expense events. In addition, the Company’s guidance is based on information available to management as of the date of this supplemental report.
8
Piedmont Office Realty Trust, Inc.
Key Performance Indicators
Unaudited (in thousands except for per share data)
This section of our supplemental report includes non-GAAP financial measures, including, but not limited to, Core Earnings Before Interest, Taxes, Depreciation, and Amortization (Core EBITDA), Funds from Operations (FFO), Core Funds from Operations (Core FFO), and Adjusted Funds from Operations (AFFO). Definitions of these non-GAAP measures are provided on pages 35-36 and reconciliations are provided on pages 38-40.
| Three Months Ended | ||||||||||||||||||||
|
Selected Operating Data |
9/30/2012 |
6/30/2012 |
3/31/2012 |
12/31/2011 |
9/30/2011 |
|||||||||||||||
| Percent leased (1) |
87.0% | 85.0% | 84.4% | 86.5% | 86.4% | |||||||||||||||
| Percent leased - stabilized portfolio (1) (2) |
90.1% | 88.1% | 87.5% | 89.1% | 88.8% | |||||||||||||||
| Rental income |
$106,826 | $105,408 | $104,943 | $105,643 | $104,121 | |||||||||||||||
| Total revenues |
$134,891 | $133,091 | $132,320 | $135,623 | $132,478 | |||||||||||||||
| Total operating expenses |
$100,944 | $97,467 | $97,778 | $103,195 | $96,137 | |||||||||||||||
| Real estate operating income |
$33,947 | $35,624 | $34,542 | $32,428 | $36,341 | |||||||||||||||
| Core EBITDA |
$79,161 | $76,327 | $76,680 | $82,523 | $86,941 | |||||||||||||||
| Core FFO |
$62,721 | $60,356 | $60,043 | $65,270 | $69,203 | |||||||||||||||
| Core FFO per share - diluted |
$0.37 | $0.35 | $0.35 | $0.38 | $0.40 | |||||||||||||||
| AFFO |
$20,351 | $36,216 | $50,113 | $44,728 | $50,988 | |||||||||||||||
| AFFO per share - diluted |
$0.12 | $0.21 | $0.29 | $0.26 | $0.29 | |||||||||||||||
| Gross dividends |
$33,675 | $34,418 | $34,526 | $54,441 | $54,441 | |||||||||||||||
| Dividends per share |
$0.200 | $0.200 | $0.200 | $0.315 | $0.315 | |||||||||||||||
| Selected Balance Sheet Data |
||||||||||||||||||||
| Total real estate assets |
$3,612,550 | $3,638,101 | $3,657,677 | $3,704,051 | $3,926,638 | |||||||||||||||
| Total gross real estate assets |
$4,550,183 | $4,558,128 | $4,590,544 | $4,615,812 | $4,875,854 | |||||||||||||||
| Total assets |
$4,285,831 | $4,328,308 | $4,326,698 | $4,447,834 | $4,613,118 | |||||||||||||||
| Net debt (3) |
$1,392,261 | $1,325,610 | $1,298,738 | $1,323,796 | $1,600,650 | |||||||||||||||
| Total liabilities |
$1,620,551 | $1,601,568 | $1,550,040 | $1,674,406 | $1,896,195 | |||||||||||||||
| Ratios |
||||||||||||||||||||
| Core EBITDA margin (4) |
58.5% | 56.9% | 57.1% | 55.8% | 59.8% | |||||||||||||||
| Fixed charge coverage ratio (5) |
4.9 x | 4.8 x | 4.6 x | 4.7 x | 4.9 x | |||||||||||||||
| Net debt to core EBITDA (6) (7) |
4.4 x | 4.3 x | 4.2 x | 4.0 x | 4.6 x | |||||||||||||||
(1) Please refer to page 22 for additional leased percentage information.
(2) Please refer to page 33 for additional information on value-add properties, data for which is removed from stabilized portfolio totals.
(3) Net debt is calculated as the total principal amount of debt outstanding minus cash and cash equivalents and escrow deposits and restricted cash. The decrease in net debt during the fourth quarter of 2011 was primarily attributable to the application of proceeds from the sale of 35 West Wacker Drive.
(4) Core EBITDA margin is calculated as Core EBITDA divided by total revenues (including revenues associated with discontinued operations).
(5) The fixed charge coverage ratio is calculated as Core EBITDA divided by the sum of interest expense, principal amortization, capitalized interest and preferred dividends. The Company had no capitalized interest, principal amortization or preferred dividends during any of the periods presented.
(6) The Company's net debt declined during the fourth quarter of 2011 with the application of the proceeds from the sale of 35 West Wacker Drive, thereby positively affecting the net debt to core EBITDA ratios.
(7) Core EBITDA is annualized for the purposes of this calculation.
9
Piedmont Office Realty Trust, Inc.
Consolidated Balance Sheets
Unaudited (in thousands)
| September 30, 2012 | June 30, 2012 | March 31, 2012 | December 31, 2011 | September 30, 2011 | ||||||||||||||||
| Assets: |
||||||||||||||||||||
| Real estate, at cost: |
||||||||||||||||||||
| Land assets |
$ | 627,812 | $ | 629,476 | $ | 631,745 | $ | 640,196 | $ | 693,229 | ||||||||||
| Buildings and improvements |
3,760,847 | 3,754,954 | 3,750,475 | 3,759,596 | 3,930,126 | |||||||||||||||
| Buildings and improvements, accumulated depreciation |
(857,993) | (837,285) | (813,679) | (792,342) | (807,917) | |||||||||||||||
| Intangible lease asset |
138,716 | 149,544 | 191,599 | 198,667 | 232,973 | |||||||||||||||
| Intangible lease asset, accumulated amortization |
(79,640) | (82,742) | (119,188) | (119,419) | (141,299) | |||||||||||||||
| Construction in progress |
22,808 | 24,154 | 16,725 | 17,353 | 19,526 | |||||||||||||||
|
|
|
|
|
|
|
|
|
|
|
|||||||||||
| Total real estate assets |
3,612,550 | 3,638,101 | 3,657,677 | 3,704,051 | 3,926,638 | |||||||||||||||
| Investment in unconsolidated joint ventures |
37,369 | 37,580 | 37,901 | 38,181 | 38,391 | |||||||||||||||
| Cash and cash equivalents |
20,763 | 26,869 | 28,679 | 139,690 | 16,128 | |||||||||||||||
| Tenant receivables, net of allowance for doubtful accounts |
24,768 | 22,884 | 24,932 | 24,722 | 32,066 | |||||||||||||||
| Straight line rent receivable |
116,447 | 111,731 | 106,723 | 104,801 | 110,818 | |||||||||||||||
| Notes receivable |
19,000 | 19,000 | 19,000 | - | - | |||||||||||||||
| Due from unconsolidated joint ventures |
533 | 569 | 449 | 788 | 643 | |||||||||||||||
| Escrow deposits and restricted cash |
23,001 | 48,046 | 25,108 | 9,039 | 47,747 | |||||||||||||||
| Prepaid expenses and other assets |
13,552 | 7,385 | 12,477 | 9,911 | 13,978 | |||||||||||||||
| Goodwill |
180,097 | 180,097 | 180,097 | 180,097 | 180,097 | |||||||||||||||
| Deferred financing costs, less accumulated amortization |
7,022 | 4,597 | 5,187 | 5,977 | 4,788 | |||||||||||||||
| Deferred lease costs, less accumulated amortization |
230,729 | 231,449 | 228,468 | 230,577 | 241,824 | |||||||||||||||
|
|
|
|
|
|
|
|
|
|
|
|||||||||||
| Total assets |
$ | 4,285,831 | $ | 4,328,308 | $ | 4,326,698 | $ | 4,447,834 | $ | 4,613,118 | ||||||||||
|
|
|
|
|
|
|
|
|
|
|
|||||||||||
| Liabilities: |
||||||||||||||||||||
| Line of credit and notes payable |
$ | 1,436,025 | $ | 1,400,525 | $ | 1,352,525 | $ | 1,472,525 | $ | 1,664,525 | ||||||||||
| Accounts payable, accrued expenses, and accrued capital expenditures |
109,125 | 126,207 | 116,292 | 122,986 | 143,106 | |||||||||||||||
| Deferred income |
24,110 | 23,668 | 32,031 | 27,321 | 32,514 | |||||||||||||||
| Intangible lease liabilities, less accumulated amortization |
42,375 | 44,246 | 46,640 | 49,037 | 56,050 | |||||||||||||||
| Interest rate swap |
8,916 | 6,922 | 2,552 | 2,537 | - | |||||||||||||||
|
|
|
|
|
|
|
|
|
|
|
|||||||||||
| Total liabilities |
1,620,551 | 1,601,568 | 1,550,040 | 1,674,406 | 1,896,195 | |||||||||||||||
| Stockholders’ equity: |
||||||||||||||||||||
| Common stock |
1,680 | 1,702 | 1,726 | 1,726 | 1,728 | |||||||||||||||
| Additional paid in capital |
3,665,870 | 3,665,284 | 3,664,202 | 3,663,662 | 3,663,155 | |||||||||||||||
| Cumulative distributions in excess of earnings |
(994,967) | (934,933) | (888,331) | (891,032) | (952,370) | |||||||||||||||
| Other comprehensive loss |
(8,916) | (6,922) | (2,552) | (2,537) | - | |||||||||||||||
|
|
|
|
|
|
|
|
|
|
|
|||||||||||
| Piedmont stockholders’ equity |
2,663,667 | 2,725,131 | 2,775,045 | 2,771,819 | 2,712,513 | |||||||||||||||
| Non-controlling interest |
1,613 | 1,609 | 1,613 | 1,609 | 4,410 | |||||||||||||||
|
|
|
|
|
|
|
|
|
|
|
|||||||||||
| Total stockholders’ equity |
2,665,280 | 2,726,740 | 2,776,658 | 2,773,428 | 2,716,923 | |||||||||||||||
|
|
|
|
|
|
|
|
|
|
|
|||||||||||
| Total liabilities, redeemable common stock and stockholders’ equity |
$ | 4,285,831 | $ | 4,328,308 | $ | 4,326,698 | $ | 4,447,834 | $ | 4,613,118 | ||||||||||
|
|
|
|
|
|
|
|
|
|
|
|||||||||||
| Common stock outstanding at end of period |
168,044 | 170,235 | 172,630 | 172,630 | 172,827 | |||||||||||||||
10
Piedmont Office Realty Trust, Inc.
Consolidated Statements of Income
Unaudited (in thousands except for per share data)
| Three Months Ended | ||||||||||||||||||||
|
|
|
|||||||||||||||||||
| 9/30/2012 | 6/30/2012 | 3/31/2012 | 12/31/2011 | 9/30/2011 | ||||||||||||||||
|
|
|
|||||||||||||||||||
| Revenues: |
||||||||||||||||||||
| Rental income |
$ | 106,826 | $ | 105,408 | $ | 104,943 | $ | 105,643 | $ | 104,121 | ||||||||||
| Tenant reimbursements |
27,470 | 26,969 | 26,680 | 29,379 | 28,234 | |||||||||||||||
| Property management fee revenue |
520 | 626 | 574 | 281 | 110 | |||||||||||||||
| Other rental income |
75 | 88 | 123 | 320 | 13 | |||||||||||||||
|
|
|
|||||||||||||||||||
| Total revenues |
134,891 | 133,091 | 132,320 | 135,623 | 132,478 | |||||||||||||||
| Operating expenses: |
||||||||||||||||||||
| Property operating costs |
51,645 | 53,571 | 52,619 | 54,992 | 50,707 | |||||||||||||||
| Depreciation |
28,489 | 27,586 | 27,176 | 26,611 | 25,891 | |||||||||||||||
| Amortization |
15,302 | 11,445 | 12,726 | 15,387 | 14,808 | |||||||||||||||
| Impairment loss |
- | - | - | - | - | |||||||||||||||
| General and administrative |
5,508 | 4,865 | 5,257 | 6,205 | 4,731 | |||||||||||||||
|
|
|
|||||||||||||||||||
| Total operating expenses |
100,944 | 97,467 | 97,778 | 103,195 | 96,137 | |||||||||||||||
|
|
|
|||||||||||||||||||
| Real estate operating income |
33,947 | 35,624 | 34,542 | 32,428 | 36,341 | |||||||||||||||
| Other income (expense): |
||||||||||||||||||||
| Interest expense |
(16,247) | (15,943) | (16,537) | (16,179) | (16,236) | |||||||||||||||
| Interest and other income (expense) |
383 | 285 | 97 | (357) | (91) | |||||||||||||||
| Equity in income of unconsolidated joint ventures |
322 | 246 | 170 | 587 | 485 | |||||||||||||||
| Litigation settlement expense |
(7,500) | - | - | - | - | |||||||||||||||
| Gain / (loss) on extinguishment of debt |
- | - | - | 1,039 | - | |||||||||||||||
|
|
|
|||||||||||||||||||
| Total other income (expense) |
(23,042) | (15,412) | (16,270) | (14,910) | (15,842) | |||||||||||||||
|
|
|
|||||||||||||||||||
| Income from continuing operations |
10,905 | 20,212 | 18,272 | 17,518 | 20,499 | |||||||||||||||
| Discontinued operations: |
||||||||||||||||||||
| Operating income, excluding impairment loss |
184 | 492 | 1,129 | 5,605 | 3,775 | |||||||||||||||
| Gain / (loss) on sale of properties |
(254) | 10,008 | 17,830 | 95,901 | 26,756 | |||||||||||||||
|
|
|
|||||||||||||||||||
| Income / (loss) from discontinued operations (1) |
(70) | 10,500 | 18,959 | 101,506 | 30,531 | |||||||||||||||
|
|
|
|||||||||||||||||||
| Net income |
10,835 | 30,712 | 37,231 | 119,024 | 51,030 | |||||||||||||||
| Less: Net income attributable to noncontrolling interest |
(4) | (4) | (4) | (4) | (4) | |||||||||||||||
|
|
|
|||||||||||||||||||
| Net income attributable to Piedmont |
$ | 10,831 | $ | 30,708 | $ | 37,227 | $ | 119,020 | $ | 51,026 | ||||||||||
|
|
|
|||||||||||||||||||
| Weighted average common shares outstanding - diluted |
168,929 | 172,209 | 172,874 | 173,036 | 173,045 | |||||||||||||||
| Net income per share available to common stockholders - diluted |
$ | 0.06 | $ | 0.18 | $ | 0.22 | $ | 0.69 | $ | 0.29 | ||||||||||
|
|
|
|||||||||||||||||||
(1) Reflects operating results for Eastpointe Corporate Center in Issaquah, WA, which was sold on July 1, 2011; 5000 Corporate Court in Holtsville, NY, which was sold on August 31, 2011; 35 West Wacker Drive in Chicago, IL, which was sold on December 15, 2011; Deschutes, Rhein, Rogue, Willamette, and Portland Land Parcels in Beaverton, OR, which were all sold on March 19, 2012; 26200 Enterprise Way in Lake Forest, CA, which was sold on May 31, 2012; and 110 and 112 Hidden Lake Circle in Duncan, SC, which were sold on September 21, 2012.
11
Piedmont Office Realty Trust, Inc.
Consolidated Statements of Income
Unaudited (in thousands except for per share data)
| Three Months Ended | Nine Months Ended | |||||||||||||||||||||||||||||||
| 9/30/2012 | 9/30/2011 | Change | Change | 9/30/2012 | 9/30/2011 | Change | Change | |||||||||||||||||||||||||
| Revenues: |
||||||||||||||||||||||||||||||||
| Rental income |
$ | 106,826 | $ | 104,121 | $ | 2,705 | 2.6% | $ | 317,177 | $ | 306,450 | $ | 10,727 | 3.5% | ||||||||||||||||||
| Tenant reimbursements |
27,470 | 28,234 | (764) | -2.7% | 81,120 | 85,703 | (4,583) | -5.3% | ||||||||||||||||||||||||
| Property management fee revenue |
520 | 110 | 410 | 372.7% | 1,719 | 1,303 | 416 | 31.9% | ||||||||||||||||||||||||
| Other rental income |
75 | 13 | 62 | 476.9% | 287 | 4,415 | (4,128) | -93.5% | ||||||||||||||||||||||||
|
|
|
|
|
|
|
|
|
|
|
|
|
|
|
|
|
|||||||||||||||||
| Total revenues |
134,891 | 132,478 | 2,413 | 1.8% | 400,303 | 397,871 | 2,432 | 0.6% | ||||||||||||||||||||||||
| Operating expenses: |
||||||||||||||||||||||||||||||||
| Property operating costs |
51,645 | 50,707 | (938) | -1.8% | 157,835 | 152,207 | (5,628) | -3.7% | ||||||||||||||||||||||||
| Depreciation |
28,489 | 25,891 | (2,598) | -10.0% | 83,252 | 76,193 | (7,059) | -9.3% | ||||||||||||||||||||||||
| Amortization |
15,302 | 14,808 | (494) | -3.3% | 39,474 | 39,098 | (376) | -1.0% | ||||||||||||||||||||||||
| Impairment loss |
- | - | - | 0.0% | - | - | - | 0.0% | ||||||||||||||||||||||||
| General and administrative |
5,508 | 4,731 | (777) | -16.4% | 15,629 | 18,868 | 3,239 | 17.2% | ||||||||||||||||||||||||
|
|
|
|
|
|
|
|
|
|
|
|
|
|
|
|
|
|||||||||||||||||
| Total operating expenses |
100,944 | 96,137 | (4,807) | -5.0% | 296,190 | 286,366 | (9,824) | -3.4% | ||||||||||||||||||||||||
|
|
|
|
|
|
|
|
|
|
|
|
|
|
|
|
|
|||||||||||||||||
| Real estate operating income |
33,947 | 36,341 | (2,394) | -6.6% | 104,113 | 111,505 | (7,392) | -6.6% | ||||||||||||||||||||||||
| Other income (expense): |
||||||||||||||||||||||||||||||||
| Interest expense |
(16,247) | (16,236) | (11) | -0.1% | (48,727) | (49,638) | 911 | 1.8% | ||||||||||||||||||||||||
| Interest and other income (expense) |
383 | (91) | 474 | 520.9% | 765 | 3,130 | (2,365) | -75.6% | ||||||||||||||||||||||||
| Equity in income of unconsolidated joint ventures |
322 | 485 | (163) | -33.6% | 739 | 1,032 | (293) | -28.4% | ||||||||||||||||||||||||
| Litigation settlement expense |
(7,500) | - | (7,500) | 0.0% | (7,500) | - | (7,500) | 0.0% | ||||||||||||||||||||||||
| Gain / (loss) on consolidation of variable interest entity |
- | - | - | 0.0% | - | 1,532 | (1,532) | -100.0% | ||||||||||||||||||||||||
|
|
|
|
|
|
|
|
|
|
|
|
|
|
|
|
|
|||||||||||||||||
| Total other income (expense) |
(23,042) | (15,842) | (7,200) | -45.4% | (54,723) | (43,944) | (10,779) | -24.5% | ||||||||||||||||||||||||
|
|
|
|
|
|
|
|
|
|
|
|
|
|
|
|
|
|||||||||||||||||
| Income from continuing operations |
10,905 | 20,499 | (9,594) | -46.8% | 49,390 | 67,561 | (18,171) | -26.9% | ||||||||||||||||||||||||
| Discontinued operations: |
||||||||||||||||||||||||||||||||
| Operating income, excluding impairment loss |
184 | 3,775 | (3,591) | -95.1% | 1,805 | 11,715 | (9,910) | -84.6% | ||||||||||||||||||||||||
| Gain / (loss) on sale of properties |
(254) | 26,756 | (27,010) | -100.9% | 27,583 | 26,756 | 827 | 3.1% | ||||||||||||||||||||||||
|
|
|
|
|
|
|
|
|
|
|
|
|
|
|
|
|
|||||||||||||||||
| Income / (loss) from discontinued operations (1) |
(70) | 30,531 | (30,601) | -100.2% | 29,388 | 38,471 | (9,083) | -23.6% | ||||||||||||||||||||||||
|
|
|
|
|
|
|
|
|
|
|
|
|
|
|
|
|
|||||||||||||||||
| Net income |
10,835 | 51,030 | (40,195) | -78.8% | 78,778 | 106,032 | (27,254) | -25.7% | ||||||||||||||||||||||||
| Less: Net income attributable to noncontrolling interest |
(4) | (4) | - | 0.0% | (12) | (12) | - | 0.0% | ||||||||||||||||||||||||
|
|
|
|
|
|
|
|
|
|
|
|
|
|
|
|
|
|||||||||||||||||
| Net income attributable to Piedmont |
$ | 10,831 | $ | 51,026 | $ | (40,195) | -78.8% | $ | 78,766 | $ | 106,020 | $ | (27,254) | -25.7% | ||||||||||||||||||
|
|
|
|
|
|
|
|
|
|
|
|
|
|
|
|
|
|||||||||||||||||
| Weighted average common shares outstanding - diluted |
168,929 | 173,045 | 171,295 | 172,996 | ||||||||||||||||||||||||||||
| Net income per share available to common stockholders - diluted |
$ | 0.06 | $ | 0.29 | $ | 0.46 | $ | 0.61 | ||||||||||||||||||||||||
|
|
|
|
|
|
|
|
|
|||||||||||||||||||||||||
(1) Reflects operating results for Eastpointe Corporate Center in Issaquah, WA, which was sold on July 1, 2011; 5000 Corporate Court in Holtsville, NY, which was sold on August 31, 2011; 35 West Wacker Drive in Chicago, IL, which was sold on December 15, 2011; Deschutes, Rhein, Rogue, Willamette, and Portland Land Parcels in Beaverton, OR, which were all sold on March 19, 2012; 26200 Enterprise Way in Lake Forest, CA, which was sold on May 31, 2012; and 110 and 112 Hidden Lake Circle in Duncan, SC, which were sold on September 21, 2012.
12
Piedmont Office Realty Trust, Inc.
Funds From Operations, Core Funds From Operations and Adjusted Funds From Operations
Unaudited (in thousands except for per share data)
| Three Months Ended | Nine Months Ended | |||||||||||||||
| 9/30/2012 | 9/30/2011 | 9/30/2012 | 9/30/2011 | |||||||||||||
| Net income attributable to Piedmont |
$ | 10,831 | $ | 51,026 | $ | 78,766 | $ | 106,020 | ||||||||
| Depreciation (1) (2) |
28,763 | 28,102 | 84,605 | 83,135 | ||||||||||||
| Amortization (1) |
15,366 | 16,616 | 39,744 | 44,601 | ||||||||||||
| Impairment loss (1) |
- | - | - | - | ||||||||||||
| (Gain) / loss on sale of properties (1) |
254 | (26,826) | (27,583) | (26,872) | ||||||||||||
| (Gain) / loss on consolidation of VIE |
- | - | - | (1,532) | ||||||||||||
|
|
|
|
|
|
|
|
|
|||||||||
| Funds from operations |
55,214 | 68,918 | 175,532 | 205,352 | ||||||||||||
| Litigation settlement expense |
7,500 | - | 7,500 | - | ||||||||||||
| Acquisition costs |
7 | 285 | 88 | 975 | ||||||||||||
|
|
|
|
|
|
|
|
|
|||||||||
| Core funds from operations |
62,721 | 69,203 | 183,120 | 206,327 | ||||||||||||
| Depreciation of non real estate assets |
196 | 84 | 397 | 422 | ||||||||||||
| Stock-based and other non-cash compensation expense |
869 | 1,111 | 1,492 | 2,975 | ||||||||||||
| Deferred financing cost amortization (1) |
663 | 879 | 2,056 | 2,546 | ||||||||||||
| Amortization of fair market adjustments on notes payable |
- | 471 | - | 1,413 | ||||||||||||
| Straight-line effects of lease revenue (1) |
(4,193) | (4,129) | (11,236) | (4,488) | ||||||||||||
| Amortization of lease-related intangibles (1) |
(1,315) | (1,817) | (4,631) | (4,850) | ||||||||||||
| Income from amortization of discount on purchase of mezzanine loans |
- | - | - | (484) | ||||||||||||
| Acquisition costs |
(7) | (285) | (88) | (975) | ||||||||||||
| Non-incremental capital expenditures (3) |
(38,583) | (14,529) | (64,430) | (45,009) | ||||||||||||
|
|
|
|
|
|
|
|
|
|||||||||
| Adjusted funds from operations |
$ | 20,351 | $ | 50,988 | $ | 106,680 | $ | 157,877 | ||||||||
|
|
|
|
|
|
|
|
|
|||||||||
| Weighted average common shares outstanding - diluted |
168,929 | 173,045 | 171,295 | 172,996 | ||||||||||||
| Funds from operations per share (diluted) |
$ | 0.33 | $ | 0.40 | $ | 1.03 | $ | 1.19 | ||||||||
| Core funds from operations per share (diluted) |
$ | 0.37 | $ | 0.40 | $ | 1.07 | $ | 1.19 | ||||||||
| Adjusted funds from operations per share (diluted) |
$ | 0.12 | $ | 0.29 | $ | 0.62 | $ | 0.91 | ||||||||
| (1) | Includes adjustments for consolidated properties, including discontinued operations, and for our proportionate ownership in unconsolidated joint ventures. |
| (2) | Excludes depreciation of non real estate assets. |
| (3) | Non-incremental capital expenditures are defined on page 36. |
13
Piedmont Office Realty Trust, Inc.
Same Store Net Operating Income (Cash Basis)
Unaudited (in thousands)
| Three Months Ended | Nine Months Ended | |||||||||||||||
| 9/30/2012 | 9/30/2011 | 9/30/2012 | 9/30/2011 | |||||||||||||
| Net income attributable to Piedmont |
$ | 10,831 | $ | 51,026 | $ | 78,766 | $ | 106,020 | ||||||||
| Net income attributable to noncontrolling interest |
4 | 135 | 12 | 378 | ||||||||||||
| Interest expense |
16,247 | 17,804 | 48,727 | 54,291 | ||||||||||||
| Depreciation (1) |
28,959 | 28,186 | 85,002 | 83,557 | ||||||||||||
| Amortization (1) |
15,366 | 16,616 | 39,744 | 44,601 | ||||||||||||
| Impairment loss (1) |
- | - | - | - | ||||||||||||
| Litigation settlement expense |
7,500 | - | 7,500 | - | ||||||||||||
| (Gain) / loss on sale of properties (1) |
254 | (26,826) | (27,583) | (26,872) | ||||||||||||
| (Gain) / loss on consolidation of VIE |
- | - | - | (1,532) | ||||||||||||
|
|
|
|
|
|
|
|
|
|||||||||
| Core EBITDA |
79,161 | 86,941 | 232,168 | 260,443 | ||||||||||||
| General & administrative expenses (1) |
5,576 | 4,747 | 15,760 | 18,843 | ||||||||||||
| Management fee revenue |
(520) | (110) | (1,719) | (1,303) | ||||||||||||
| Interest and other income (1) |
(383) | 74 | (785) | (3,132) | ||||||||||||
| Lease termination income |
(75) | 33 | (287) | (4,718) | ||||||||||||
| Lease termination expense - straight line rent & acquisition intangibles write-offs |
122 | 260 | 385 | 739 | ||||||||||||
| Straight-line effects of lease revenue (1) |
(4,337) | (4,296) | (11,643) | (4,963) | ||||||||||||
| Net effect of amortization of above/(below) market in-place lease intangibles (1) |
(1,293) | (1,911) | (4,609) | (5,115) | ||||||||||||
|
|
|
|
|
|
|
|
|
|||||||||
| Property net operating income - cash basis |
78,251 | 85,738 | 229,270 | 260,794 | ||||||||||||
| Net operating income from: |
||||||||||||||||
| Acquisitions (2) |
(3,576) | (3,393) | (10,612) | (6,837) | ||||||||||||
| Dispositions (3) |
(321) | (7,699) | (2,499) | (23,051) | ||||||||||||
| Unconsolidated joint ventures |
(735) | (818) | (1,923) | (2,172) | ||||||||||||
|
|
|
|
|
|
|
|
|
|||||||||
| Same store NOI - cash basis |
$ | 73,619 | $ | 73,828 | $ | 214,236 | $ | 228,734 | ||||||||
|
|
|
|
|
|
|
|
|
|||||||||
| Change period over period |
-0.3% | N/A | -6.3% | N/A | ||||||||||||
| Same Store Net Operating Income Top Seven Markets |
|
|||||||||||||||||||||||||||||||||||
| Three Months Ended | Nine Months Ended | |||||||||||||||||||||||||||||||||||
| 9/30/2012 | 9/30/2011 | 9/30/2012 | 9/30/2011 | |||||||||||||||||||||||||||||||||
| $ | % | $ | % | $ | % | $ | % | |||||||||||||||||||||||||||||
|
|
|
|
|
|
|
|
|
|||||||||||||||||||||||||||||
| Washington, D.C. (4) |
$ | 20,233 | 27.5 | $ | 18,068 | 24.5 | $ | 57,277 | 26.7 | $ | 53,820 | 23.5 | ||||||||||||||||||||||||
| New York (5) |
11,143 | 15.1 | 13,758 | 18.6 | 34,573 | 16.1 | 41,438 | 18.1 | ||||||||||||||||||||||||||||
| Chicago (6) |
11,306 | 15.4 | 14,989 | 20.3 | 30,309 | 14.2 | 40,201 | 17.6 | ||||||||||||||||||||||||||||
| Minneapolis (7) |
5,439 | 7.4 | 4,456 | 6.0 | 15,711 | 7.3 | 14,435 | 6.3 | ||||||||||||||||||||||||||||
| Dallas |
3,380 | 4.6 | 3,796 | 5.1 | 10,713 | 5.0 | 11,001 | 4.8 | ||||||||||||||||||||||||||||
| Los Angeles (8) |
3,701 | 4.9 | 2,490 | 3.4 | 10,109 | 4.7 | 9,947 | 4.4 | ||||||||||||||||||||||||||||
| Boston |
3,067 | 4.2 | 2,493 | 3.4 | 8,306 | 3.9 | 8,965 | 3.9 | ||||||||||||||||||||||||||||
| Other (9) |
15,350 | 20.9 | 13,778 | 18.7 | 47,238 | 22.1 | 48,927 | 21.4 | ||||||||||||||||||||||||||||
|
|
|
|
|
|
|
|
|
|||||||||||||||||||||||||||||
| Total |
$ | 73,619 | 100.0 | $ | 73,828 | 100.0 | $ | 214,236 | 100.0 | $ | 228,734 | 100.0 | ||||||||||||||||||||||||
|
|
|
|
|
|
|
|
|
|||||||||||||||||||||||||||||
(1) Includes amounts attributable to consolidated properties, including discontinued operations, and our proportionate share of amounts attributable to unconsolidated joint ventures.
(2) Acquisitions consist of 1200 Enclave Parkway in Houston, TX, purchased on March 30, 2011; 500 West Monroe Street in Chicago, IL, acquired on March 31, 2011; The Dupree in Atlanta, GA, purchased on April 29, 2011; The Medici in Atlanta, GA, purchased on June 7, 2011; 225 and 235 Presidential Way in Woburn, MA, purchased on September 13, 2011; 400 TownPark in Lake Mary, FL purchased on November 10, 2011; and Gavitello Land in Atlanta, GA, purchased on June 28, 2012.
(3) Dispositions consist of Eastpointe Corporate Center in Issaquah, WA, sold on July 1, 2011; 5000 Corporate Court in Holtsville, NY, sold on August 31, 2011; 35 West Wacker Drive in Chicago, IL, sold on December 15, 2011; Deschutes, Rhein, Rogue, Willamette, and Portland Land Parcels in Beaverton, OR, sold on March 19, 2012; 26200 Enterprise Way in Lake Forest, CA, sold on May 31, 2012; and 110 and 112 Hidden Lake Circle in Duncan, SC, sold on September 21, 2012.
(4) The increase in Washington, D.C. Same Store Net Operating Income for the three months and the nine months ended September 30, 2012 as compared to the same periods in 2011 was primarily attributable to two factors: 1) an increase in revenue due to a rental rate increase associated with the 21-month lease extension of the Comptroller of the Currency at One Independence Square in Washington, D.C., and 2) increased rental revenue as a result of the commencement of several new leases at Piedmont Pointe I and II in Bethesda, MD.
(5) The decrease in New York Same Store Net Operating Income for the three months and the nine months ended September 30, 2012 as compared to the same periods in 2011 was primarily related to the lease expirations of and the downtime and rental abatements associated with newly signed leases to backfill the spaces formerly occupied by sanofi-aventis at 200 & 400 Bridgewater Crossing in Bridgewater, NJ.
(6) The decrease in Chicago Same Store Net Operating Income for the three months and the nine months ended September 30, 2012 as compared to the same periods in 2011 was primarily related to the expiration of the Zurich American Insurance Company lease at Windy Point II in Schaumburg, IL in August 2011 and subsequent downtime before the commencement of the Catamaran lease in the first quarter of 2013, as well as the expiration of the Kirkland & Ellis lease at Aon Center in Chicago, IL in December 2011 and subsequent downtime before the commencement of the KPMG lease in August 2012. The loss of the Zurich and Kirkland & Ellis leases reduced revenues by approximately $4.3 million and $14.7 million, respectively, for the three months and the nine months ended September 30, 2012; these amounts are offset partially by incremental operating expense savings due to the vacancy of those tenants.
(7) The increase in Minneapolis Same Store Net Operating Income for the three months ended September 30, 2012 as compared to the same period in 2011 was primarily related to rent commencement in December 2011 for the US Bank leases at One Meridian Crossings and Two Meridian Crossings in Richfield, MN. The increase in Minneapolis Same Store Net Operating Income for the nine months ended September 30, 2012 as compared to the same period in 2011 was primarily related to the item described above, offset somewhat by the net loss of approximately 76,000 leased square feet associated with the December 2011 expiration of the HSBC Card Services lease at Crescent Ridge II in Minnetonka, MN.
(8) The increase in Los Angeles Same Store Net Operating Income for the three months ended September 30, 2012 as compared to the same period in 2011 was primarily related to increased rental revenue associated with several new leases at 1901 Main Street in Irvine, CA, 1055 East Colorado Boulevard in Pasadena, CA, and Fairway Center II in Brea, CA, in addition to contractual rental rate increases at 800 North Brand Boulevard in Glendale, CA.
(9) The increase in Other Same Store Net Operating Income for the three months ended September 30, 2012 as compared to the same period in 2011 was primarily related to rent commencements associated with a new lease with Grand Canyon Education at Desert Canyon 300 in Phoenix, AZ and a new lease with Chrysler Group, LLC at 1075 West Entrance Drive in Auburn Hills, MI. The decrease in Other Same Store Net Operating Income for the nine months ended September 30, 2012 as compared to the same period in 2011 was primarily attributable to: 1) a rental abatement concession associated with a new lease with Grand Canyon Education at Desert Canyon 300 in Phoenix, AZ, 2) a decrease in rental revenue associated with a lower lease renewal rental rate at 5601 Headquarters Drive in Plano, TX, and 3) a decrease in rental revenue associated with lease expirations in 2011 and rental abatement concessions related to new leasing at Las Colinas Corporate Center II in Irving, TX.
14
Piedmont Office Realty Trust, Inc.
Same Store Net Operating Income (Accrual Basis)
Unaudited (in thousands)
| Three Months Ended | Nine Months Ended | |||||||||||||||
| 9/30/2012 | 9/30/2011 | 9/30/2012 | 9/30/2011 | |||||||||||||
| Net income attributable to Piedmont |
$ | 10,831 | $ | 51,026 | $ | 78,766 | $ | 106,020 | ||||||||
| Net income attributable to noncontrolling interest |
4 | 135 | 12 | 378 | ||||||||||||
| Interest expense |
16,247 | 17,804 | 48,727 | 54,291 | ||||||||||||
| Depreciation (1) |
28,959 | 28,186 | 85,002 | 83,557 | ||||||||||||
| Amortization (1) |
15,366 | 16,616 | 39,744 | 44,601 | ||||||||||||
| Impairment loss (1) |
- | - | - | - | ||||||||||||
| Litigation settlement expense |
7,500 | - | 7,500 | - | ||||||||||||
| (Gain) / loss on sale of properties (1) |
254 | (26,826) | (27,583) | (26,872) | ||||||||||||
| (Gain) / loss on consolidation of VIE |
- | - | - | (1,532) | ||||||||||||
|
|
|
|
|
|
|
|
|
|||||||||
| Core EBITDA |
79,161 | 86,941 | 232,168 | 260,443 | ||||||||||||
| General & administrative expenses (1) |
5,576 | 4,747 | 15,760 | 18,843 | ||||||||||||
| Management fee revenue |
(520) | (110) | (1,719) | (1,303) | ||||||||||||
| Interest and other income (1) |
(383) | 74 | (785) | (3,132) | ||||||||||||
| Lease termination income |
(75) | 33 | (287) | (4,718) | ||||||||||||
| Lease termination expense - straight line rent & acquisition intangibles write-offs |
122 | 260 | 385 | 739 | ||||||||||||
|
|
|
|
|
|
|
|
|
|||||||||
| Property net operating income - accrual basis |
83,881 | 91,945 | 245,522 | 270,872 | ||||||||||||
| Net operating income from: |
||||||||||||||||
| Acquisitions (2) |
(4,822) | (3,595) | (14,131) | (7,185) | ||||||||||||
| Dispositions (3) |
(404) | (9,102) | (2,844) | (27,576) | ||||||||||||
| Unconsolidated joint ventures |
(700) | (772) | (1,827) | (2,041) | ||||||||||||
|
|
|
|
|
|
|
|
|
|||||||||
| Same store NOI - accrual basis |
$ | 77,955 | $ | 78,476 | $ | 226,720 | $ | 234,070 | ||||||||
|
|
|
|
|
|
|
|
|
|||||||||
| Change period over period |
-0.7% | N/A | -3.1% | N/A | ||||||||||||
| Same Store Net Operating Income Top Seven Markets |
||||||||||||||||||||||||||||||||||||
| Three Months Ended | Nine Months Ended | |||||||||||||||||||||||||||||||||||
| 9/30/2012 | 9/30/2011 | 9/30/2012 | 9/30/2011 | |||||||||||||||||||||||||||||||||
| $ | % | $ | % | $ | % | $ | % | |||||||||||||||||||||||||||||
|
|
|
|
|
|
|
|
|
|||||||||||||||||||||||||||||
| Washington, D.C. (4) |
$ | 21,130 | 27.1 | $ | 18,987 | 24.2 | $ | 61,022 | 26.9 | $ | 55,287 | 23.6 | ||||||||||||||||||||||||
| New York (5) |
11,446 | 14.7 | 13,273 | 16.9 | 36,035 | 15.9 | 40,592 | 17.3 | ||||||||||||||||||||||||||||
| Chicago (6) |
11,651 | 14.9 | 14,644 | 18.7 | 29,958 | 13.2 | 39,049 | 16.7 | ||||||||||||||||||||||||||||
| Minneapolis (7) |
5,639 | 7.2 | 5,546 | 7.0 | 16,528 | 7.3 | 17,466 | 7.5 | ||||||||||||||||||||||||||||
| Dallas |
3,854 | 4.9 | 3,730 | 4.8 | 11,664 | 5.1 | 11,366 | 4.9 | ||||||||||||||||||||||||||||
| Los Angeles (8) |
3,330 | 4.3 | 2,406 | 3.1 | 9,766 | 4.3 | 9,514 | 4.1 | ||||||||||||||||||||||||||||
| Boston |
3,347 | 4.4 | 2,843 | 3.6 | 9,204 | 4.1 | 9,199 | 3.9 | ||||||||||||||||||||||||||||
| Other (9) |
17,558 | 22.5 | 17,047 | 21.7 | 52,543 | 23.2 | 51,597 | 22.0 | ||||||||||||||||||||||||||||
|
|
|
|
|
|
|
|
|
|||||||||||||||||||||||||||||
| Total |
$ | 77,955 | 100.0 | $ | 78,476 | 100.0 | $ | 226,720 | 100.0 | $ | 234,070 | 100.0 | ||||||||||||||||||||||||
|
|
|
|
|
|
|
|
|
|||||||||||||||||||||||||||||
(1) Includes amounts attributable to consolidated properties, including discontinued operations, and our proportionate share of amounts attributable to unconsolidated joint ventures.
(2) Acquisitions consist of 1200 Enclave Parkway in Houston, TX, purchased on March 30, 2011; 500 West Monroe Street in Chicago, IL, acquired on March 31, 2011; The Dupree in Atlanta, GA, purchased on April 29, 2011; The Medici in Atlanta, GA, purchased on June 7, 2011; 225 and 235 Presidential Way in Woburn, MA, purchased on September 13, 2011; 400 TownPark in Lake Mary, FL purchased on November 10, 2011; and Gavitello Land in Atlanta, GA, purchased on June 28, 2012.
(3) Dispositions consist of Eastpointe Corporate Center in Issaquah, WA, sold on July 1, 2011; 5000 Corporate Court in Holtsville, NY, sold on August 31, 2011; 35 West Wacker Drive in Chicago, IL, sold on December 15, 2011; Deschutes, Rhein, Rogue, Willamette, and Portland Land Parcels in Beaverton, OR, sold on March 19, 2012; 26200 Enterprise Way in Lake Forest, CA, sold on May 31, 2012; and 110 and 112 Hidden Lake Circle in Duncan, SC, sold on September 21, 2012.
(4) The increase in Washington, D.C. Same Store Net Operating Income for the three months and the nine months ended September 30, 2012 as compared to the same periods in 2011 was primarily attributable to two factors: 1) an increase in revenue due to a rental rate increase associated with the 21-month lease extension of the Comptroller of the Currency at One Independence Square in Washington, D.C., and 2) increased rental revenue as a result of the commencement of several new leases at Piedmont Pointe I and II in Bethesda, MD.
(5) The decrease in New York Same Store Net Operating Income for the three months and the nine months ended September 30, 2012 as compared to the same periods in 2011 was primarily related to the expiration of the sanofi-aventis lease, resulting in a net decrease in leased square footage of 79,000 square feet, and the downtime associated with newly signed leases to backfill the space formerly occupied by sanofi-aventis at 200 Bridgewater Crossing in Bridgewater, NJ.
(6) The decrease in Chicago Same Store Net Operating Income for the three months and the nine months ended September 30, 2012 as compared to the same periods in 2011 was primarily related to the expiration of the Zurich American Insurance Company lease at Windy Point II in Schaumburg, IL in August 2011 and subsequent downtime before the commencement of the Catamaran lease in the first quarter of 2013, as well as the expiration of the Kirkland & Ellis lease at Aon Center in Chicago, IL in December 2011 and subsequent downtime before the commencement of the KPMG lease in August 2012. The loss of the Zurich and Kirkland & Ellis leases reduced revenues by approximately $4.1 million and $14.1 million, respectively, for the three months and the nine months ended September 30, 2012; these amounts are offset partially by incremental operating expense savings due to the vacancy of those tenants.
(7) The decrease in Minneapolis Same Store Net Operating Income for the nine months ended September 30, 2012 as compared to the same period in 2011 was primarily related to the net loss of approximately 76,000 leased square feet associated with the December 2011 expiration of the HSBC Card Services lease at Crescent Ridge II in Minnetonka, MN.
(8) The increase in Los Angeles Same Store Net Operating Income for the three months ended September 30, 2012 as compared to the same period in 2011 was primarily related to the commencement of several new leases at 1901 Main Street in Irvine, CA and Fairway Center II in Brea, CA.
(9) The increase in Other Same Store Net Operating Income for the nine months ended September 30, 2012 as compared to the same period in 2011 was primarily related to an increase in rental revenue due to the commencement of several new leases at Glenridge Highlands II in Atlanta, GA.
15
Piedmont Office Realty Trust, Inc.
Capitalization Analysis
Unaudited ($ and shares in thousands)
| As of September 30, 2012 |
As
of December 31, 2011 |
|||||||
|
Common stock price (1) |
$17.34 | $17.04 | ||||||
|
Total shares outstanding |
168,044 | 172,630 | ||||||
|
Equity market capitalization (1) |
$2,913,889 | $2,941,611 | ||||||
|
Total debt - principal amount outstanding |
$1,436,025 | $1,472,525 | ||||||
|
Total market capitalization (1) |
$4,349,914 | $4,414,136 | ||||||
|
Total debt / Total market capitalization |
33.0% | 33.4% | ||||||
|
Total gross real estate assets |
$4,550,183 | $4,615,812 | ||||||
|
Total debt / Total gross real estate assets (2) |
31.6% | 31.9% | ||||||
|
Total debt / Total gross assets (3) |
27.5% | 27.5% | ||||||
(1) Reflects common stock closing price as of the end of the reporting period.
(2) Gross real estate assets is defined as total real estate assets with the add back of accumulated depreciation and accumulated amortization related to real estate assets.
(3) Gross assets is defined as total assets with the add back of accumulated depreciation and accumulated amortization related to real estate assets.
16
Piedmont Office Realty Trust, Inc.
Debt Summary
As of September 30, 2012
Unaudited ($ in thousands)
| Floating Rate & Fixed Rate Debt | ||||||||
| Debt (1) | Principal Amount Outstanding |
Weighted Average Stated Interest Rate |
Weighted Average Maturity |
| ||||
|
|
||||||||
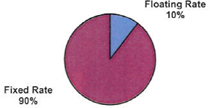
| Floating Rate |
$148,500(2) | 1.40% | 58.7 months | |||||
| Fixed Rate |
1,287,525 | 4.59% | 35.3 months | |||||
|
|
||||||||
| Total |
$1,436,025 | 4.26% | 37.7 months | |||||
|
|
||||||||
| Unsecured & Secured Debt | ||||||||
| Debt (1) | Principal Amount Outstanding |
Weighted Average Stated Interest Rate |
Weighted Average Maturity |
| ||||
|
|
||||||||
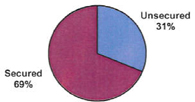
| Unsecured |
$448,500 | 2.26%(3) | 52.7 months | |||||
| Secured |
987,525 | 5.17% | 30.9 months | |||||
|
|
||||||||
| Total |
$1,436,025 | 4.26% | 37.7 months | |||||
|
|
||||||||
| Debt Maturities | ||||||||||||||
| Maturity Year | Secured Debt - Principal Amount Outstanding (1) |
Unsecured Debt - Principal Amount Outstanding (1) |
Weighted Average Stated Interest Rate |
Percentage of Total |
||||||||||
|
|
||||||||||||||
|
2012 |
$0 | $0 | N/A | 0.0% | ||||||||||
| 2013 |
0 | 0 | N/A | 0.0% | ||||||||||
| 2014 |
575,000 | 0 | 4.89% | 40.0% | ||||||||||
| 2015 |
105,000 | 0 | 5.29% | 7.3% | ||||||||||
| 2016 |
167,525 | 300,000 | 3.71% | 32.6% | ||||||||||
| 2017 |
140,000 | 148,500(4) | 3.51% | 20.1% | ||||||||||
|
|
||||||||||||||
| Total |
$987,525 | $448,500 | 4.26% | 100.0% | ||||||||||
|
|
||||||||||||||
(1) All of Piedmont's outstanding debt as of September 30, 2012 was interest-only debt.
(2) Amount represents the outstanding balance as of September 30, 2012, on the $500 million unsecured revolving credit facility.
(3) The weighted average interest rate is a weighted average rate for amounts outstanding under our $500 million unsecured revolving credit facility and our $300 million unsecured term loan. The $300 million unsecured term loan has a stated variable rate; however, Piedmont entered into interest rate swap agreements which effectively fix the interest rate on this loan at 2.69% through its maturity date of November 22, 2016, assuming no credit rating change for the Company.
(4) The initial maturity date of the $500 million unsecured revolving credit facility is August 19, 2016; however, there are two, six-month extension options available under the facility providing for a final extended maturity date of August 21, 2017. For the purposes of this schedule, we reflect the maturity date of the facility as the final extended maturity date of August 2017.
17
Piedmont Office Realty Trust, Inc.
Debt Detail
Unaudited ($ in thousands)
| Facility | Property | Rate(1) | Maturity | Principal Amount September 30, 2012 |
||||||||
|
|
||||||||||||
| Secured |
||||||||||||
| $200.0 Million Fixed-Rate Loan |
Aon Center | 4.87% | 5/1/2014 | $200,000 | ||||||||
| $25.0 Million Fixed-Rate Loan |
Aon Center | 5.70% | 5/1/2014 | 25,000 | ||||||||
| $350.0 Million Secured Pooled Facility |
Nine Property Collateralized Pool (2) | 4.84% | 6/7/2014 | 350,000 | ||||||||
| $105.0 Million Fixed-Rate Loan |
US Bancorp Center | 5.29% | 5/11/2015 | 105,000 | ||||||||
| $125.0 Million Fixed-Rate Loan |
Four Property Collateralized Pool (3) | 5.50% | 4/1/2016 | 125,000 | ||||||||
| $42.5 Million Fixed-Rate Loan |
Las Colinas Corporate Center I & II | 5.70% | 10/11/2016 | 42,525 | ||||||||
| $140.0 Million WDC Fixed-Rate Loans |
1201 & 1225 Eye Street | 5.76% | 11/1/2017 | 140,000 | ||||||||
|
|
||||||||||||
| Subtotal / Weighted Average (4) |
5.17% | $987,525 | ||||||||||
| Unsecured |
||||||||||||
| $500.0 Million Unsecured Facility (5) |
N/A | 1.40%(6) | 8/21/2017 | $148,500 | ||||||||
| $300.0 Million Unsecured Term Loan |
N/A | 2.69%(7) | 11/22/2016 | 300,000 | ||||||||
|
|
||||||||||||
| Subtotal / Weighted Average (4) |
2.26% | $448,500 | ||||||||||
|
|
||||||||||||
| Total Debt - Principal Amount Outstanding / Weighted Average Stated Rate (4) |
4.26% | $1,436,025 | ||||||||||
|
|
||||||||||||
(1) All of Piedmont’s outstanding debt as of September 30, 2012, was interest-only debt.
(2) The nine property collateralized pool includes 1200 Crown Colony Drive, Braker Pointe III, 2 Gatehall Drive, One and Two Independence Square, 2120 West End Avenue, 200 and 400 Bridgewater Crossing, and Fairway Center II.
(3) The four property collateralized pool includes 1430 Enclave Parkway, Windy Point I and II, and 1055 East Colorado Boulevard.
(4) Weighted average is based on the total balance outstanding and interest rate at September 30, 2012.
(5) All of Piedmont’s outstanding debt as of September 30, 2012, was term debt with the exception of $148.5 million outstanding on our unsecured revolving credit facility. On August 21, 2012, Piedmont closed on a new $500 million unsecured revolving credit facility that replaced the previous facility that was set to expire on August 30, 2012. The new facility has an initial maturity date of August 19, 2016 and has two six-month extension options for a total extension of up to one year to August 21, 2017. The final extended maturity date is presented on this schedule.
(6) The interest rate on the $500 million unsecured revolving credit facility is equal to the weighted average interest rate on all outstanding draws as of September 30, 2012. Piedmont may select from multiple interest rate options with each draw under this facility, including the prime rate and various length LIBOR locks. All LIBOR selections are subject to an additional spread (1.175% as of September 30, 2012) over the selected rate based on Piedmont’s current credit rating.
(7) The $300 million unsecured term loan has a stated variable rate; however, Piedmont entered into interest rate swap agreements which effectively fix the interest rate on this loan at 2.69% through its maturity date of November 22, 2016, assuming no credit rating change for the Company.
18
Piedmont Office Realty Trust, Inc.
Debt Analysis
As of September 30, 2012
Unaudited
| Debt Covenant Compliance (1) | Required | Actual | ||||||
|
Maximum Leverage Ratio |
0.60 | 0.28 | ||||||
|
Minimum Fixed Charge Coverage Ratio (2) |
1.50 | 4.54 | ||||||
|
Maximum Secured Indebtedness Ratio |
0.40 | 0.19 | ||||||
|
Minimum Unencumbered Leverage Ratio |
1.60 | 5.90 | ||||||
|
Minimum Unencumbered Interest Coverage Ratio (3) |
1.75 | 17.50 | ||||||
| (1) Debt covenant compliance calculations relate to specific calculations detailed in our line of credit agreement.
(2) Defined as EBITDA for the trailing four quarters (including the company's share of EBITDA from unconsolidated interests), less one-time or non-recurring gains or losses, less a $0.15 per square foot capital reserve, and excluding the impact of straight line rent leveling adjustments and amortization of intangibles divided by the company's share of fixed charges, as more particularly described in the credit agreements. This definition of fixed charge coverage ratio as prescribed by our credit agreements is different from the fixed charge coverage ratio definition employed elsewhere within this report.
(3) Defined as net operating income for the trailing four quarters for unencumbered assets (including the company's share of net operating income from unconsolidated interests that are unencumbered) less a $0.15 per square foot capital reserve divided by the company's share of interest expense associated with unsecured financings only, as more particularly described in the credit agreements. |
| |||||||
| Other Debt Coverage Ratios | Three months ended September 30, 2012 |
Nine months ended September 30, 2012 |
Year ended December 31, 2011 | |||
|
Net debt to core EBITDA |
4.4 x | 4.5 x | 3.9 x | |||
|
Fixed charge coverage ratio (4) |
4.9 x | 4.8 x | 4.8 x | |||
|
Interest coverage ratio (5) |
4.9 x | 4.8 x | 4.8 x | |||
|
(4) Fixed charge coverage is calculated as Core EBITDA divided by the sum of interest expense, principal amortization, capitalized interest and preferred dividends. We had no capitalized interest, principal amortization or preferred dividends during the periods ended September 30, 2012 and December 31, 2011.
(5) Interest coverage ratio is calculated as Core EBITDA divided by the sum of interest expense and capitalized interest. We had no capitalized interest during the periods ended September 30, 2012 and December 31, 2011. | ||||||
19
Piedmont Office Realty Trust, Inc.
Tenant Diversification (1)
As of September 30, 2012
(in thousands except for number of properties)
| Credit Rating (2) | Number of Properties |
Lease Expiration(s) (3) |
Annualized Lease Revenue |
Percentage of Annualized Lease Revenue (%) |
Leased Square Footage |
Percentage of Leased Square | ||||||||
| U.S. Government |
AA+ / Aaa | 9 | (4) | $73,107 | 13.3 | 1,586 | 8.9 | |||||||
| BP(5) |
A / A2 | 1 | 2013 | 31,749 | 5.8 | 776 | 4.3 | |||||||
| US Bancorp |
A+ / Aa3 | 3 | 2014 / 2023(6) | 27,705 | 5.0 | 973 | 5.5 | |||||||
| State of New York |
AA / Aa2 | 1 | 2019 | 19,963 | 3.6 | 481 | 2.7 | |||||||
| GE |
AA+ / Aa3 | 2 | 2027 | 14,820 | 2.7 | 447 | 2.5 | |||||||
| Independence Blue Cross |
No rating available | 1 | 2023 | 14,267 | 2.6 | 761 | 4.3 | |||||||
| Nestle |
AA / Aa2 | 1 | 2015 | 14,205 | 2.6 | 392 | 2.2 | |||||||
| Shaw |
BBB- / Ba1 | 1 | 2018 | 9,836 | 1.8 | 313 | 1.8 | |||||||
| City of New York |
AA / Aa2 | 1 | 2020 | 9,545 | 1.7 | 313 | 1.7 | |||||||
| Lockheed Martin |
A- / Baa1 | 3 | 2014 | 9,320 | 1.7 | 283 | 1.6 | |||||||
| KPMG |
No rating available | 2 | 2027 | 8,949 | 1.6 | 279 | 1.6 | |||||||
| Gallagher |
No rating available | 1 | 2018 | 8,013 | 1.5 | 307 | 1.7 | |||||||
| DDB Needham |
BBB+ / Baa1 | 1 | 2018 | 7,625 | 1.4 | 214 | 1.2 | |||||||
| Gemini |
A+ / A2 | 1 | 2021 | 7,304 | 1.3 | 205 | 1.1 | |||||||
| Caterpillar Financial |
A / A2 | 1 | 2022 | 7,275 | 1.3 | 312 | 1.7 | |||||||
| Harvard University |
AAA / Aaa | 2 | 2017 | 6,652 | 1.2 | 105 | 0.6 | |||||||
| Raytheon |
A- / A3 | 2 | 2019 | 6,555 | 1.2 | 440 | 2.5 | |||||||
| Catamaran |
BB / Ba2 | 1 | 2024 | 6,530 | 1.2 | 301 | 1.7 | |||||||
| KeyBank |
A- / A3 | 2 | 2016 | 6,383 | 1.2 | 210 | 1.2 | |||||||
| Harcourt |
BBB+ | 1 | 2016 | 6,254 | 1.1 | 195 | 1.1 | |||||||
| Edelman |
No rating available | 1 | 2024 | 6,094 | 1.1 | 178 | 1.0 | |||||||
| Qwest Communications |
BB / Baa3 | 1 | 2014 | 5,785 | 1.1 | 161 | 0.9 | |||||||
| Jones Lang LaSalle |
BBB- / Baa2 | 1 | 2017 | 5,777 | 1.1 | 165 | 0.9 | |||||||
| First Data Corporation |
B / B3 | 1 | 2020 | 5,691 | 1.0 | 195 | 1.1 | |||||||
| Other |
Various | 230,565 | 41.9 | 8,238 | 46.2 | |||||||||
| Total |
$549,969 | 100.0 | 17,830 | 100.0 |
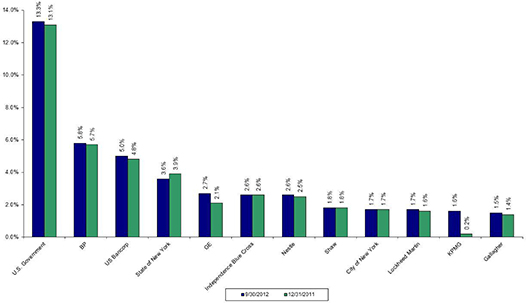
(1) This schedule presents all tenants contributing 1.0% or more to Annualized Lease Revenue.
(2) Credit rating may reflect the credit rating of the parent or a guarantor. When available, both the Standard & Poor's credit rating and the Moody's credit rating are provided.
(3) Unless otherwise indicated, Lease Expiration represents the expiration year of the majority of the square footage leased by the tenant.
(4) There are several leases with several different agencies of the U.S. Government with expiration years ranging from 2012 to 2027.
(5) Majority of the space is subleased to Aon Corporation. Approximately 88% of the space currently leased by BP has been re-leased under long-term leases for the period following the BP lease expiration.
(6) US Bank's lease at One & Two Meridian Crossings, representing approximately 337,000 square feet and $8.9 million of Annualized Lease Revenue, expires in 2023. US Bancorp's lease at US Bancorp Center for approximately 635,000 square feet, representing $18.8 million of Annualized Lease Revenue, expires in 2014.
20
Piedmont Office Realty Trust, Inc.
Tenant Credit Rating & Lease Distribution Information
As of September 30, 2012
| Tenant Credit Rating (1) | Annualized Lease Revenue ($’s in thousands) |
Percentage of Annualized Lease Revenue (%) |
||||||
| AAA / Aaa |
$79,723 | 14.5 | ||||||
| AA / Aa |
108,171 | 19.7 | ||||||
| A / A |
108,017 | 19.6 | ||||||
| BBB / Baa |
69,479 | 12.6 | ||||||
| BB / Ba |
22,284 | 4.1 | ||||||
| B / B |
19,638 | 3.6 | ||||||
| Below |
1,248 | 0.2 | ||||||
| Not rated (2) |
141,409 | 25.7 | ||||||
|
|
|
|
||||||
| Total |
$549,969 | 100.0 | ||||||
|
|
|
|
||||||
Lease Distribution
As of September 30, 2012
| Number of Leases | Percentage of Leases (%) |
Annualized Lease Revenue (in thousands) |
Percentage of Annualized Lease Revenue (%) |
Leased Square Footage (in thousands) |
Percentage of Leased Square Footage (%) | |||||||||||
|
| ||||||||||||||||
| 2,500 or Less |
195 | 35.5 | $17,004 | 3.1 | 163 | 0.9 | ||||||||||
| 2,501 - 10,000 |
140 | 25.5 | 24,668 | 4.5 | 744 | 4.2 | ||||||||||
| 10,001 - 20,000 |
66 | 12.0 | 28,366 | 5.2 | 955 | 5.4 | ||||||||||
| 20,001 - 40,000 |
63 | 11.5 | 56,924 | 10.3 | 1,843 | 10.3 | ||||||||||
| 40,001 - 100,000 |
33 | 6.0 | 59,039 | 10.7 | 1,938 | 10.9 | ||||||||||
| Greater than 100,000 |
52 | 9.5 | 363,968 | 66.2 | 12,187 | 68.3 | ||||||||||
|
| ||||||||||||||||
| Total |
549 | 100.0 | $549,969 | 100.0 | 17,830 | 100.0 | ||||||||||
|
| ||||||||||||||||
(1) Credit rating may reflect the credit rating of the parent or a guarantor. Where differences exist between the Standard & Poor's credit rating for a tenant and the Moody's credit rating for a tenant, the higher credit rating is selected for this analysis.
(2) The classification of a tenant as "not rated" does not indicate that the tenant is of poor credit quality, but can indicate that the tenant or the tenant's debt, if any, has not been rated. Included in this category are such tenants as Independence Blue Cross, McKinsey & Company and KPMG.
21
Piedmont Office Realty Trust, Inc.
Leased Percentage Information
(in thousands)
Impact of Strategic Transactions on Leased Percentage
The Company’s stated long-term growth strategy includes the recycling of capital from certain stabilized or non-core assets into office properties located in focused concentration and opportunistic markets. Some of the recently acquired properties are value-add properties which are defined as low-occupancy properties acquired at attractive bases with earnings growth and capital appreciation potential achievable through leasing up such assets to a stabilized occupancy. Because the value-add properties have large vacancies, they negatively affect Piedmont’s overall leased percentage. In order to identify the effect they have on Piedmont’s overall leased percentage, the following information is being provided. The analysis below: 1) removes the impact of the value-add properties from Piedmont’s overall office portfolio total under the heading “Stabilized Portfolio Analysis”; 2) provides a year-over-year comparison of leased percentage on the same subset of properties under the heading “Same Store Analysis”; and 3) provides a year-over-year comparison of leased percentage on the same subset of stabilized properties under the heading “Same Store Stabilized Analysis”.
| Three Months Ended September 30, 2012 | Three Months Ended September 30, 2011 | |||||||||||||||||||||||||||||
|
|
|
|
|
|||||||||||||||||||||||||||
| Leased Square Footage |
Rentable Square Footage |
Percent Leased (1) |
Leased Square Footage |
Rentable Square Footage |
Percent Leased (1) |
|||||||||||||||||||||||||
|
|
|
|
|
|||||||||||||||||||||||||||
| As of June 30, 20xx |
17,418 | 20,482 | 85.0% | 18,861 | 21,817 | 86.5% | ||||||||||||||||||||||||
| New leases |
806 | 770 | ||||||||||||||||||||||||||||
| Expired leases |
(400 | ) | (924 | ) | ||||||||||||||||||||||||||
| Other |
6 | 6 | 4 | 2 | ||||||||||||||||||||||||||
|
|
|
|
|
|||||||||||||||||||||||||||
| Subtotal |
17,830 | 20,488 | 87.0% | 18,711 | 21,819 | 85.8% | ||||||||||||||||||||||||
| Acquisitions during period |
- | - | 440 | 440 | ||||||||||||||||||||||||||
| Dispositions during period |
- | - | (282 | ) | (420 | ) | ||||||||||||||||||||||||
| As of September 30, 20xx (2) (3) |
17,830 | 20,488 | 87.0% | 18,869 | 21,839 | 86.4% | ||||||||||||||||||||||||
|
|
|
|
|
|||||||||||||||||||||||||||
| Nine Months Ended September 30, 2012 | Nine Months Ended September 30, 2011 | |||||||||||||||||||||||||||||
|
|
|
|
|
|||||||||||||||||||||||||||
| Leased Square Footage |
Rentable Square Footage |
Percent Leased (1) |
Leased Square Footage |
Rentable Square Footage |
Percent Leased (1) |
|||||||||||||||||||||||||
|
|
|
|
|
|||||||||||||||||||||||||||
| As of December 31, 20xx |
18,124 | 20,942 | 86.5% | 18,214 | 20,408 | 89.2% | ||||||||||||||||||||||||
| New leases |
1,790 | 2,584 | ||||||||||||||||||||||||||||
| Expired leases |
(1,623 | ) | (2,903 | ) | ||||||||||||||||||||||||||
| Other |
9 | 16 | 1 | 9 | ||||||||||||||||||||||||||
|
|
|
|
|
|||||||||||||||||||||||||||
| Subtotal |
18,300 | 20,958 | 87.3% | 17,896 | 20,417 | 87.7% | ||||||||||||||||||||||||
| Acquisitions during period |
- | - | 1,255 | 1,842 | ||||||||||||||||||||||||||
| Dispositions during period |
(470 | ) | (470 | ) | (282 | ) | (420 | ) | ||||||||||||||||||||||
| As of September 30, 20xx (2) (3) |
17,830 | 20,488 | 87.0% | 18,869 | 21,839 | 86.4% | ||||||||||||||||||||||||
| Stabilized Portfolio Analysis |
||||||||||||||||||||||||||||||
| Less value-add properties (4) |
(665 | ) | (1,433 | ) | 46.4% | (718 | ) | (1,406 | ) | 51.1% | ||||||||||||||||||||
| Stabilized Total (2) (3) |
17,165 | 19,055 | 90.1% | 18,151 | 20,433 | 88.8% | ||||||||||||||||||||||||
|
|
|
|
|
|||||||||||||||||||||||||||
| Same Store Analysis |
||||||||||||||||||||||||||||||
| Less acquisitions/dispositions after September 30, 2011 (4) (5) |
(60 | ) | (176 | ) | 34.1% | (1,548 | ) | (1,549 | ) | 99.9% | ||||||||||||||||||||
| Same Store Total (2) (3) (6) |
17,770 | 20,312 | 87.5% | 17,321 | 20,290 | 85.4% | ||||||||||||||||||||||||
|
|
|
|
|
|||||||||||||||||||||||||||
| Same Store Stabilized Analysis |
||||||||||||||||||||||||||||||
| Less value-add same store properties (4) |
(753 | ) | (1,407 | ) | 53.5% | (718 | ) | (1,406 | ) | 51.1% | ||||||||||||||||||||
| Same Store Stabilized Total (2) (3) |
17,017 | 18,905 | 90.0% | 16,603 | 18,884 | 87.9% | ||||||||||||||||||||||||
|
|
|
|
|
|||||||||||||||||||||||||||
(1) Calculated as leased square footage as of period end with the addition of square footage associated with uncommenced leases for spaces vacant as of period end, divided by total rentable square footage as of period end, expressed as a percentage.
(2) The square footage associated with leases with end of period expiration dates is included in the end of the period leased square footage.
(3) End of period leased square footage for 2012 includes short-term space leased on behalf of NASA in accordance with requirements stipulated under its lease to allow it to restructure its space at Two Independence Square in Washington, D.C. As of September 30, 2012, the total short-term space amounts to approximately 63,000 square feet and it will be occupied until an estimated date of September 30, 2013.
(4) For additional information on acquisitions/dispositions completed during the last year and value-add properties, please refer to pages 32 and 33, respectively.
(5) Dispositions completed during the previous twelve months are deducted from the previous period data and acquisitions completed during the previous twelve months are deducted from the current period data.
(6) Excluding executed but not commenced leases for currently vacant spaces, comprising approximately 706,000 square feet for the current period and 371,000 square feet for the prior period, Piedmont's same store commenced leased percentage was 84.0% and 83.5% for the current and prior periods, respectively.
22
Piedmont Office Realty Trust, Inc.
Rental Rate Roll Up / Roll Down Analysis (1)
(in thousands)
| Three Months Ended September 30, 2012 | ||||||||||||||||||||
|
|
|
|||||||||||||||||||
| Square Feet | % of Total Signed During Period |
% of Rentable Square Footage |
% Change Cash Rents (2) |
% Change Accrual Rents (3) (4) |
||||||||||||||||
|
|
|
|||||||||||||||||||
| Leases executed for spaces vacant one year or less |
465 | 46 | % | 2.3 | % | (16.5 | %) | (9.9 | %) | |||||||||||
| Leases executed for spaces excluded from analysis (5) |
547 | 54 | % | |||||||||||||||||
| Nine Months Ended September 30, 2012 | ||||||||||||||||||||
|
|
|
|||||||||||||||||||
| Square Feet | % of Total Signed During Period |
% of Rentable Square Footage |
% Change Cash Rents (2) |
% Change Accrual Rents (3) (4) |
||||||||||||||||
|
|
|
|||||||||||||||||||
| Leases executed for spaces vacant one year or less |
1,270 | 62 | % | 6.2 | % | (13.5 | %) | (7.2 | %) | |||||||||||
| Leases executed for spaces excluded from analysis (5) |
783 | 38 | % | |||||||||||||||||
(1) The population analyzed consists of consolidated office leases executed during the period (retail leases, as well as leases associated with storage spaces, management offices, industrial properties and unconsolidated joint venture assets, were excluded from this analysis) with lease terms greater than one year.
(2) For the purposes of this analysis, the cash rents last in effect for the previous leases were compared to the initial cash rents of the new leases in order to calculate the percentage change.
(3) For the purposes of this analysis, the accrual basis rents for the previous leases were compared to the accrual basis rents of the new leases in order to calculate the percentage change. For newly signed leases which have variations in accrual basis rents, whether because of known future expansions, contractions, lease expense recovery structure changes, or other similar reasons, the weighted average of such accrual basis rents is used for the purposes of this analysis.
(4) For leases under which a tenant may use, at its discretion, a portion of its tenant improvement allowance for expenses other than those related to improvements to its space, an assumption is made that the tenant elects to use any such portion of its tenant improvement allowance for improvements to its space prior to the commencement of its lease, unless the Company is notified otherwise by the tenant. This assumption is made based upon the historical tenant improvement allowance usage patterns of the Company's tenants.
(5) Represents leases signed at our consolidated office assets that do not qualify for inclusion in the analysis primarily because the spaces for which the new leases were signed had been vacant for greater than one year.
23
Piedmont Office Realty Trust, Inc.
Lease Expiration Schedule
As of September 30, 2012
(in thousands)
| OFFICE PORTFOLIO | GOVERNMENTAL ENTITIES | |||||||||||||
| Annualized Lease Revenue (1) |
Percentage of Annualized Lease Revenue (%) |
Rentable Square Footage |
Percentage of Rentable Square Footage (%) |
Annualized Lease Revenue (1) |
Percentage of Annualized Lease Revenue (%) |
Percentage of | ||||||||
| Vacant |
$0 | 0.0 | 2,659 | 13.0 | $0 | 0.0 | N/A | |||||||
| 2012(2) |
16,701 | 3.0 | 617 | 3.0 | 7,018 | 1.3 | 42.0 | |||||||
| 2013 |
53,218 | 9.7 | 1,172 | 5.7 | 21,839 | 4.0 | 41.0 | |||||||
| 2014 |
50,965 | 9.3 | 1,463 | 7.1 | 3,572 | 0.6 | 7.0 | |||||||
| 2015 |
43,936 | 8.0 | 1,535 | 7.5 | 33 | 0.0 | 0.1 | |||||||
| 2016 |
29,791 | 5.4 | 1,026 | 5.0 | 1,435 | 0.3 | 4.8 | |||||||
| 2017 |
36,667 | 6.7 | 1,159 | 5.7 | 1,846 | 0.3 | 5.0 | |||||||
| 2018 |
52,768 | 9.6 | 1,760 | 8.6 | 8,763 | 1.6 | 16.6 | |||||||
| 2019 |
47,844 | 8.7 | 1,783 | 8.7 | 19,963 | 3.6 | 41.7 | |||||||
| 2020 |
26,527 | 4.8 | 1,030 | 5.0 | 9,545 | 1.7 | 36.0 | |||||||
| 2021 |
14,488 | 2.6 | 502 | 2.5 | 0 | 0.0 | 0.0 | |||||||
| 2022 |
21,970 | 4.0 | 712 | 3.5 | 0 | 0.0 | 0.0 | |||||||
| 2023 |
37,635 | 6.8 | 1,628 | 7.9 | 0 | 0.0 | 0.0 | |||||||
| 2024 |
32,333 | 5.9 | 1,116 | 5.5 | 0 | 0.0 | 0.0 | |||||||
| 2025 |
7,260 | 1.3 | 295 | 1.4 | 0 | 0.0 | 0.0 | |||||||
| Thereafter |
77,866 | 14.2 | 2,031 | 9.9 | 28,953 | 5.3 | 37.2 | |||||||
|
|
| |||||||||||||
| Total / Weighted Average |
$549,969 | 100.0 | 20,488 | 100.0 | $102,967 | 18.7 | ||||||||
|
|
| |||||||||||||
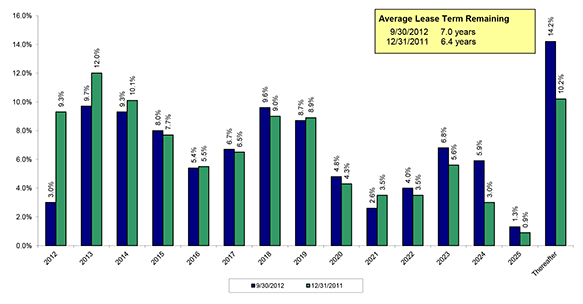
(1) Annualized rental income associated with newly executed leases for currently occupied space is incorporated herein only at the expiration date for the current lease. Annualized rental income associated with such new leases is removed from the expiry year of the current lease and added to the expiry year of the new lease. These adjustments effectively incorporate known roll ups and roll downs into the expiration schedule.
(2) Leases and other revenue-producing agreements on a month-to-month basis, aggregating 7,768 square feet and Annualized Lease Revenue of $281,230, are assigned a lease expiration date of a year and a day beyond the period end date. Includes leases with an expiration date of September 30, 2012 aggregating 3,331 square feet and Annualized Lease Revenue of $111,643, as well as the National Park Service lease, which is comprised of 219,750 square feet and $10.0 million in Annualized Lease Revenue, or 1.8% of the Company's total Annualized Lease Revenue.
24
Piedmont Office Realty Trust, Inc.
Lease Expirations by Quarter
As of September 30, 2012
(in thousands)
| Q4 2012 (1) | Q1 2013 | Q2 2013 | Q3 2013 | |||||||||||||
| Expiring Square Footage |
Expiring Lease Revenue (2) |
Expiring Square Footage |
Expiring Lease Revenue (2) |
Expiring Square Footage |
Expiring Lease Revenue (2) |
Expiring Square Footage |
Expiring Lease Revenue (2) | |||||||||
|
|
|
|
| |||||||||||||
| Atlanta |
47 | $917 | 0 | $0 | 8 | $267 | 11 | $259 | ||||||||
| Austin |
0 | 0 | 0 | 0 | 0 | 0 | 0 | 0 | ||||||||
| Boston |
1 | 37 | 0 | 32 | 0 | 0 | 0 | 0 | ||||||||
| Central & South Florida |
4 | 113 | 0 | 0 | 0 | 0 | 14 | 350 | ||||||||
| Chicago |
11 | 287 | 47 | 1,681 | 24 | 602 | 0 | 793 | ||||||||
| Cleveland |
102 | 1,580 | 0 | 0 | 0 | 0 | 0 | 0 | ||||||||
| Dallas |
32 | 752 | 28 | 705 | 10 | 252 | 0 | 0 | ||||||||
| Denver |
0 | 0 | 0 | 0 | 0 | 0 | 0 | 0 | ||||||||
| Detroit |
0 | 0 | 0 | 0 | 0 | 0 | 52 | 0 | ||||||||
| Houston |
11 | 345 | 0 | 0 | 0 | 0 | 0 | 0 | ||||||||
| Los Angeles |
22 | 866 | 2 | 50 | 47 | 1,523 | 5 | 151 | ||||||||
| Minneapolis |
8 | 227 | 16 | 524 | 5 | 160 | 16 | 535 | ||||||||
| Nashville |
0 | 0 | 0 | 0 | 0 | 0 | 0 | 0 | ||||||||
| New York |
150 | 3,319 | 11 | 306 | 5 | 124 | 0 | 0 | ||||||||
| Philadelphia |
0 | 0 | 0 | 0 | 0 | 0 | 0 | 0 | ||||||||
| Phoenix |
0 | 0 | 0 | 0 | 0 | 0 | 0 | 0 | ||||||||
| Washington, D.C.(3) |
229 | 10,554 | 344 | 21,006 | 70 | 3,816 | 64 | 0 | ||||||||
|
|
|
|
| |||||||||||||
| Total / Weighted Average (4) | 617 | $18,997 | 448 | $24,304 | 169 | $6,744 | 162 | $2,088 | ||||||||
|
|
|
|
| |||||||||||||
(1) Includes leases with an expiration date of September 30, 2012 aggregating 3,331 square feet and Expiring Lease Revenue of $111,643. No such adjustments are made to other periods presented.
(2) Expiring lease revenue is calculated as expiring square footage multiplied by the gross rent per square foot of the tenant currently leasing the space.
(3) Approximately 220,000 square feet and $10.0 million of expiring lease revenue in the fourth quarter of 2012 is related to the lease with the National Park Service, which is currently in hold over status.
(4) Total expiring lease revenue in any given year will not tie to the expiring Annualized Lease Revenue presented on the Lease Expiration Schedule on the previous page as the Lease Expiration Schedule accounts for the revenue effects of newly signed leases. Reflected herein are expiring revenues based on in place rental rates.
25
Piedmont Office Realty Trust, Inc.
Lease Expirations by Year
As of September 30, 2012
(in thousands)
| 12/31/2012 (1) | 12/31/2013 | 12/31/2014 | 12/31/2015 | 12/31/2016 | ||||||||||||||||
|
|
|
|
|
| ||||||||||||||||
| Expiring Square Footage |
Expiring Lease Revenue (2) |
Expiring Square Footage |
Expiring Lease Revenue (2) |
Expiring Square Footage |
Expiring Lease Revenue (2) |
Expiring Square Footage |
Expiring Lease Revenue (2) |
Expiring Square Footage |
Expiring Lease Revenue (2) | |||||||||||
|
|
|
|
|
| ||||||||||||||||
| Atlanta |
47 | $917 | 19 | $582 | 29 | $624 | 29 | $504 | 18 | $353 | ||||||||||
| Austin |
0 | 0 | 0 | 0 | 0 | 0 | 0 | 0 | 195 | 6,258 | ||||||||||
| Boston |
1 | 37 | 0 | 32 | 27 | 1,884 | 135 | 2,791 | 3 | 185 | ||||||||||
| Central & South Florida |
4 | 113 | 22 | 571 | 18 | 458 | 17 | 388 | 65 | 1,604 | ||||||||||
| Chicago |
11 | 287 | 226 | 8,421 | 26 | 3,381 | 188 | 5,170 | 82 | 2,386 | ||||||||||
| Cleveland |
102 | 1,580 | 10 | 218 | 0 | 0 | 0 | 0 | 13 | 294 | ||||||||||
| Dallas |
32 | 752 | 46 | 1,162 | 13 | 304 | 270 | 6,021 | 7 | 150 | ||||||||||
| Denver |
0 | 0 | 0 | 0 | 0 | 0 | 0 | 0 | 156 | 2,919 | ||||||||||
| Detroit |
0 | 0 | 86 | 750 | 8 | 147 | 132 | 3,901 | 31 | 690 | ||||||||||
| Houston |
11 | 345 | 0 | 0 | 0 | 0 | 0 | 0 | 0 | 17 | ||||||||||
| Los Angeles |
22 | 866 | 57 | 1,876 | 5 | 1,550 | 428 | 15,250 | 88 | 2,646 | ||||||||||
| Minneapolis |
8 | 227 | 48 | 1,586 | 686 | 18,685 | 103 | 3,679 | 33 | 1,043 | ||||||||||
| Nashville |
0 | 0 | 0 | 0 | 0 | 0 | 0 | 0 | 0 | 0 | ||||||||||
| New York |
150 | 3,319 | 37 | 1,534 | 96 | 4,059 | 66 | 2,431 | 280 | 8,989 | ||||||||||
| Philadelphia |
0 | 0 | 0 | 0 | 0 | 0 | 0 | 0 | 0 | 0 | ||||||||||
| Phoenix |
0 | 0 | 0 | 0 | 0 | 0 | 132 | 1,947 | 0 | 0 | ||||||||||
| Washington, D.C.(3) |
229 | 10,554 | 621 | 30,888 | 555 | 19,320 | 35 | 1,719 | 55 | 2,421 | ||||||||||
|
|
|
|
|
| ||||||||||||||||
| Total / Weighted Average (4) |
617 | $18,997 | 1,172 | $47,620 | 1,463 | $50,412 | 1,535 | $43,801 | 1,026 | $29,955 | ||||||||||
|
|
|
|
|
| ||||||||||||||||
(1) Includes leases with an expiration date of September 30, 2012 aggregating 3,331 square feet and Expiring Lease Revenue of $111,643. No such adjustments are made to other periods presented.
(2) Expiring lease revenue is calculated as expiring square footage multiplied by the gross rent per square foot of the tenant currently leasing the space.
(3) Approximately 220,000 square feet and $10.0 million of expiring lease revenue in 2012 is related to the lease with the National Park Service, which is currently in hold over status.
(4) Total expiring lease revenue in any given year will not tie to the expiring Annualized Lease Revenue presented on the Lease Expiration Schedule on page 24 as the Lease Expiration Schedule accounts for the revenue effects of newly signed leases. Reflected herein are expiring revenues based on in place rental rates.
26
Piedmont Office Realty Trust, Inc.
Capital Expenditures & Commitments
For the quarter ended September 30, 2012
Unaudited ($ in thousands)
| For the Three Months Ended | ||||||||||||||||||||||||
|
|
|
|||||||||||||||||||||||
| 9/30/2012 | 6/30/2012 | 3/31/2012 | 12/31/2011 | 9/30/2011 | ||||||||||||||||||||
|
|
|
|||||||||||||||||||||||
| Non-incremental |
||||||||||||||||||||||||
| Bldg / construction / dev |
$5,257 | $1,959 | $1,426 | $3,650 | $1,063 | |||||||||||||||||||
| Tenant improvements |
17,347 | 4,809 | 5,367 | 8,463 | 4,748 | |||||||||||||||||||
| Leasing costs |
15,979 | 11,013 | 1,273 | 3,279 | 8,718 | |||||||||||||||||||
|
|
|
|||||||||||||||||||||||
| Total non-incremental |
38,583 | 17,781 | 8,066 | 15,392 | 14,529 | |||||||||||||||||||
| Incremental |
||||||||||||||||||||||||
| Bldg / construction / dev |
7,338 | 5,721 | 2,241 | 2,040 | 1,646 | |||||||||||||||||||
| Tenant improvements |
5,904 | 12,044 | 5,938 | 10,862 | 7,154 | |||||||||||||||||||
| Leasing costs |
8,768 | 1,687 | 1,925 | 12,791 | 1,464 | |||||||||||||||||||
|
|
|
|||||||||||||||||||||||
| Total incremental |
22,010 | 19,452 | 10,104 | 25,693 | 10,264 | |||||||||||||||||||
|
|
|
|||||||||||||||||||||||
| Total capital expenditures |
$60,593 | $37,233 | $18,170 | $41,085 | $24,793 | |||||||||||||||||||
|
|
|
|||||||||||||||||||||||
| Non-incremental tenant improvement commitments (1) | ||||||||||||||||||||||||
| Non-incremental tenant improvement commitments outstanding as of June 30, 2012 |
|
$97,190 | ||||||||||||||||||||||
| New non-incremental tenant improvement commitments related to leases executed during period |
|
25,667 | ||||||||||||||||||||||
| Non-incremental tenant improvement expenditures |
|
(17,347 | ) | |||||||||||||||||||||
| Less: Tenant improvement expenditures fulfilled through accrued liabilities already presented on Piedmont’s balance sheet, expired commitments or other adjustments |
|
16,515 | ||||||||||||||||||||||
|
|
|
|||||||||||||||||||||||
| Non-incremental tenant improvement commitments fulfilled, expired or other adjustments |
|
(832 | ) | |||||||||||||||||||||
|
|
|
|||||||||||||||||||||||
| Total as of September 30, 2012 |
|
$122,025 | ||||||||||||||||||||||
|
|
|
|||||||||||||||||||||||
NOTE: The information presented on this page is for all consolidated assets, inclusive of our industrial properties.
(1) Commitments are unexpired contractual non-incremental tenant improvement obligations for leases executed in current and prior periods that have not yet been incurred and have not otherwise been presented on Piedmont's financial statements. The four largest commitments total approximately $74.3 million, or 61% of total outstanding commitments.
27
Piedmont Office Realty Trust, Inc.
Contractual Tenant Improvements and Leasing Commissions
| For the Year Ended | ||||||||||||
| For the Three Months Ended September 30, 2012 |
For the Nine Months Ended September 30, 2012 |
2011 | 2010 | 2009 | ||||||||
| Renewal Leases |
||||||||||||
| Number of leases |
6 | 27 | 48 | 37 | 34 | |||||||
| Square feet (1) |
19,247 | 534,832 | 2,280,329 | 1,241,481 | 1,568,895 | |||||||
| Tenant improvements per square foot (2) |
$11.48 | $6.63 | $33.29 | $14.40 | $12.01 | |||||||
| Leasing commissions per square foot |
$7.78 | $4.71 | $9.97 | $8.40 | $5.51 | |||||||
| Total per square foot |
$19.26 | $11.34 | $43.26 | $22.80 | $17.52 | |||||||
| Tenant improvements per square foot per year of lease term |
$1.54 | $1.45 | $3.93 | $1.74 | $1.44 | |||||||
| Leasing commissions per square foot per year of lease term |
$1.05 | $1.03 | $1.18 | $1.02 | $0.66 | |||||||
| Total per square foot per year of lease term (3) |
$2.59 | $2.48 | $5.11 | $2.76 | $2.10 | |||||||
| New Leases |
||||||||||||
| Number of leases |
25 | 69 | 76 | 56 | 28 | |||||||
| Square feet (1) |
993,179 | 1,518,363 | 1,588,271 | 866,212 | 700,295 | |||||||
| Tenant improvements per square foot (2) |
$55.72 | $49.57 | $41.21 | $32.65 | $45.04 | |||||||
| Leasing commissions per square foot |
$21.06 | $19.50 | $15.38 | $11.28 | $17.12 | |||||||
| Total per square foot |
$76.78 | $69.07 | $56.59 | $43.93 | $62.16 | |||||||
| Tenant improvements per square foot per year of lease term |
$4.35 | $4.27 | $4.19 | $4.16 | $4.05 | |||||||
| Leasing commissions per square foot per year of lease term |
$1.64 | $1.68 | $1.57 | $1.44 | $1.54 | |||||||
| Total per square foot per year of lease term |
$5.99 | $5.95 | $5.76 | $5.60 | $5.59 | |||||||
| Total |
||||||||||||
| Number of leases |
31 | 96 | 124 | 93 | 62 | |||||||
| Square feet |
1,012,426 | 2,053,195 | 3,868,600 | 2,107,693 | 2,269,190 | |||||||
| Tenant improvements per square foot (2) |
$54.88 | $38.38 | $36.54 | $21.90 | $22.21 | |||||||
| Leasing commissions per square foot |
$20.80 | $15.65 | $12.19 | $9.59 | $9.09 | |||||||
| Total per square foot |
$75.68 | $54.03 | $48.73 | $31.49 | $31.30 | |||||||
| Tenant improvements per square foot per year of lease term |
$4.32 | $3.92 | $4.05 | $2.70 | $2.42 | |||||||
| Leasing commissions per square foot per year of lease term |
$1.64 | $1.60 | $1.35 | $1.18 | $0.99 | |||||||
| Total per square foot per year of lease term |
$5.96 | $5.52 | $5.40 | $3.88 | $3.41 | |||||||
NOTE: This information is presented for our consolidated office assets only and excludes activity associated with storage spaces. Beginning with 2012, all leases for consolidated office properties, including short-term leases (leases for a term of less than one year), are included in the information presented above. Prior to 2012, short-term leases were excluded from this information. Management believes that short-term leases completed prior to 2012 would have an immaterial impact to the data presented herein.
(1) During the third quarter of 2012, we completed an approximate 20,000 square foot, 15-year renewal with a tenant at 500 West Monroe Street in Chicago, IL that involved a relocation in the building and an expansion. For the purposes of this schedule, we are treating the lease as a new lease since the tenant will be occupying new space.
(2) For leases under which a tenant may use, at its discretion, a portion of its tenant improvement allowance for expenses other than those related to improvements to its space, an assumption is made that the tenant elects to use any such portion of its tenant improvement allowance for improvements to its space prior to the commencement of its lease, unless the Company is notified otherwise by the tenant. This assumption is made based upon the historical tenant improvement allowance usage patterns of the Company's tenants.
(3) During 2011, we completed two large, 15-year lease renewals with significant capital commitments: NASA at Two Independence Square in Washington, D.C. and GE at 500 West Monroe Street in Chicago, IL. If the costs associated with these renewals were to be removed from the average committed capital cost calculation, the average committed capital cost per square foot per year of lease term for renewal leases in 2011 would be $2.80.
28
Piedmont Office Realty Trust, Inc.
Geographic Diversification
As of September 30, 2012
| Location | Number of Properties |
Annualized Lease Revenue ($’s in thousands) |
Percentage of Annualized Lease |
Rentable Square Footage (in Thousands) |
Percentage of Rentable Square Footage (%) |
Leased Square Footage (in thousands) |
Percent Leased (%) | |||||||||||||||||||
| Chicago |
6 | $125,577 | 22.8 | 4,777 | 23.3 | 3,731 | 78.1 | |||||||||||||||||||
| Washington, D.C. |
14 | 121,071 | 22.0 | 3,056 | 14.9 | 2,795 | 91.5 | |||||||||||||||||||
| New York |
7 | 80,833 | 14.7 | 2,658 | 13.0 | 2,469 | 92.9 | |||||||||||||||||||
| Minneapolis |
4 | 43,663 | 8.0 | 1,613 | 7.9 | 1,480 | 91.8 | |||||||||||||||||||
| Los Angeles |
4 | 29,800 | 5.4 | 999 | 4.9 | 869 | 87.0 | |||||||||||||||||||
| Boston |
6 | 25,825 | 4.7 | 1,023 | 5.0 | 1,013 | 99.0 | |||||||||||||||||||
| Dallas |
7 | 24,815 | 4.5 | 1,276 | 6.2 | 1,158 | 90.8 | |||||||||||||||||||
| Detroit |
4 | 17,372 | 3.2 | 930 | 4.5 | 783 | 84.2 | |||||||||||||||||||
| Atlanta |
6 | 15,395 | 2.8 | 1,042 | 5.1 | 634 | 60.8 | |||||||||||||||||||
| Houston |
2 | 14,402 | 2.6 | 463 | 2.3 | 461 | 99.6 | |||||||||||||||||||
| Philadelphia |
1 | 14,267 | 2.6 | 761 | 3.7 | 761 | 100.0 | |||||||||||||||||||
| Phoenix |
4 | 9,095 | 1.7 | 564 | 2.8 | 477 | 84.6 | |||||||||||||||||||
| Central & South Florida |
4 | 8,263 | 1.5 | 476 | 2.3 | 359 | 75.4 | |||||||||||||||||||
| Nashville |
1 | 7,275 | 1.3 | 312 | 1.5 | 312 | 100.0 | |||||||||||||||||||
| Austin |
1 | 6,258 | 1.1 | 195 | 0.9 | 195 | 100.0 | |||||||||||||||||||
| Cleveland |
2 | 3,139 | 0.6 | 187 | 0.9 | 177 | 94.7 | |||||||||||||||||||
| Denver |
1 | 2,919 | 0.5 | 156 | 0.8 | 156 | 100.0 | |||||||||||||||||||
| Total / Weighted Average |
74 | $549,969 | 100.0 | 20,488 | 100.0 | 17,830 | 87.0 | |||||||||||||||||||
|
| ||||||||||||||||||||||||||
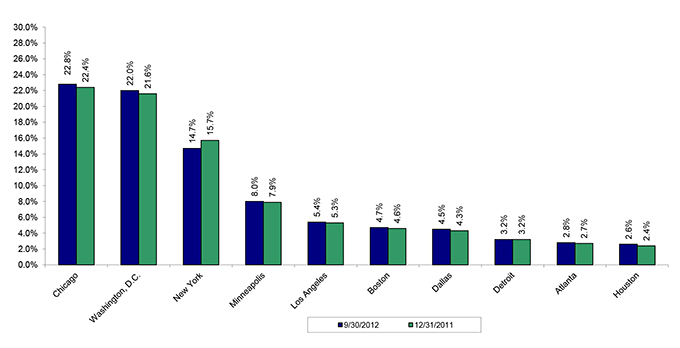
29
Piedmont Office Realty Trust, Inc.
Geographic Diversification by Location Type
As of September 30, 2012
| CBD / URBAN INFILL | SUBURBAN | TOTAL | ||||||||||||||||||||||||||||||
| Location | State | Number of Properties |
Percentage of Annualized Lease Revenue (%) |
Rentable Square Footage (in Thousands) |
Percentage of Rentable Square Footage (%) |
Number of Properties |
Percentage of Annualized Lease Revenue (%) |
Rentable Square Footage (in Thousands) |
Percentage of Rentable Square Footage (%) |
Number of Properties |
Percentage of Annualized Lease Revenue (%) |
Rentable Square Footage (in Thousands) |
Percentage of Rentable Square Footage (%) | |||||||||||||||||||
|
|
|
|
| |||||||||||||||||||||||||||||
| Chicago |
IL | 2 | 18.4 | 3,651 | 17.8 | 4 | 4.4 | 1,126 | 5.5 | 6 | 22.8 | 4,777 | 23.3 | |||||||||||||||||||
| Washington, D.C. |
DC, VA, MD | 9 | 19.7 | 2,575 | 12.6 | 5 | 2.3 | 481 | 2.3 | 14 | 22.0 | 3,056 | 14.9 | |||||||||||||||||||
| New York |
NY, NJ | 1 | 7.2 | 1,027 | 5.0 | 6 | 7.5 | 1,631 | 8.0 | 7 | 14.7 | 2,658 | 13.0 | |||||||||||||||||||
| Minneapolis |
MN | 1 | 5.1 | 928 | 4.6 | 3 | 2.9 | 685 | 3.3 | 4 | 8.0 | 1,613 | 7.9 | |||||||||||||||||||
| Los Angeles |
CA | 3 | 4.8 | 865 | 4.2 | 1 | 0.6 | 134 | 0.7 | 4 | 5.4 | 999 | 4.9 | |||||||||||||||||||
| Boston |
MA | 2 | 2.2 | 173 | 0.9 | 4 | 2.5 | 850 | 4.1 | 6 | 4.7 | 1,023 | 5.0 | |||||||||||||||||||
| Dallas |
TX | 0 | 0.0 | 0 | 0.0 | 7 | 4.5 | 1,276 | 6.2 | 7 | 4.5 | 1,276 | 6.2 | |||||||||||||||||||
| Detroit |
MI | 1 | 1.8 | 493 | 2.4 | 3 | 1.4 | 437 | 2.1 | 4 | 3.2 | 930 | 4.5 | |||||||||||||||||||
| Atlanta |
GA | 2 | 1.7 | 558 | 2.7 | 4 | 1.1 | 484 | 2.4 | 6 | 2.8 | 1,042 | 5.1 | |||||||||||||||||||
| Houston |
TX | 0 | 0.0 | 0 | 0.0 | 2 | 2.6 | 463 | 2.3 | 2 | 2.6 | 463 | 2.3 | |||||||||||||||||||
| Philadelphia |
PA | 1 | 2.6 | 761 | 3.7 | 0 | 0.0 | 0 | 0.0 | 1 | 2.6 | 761 | 3.7 | |||||||||||||||||||
| Phoenix |
AZ | 0 | 0.0 | 0 | 0.0 | 4 | 1.7 | 564 | 2.8 | 4 | 1.7 | 564 | 2.8 | |||||||||||||||||||
| Central & South Florida |
FL | 0 | 0.0 | 0 | 0.0 | 4 | 1.5 | 476 | 2.3 | 4 | 1.5 | 476 | 2.3 | |||||||||||||||||||
| Nashville |
TN | 1 | 1.3 | 312 | 1.5 | 0 | 0.0 | 0 | 0.0 | 1 | 1.3 | 312 | 1.5 | |||||||||||||||||||
| Austin |
TX | 0 | 0.0 | 0 | 0.0 | 1 | 1.1 | 195 | 0.9 | 1 | 1.1 | 195 | 0.9 | |||||||||||||||||||
| Cleveland |
OH | 0 | 0.0 | 0 | 0.0 | 2 | 0.6 | 187 | 0.9 | 2 | 0.6 | 187 | 0.9 | |||||||||||||||||||
| Denver |
CO | 0 | 0.0 | 0 | 0.0 | 1 | 0.5 | 156 | 0.8 | 1 | 0.5 | 156 | 0.8 | |||||||||||||||||||
|
|
|
|
| |||||||||||||||||||||||||||||
| Total / Weighted Average |
23 | 64.8 | 11,343 | 55.4 | 51 | 35.2 | 9,145 | 44.6 | 74 | 100.0 | 20,488 | 100.0 | ||||||||||||||||||||
|
|
|
| ||||||||||||||||||||||||||||||
30
Piedmont Office Realty Trust, Inc.
Industry Diversification
As of September 30, 2012
| Industry Diversification | Number of Tenants |
Percentage of Total Tenants (%) |
Annualized Lease Revenue ($’s in thousands) |
Percentage of Annualized Lease Revenue (%) |
Leased Square Footage (in thousands) |
Percentage of Leased Square Footage (%) | ||||||
|
| ||||||||||||
| Governmental Entity |
7 | 1.6 | $102,967 | 18.7 | 2,390 | 13.4 | ||||||
| Depository Institutions |
13 | 2.9 | 49,813 | 9.1 | 1,734 | 9.7 | ||||||
| Business Services |
63 | 14.1 | 41,678 | 7.6 | 1,453 | 8.1 | ||||||
| Petroleum Refining & Related Industries |
1 | 0.2 | 31,749 | 5.8 | 776 | 4.4 | ||||||
| Nondepository Credit Institutions |
15 | 3.3 | 31,561 | 5.7 | 1,114 | 6.2 | ||||||
| Insurance Carriers |
24 | 5.4 | 31,041 | 5.6 | 1,386 | 7.8 | ||||||
| Engineering, Accounting, Research, Management & Related Services |
29 | 6.5 | 31,009 | 5.6 | 939 | 5.3 | ||||||
| Communications |
34 | 7.6 | 18,320 | 3.3 | 610 | 3.4 | ||||||
| Insurance Agents, Brokers & Services |
8 | 1.8 | 17,298 | 3.2 | 710 | 4.0 | ||||||
| Security & Commodity Brokers, Dealers, Exchanges & Services |
29 | 6.5 | 16,880 | 3.1 | 617 | 3.5 | ||||||
| Educational Services |
10 | 2.2 | 15,813 | 2.9 | 440 | 2.5 | ||||||
| Food & Kindred Products |
6 | 1.3 | 15,163 | 2.8 | 428 | 2.4 | ||||||
| Transportation Equipment |
4 | 0.9 | 13,860 | 2.5 | 518 | 2.9 | ||||||
| Electronic & Other Electrical Equipment & Components, Except Computer |
10 | 2.2 | 13,759 | 2.5 | 572 | 3.2 | ||||||
| Fabricated Metal Products, Except Machinery & Transportation Equipment |
4 | 0.9 | 12,340 | 2.2 | 418 | 2.3 | ||||||
| Other |
191 | 42.6 | 106,718 | 19.4 | 3,725 | 20.9 | ||||||
|
| ||||||||||||
| Total |
448 | 100.0 | $549,969 | 100.0 | 17,830 | 100.0 | ||||||
|
| ||||||||||||
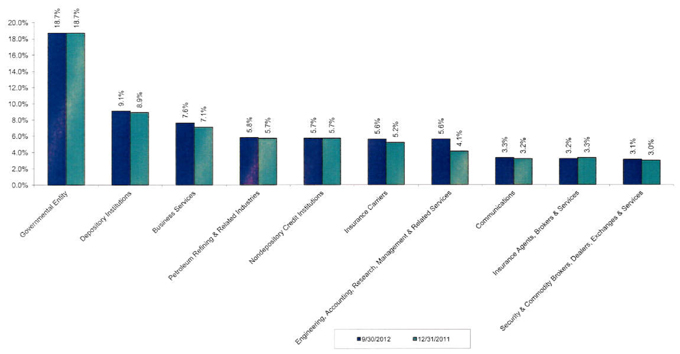
31
Piedmont Office Realty Trust, Inc.
Property Investment Activity
As of September 30, 2012
| Acquisitions Over Previous Eighteen Months | ||||||||||||||
|
| ||||||||||||||
| Property Name | Location | Acquisition Date |
Percent Ownership |
Year Built | Purchase Price ($’s in thousands) |
Rentable Square Footage (in thousands) |
Percent Leased at Acquisition (%) | |||||||
|
| ||||||||||||||
| The Dupree |
Atlanta, GA | 4/29/2011 | 100 | 1997 | 20,450 | 138 | 83 | |||||||
| The Medici |
Atlanta, GA | 6/7/2011 | 100 | 2008 | 13,210 | 152 | 22 | |||||||
| 225 and 235 Presidential Way |
Woburn, MA | 9/13/2011 | 100 | 2000-2001 | 85,300 | 440 | 100 | |||||||
| 400 TownPark |
Lake Mary, FL | 11/10/2011 | 100 | 2008 | 23,865 | 176 | 19 | |||||||
| Gavitello Land |
Atlanta, GA | 6/28/2012 | 100 | N/A | 2,500 | N/A | N/A | |||||||
|
| ||||||||||||||
| $145,325 | 906 | 69 | ||||||||||||
|
| ||||||||||||||
| Dispositions Over Previous Eighteen Months | ||||||||||||||
|
| ||||||||||||||
| Property Name | Location | Disposition Date |
Percent Ownership (%) |
Year Built | Sale Price ($’s in thousands) |
Rentable Square Footage (in thousands) |
Percent Leased at Disposition (%) | |||||||
|
| ||||||||||||||
| 360 Interlocken Boulevard (1) |
Broomfield, CO | 6/2/2011 | 4 | 1996 | $9,150 | 52 | 100 | |||||||
| Eastpointe Corporate Center |
Issaquah, WA | 7/1/2011 | 100 | 2001 | 32,000 | 156 | 19 | |||||||
| 47300 Kato Road (1) |
Fremont, CA | 8/25/2011 | 78 | 1982 | 3,825 | 58 | 0 | |||||||
| 5000 Corporate Court |
Holtsville, NY | 8/31/2011 | 100 | 2000 | 39,250 | 264 | 82 | |||||||
| 35 West Wacker Drive (1) |
Chicago, IL | 12/15/2011 | 96.5 | 1989 | 401,000 | 1,118 | 100 | |||||||
| Willamette |
Beaverton, OR | 3/19/2012 | 100 | 1988 | 7,050 | 73 | 100 | |||||||
| Rogue |
Beaverton, OR | 3/19/2012 | 100 | 1998 | 13,550 | 105 | 100 | |||||||
| Deschutes (2) |
Beaverton, OR | 3/19/2012 | 100 | 1989 | 7,150 | 73 | 50 | |||||||
| Rhein |
Beaverton, OR | 3/19/2012 | 100 | 1990 | 10,250 | 74 | 100 | |||||||
| Portland Land Parcels |
Beaverton, OR | 3/19/2012 | 100 | N/A | 5,942 | N/A | N/A | |||||||
| 26200 Enterprise Way |
Lake Forest, CA | 5/31/2012 | 100 | 2000 | 28,250 | 145 | 100 | |||||||
| 110 Hidden Lake Circle |
Duncan, SC | 9/21/2012 | 100 | 1987 | 16,058 | 474 | 100 | |||||||
| 112 Hidden Lake Circle |
Duncan, SC | 9/21/2012 | 100 | 1987 | 9,842 | 313 | 100 | |||||||
|
| ||||||||||||||
| $583,317 | 2,905 | 91 | ||||||||||||
|
| ||||||||||||||
| Acquisitions Subsequent to Quarter End | ||||||||||||||||
|
| ||||||||||||||||
| Property Name | Location | Acquisition Date |
Percent Ownership |
Year Built | Purchase Price ($’s in thousands) |
Rentable Square Footage (in thousands) |
Percent Leased at Acquisition (%) | |||||||||
|
| ||||||||||||||||
| Glenridge Highlands III Land |
Atlanta, GA | 10/15/2012 | 100 | N/A | $1,725 | N/A | N/A | |||||||||
(1) Sale price and rentable square footage are gross figures and have not been adjusted for Piedmont's ownership percentage.
(2) The property would have been 100% leased upon sale had Piedmont not exercised a landlord termination option for one full floor in anticipation of a potential lease with Nike, Inc., the ultimate purchaser of the property.
32
Piedmont Office Realty Trust, Inc.
Value-Add Activity
As of September 30, 2012
Presented below are properties that were acquired employing a value-add strategy. Once a property acquired under a value-add strategy reaches 80% leased, it is deemed stabilized for the purposes of supplemental reporting and will be removed from the value-add classification.
| Value-Add Properties | ||||||||||||||||||||||
|
| ||||||||||||||||||||||
| Property Name | Location | Acquisition Date |
Percent Ownership |
Year Built | Purchase Price ($’s in thousands) |
Rentable Square Footage (in |
Current Percent Leased (%) |
Percent Leased at (%) |
Real Estate Gross Book Value |
Estimated Cost to Stabilize (per VACANT square foot) | ||||||||||||
|
| ||||||||||||||||||||||
| Suwanee Gateway One |
Suwanee, GA | 9/28/2010 | 100 | 2008 | $7,875 | 142 | 0 | 0 | $7,953 | $40 - 60 | ||||||||||||
| 500 West Monroe Street (1) |
Chicago, IL | 3/31/2011 | 100 | 1991 | 227,500 | 962 | 59 | 49 | 212,636 | $60 - 90 | ||||||||||||
| The Medici |
Atlanta, GA | 6/7/2011 | 100 | 2008 | 13,210 | 152 | 23 | 22 | 13,711 | $35 - 60 | ||||||||||||
| 400 TownPark |
Lake Mary, FL | 11/10/2011 | 100 | 2008 | 23,865 | 176 | 34 | 19 | 23,705 | $35 - 50 | ||||||||||||
|
| ||||||||||||||||||||||
| $272,450 | 1,432 | 46 | 37 | $258,005 | ||||||||||||||||||
|
| ||||||||||||||||||||||
| Properties Removed From Value-Add Classification This Year | ||||||||||||||||||||||
|
| ||||||||||||||||||||||
| Property Name | Location | Acquisition Date |
Percent Ownership (%) |
Year Built | Purchase Price ($’s in thousands) |
Rentable Square Footage (in thousands) |
Current Percent Leased (%) |
Percent Leased at Acquisition (%) |
Real Estate Gross Book Value |
Estimated Cost to Stabilize (per VACANT square foot) | ||||||||||||
|
| ||||||||||||||||||||||
| 1200 Enclave Parkway |
Houston, TX | 3/30/2011 | 100 | 1999 | $18,500 | 150 | 99 | 18 | $24,685 | N/A | ||||||||||||
(1) Investment in this property was converted from a structured finance investment to an owned real estate asset through a UCC foreclosure of an equity ownership interest on March 31, 2011. The purchase price presented represents the estimated fair value of the real estate assets comprising the property as of the date of the transaction. Percent leased at acquisition reflects the space leased by Marsh USA as vacant, as the tenant had already announced plans to vacate prior to Piedmont's assumption of ownership of the asset.
33
Piedmont Office Realty Trust, Inc.
Other Investments
As of September 30, 2012
| Unconsolidated Joint Venture Properties | Location | Percent Ownership (%) |
Year Built | Piedmont Share of Real Estate Net Book Value ($’s in thousands) |
Real Estate Net Book Value ($’s in thousands) |
Rentable Square Footage (in thousands) |
Percent Leased (%) | |||||||
|
| ||||||||||||||
| 20/20 Building |
Leawood, KS | 57 | 1992 | $2,481 | $4,372 | 68.3 | 91 | |||||||
| 4685 Investment Drive |
Troy, MI | 55 | 2000 | 4,990 | 9,071 | 77.1 | 100 | |||||||
| 5301 Maryland Way |
Brentwood, TN | 55 | 1989 | 10,592 | 19,254 | 201.2 | 100 | |||||||
| 8560 Upland Drive |
Parker, CO | 72 | 2001 | 7,687 | 10,693 | 148.2 | 74 | |||||||
| Two Park Center |
Hoffman Estates, IL | 72 | 1999 | 10,970 | 15,259 | 193.7 | 39 | |||||||
|
| ||||||||||||||
| $36,720 | $58,649 | 688.5 | 76 | |||||||||||
|
| ||||||||||||||
| Land Parcels | Location | Acres | Approximate Current Value ($’s in thousands) | |||||||||||
|
| ||||||||||||||
| Gavitello |
Atlanta, GA | 2.0 | $2,500 | |||||||||||
| Enclave Parkway |
Houston, TX | 4.7 | 2,600 | |||||||||||
| Durham Avenue |
South Plainfield, NJ | 8.9 | 2,200 | |||||||||||
| State Highway 161 |
Irving, TX | 4.5 | 1,200 | |||||||||||
|
|
| |||||||||||||
| 20.1 | $8,500 | |||||||||||||
|
|
| |||||||||||||
34
Piedmont Office Realty Trust, Inc.
Supplemental Definitions
Included in this section are management’s statements regarding certain non-GAAP financial measures provided in this supplemental report and reasons why management believes that these measures provide useful information to investors about the Company's financial condition and results of operations. Reconciliations of these non-GAAP measures are included within pages 38-40.
Adjusted Funds From Operations (“AFFO”): AFFO is calculated by deducting from Core FFO non-incremental capital expenditures and acquisition-related costs and adding back non-cash items including non-real estate depreciation, straight lined rents and fair value lease revenue, non-cash components of interest expense and compensation expense, and by making similar adjustments for unconsolidated partnerships and joint ventures. Although AFFO may not be comparable to that of other REITs, we believe it provides a meaningful indicator of our ability to fund cash needs and to make cash distributions to equity owners. AFFO is a non-GAAP financial measure and should not be viewed as an alternative measurement of our operating performance to net income, as an alternative to net cash flows from operating activities or as a measure of our liquidity.
Annualized Lease Revenue (“ALR”): ALR is calculated by multiplying (i) rental payments (defined as base rent plus operating expense reimbursements, if payable by the tenant on a monthly basis under the terms of a lease that have been executed, but excluding a) rental abatements and b) rental payments related to executed but not commenced leases for space that was covered by an existing lease), by (ii) 12. In instances in which contractual rents or operating expense reimbursements are collected on an annual, semi-annual, or quarterly basis, such amounts are multiplied by a factor of 1, 2, or 4, respectively, to calculate the annualized figure. For leases that have been executed but not commenced relating to un-leased space, ALR is calculated by multiplying (i) the monthly base rental payment (excluding abatements) plus any operating expense reimbursements for the initial month of the lease term, by (ii) 12. Unless stated otherwise, this measure excludes our unconsolidated joint venture interests.
Core EBITDA: Core EBITDA is defined as net income before interest, taxes, depreciation and amortization and incrementally removing any impairment losses, gains or losses from sales of property, or other significant non-recurring items. We do not include impairment losses in this measure because we feel these types of losses create volatility in our earnings and make it difficult to determine the earnings generated by our ongoing business. We believe Core EBITDA is a reasonable measure of our liquidity. Core EBITDA is a non-GAAP financial measure and should not be viewed as an alternative measurement of cash flows from operating activities or other GAAP basis liquidity measures. Other REITs may calculate Core EBITDA differently and our calculation should not be compared to that of other REITs.
Core Funds From Operations (“Core FFO”): We calculate Core FFO by starting with FFO, as defined by NAREIT, and adjusting for certain non-recurring items such as gains or losses on the early extinguishment of debt, acquisition-related costs and other significant items. Such items create significant earnings volatility. We believe Core FFO provides a meaningful measure of our operating performance and more predictability regarding future earnings potential. Core FFO is a non-GAAP financial measure and should not be viewed as an alternative measurement of our operating performance to net income; therefore, it should not be compared to other REITs' equivalent to Core FFO.
Core Net Operating Income (“Core NOI”): Core NOI is defined as real estate operating income with the add-back of corporate general and administrative expense, depreciation and amortization, and casualty and impairment losses and the deduction of income and expense associated with lease terminations and income associated with property management performed by Piedmont for other organizations. We present this measure on an accrual basis and a cash basis, which eliminates the effects of straight lined rents and fair value lease revenue. The company uses this measure to assess its operating results and believes it is important in assessing operating performance. Core NOI is a non-GAAP measure which does not have any standard meaning prescribed by GAAP and therefore may not be comparable to similar measures presented by other companies.
EBITDA: EBITDA is defined as net income before interest, taxes, depreciation and amortization. We believe EBITDA is an appropriate measure of our ability to incur and service debt. EBITDA should not be considered as an alternative to cash flows from operating activities, as a measure of our liquidity or as an alternative to net income as an indicator of our operating activities. Other REITs may calculate EBITDA differently and our calculation should not be compared to that of other REITs.
Funds From Operations (“FFO”): FFO is calculated in accordance with the current National Association of Real Estate Investment Trusts ("NAREIT") definition. NAREIT currently defines FFO as net income (computed in accordance with GAAP), excluding gains or losses from sales of property and impairment losses, adding back depreciation and amortization on real estate assets, and after the same adjustments for unconsolidated partnerships and joint ventures. These adjustments can vary among owners of identical assets in similar conditions based on historical cost accounting and useful-life estimates. FFO may provide valuable comparisons of operating performance between periods and with other REITs. FFO is a non-GAAP financial measure and should not be viewed as an alternative measurement of our operating performance to net income. We believe that FFO is a beneficial indicator of the performance of an equity REIT. However, other REITs may not define FFO in accordance with the NAREIT definition, or may interpret the current NAREIT definition differently than we do; therefore, our computation of FFO may not be comparable to that of such other REITs.
Incremental Capital Expenditures: Incremental Capital Expenditures are defined as capital expenditures of a non-recurring nature that incrementally enhance the underlying assets' income generating capacity. Tenant improvements, leasing commissions, building capital and deferred lease incentives ("Leasing Costs") incurred to lease space that was vacant at acquisition, Leasing Costs for spaces vacant for greater than one year, Leasing Costs for spaces at newly acquired properties for which in-place leases expire shortly after acquisition, improvements associated with the expansion of a building and renovations that change the underlying classification of a building are included in this measure.
35
Piedmont Office Realty Trust, Inc.
Supplemental Definitions
| NOI from Unconsolidated Joint Ventures: NOI from Unconsolidated Joint Ventures is defined as Core NOI attributable to our interests in five properties owned through unconsolidated partnerships. We present this measure on an accrual basis and a cash basis, which eliminates the effects of straight lined rents and fair value lease revenue. NOI from Unconsolidated Joint Ventures is a non-GAAP measure and therefore may not be comparable to similarly defined data provided by other REITs.
Non-Incremental Capital Expenditures: Non-Incremental Capital Expenditures are defined as capital expenditures of a recurring nature related to tenant improvements and leasing commissions that do not incrementally enhance the underlying assets' income generating capacity. We exclude first generation tenant improvements and leasing commissions from this measure, in addition to other capital expenditures that qualify as Incremental Capital Expenditures, as defined above.
Same Store Net Operating Income (“Same Store NOI”): Same Store NOI is calculated as the Core NOI attributable to the properties owned or placed in service during the entire span of the current and prior year reporting periods. Same Store NOI excludes amounts attributable to industrial properties and unconsolidated joint venture assets. We present this measure on an accrual basis and a cash basis, which eliminates the effects of straight lined rents and fair value lease revenue. We believe Same Store NOI is an important measure of comparison of our stabilized properties' operating performance. Other REITs may calculate Same Store NOI differently and our calculation should not be compared to that of other REITs.
Same Store Properties: Same Store Properties is defined as properties owned or placed in service during the entire span of the current and prior year reporting periods. Same Store Properties excludes industrial properties and unconsolidated joint venture assets. We believe Same Store Properties is an important measure of comparison of our stabilized portfolio performance. |
36
Piedmont Office Realty Trust, Inc.
Research Coverage
| Paul E. Adornato, CFA |
Michael Knott, CFA | Chris Caton | ||||
| BMO Capital Markets |
Jed Reagan | Morgan Stanley | ||||
| 3 Times Square, 26th Floor | Green Street Advisors | 555 California Street, 21st Floor | ||||
| New York, NY 10036 | 660 Newport Center Drive, Suite 800 | San Francisco, CA 94104 | ||||
| Phone: (212) 885-4170 | Newport Beach, CA 92660 | Phone: (415) 576-2637 | ||||
| Phone: (949) 640-8780 | ||||||
| Brendan Maiorana |
John W. Guinee, III | Richard Moore | ||||
| Wells Fargo |
Erin Aslakson | Michael Carroll | ||||
| 7 St. Paul Street | Stifel, Nicolaus & Company | RBC Capital Markets | ||||
| MAC R1230-011 | One South Street | Arbor Court | ||||
| Baltimore, MD 21202 | 16th Floor | 30575 Bainbridge Road, Suite 250 | ||||
| Phone: (443) 263-6516 | Baltimore, MD 21202 | Solon, OH 44139 | ||||
| Phone: (443) 224-1307 | Phone: (440) 715-2646 | |||||
| Anthony Paolone, CFA |
||||||
| JP Morgan |
||||||
| 277 Park Avenue | ||||||
| New York, NY 10172 | ||||||
| Phone: (212) 622-6682 | ||||||
37
Piedmont Office Realty Trust, Inc.
FFO, Core FFO, & AFFO Reconciliations
Unaudited (in thousands)
| Three Months Ended | Nine Months Ended | |||||||||||||||||||||||||||
| 9/30/2012 | 6/30/2012 | 3/31/2012 | 12/31/2011 | 9/30/2011 | 9/30/2012 | 9/30/2011 | ||||||||||||||||||||||
| Net income attributable to Piedmont |
$ | 10,831 | $ | 30,708 | $ | 37,227 | $ | 119,020 | $ | 51,026 | $ | 78,766 | $ | 106,020 | ||||||||||||||
| Depreciation |
28,763 | 28,033 | 27,809 | 27,287 | 28,102 | 84,605 | 83,135 | |||||||||||||||||||||
| Amortization |
15,366 | 11,539 | 12,840 | 15,531 | 16,616 | 39,744 | 44,601 | |||||||||||||||||||||
| Impairment loss |
- | - | - | - | - | - | - | |||||||||||||||||||||
| (Gain) / loss on sale of properties |
254 | (10,008) | (17,830) | (95,901) | (26,826) | (27,583) | (26,872) | |||||||||||||||||||||
| (Gain) / loss on consolidation of VIE |
- | - | - | - | - | - | (1,532) | |||||||||||||||||||||
|
|
|
|
|
|
|
|
|
|
|
|
|
|
|
|||||||||||||||
| Funds from operations |
55,214 | 60,272 | 60,046 | 65,937 | 68,918 | 175,532 | 205,352 | |||||||||||||||||||||
| Litigation settlement expense |
7,500 | - | - | - | - | 7,500 | - | |||||||||||||||||||||
| Acquisition costs |
7 | 84 | (3) | 372 | 285 | 88 | 975 | |||||||||||||||||||||
| (Gain) / loss on extinguishment of debt |
- | - | - | (1,039) | - | - | - | |||||||||||||||||||||
|
|
|
|
|
|
|
|
|
|
|
|
|
|
|
|||||||||||||||
| Core funds from operations |
62,721 | 60,356 | 60,043 | 65,270 | 69,203 | 183,120 | 206,327 | |||||||||||||||||||||
| Depreciation of non real estate assets |
196 | 108 | 93 | 77 | 84 | 397 | 422 | |||||||||||||||||||||
| Stock-based and other non-cash compensation expense |
869 | 289 | 334 | 1,730 | 1,111 | 1,492 | 2,975 | |||||||||||||||||||||
| Deferred financing cost amortization |
663 | 590 | 803 | 649 | 879 | 2,056 | 2,546 | |||||||||||||||||||||
| Amortization of fair market adjustments on notes payable |
- | - | - | - | 471 | - | 1,413 | |||||||||||||||||||||
| Straight-line effects of lease revenue |
(4,193) | (5,477) | (1,565) | (5,019) | (4,129) | (11,236) | (4,488) | |||||||||||||||||||||
| Amortization of lease-related intangibles |
(1,315) | (1,785) | (1,532) | (2,215) | (1,817) | (4,631) | (4,850) | |||||||||||||||||||||
| Income from amortization of discount on purchase of mezzanine loans |
- | - | - | - | - | - | (484) | |||||||||||||||||||||
| Acquisition costs |
(7) | (84) | 3 | (372) | (285) | (88) | (975) | |||||||||||||||||||||
| Non-incremental capital expenditures |
(38,583) | (17,781) | (8,066) | (15,392) | (14,529) | (64,430) | (45,009) | |||||||||||||||||||||
|
|
|
|
|
|
|
|
|
|
|
|
|
|
|
|||||||||||||||
| Adjusted funds from operations |
$ | 20,351 | $ | 36,216 | $ | 50,113 | $ | 44,728 | $ | 50,988 | $ | 106,680 | $ | 157,877 | ||||||||||||||
|
|
|
|
|
|
|
|
|
|
|
|
|
|
|
|||||||||||||||
38
Piedmont Office Realty Trust, Inc.
Same Store Net Operating Income (Cash Basis)
Unaudited (in thousands)
| Three Months Ended | Nine Months Ended | |||||||||||||||||||||||||||
|
|
|
|
|
|||||||||||||||||||||||||
| 9/30/2012 | 6/30/2012 | 3/31/2012 | 12/31/2011 | 9/30/2011 | 9/30/2012 | 9/30/2011 | ||||||||||||||||||||||
| Net income attributable to Piedmont |
$ | 10,831 | $ | 30,708 | $ | 37,227 | $ | 119,020 | $ | 51,026 | $ | 78,766 | $ | 106,020 | ||||||||||||||
| Net income attributable to noncontrolling interest |
4 | 4 | 4 | 91 | 135 | 12 | 378 | |||||||||||||||||||||
| Interest expense |
16,247 | 15,943 | 16,537 | 17,457 | 17,804 | 48,727 | 54,291 | |||||||||||||||||||||
| (Gain) / loss on extinguishment of debt |
- | - | - | (1,039) | - | - | - | |||||||||||||||||||||
| Depreciation |
28,959 | 28,141 | 27,902 | 27,364 | 28,186 | 85,002 | 83,557 | |||||||||||||||||||||
| Amortization |
15,366 | 11,539 | 12,840 | 15,531 | 16,616 | 39,744 | 44,601 | |||||||||||||||||||||
| Impairment loss |
- | - | - | - | - | - | - | |||||||||||||||||||||
| Litigation settlement expense |
7,500 | - | - | - | - | 7,500 | - | |||||||||||||||||||||
| (Gain) / loss on sale of properties |
254 | (10,008) | (17,830) | (95,901) | (26,826) | (27,583) | (26,872) | |||||||||||||||||||||
| (Gain) / loss on consolidation of VIE |
- | - | - | - | - | - | (1,532) | |||||||||||||||||||||
|
|
|
|
|
|
|
|
|
|
|
|
|
|
|
|||||||||||||||
| Core EBITDA |
79,161 | 76,327 | 76,680 | 82,523 | 86,941 | 232,168 | 260,443 | |||||||||||||||||||||
| General & administrative expenses |
5,576 | 4,866 | 5,318 | 6,241 | 4,747 | 15,760 | 18,843 | |||||||||||||||||||||
| Management fee revenue |
(520) | (626) | (574) | (281) | (110) | (1,719) | (1,303) | |||||||||||||||||||||
| Interest and other income |
(383) | (305) | (97) | 357 | 74 | (785) | (3,132) | |||||||||||||||||||||
| Lease termination income |
(75) | (88) | (123) | (320) | 33 | (287) | (4,718) | |||||||||||||||||||||
| Lease termination expense - straight line rent & acquisition intangibles write-offs |
122 | 165 | 99 | 186 | 260 | 385 | 739 | |||||||||||||||||||||
| Straight-line effects of lease revenue |
(4,337) | (5,642) | (1,664) | (5,180) | (4,296) | (11,643) | (4,963) | |||||||||||||||||||||
| Net effect of amortization of above/(below) market in-place lease intangibles |
(1,293) | (1,785) | (1,532) | (2,239) | (1,911) | (4,609) | (5,115) | |||||||||||||||||||||
|
|
|
|
|
|
|
|
|
|
|
|
|
|
|
|||||||||||||||
| Core net operating income - Cash Basis |
78,251 | 72,912 | 78,107 | 81,287 | 85,738 | 229,270 | 260,794 | |||||||||||||||||||||
| Net operating income from: |
||||||||||||||||||||||||||||
| Acquisitions |
(3,576) | (3,886) | (3,150) | (4,489) | (3,393) | (10,612) | (6,837) | |||||||||||||||||||||
| Dispositions |
(321) | (541) | (1,637) | (6,363) | (7,699) | (2,499) | (23,051) | |||||||||||||||||||||
| Unconsolidated joint ventures |
(735) | (598) | (590) | (1,013) | (818) | (1,923) | (2,172) | |||||||||||||||||||||
|
|
|
|
|
|
|
|
|
|
|
|
|
|
|
|||||||||||||||
| Same Store NOI - Cash Basis |
$ | 73,619 | $ | 67,887 | $ | 72,730 | $ | 69,422 | $ | 73,828 | $ | 214,236 | $ | 228,734 | ||||||||||||||
|
|
|
|
|
|
|
|
|
|
|
|
|
|
|
|||||||||||||||
39
Piedmont Office Realty Trust, Inc.
Unconsolidated Joint Venture NOI Reconciliation
Pro-rata (in thousands)
| Three Months Ended | Nine Months Ended | |||||||||||||||||||||||||||
| 9/30/2012 | 6/30/2012 | 3/31/2012 | 12/31/2011 | 9/30/2011 | 9/30/2012 | 9/30/2011 | ||||||||||||||||||||||
| Equity in Income of Unconsolidated JVs |
$ | 322 | $ | 246 | $ | 170 | $ | 587 | $ | 485 | $ | 739 | $ | 1,032 | ||||||||||||||
| Interest expense |
- | - | - | - | - | - | - | |||||||||||||||||||||
| Depreciation |
307 | 300 | 296 | 293 | 296 | 902 | 897 | |||||||||||||||||||||
| Amortization |
41 | 41 | 41 | 33 | 33 | 123 | 97 | |||||||||||||||||||||
| (Gain) / loss on sale of properties |
- | - | - | - | (71 | ) | - | (116 | ) | |||||||||||||||||||
|
|
|
|
|
|
|
|
|
|
|
|
|
|
|
|||||||||||||||
| Core EBITDA |
670 | 587 | 507 | 913 | 743 | 1,764 | 1,910 | |||||||||||||||||||||
| General & administrative expenses |
30 | (3 | ) | 57 | 49 | 30 | 84 | 132 | ||||||||||||||||||||
| Interest and other income |
- | (21 | ) | - | - | (1 | ) | (21 | ) | (1 | ) | |||||||||||||||||
|
|
|
|
|
|
|
|
|
|
|
|
|
|
|
|||||||||||||||
| Core net operating income (accrual basis) |
700 | 563 | 564 | 962 | 772 | 1,827 | 2,041 | |||||||||||||||||||||
| Straight-line effects of lease revenue |
35 | 35 | 26 | 51 | 46 | 96 | 131 | |||||||||||||||||||||
| Net effect of amortization of above/(below) market in-place lease intangibles |
- | - | - | - | - | - | - | |||||||||||||||||||||
|
|
|
|
|
|
|
|
|
|
|
|
|
|
|
|||||||||||||||
| Core net operating income (cash basis) |
$ | 735 | $ | 598 | $ | 590 | $ | 1,013 | $ | 818 | $ | 1,923 | $ | 2,172 | ||||||||||||||
|
|
|
|
|
|
|
|
|
|
|
|
|
|
|
|||||||||||||||
40
Piedmont Office Realty Trust, Inc.
Discontinued Operations
Unaudited (in thousands)
| Three Months Ended | Nine Months Ended | |||||||||||||||||||||||||||
|
|
|
|
|
|||||||||||||||||||||||||
| 9/30/2012 | 6/30/2012 | 3/31/2012 | 12/31/2011 | 9/30/2011 | 9/30/2012 | 9/30/2011 | ||||||||||||||||||||||
|
|
|
|
|
|||||||||||||||||||||||||
| Revenues: |
||||||||||||||||||||||||||||
| Rental income |
$ | 434 | $ | 898 | $ | 1,613 | $ | 7,946 | $ | 9,234 | $ | 2,945 | $ | 29,941 | ||||||||||||||
| Tenant reimbursements |
73 | 104 | 292 | 4,396 | 3,790 | 469 | 14,967 | |||||||||||||||||||||
| Property management fee revenue |
- | - | - | - | - | - | - | |||||||||||||||||||||
| Other rental income |
- | - | - | - | (46 | ) | - | 303 | ||||||||||||||||||||
|
|
|
|
|
|||||||||||||||||||||||||
| Total revenues |
507 | 1,002 | 1,905 | 12,342 | 12,978 | 3,414 | 45,211 | |||||||||||||||||||||
| Operating expenses: |
||||||||||||||||||||||||||||
| Property operating costs |
100 | 197 | 269 | 4,814 | 3,758 | 566 | 16,762 | |||||||||||||||||||||
| Depreciation |
163 | 255 | 430 | 459 | 2,000 | 848 | 6,467 | |||||||||||||||||||||
| Amortization |
22 | 53 | 74 | 112 | 1,776 | 148 | 5,406 | |||||||||||||||||||||
| General and administrative |
38 | 5 | 3 | (13 | ) | (14 | ) | 47 | (157 | ) | ||||||||||||||||||
|
|
|
|
|
|||||||||||||||||||||||||
| Total operating expenses |
323 | 510 | 776 | 5,372 | 7,520 | 1,609 | 28,478 | |||||||||||||||||||||
| Interest expense |
— | — | — | (1,278 | ) | (1,568 | ) | — | (4,653 | ) | ||||||||||||||||||
| Interest and other income (expense) |
— | — | — | — | 16 | — | 1 | |||||||||||||||||||||
| Net income attributable to noncontrolling interest |
— | — | — | (87 | ) | (131 | ) | — | (366 | ) | ||||||||||||||||||
|
|
|
|
|
|||||||||||||||||||||||||
| Total other income (expense) |
— | — | — | (1,365 | ) | (1,683 | ) | — | (5,018 | ) | ||||||||||||||||||
| Operating income, excluding impairment loss and gain on sale |
184 | 492 | 1,129 | 5,605 | 3,775 | 1,805 | 11,715 | |||||||||||||||||||||
| Gain / (loss) on sale of properties |
(254 | ) | 10,008 | 17,830 | 95,901 | 26,756 | 27,583 | 26,756 | ||||||||||||||||||||
|
|
|
|
|
|||||||||||||||||||||||||
| Income from discontinued operations |
$ | (70 | ) | $ | 10,500 | $ | 18,959 | $ | 101,506 | $ | 30,531 | $ | 29,388 | $ | 38,471 | |||||||||||||
|
|
|
|
|
|||||||||||||||||||||||||
41
Piedmont Office Realty Trust, Inc.
Property Detail
As of September 30, 2012
| Building Name | City | State | Percent Ownership |
Year Built |
Rentable Square Footage Owned (in thousands) |
Leased Percentage |
Commenced Leased Percentage |
Economic Leased Percentage (1) |
||||||||||||||||||||
| Atlanta |
||||||||||||||||||||||||||||
| 11695 Johns Creek Parkway |
Johns Creek | GA | 100.0 | % | 2001 | 101 | 91.1 | % | 91.1 | % | 88.1 | % | ||||||||||||||||
| 3750 Brookside Parkway |
Alpharetta | GA | 100.0 | % | 2001 | 103 | 91.3 | % | 91.3 | % | 91.3 | % | ||||||||||||||||
| Glenridge Highlands Two |
Atlanta | GA | 100.0 | % | 2000 | 406 | 73.6 | % | 71.2 | % | 69.7 | % | ||||||||||||||||
| Suwanee Gateway One |
Suwanee | GA | 100.0 | % | 2008 | 142 | 0.0 | % | 0.0 | % | 0.0 | % | ||||||||||||||||
| The Dupree |
Atlanta | GA | 100.0 | % | 1997 | 138 | 82.6 | % | 82.6 | % | 82.6 | % | ||||||||||||||||
| The Medici |
Atlanta | GA | 100.0 | % | 2008 | 152 | 23.0 | % | 23.0 | % | 13.2 | % | ||||||||||||||||
| Metropolitan Area Subtotal / Weighted Average |
1,042 | 60.8 | % | 59.9 | % | 57.6 | % | |||||||||||||||||||||
| Austin |
||||||||||||||||||||||||||||
| Braker Pointe III |
Austin | TX | 100.0 | % | 2001 | 195 | 100.0 | % | 100.0 | % | 100.0 | % | ||||||||||||||||
| Metropolitan Area Subtotal / Weighted Average |
195 | 100.0 | % | 100.0 | % | 100.0 | % | |||||||||||||||||||||
| Boston |
||||||||||||||||||||||||||||
| 1200 Crown Colony Drive |
Quincy | MA | 100.0 | % | 1990 | 235 | 100.0 | % | 100.0 | % | 22.1 | % | ||||||||||||||||
| 90 Central Street |
Boxborough | MA | 100.0 | % | 2001 | 175 | 97.1 | % | 97.1 | % | 97.1 | % | ||||||||||||||||
| 1414 Massachusetts Avenue |
Cambridge | MA | 100.0 | % | 1873 | 78 | 100.0 | % | 100.0 | % | 100.0 | % | ||||||||||||||||
| One Brattle Square |
Cambridge | MA | 100.0 | % | 1991 | 95 | 94.7 | % | 94.7 | % | 94.7 | % | ||||||||||||||||
| 225 Presidential Way |
Woburn | MA | 100.0 | % | 2001 | 202 | 100.0 | % | 100.0 | % | 100.0 | % | ||||||||||||||||
| 235 Presidential Way |
Woburn | MA | 100.0 | % | 2000 | 238 | 100.0 | % | 100.0 | % | 100.0 | % | ||||||||||||||||
| Metropolitan Area Subtotal / Weighted Average |
1,023 | 99.0 | % | 99.0 | % | 81.1 | % | |||||||||||||||||||||
| Chicago |
||||||||||||||||||||||||||||
| Windy Point I |
Schaumburg | IL | 100.0 | % | 1999 | 187 | 100.0 | % | 100.0 | % | 88.2 | % | ||||||||||||||||
| Windy Point II |
Schaumburg | IL | 100.0 | % | 2001 | 301 | 100.0 | % | 0.0 | % | 0.0 | % | ||||||||||||||||
| Aon Center |
Chicago | IL | 100.0 | % | 1972 | 2,688 | 80.6 | % | 80.4 | % | 68.3 | % | ||||||||||||||||
| Two Pierce Place |
Itasca | IL | 100.0 | % | 1991 | 486 | 80.9 | % | 77.4 | % | 76.1 | % | ||||||||||||||||
| 2300 Cabot Drive |
Lisle | IL | 100.0 | % | 1998 | 152 | 75.0 | % | 75.0 | % | 75.0 | % | ||||||||||||||||
| 500 West Monroe Street |
Chicago | IL | 100.0 | % | 1991 | 963 | 59.2 | % | 46.7 | % | 43.4 | % | ||||||||||||||||
| Metropolitan Area Subtotal / Weighted Average |
4,777 | 78.1 | % | 68.9 | % | 60.8 | % | |||||||||||||||||||||
| Cleveland |
||||||||||||||||||||||||||||
| Eastpoint I |
Mayfield Heights | OH | 100.0 | % | 2000 | 102 | 100.0 | % | 100.0 | % | 100.0 | % | ||||||||||||||||
| Eastpoint II |
Mayfield Heights | OH | 100.0 | % | 2000 | 85 | 88.2 | % | 88.2 | % | 88.2 | % | ||||||||||||||||
| Metropolitan Area Subtotal / Weighted Average |
187 | 94.7 | % | 94.7 | % | 94.7 | % | |||||||||||||||||||||
| Dallas |
||||||||||||||||||||||||||||
| 3900 Dallas Parkway |
Plano | TX | 100.0 | % | 1999 | 120 | 100.0 | % | 100.0 | % | 100.0 | % | ||||||||||||||||
| 5601 Headquarters Drive |
Plano | TX | 100.0 | % | 2001 | 166 | 100.0 | % | 100.0 | % | 100.0 | % | ||||||||||||||||
| 6031 Connection Drive |
Irving | TX | 100.0 | % | 1999 | 229 | 95.6 | % | 92.1 | % | 90.4 | % | ||||||||||||||||
| 6021 Connection Drive |
Irving | TX | 100.0 | % | 2000 | 223 | 100.0 | % | 100.0 | % | 100.0 | % | ||||||||||||||||
| 6011 Connection Drive |
Irving | TX | 100.0 | % | 1999 | 152 | 100.0 | % | 100.0 | % | 100.0 | % | ||||||||||||||||
| Las Colinas Corporate Center I |
Irving | TX | 100.0 | % | 1998 | 159 | 89.9 | % | 89.9 | % | 40.9 | % | ||||||||||||||||
| Las Colinas Corporate Center II |
Irving | TX | 100.0 | % | 1998 | 227 | 59.5 | % | 58.1 | % | 53.3 | % | ||||||||||||||||
| Metropolitan Area Subtotal / Weighted Average |
1,276 | 90.8 | % | 89.9 | % | 82.6 | % | |||||||||||||||||||||
| Denver |
||||||||||||||||||||||||||||
| 350 Spectrum Loop |
Colorado Springs | CO | 100.0 | % | 2001 | 156 | 100.0 | % | 100.0 | % | 100.0 | % | ||||||||||||||||
| Metropolitan Area Subtotal / Weighted Average |
156 | 100.0 | % | 100.0 | % | 100.0 | % | |||||||||||||||||||||
| Detroit |
||||||||||||||||||||||||||||
| 1441 West Long Lake Road |
Troy | MI | 100.0 | % | 1999 | 107 | 81.3 | % | 79.4 | % | 76.6 | % | ||||||||||||||||
| 150 West Jefferson |
Detroit | MI | 100.0 | % | 1989 | 493 | 74.2 | % | 74.2 | % | 73.8 | % | ||||||||||||||||
| Auburn Hills Corporate Center |
Auburn Hills | MI | 100.0 | % | 2001 | 120 | 100.0 | % | 100.0 | % | 100.0 | % | ||||||||||||||||
| 1075 West Entrance Drive |
Auburn Hills | MI | 100.0 | % | 2001 | 210 | 100.0 | % | 100.0 | % | 100.0 | % | ||||||||||||||||
| Metropolitan Area Subtotal / Weighted Average |
930 | 84.2 | % | 84.0 | % | 83.4 | % | |||||||||||||||||||||
| Central & South Florida |
||||||||||||||||||||||||||||
| Sarasota Commerce Center II |
Sarasota | FL | 100.0 | % | 1999 | 152 | 99.3 | % | 84.9 | % | 67.1 | % | ||||||||||||||||
| 5601 Hiatus Road |
Tamarac | FL | 100.0 | % | 2001 | 100 | 100.0 | % | 100.0 | % | 100.0 | % | ||||||||||||||||
| 2001 NW 64th Street |
Ft. Lauderdale | FL | 100.0 | % | 2001 | 48 | 100.0 | % | 100.0 | % | 85.4 | % | ||||||||||||||||
| 400 TownPark |
Lake Mary | FL | 100.0 | % | 2008 | 176 | 34.1 | % | 34.1 | % | 31.3 | % | ||||||||||||||||
| Metropolitan Area Subtotal / Weighted Average |
476 | 75.4 | % | 70.8 | % | 62.6 | % | |||||||||||||||||||||
| Houston |
||||||||||||||||||||||||||||
| 1430 Enclave Parkway |
Houston | TX | 100.0 | % | 1994 | 313 | 100.0 | % | 100.0 | % | 100.0 | % | ||||||||||||||||
| 1200 Enclave Parkway |
Houston | TX | 100.0 | % | 1999 | 150 | 98.7 | % | 98.7 | % | 9.3 | % | ||||||||||||||||
| Metropolitan Area Subtotal / Weighted Average |
463 | 99.6 | % | 99.6 | % | 70.6 | % | |||||||||||||||||||||
42
Piedmont Office Realty Trust, Inc.
Property Detail
As of September 30, 2012
| Building Name | City | State | Percent Ownership |
Year Built |
Rentable Square Footage Owned (in thousands) |
Leased Percentage |
Commenced Leased Percentage |
Economic Leased Percentage (1) |
||||||||||||||||||||
| Los Angeles |
||||||||||||||||||||||||||||
| 800 North Brand Boulevard |
Glendale | CA | 100.0 | % | 1990 | 518 | 80.3 | % | 80.3 | % | 80.3 | % | ||||||||||||||||
| 1055 East Colorado Boulevard |
Pasadena | CA | 100.0 | % | 2001 | 175 | 98.9 | % | 61.7 | % | 61.7 | % | ||||||||||||||||
| Fairway Center II |
Brea | CA | 100.0 | % | 2002 | 134 | 97.8 | % | 95.5 | % | 95.5 | % | ||||||||||||||||
| 1901 Main Street |
Irvine | CA | 100.0 | % | 2001 | 172 | 86.6 | % | 86.6 | % | 80.8 | % | ||||||||||||||||
| Metropolitan Area Subtotal / Weighted Average |
|
999 | 87.0 | % | 80.2 | % | 79.2 | % | ||||||||||||||||||||
| Minneapolis |
||||||||||||||||||||||||||||
| Crescent Ridge II |
Minnetonka | MN | 100.0 | % | 2000 | 301 | 74.8 | % | 74.8 | % | 74.8 | % | ||||||||||||||||
| US Bancorp Center |
Minneapolis | MN | 100.0 | % | 2000 | 928 | 95.6 | % | 95.6 | % | 90.7 | % | ||||||||||||||||
| One Meridian Crossings |
Richfield | MN | 100.0 | % | 1997 | 195 | 100.0 | % | 100.0 | % | 100.0 | % | ||||||||||||||||
| Two Meridian Crossings |
Richfield | MN | 100.0 | % | 1998 | 189 | 91.5 | % | 91.5 | % | 91.0 | % | ||||||||||||||||
| Metropolitan Area Subtotal / Weighted Average |
|
1,613 | 91.8 | % | 91.8 | % | 88.9 | % | ||||||||||||||||||||
| Nashville |
||||||||||||||||||||||||||||
| 2120 West End Avenue |
Nashville | TN | 100.0 | % | 2000 | 312 | 100.0 | % | 100.0 | % | 100.0 | % | ||||||||||||||||
| Metropolitan Area Subtotal / Weighted Average |
|
312 | 100.0 | % | 100.0 | % | 100.0 | % | ||||||||||||||||||||
| New York |
||||||||||||||||||||||||||||
| 1111 Durham Avenue |
South Plainfield |
NJ | 100.0 | % | 1975 | 237 | 61.2 | % | 61.2 | % | 61.2 | % | ||||||||||||||||
| 2 Gatehall Drive |
Parsippany | NJ | 100.0 | % | 1985 | 405 | 100.0 | % | 100.0 | % | 100.0 | % | ||||||||||||||||
| 200 Bridgewater Crossing |
Bridgewater | NJ | 100.0 | % | 2002 | 299 | 73.6 | % | 26.4 | % | 19.7 | % | ||||||||||||||||
| Copper Ridge Center |
Lyndhurst | NJ | 100.0 | % | 1989 | 268 | 96.3 | % | 96.3 | % | 96.3 | % | ||||||||||||||||
| 60 Broad Street |
New York | NY | 100.0 | % | 1962 | 1,027 | 99.3 | % | 99.1 | % | 99.1 | % | ||||||||||||||||
| 600 Corporate Drive |
Lebanon | NJ | 100.0 | % | 2005 | 125 | 100.0 | % | 100.0 | % | 100.0 | % | ||||||||||||||||
| 400 Bridgewater Crossing |
Bridgewater | NJ | 100.0 | % | 2002 | 297 | 99.7 | % | 99.7 | % | 99.7 | % | ||||||||||||||||
| Metropolitan Area Subtotal / Weighted Average |
|
2,658 | 92.9 | % | 87.5 | % | 86.8 | % | ||||||||||||||||||||
| Philadelphia |
||||||||||||||||||||||||||||
| 1901 Market Street |
Philadelphia | PA | 100.0 | % | 1987 | 761 | 100.0 | % | 100.0 | % | 100.0 | % | ||||||||||||||||
| Metropolitan Area Subtotal / Weighted Average |
|
761 | 100.0 | % | 100.0 | % | 100.0 | % | ||||||||||||||||||||
| Phoenix |
||||||||||||||||||||||||||||
| River Corporate Center |
Tempe | AZ | 100.0 | % | 1998 | 133 | 100.0 | % | 100.0 | % | 0.0 | % | ||||||||||||||||
| 8700 South Price Road |
Tempe | AZ | 100.0 | % | 2000 | 132 | 100.0 | % | 100.0 | % | 100.0 | % | ||||||||||||||||
| Desert Canyon 300 |
Phoenix | AZ | 100.0 | % | 2001 | 149 | 100.0 | % | 100.0 | % | 100.0 | % | ||||||||||||||||
| Chandler Forum |
Chandler | AZ | 100.0 | % | 2003 | 150 | 42.0 | % | 42.0 | % | 42.0 | % | ||||||||||||||||
| Metropolitan Area Subtotal / Weighted Average |
|
564 | 84.6 | % | 84.6 | % | 61.0 | % | ||||||||||||||||||||
| Washington, D.C. |
||||||||||||||||||||||||||||
| 11107 Sunset Hills Road |
Reston | VA | 100.0 | % | 1985 | 101 | 100.0 | % | 98.0 | % | 98.0 | % | ||||||||||||||||
| 1201 Eye Street |
Washington | DC | 49.5 | % (2) | 2001 | 269 | 100.0 | % | 100.0 | % | 100.0 | % | ||||||||||||||||
| 1225 Eye Street |
Washington | DC | 49.5 | % (2) | 1986 | 225 | 87.6 | % | 87.6 | % | 78.7 | % | ||||||||||||||||
| 3100 Clarendon Boulevard |
Arlington | VA | 100.0 | % | 1987 | 250 | 100.0 | % | 100.0 | % | 100.0 | % | ||||||||||||||||
| 400 Virginia Avenue |
Washington | DC | 100.0 | % | 1985 | 224 | 89.3 | % | 89.3 | % | 89.3 | % | ||||||||||||||||
| 4250 North Fairfax Drive |
Arlington | VA | 100.0 | % | 1998 | 305 | 100.0 | % | 100.0 | % | 100.0 | % | ||||||||||||||||
| 9211 Corporate Boulevard |
Rockville | MD | 100.0 | % | 1989 | 115 | 100.0 | % | 100.0 | % | 100.0 | % | ||||||||||||||||
| 9221 Corporate Boulevard |
Rockville | MD | 100.0 | % | 1989 | 115 | 100.0 | % | 100.0 | % | 100.0 | % | ||||||||||||||||
| One Independence Square |
Washington | DC | 100.0 | % | 1991 | 334 | 100.0 | % | 100.0 | % | 100.0 | % | ||||||||||||||||
| 9200 Corporate Boulevard |
Rockville | MD | 100.0 | % | 1982 | 109 | 100.0 | % | 100.0 | % | 100.0 | % | ||||||||||||||||
| 11109 Sunset Hills Road |
Reston | VA | 100.0 | % | 1984 | 41 | 0.0 | % | 0.0 | % | 0.0 | % | ||||||||||||||||
| Two Independence Square |
Washington | DC | 100.0 | % | 1991 | 561 | 100.0 | % | 100.0 | % | 100.0 | % | ||||||||||||||||
| Piedmont Pointe I |
Bethesda | MD | 100.0 | % | 2007 | 186 | 68.8 | % | 65.6 | % | 65.6 | % | ||||||||||||||||
| Piedmont Pointe II |
Bethesda | MD | 100.0 | % | 2008 | 221 | 50.2 | % | 50.2 | % | 19.0 | % | ||||||||||||||||
| Metropolitan Area Subtotal / Weighted Average |
|
3,056 | 91.5 | % | 91.2 | % | 88.3 | % | ||||||||||||||||||||
|
Grand Total
|
|
20,488
|
|
|
87.0
|
%
|
|
83.6
|
%
|
|
77.9
|
%
| ||||||||||||||||
(1) Economic leased percentage excludes the square footage associated with executed but not commenced leases for currently vacant spaces and the square footage associated with tenants receiving rental abatements (after proportionate adjustments for tenants receiving only partial rent abatements).
(2) Although Piedmont owns 49.5% of the asset, it is entitled to 100% of the cash flows under the terms of the property ownership entity's joint venture agreement.
43
Piedmont Office Realty Trust, Inc.
Supplemental Operating & Financial Data
Risks, Uncertainties and Limitations
| Certain statements contained in this supplemental package constitute forward-looking statements within the meaning of Section 27A of the Securities Act of 1933, as amended (the “Securities Act”) and Section 21E of the Securities Exchange Act of 1934, as amended (the “Exchange Act”). We intend for all such forward-looking statements to be covered by the safe-harbor provisions for forward-looking statements contained in Section 27A of the Securities Act and Section 21E of the Exchange Act, as applicable. Such information is subject to certain risks and uncertainties, as well as known and unknown risks, which could cause actual results to differ materially from those projected or anticipated. Therefore, such statements are not intended to be a guarantee of our performance in future periods. Such forward-looking statements can generally be identified by our use of forward-looking terminology such as “may,” “will,” “expect,” “intend,” “anticipate,” “believe,” “continue” or similar words or phrases that are predictions of future events or trends and which do not relate solely to historical matters.
The following are some of the factors that could cause our actual results and expectations to differ materially from those described in our forward-looking statements: our ability to successfully identify and consummate suitable acquisitions; the demand for office space, rental rates and property values may continue to lag the general economic recovery; lease terminations or lease defaults, particularly by one of our large lead tenants; the impact of competition on our efforts to renew existing leases or re-let space; changes in the economies and other conditions of the office market in general and of the specific markets in which we operate; economic and regulatory changes; additional risks and costs associated with directly managing properties occupied by government tenants; adverse market and economic conditions and related impairments to our assets, including, but not limited to, receivables, real estate assets and other intangible assets; availability of financing; costs of complying with governmental laws and regulations; uncertainties associated with environmental and other regulatory matters; potential changes in the political environment and reduction in federal and/or state funding of our government tenants; we are and may continue to be subject to litigation; our ability to continue to qualify as a REIT under the Internal Revenue Code; and other factors detailed in our most recent Annual Report on Form 10-K and other documents we file with the Securities and Exchange Commission.
Readers are cautioned not to place undue reliance on these forward-looking statements, which speak only as of the date of this supplemental report. We cannot guarantee the accuracy of any such forward-looking statements contained in this supplemental report, and we do not intend to publicly update or revise any forward-looking statements, whether as a result of new information, future events, or otherwise. |
44