Attached files
| file | filename |
|---|---|
| EX-11 - EXHIBIT 11 - POTASH CORP OF SASKATCHEWAN INC | d426966dex11.htm |
| EX-32 - EXHIBIT 32 - POTASH CORP OF SASKATCHEWAN INC | d426966dex32.htm |
| EX-95 - EXHIBIT 95 - POTASH CORP OF SASKATCHEWAN INC | d426966dex95.htm |
| EX-31.A - EXHIBIT 31(A) - POTASH CORP OF SASKATCHEWAN INC | d426966dex31a.htm |
| EX-31.B - EXHIBIT 31(B) - POTASH CORP OF SASKATCHEWAN INC | d426966dex31b.htm |
UNITED STATES SECURITIES AND EXCHANGE COMMISSION
Washington, D.C. 20549
Form 10-Q
| þ | QUARTERLY REPORT PURSUANT TO SECTION 13 OR 15(d) OF THE SECURITIES EXCHANGE ACT OF 1934 |
For the Quarterly Period Ended September 30, 2012
OR
| ¨ | TRANSITION REPORT PURSUANT TO SECTION 13 OR 15(d) OF THE SECURITIES EXCHANGE ACT OF 1934 |
Commission File Number 1-10351
Potash Corporation of Saskatchewan Inc.
(Exact name of registrant as specified in its charter)
| Canada | N/A | |
| (State or other jurisdiction of incorporation or organization) |
(I.R.S. Employer Identification No.) | |
| 122 — 1st Avenue South Saskatoon, Saskatchewan, Canada |
S7K 7G3 (Zip Code) | |
| (Address of principal executive offices) | ||
306-933-8500
(Registrant’s telephone number, including area code)
Indicate by check mark whether the registrant (1) has filed all reports required to be filed by Sections 13 or 15(d) of the Securities Exchange Act of 1934 during the preceding 12 months (or for such shorter period that the registrant was required to file such reports), and (2) has been subject to such filing requirements for the past 90 days.
Yes þ No ¨
Indicate by check mark whether the registrant has submitted electronically and posted on its corporate Web site, if any, every Interactive Data File required to be submitted and posted pursuant to Rule 405 of Regulation S-T during the preceding 12 months (or for such shorter period that the registrant was required to submit and post such files).
Yes ¨ No ¨
Indicate by check mark whether the registrant is a large accelerated filer, an accelerated filer, a non-accelerated filer, or a smaller reporting company. See the definitions of “large accelerated filer,” “accelerated filer” and “smaller reporting company” in Rule 12b-2 of the Exchange Act. (Check one):
| Large accelerated filer þ | Accelerated filer ¨ | Non-accelerated filer ¨ | Smaller reporting company ¨ | |||
| (Do not check if a smaller reporting company) |
Indicate by check mark whether the registrant is a shell company (as defined in Exchange Act Rule 12b-2).
Yes ¨ No þ
As at October 31, 2012, Potash Corporation of Saskatchewan Inc. had 861,629,386 Common Shares outstanding.
Part I. Financial Information
Item 1. Financial Statements
Potash Corporation of Saskatchewan Inc.
Condensed Consolidated Statements of Financial Position
(in millions of US dollars)
(unaudited)
| As at | September 30, 2012 |
December 31, 2011 |
||||||
| Assets |
||||||||
| Current assets |
||||||||
| Cash and cash equivalents |
$ | 461 | $ | 430 | ||||
| Receivables |
1,360 | 1,195 | ||||||
| Inventories (Note 2) |
681 | 731 | ||||||
| Prepaid expenses and other current assets |
69 | 52 | ||||||
| 2,571 | 2,408 | |||||||
| Non-current assets |
||||||||
| Property, plant and equipment |
10,962 | 9,922 | ||||||
| Investments in equity-accounted investees |
1,279 | 1,187 | ||||||
| Available-for-sale investments (Note 3) |
2,435 | 2,265 | ||||||
| Other assets |
323 | 360 | ||||||
| Intangible assets |
121 | 115 | ||||||
| Total Assets |
$ | 17,691 | $ | 16,257 | ||||
| Liabilities |
||||||||
| Current liabilities |
||||||||
| Short-term debt and current portion of long-term debt (Note 4) |
$ | 573 | $ | 832 | ||||
| Payables and accrued charges |
1,129 | 1,295 | ||||||
| Current portion of derivative instrument liabilities |
58 | 67 | ||||||
| 1,760 | 2,194 | |||||||
| Non-current liabilities |
||||||||
| Long-term debt (Note 4) |
3,465 | 3,705 | ||||||
| Derivative instrument liabilities |
178 | 204 | ||||||
| Deferred income tax liabilities |
1,392 | 1,052 | ||||||
| Pension and other post-retirement benefit liabilities (Note 5) |
612 | 552 | ||||||
| Asset retirement obligations and accrued environmental costs |
607 | 615 | ||||||
| Other non-current liabilities and deferred credits |
101 | 88 | ||||||
| Total Liabilities |
8,115 | 8,410 | ||||||
| Shareholders’ Equity |
||||||||
| Share capital (Note 6) |
1,508 | 1,483 | ||||||
| Contributed surplus |
316 | 291 | ||||||
| Accumulated other comprehensive income |
1,344 | 816 | ||||||
| Retained earnings |
6,408 | 5,257 | ||||||
| Total Shareholders’ Equity |
9,576 | 7,847 | ||||||
| Total Liabilities and Shareholders’ Equity |
$ | 17,691 | $ | 16,257 | ||||
(See Notes to the Condensed Consolidated Financial Statements)
| 1 | PotashCorp 2012 Third Quarter Quarterly Report on Form 10-Q |
Potash Corporation of Saskatchewan Inc.
Condensed Consolidated Statements of Income
(in millions of US dollars except per-share amounts)
(unaudited)
| Three Months Ended September 30 |
Nine Months Ended September 30 |
|||||||||||||||
| 2012 | 2011 | 2012 | 2011 | |||||||||||||
| Sales (Note 7) |
$ | 2,143 | $ | 2,321 | $ | 6,285 | $ | 6,850 | ||||||||
| Freight, transportation and distribution |
(154 | ) | (129 | ) | (381 | ) | (410 | ) | ||||||||
| Cost of goods sold |
(1,062 | ) | (1,060 | ) | (3,080 | ) | (3,044 | ) | ||||||||
| Gross Margin |
927 | 1,132 | 2,824 | 3,396 | ||||||||||||
| Selling and administrative expenses |
(53 | ) | (46 | ) | (166 | ) | (176 | ) | ||||||||
| Provincial mining and other taxes |
(62 | ) | (53 | ) | (162 | ) | (147 | ) | ||||||||
| Share of earnings of equity-accounted investees |
77 | 68 | 220 | 185 | ||||||||||||
| Dividend income |
39 | 41 | 106 | 94 | ||||||||||||
| Impairment of available-for-sale investment (Note 3) |
— | — | (341 | ) | — | |||||||||||
| Other expenses |
(10 | ) | — | (21 | ) | (10 | ) | |||||||||
| Operating Income |
918 | 1,142 | 2,460 | 3,342 | ||||||||||||
| Finance costs |
(24 | ) | (37 | ) | (89 | ) | (125 | ) | ||||||||
| Income Before Income Taxes |
894 | 1,105 | 2,371 | 3,217 | ||||||||||||
| Income taxes (Note 9) |
(249 | ) | (279 | ) | (713 | ) | (819 | ) | ||||||||
| Net Income |
$ | 645 | $ | 826 | $ | 1,658 | $ | 2,398 | ||||||||
| Net Income per Share (Note 10) |
||||||||||||||||
| Basic |
$ | 0.75 | $ | 0.96 | $ | 1.93 | $ | 2.80 | ||||||||
| Diluted |
$ | 0.74 | $ | 0.94 | $ | 1.89 | $ | 2.73 | ||||||||
| Dividends Declared per Share |
$ | 0.21 | $ | 0.07 | $ | 0.49 | $ | 0.21 | ||||||||
(See Notes to the Condensed Consolidated Financial Statements)
| PotashCorp 2012 Third Quarter Quarterly Report on Form 10-Q | 2 |
Potash Corporation of Saskatchewan Inc.
Condensed Consolidated Statements of Comprehensive Income (Loss)
(in millions of US dollars)
(unaudited)
| Three Months Ended September 30 |
Nine Months Ended September 30 |
|||||||||||||||
| (Net of related income taxes) | 2012 | 2011 | 2012 | 2011 | ||||||||||||
| Net Income |
$ | 645 | $ | 826 | $ | 1,658 | $ | 2,398 | ||||||||
| Other comprehensive income (loss) |
||||||||||||||||
| Net increase (decrease) in net unrealized gain on available-for-sale investments(1) |
303 | (983 | ) | 169 | (1,351 | ) | ||||||||||
| Reclassification to income of unrealized loss on impaired available-for-sale investment (Note 3) |
— | — | 341 | — | ||||||||||||
| Net actuarial loss on defined benefit plans(2) |
— | (125 | ) | (84 | ) | (125 | ) | |||||||||
| Net loss on derivatives designated as cash flow hedges(3) |
(1 | ) | (18 | ) | (16 | ) | (18 | ) | ||||||||
| Reclassification to income of net loss on cash flow hedges(4) |
11 | 10 | 36 | 38 | ||||||||||||
| Other |
— | (5 | ) | (2 | ) | (5 | ) | |||||||||
| Other Comprehensive Income (Loss) |
313 | (1,121 | ) | 444 | (1,461 | ) | ||||||||||
| Comprehensive Income (Loss) |
$ | 958 | $ | (295 | ) | $ | 2,102 | $ | 937 | |||||||
| (1) | Available-for-sale investments are comprised of shares in Israel Chemicals Ltd. and Sinofert Holdings Limited. |
| (2) | Net of income taxes of $NIL (2011 — $71) for the three months ended September 30, 2012 and $48 (2011 — $71) for the nine months ended September 30, 2012. |
| (3) | Cash flow hedges are comprised of natural gas derivative instruments, and are net of income taxes of $1 (2011 — $11) for the three months ended September 30, 2012 and $11 (2011 — $11) for the nine months ended September 30, 2012. |
| (4) | Net of income taxes of $(8) (2011 — $(7)) for the three months ended September 30, 2012 and $(24) (2011 — $(23)) for the nine months ended September 30, 2012. |
(See Notes to the Condensed Consolidated Financial Statements)
| 3 | PotashCorp 2012 Third Quarter Quarterly Report on Form 10-Q |
Potash Corporation of Saskatchewan Inc.
Condensed Consolidated Statements of Cash Flow
(in millions of US dollars)
(unaudited)
| Three Months Ended September 30 |
Nine Months Ended September 30 |
|||||||||||||||
| 2012 | 2011 | 2012 | 2011 | |||||||||||||
| Operating Activities |
||||||||||||||||
| Net income |
$ | 645 | $ | 826 | $ | 1,658 | $ | 2,398 | ||||||||
| Adjustments to reconcile net income to cash provided by operating activities |
||||||||||||||||
| Depreciation and amortization |
149 | 122 | 434 | 374 | ||||||||||||
| Share-based compensation |
3 | 3 | 21 | 22 | ||||||||||||
| Impairment of available-for-sale investment (Note 3) |
— | — | 341 | — | ||||||||||||
| Realized excess tax benefit related to share-based compensation |
4 | 6 | 7 | 29 | ||||||||||||
| Provision for deferred income tax |
162 | 189 | 366 | 342 | ||||||||||||
| Net undistributed earnings of equity-accounted investees |
(74 | ) | (68 | ) | (90 | ) | (118 | ) | ||||||||
| Pension and other post-retirement benefits |
(86 | ) | (145 | ) | (71 | ) | (131 | ) | ||||||||
| Asset retirement obligations and accrued environmental costs |
(6 | ) | 22 | 4 | 40 | |||||||||||
| Other long-term liabilities and miscellaneous |
7 | 9 | 33 | (23 | ) | |||||||||||
| Subtotal of adjustments |
159 | 138 | 1,045 | 535 | ||||||||||||
| Changes in non-cash operating working capital |
||||||||||||||||
| Receivables |
(90 | ) | (88 | ) | (84 | ) | (277 | ) | ||||||||
| Inventories |
19 | 7 | 63 | (14 | ) | |||||||||||
| Prepaid expenses and other current assets |
(5 | ) | — | (21 | ) | 12 | ||||||||||
| Payables and accrued charges |
31 | (18 | ) | (308 | ) | (35 | ) | |||||||||
| Subtotal of changes in non-cash operating working capital |
(45 | ) | (99 | ) | (350 | ) | (314 | ) | ||||||||
| Cash provided by operating activities |
759 | 865 | 2,353 | 2,619 | ||||||||||||
| Investing Activities |
||||||||||||||||
| Additions to property, plant and equipment |
(546 | ) | (590 | ) | (1,505 | ) | (1,523 | ) | ||||||||
| Other assets and intangible assets |
(23 | ) | (8 | ) | (37 | ) | (11 | ) | ||||||||
| Cash used in investing activities |
(569 | ) | (598 | ) | (1,542 | ) | (1,534 | ) | ||||||||
| Financing Activities |
||||||||||||||||
| Repayment of long-term debt obligations |
— | — | (2 | ) | (600 | ) | ||||||||||
| Repayment of short-term debt obligations |
(117 | ) | (236 | ) | (501 | ) | (395 | ) | ||||||||
| Dividends |
(116 | ) | (60 | ) | (293 | ) | (148 | ) | ||||||||
| Issuance of common shares |
13 | 15 | 16 | 40 | ||||||||||||
| Cash used in financing activities |
(220 | ) | (281 | ) | (780 | ) | (1,103 | ) | ||||||||
| (Decrease) Increase in Cash and Cash Equivalents |
(30 | ) | (14 | ) | 31 | (18 | ) | |||||||||
| Cash and Cash Equivalents, Beginning of Period |
491 | 408 | 430 | 412 | ||||||||||||
| Cash and Cash Equivalents, End of Period |
$ | 461 | $ | 394 | $ | 461 | $ | 394 | ||||||||
| Cash and cash equivalents comprised of: |
||||||||||||||||
| Cash |
$ | 69 | $ | 78 | $ | 69 | $ | 78 | ||||||||
| Short-term investments |
392 | 316 | 392 | 316 | ||||||||||||
| $ | 461 | $ | 394 | $ | 461 | $ | 394 | |||||||||
| Supplemental cash flow disclosure |
||||||||||||||||
| Interest paid |
$ | 12 | $ | 35 | $ | 114 | $ | 168 | ||||||||
| Income taxes paid |
$ | 91 | $ | 91 | $ | 583 | $ | 415 | ||||||||
(See Notes to the Condensed Consolidated Financial Statements)
| PotashCorp 2012 Third Quarter Quarterly Report on Form 10-Q | 4 |
Potash Corporation of Saskatchewan Inc.
Condensed Consolidated Statements of Changes in Equity
(in millions of US dollars)
(unaudited)
| Equity Attributable to Common Shareholders(1) | ||||||||||||||||||||||||||||||||||||
| Accumulated Other Comprehensive Income | ||||||||||||||||||||||||||||||||||||
| Share Capital |
Contributed Surplus |
Net unrealized gain on available-for- sale investments |
Net loss on derivatives designated as cash flow hedges |
Net actuarial loss on defined benefit plans |
Other | Total Accumulated Other Comprehensive Income |
Retained Earnings |
Total Equity |
||||||||||||||||||||||||||||
| Balance — December 31, 2011 |
$ | 1,483 | $ | 291 | $ | 982 | $ | (168 | ) | $ | — | (2) | $ | 2 | $ | 816 | $ | 5,257 | $ | 7,847 | ||||||||||||||||
| Net income |
— | — | — | — | — | — | — | 1,658 | 1,658 | |||||||||||||||||||||||||||
| Other comprehensive income (loss) |
— | — | 510 | 20 | (84 | ) | (2 | ) | 444 | — | 444 | |||||||||||||||||||||||||
| Effect of share-based compensation |
— | 27 | — | — | — | — | — | — | 27 | |||||||||||||||||||||||||||
| Dividends declared |
— | — | — | — | — | — | — | (423 | ) | (423 | ) | |||||||||||||||||||||||||
| Issuance of common shares |
25 | (2 | ) | — | — | — | — | — | — | 23 | ||||||||||||||||||||||||||
| Transfer of actuarial losses on defined benefit plans |
— | — | — | — | 84 | — | 84 | (84 | ) | — | ||||||||||||||||||||||||||
| Balance — September 30, 2012 |
$ | 1,508 | $ | 316 | $ | 1,492 | $ | (148 | ) | $ | — | (2) | $ | — | $ | 1,344 | $ | 6,408 | $ | 9,576 | ||||||||||||||||
| (1) | All equity transactions are attributable to common shareholders. |
| (2) | Any amounts incurred during a period are closed out to retained earnings at each period-end. Therefore, no balance exists in the reserve at beginning or end of period. |
| Equity Attributable to Common Shareholders(1) | ||||||||||||||||||||||||||||||||||||
| Accumulated Other Comprehensive Income | ||||||||||||||||||||||||||||||||||||
| Share Capital |
Contributed Surplus |
Net unrealized gain on available-for- sale investments |
Net loss on derivatives designated as cash flow hedges |
Net actuarial loss on defined benefit plans |
Other | Total Accumulated Other Comprehensive Income |
Retained Earnings |
Total Equity |
||||||||||||||||||||||||||||
| Balance — December 31, 2010 |
$ | 1,431 | $ | 308 | $ | 2,563 | $ | (177 | ) | $ | — | (2) | $ | 8 | $ | 2,394 | $ | 2,552 | $ | 6,685 | ||||||||||||||||
| Net income |
— | — | — | — | — | — | — | 2,398 | 2,398 | |||||||||||||||||||||||||||
| Other comprehensive (loss) income |
— | — | (1,351 | ) | 20 | (125 | ) | (5 | ) | (1,461 | ) | — | (1,461 | ) | ||||||||||||||||||||||
| Effect of share-based compensation |
— | (12 | ) | — | — | — | — | — | — | (12 | ) | |||||||||||||||||||||||||
| Dividends declared |
— | — | — | — | — | — | — | (180 | ) | (180 | ) | |||||||||||||||||||||||||
| Issuance of common shares |
37 | — | — | — | — | — | — | — | 37 | |||||||||||||||||||||||||||
| Transfer of actuarial losses on defined benefit plans |
— | — | — | — | 125 | — | 125 | (125 | ) | — | ||||||||||||||||||||||||||
| Balance — September 30, 2011 |
$ | 1,468 | $ | 296 | $ | 1,212 | $ | (157 | ) | $ | — | (2) | $ | 3 | $ | 1,058 | $ | 4,645 | $ | 7,467 | ||||||||||||||||
| (1) | All equity transactions are attributable to common shareholders. |
| (2) | Any amounts incurred during a period are closed out to retained earnings at each period-end. Therefore, no balance exists in the reserve at beginning or end of period. |
| (See | Notes to the Condensed Consolidated Financial Statements) |
| 5 | PotashCorp 2012 Third Quarter Quarterly Report on Form 10-Q |
Potash Corporation of Saskatchewan Inc.
Notes to the Condensed Consolidated Financial Statements
For the Three and Nine Months Ended September 30, 2012
(in millions of US dollars except share and per-share amounts)
(unaudited)
| 1. | Significant Accounting Policies |
Basis of Presentation
With its subsidiaries, Potash Corporation of Saskatchewan Inc. (“PCS”) — together known as “PotashCorp” or “the company” except to the extent the context otherwise requires — forms an integrated fertilizer and related industrial and feed products company. These unaudited interim condensed consolidated financial statements are based on International Financial Reporting Standards (“IFRS”), as issued by the International Accounting Standards Board (“IASB”), and have been prepared in accordance with International Accounting Standard (“IAS”) 34, “Interim Financial Reporting.” The accounting policies used in preparing these unaudited interim condensed consolidated financial statements are consistent with those used in the preparation of the 2011 annual consolidated financial statements.
These unaudited interim condensed consolidated financial statements include the accounts of PCS and its subsidiaries; however, they do not include all disclosures normally provided in annual consolidated financial statements and should be read in conjunction with the 2011 annual consolidated financial statements. In management’s opinion, the unaudited interim condensed consolidated financial statements include all adjustments necessary to fairly present such information. Interim results are not necessarily indicative of the results expected for the fiscal year.
These unaudited interim condensed consolidated financial statements were authorized by the audit committee of the Board of Directors for issue on October 31, 2012.
Standards, amendments and interpretations not yet effective and not applied
The IASB and International Financial Reporting Interpretations Committee (“IFRIC”) have issued the following standards and amendments or interpretations to existing standards that are not yet effective and not applied. The company does not anticipate early adoption of these standards at this time.
| Standard | Description | Impact | Effective date1 | |||
| Amendments to IAS 1, Presentation of Financial Statements | Amendments require items within other comprehensive income (“OCI”) that may be reclassified to the profit or loss section of the income statement to be grouped together. | The format of the company’s consolidated statements of comprehensive income will change. | July 1, 2012, applied retrospectively. | |||
| Amendments to IFRS 7, Financial Instruments: Disclosures | Issued as part of its offsetting project, addresses common disclosure requirements related to financial instruments. | The company is reviewing the standard to determine the potential impact, if any; however, no significant impact is anticipated. | January 1, 2013, applied retrospectively. | |||
| IFRS 10, Consolidated Financial Statements | Builds on existing principles by identifying the concept of control as the determining factor in whether an entity should be included within the consolidated financial statements of the parent company. | The company is reviewing the standard to determine the potential impact, if any; however, no significant impact is anticipated. | January 1, 2013, applied retrospectively, in most circumstances. | |||
| IFRS 11, Joint Arrangements | Removes a choice in accounting method and requires equity accounting for participants in joint ventures. Also focuses on the rights and obligations of an arrangement rather than its legal form. | The company is reviewing the standard to determine the potential impact, if any; however, no significant impact is anticipated. | January 1, 2013, applied prospectively. |
| PotashCorp 2012 Third Quarter Quarterly Report on Form 10-Q | 6 |
| Standard | Description | Impact | Effective date1 | |||
| IFRS 12, Disclosure of Interests in Other Entities | A new and comprehensive standard on disclosure requirements for all forms of interest in other entities, including subsidiaries, joint arrangements, associates and unconsolidated structured entities. | The company is reviewing the standard to determine the potential impact, if any; however, no significant impact is anticipated. | January 1, 2013, applied prospectively. | |||
| IFRS 13, Fair Value Measurement | Establishes a single framework for measuring fair value and introduces consistent disclosure requirements on fair value measurements. | The company is reviewing the standard to determine the potential impact, if any; however, no significant impact is anticipated. | January 1, 2013, applied prospectively. | |||
| Amendments to IAS 19, Employee Benefits | Changes relating to the recognition, measurement, presentation and disclosure of post-employment benefits. The amendment also changes the accounting for termination benefits and short-term employment benefits, along with other minor clarifications. | The company is reviewing the standard to determine the potential impact, if any. | January 1, 2013, applied retrospectively, in most circumstances. | |||
| IFRIC 20, Stripping Costs in the Production Phase of a Surface Mine | Clarifies the requirements for accounting for stripping costs in the production phase of a surface mine. | The company is reviewing the standard to determine the potential impact, if any; however, no significant impact is anticipated. | January 1, 2013, applied to the earliest period presented. | |||
| Amendments to IAS 32, Offsetting Financial Assets and Financial Liabilities | Issued as part of its offsetting project, amendments clarify certain items regarding offsetting financial assets and financial liabilities. | The company is reviewing the standard to determine the potential impact, if any; however, no significant impact is anticipated. | January 1, 2014, applied retrospectively. | |||
| IFRS 9, Financial Instruments | Initially issued guidance on the classification and measurement of financial assets. Additional guidance was issued on the classification and measurement of financial liabilities. Further amendments were issued which modify the requirements for transition from IAS 39 to IFRS 9. | The company is reviewing the standard to determine the potential impact, if any. | January 1, 2015, applied prospectively. |
| 1 | Effective date for annual periods beginning on or after the stated date. |
| 2. | Inventories |
| September 30, 2012 |
December 31, 2011 |
|||||||
| Finished products |
$ | 343 | $ | 395 | ||||
| Intermediate products |
83 | 98 | ||||||
| Raw materials |
89 | 91 | ||||||
| Materials and supplies |
166 | 147 | ||||||
| $ | 681 | $ | 731 | |||||
| 3. | Available-for-Sale Investments |
The company assesses at the end of each reporting period whether there is objective evidence that a financial asset or group of financial assets is impaired. In the case of equity instruments classified as available-for-sale, for which unrealized gains and losses are generally recognized in OCI, a significant or prolonged decline in the fair value of the investment below its cost may be evidence that the asset is impaired. When objective evidence of impairment exists, the impaired amount (i.e., the unrealized loss) is recognized in net income; any subsequent reversals would be recognized in OCI and would not flow back into net income.
| 7 | PotashCorp 2012 Third Quarter Quarterly Report on Form 10-Q |
Changes in fair value, and related accounting, for the company’s investment in Sinofert Holdings Limited (“Sinofert”) since December 31, 2011 were as follows:
| Impact of Unrealized Holding Loss on: | ||||||||||||||||
| Fair Value | Unrealized Holding Loss |
OCI and AOCI | Net Income and Retained Earnings |
|||||||||||||
| Balance — December 31, 2011 |
$ | 439 | $ | (140 | ) | $ | (140 | ) | $ | — | ||||||
| Decrease in fair value |
(61 | ) | (61 | ) | (61 | ) | — | |||||||||
| Balance — March 31, 2012 |
$ | 378 | $ | (201 | ) | $ | (201 | ) | $ | — | ||||||
| Decrease in fair value prior to recognition of impairment |
(140 | ) | (140 | ) | (140 | ) | — | |||||||||
| Recognition of impairment |
— | — | 341 | (341 | ) | |||||||||||
| Balance — June 30, 2012 |
$ | 238 | $ | (341 | ) | $ | — | $ | (341 | ) | ||||||
| Increase in fair value subsequent to recognition of impairment |
66 | 66 | 66 | — | ||||||||||||
| Balance — September 30, 2012 |
$ | 304 | $ | (275 | ) | $ | 66 | $ | (341 | ) | ||||||
| 4. | Long-Term Debt |
During the first quarter of 2012, the company classified as current the $250 aggregate principal amount of 4.875 percent senior notes due March 1, 2013.
| 5. | Pension and Other Post-Retirement Benefits |
A remeasurement of the defined benefit plan assets and liabilities was performed at June 30, 2012. As a result of a change in the discount rate, the company recorded net actuarial losses on defined benefit plan obligations of $73 in OCI, which was recognized immediately in retained earnings at June 30, 2012. The company’s defined benefit pension and other post-retirement benefit liabilities increased by $117 and deferred income tax liabilities decreased by $44 at June 30, 2012.
The discount rate used to determine the benefit obligation for the company’s significant plans at June 30, 2012 was 4.05 percent (December 31, 2011 — 4.60 percent).
| 6. | Share Capital |
Authorized
The company is authorized to issue an unlimited number of common shares without par value and an unlimited number of first preferred shares. The common shares are not redeemable or convertible. The first preferred shares may be issued in one or more series with rights and conditions to be determined by the Board of Directors. No first preferred shares have been issued.
Issued
| Number of Common Shares |
Consideration | |||||||
| Balance — December 31, 2011 |
858,702,991 | $ | 1,483 | |||||
| Issued under option plans |
2,641,154 | 18 | ||||||
| Issued for dividend reinvestment plan |
162,641 | 7 | ||||||
| Balance — September 30, 2012 |
861,506,786 | $ | 1,508 | |||||
| PotashCorp 2012 Third Quarter Quarterly Report on Form 10-Q | 8 |
| 7. | Segment Information |
The company’s operating segments have been determined based on reports reviewed by the Chief Executive Officer, its chief operating decision maker, that are used to make strategic decisions. The company has three reportable operating segments: potash, phosphate and nitrogen. These operating segments are differentiated by the chemical nutrient contained in the product that each produces. Inter-segment sales are made under terms that approximate market value. The accounting policies of the segments are the same as those described in Note 1.
| Three Months Ended September 30, 2012 | ||||||||||||||||||||
| Potash | Phosphate | Nitrogen | All Others | Consolidated | ||||||||||||||||
| Sales |
$ | 963 | $ | 568 | $ | 612 | $ | — | $ | 2,143 | ||||||||||
| Freight, transportation and distribution |
(76 | ) | (55 | ) | (23 | ) | — | (154 | ) | |||||||||||
| Net sales — third party |
887 | 513 | 589 | — | ||||||||||||||||
| Cost of goods sold |
(333 | ) | (391 | ) | (338 | ) | — | (1,062 | ) | |||||||||||
| Gross margin |
554 | 122 | 251 | — | 927 | |||||||||||||||
| Depreciation and amortization |
(49 | ) | (64 | ) | (33 | ) | (3 | ) | (149 | ) | ||||||||||
| Inter-segment sales |
— | — | 72 | — | — | |||||||||||||||
| Cash flows for additions to property, plant and equipment |
348 | 73 | 106 | 19 | 546 | |||||||||||||||
| Three Months Ended September 30, 2011 | ||||||||||||||||||||
| Potash | Phosphate | Nitrogen | All Others | Consolidated | ||||||||||||||||
| Sales |
$ | 1,035 | $ | 690 | $ | 596 | $ | — | $ | 2,321 | ||||||||||
| Freight, transportation and distribution |
(59 | ) | (46 | ) | (24 | ) | — | (129 | ) | |||||||||||
| Net sales — third party |
976 | 644 | 572 | — | ||||||||||||||||
| Cost of goods sold |
(276 | ) | (475 | ) | (309 | ) | — | (1,060 | ) | |||||||||||
| Gross margin |
700 | 169 | 263 | — | 1,132 | |||||||||||||||
| Depreciation and amortization |
(33 | ) | (55 | ) | (32 | ) | (2 | ) | (122 | ) | ||||||||||
| Inter-segment sales |
— | — | 56 | — | — | |||||||||||||||
| Cash flows for additions to property, plant and equipment |
493 | 41 | 53 | 3 | 590 | |||||||||||||||
| Nine Months Ended September 30, 2012 | ||||||||||||||||||||
| Potash | Phosphate | Nitrogen | All Others | Consolidated | ||||||||||||||||
| Sales |
$ | 2,731 | $ | 1,750 | $ | 1,804 | $ | — | $ | 6,285 | ||||||||||
| Freight, transportation and distribution |
(165 | ) | (140 | ) | (76 | ) | — | (381 | ) | |||||||||||
| Net sales — third party |
2,566 | 1,610 | 1,728 | — | ||||||||||||||||
| Cost of goods sold |
(884 | ) | (1,240 | ) | (956 | ) | — | (3,080 | ) | |||||||||||
| Gross margin |
1,682 | 370 | 772 | — | 2,824 | |||||||||||||||
| Depreciation and amortization |
(135 | ) | (188 | ) | (103 | ) | (8 | ) | (434 | ) | ||||||||||
| Inter-segment sales |
— | — | 164 | — | — | |||||||||||||||
| Cash flows for additions to property, plant and equipment |
1,029 | 172 | 261 | 43 | 1,505 | |||||||||||||||
| Nine Months Ended September 30, 2011 | ||||||||||||||||||||
| Potash | Phosphate | Nitrogen | All Others | Consolidated | ||||||||||||||||
| Sales |
$ | 3,265 | $ | 1,872 | $ | 1,713 | $ | — | $ | 6,850 | ||||||||||
| Freight, transportation and distribution |
(212 | ) | (129 | ) | (69 | ) | — | (410 | ) | |||||||||||
| Net sales — third party |
3,053 | 1,743 | 1,644 | — | ||||||||||||||||
| Cost of goods sold |
(817 | ) | (1,258 | ) | (969 | ) | — | (3,044 | ) | |||||||||||
| Gross margin |
2,236 | 485 | 675 | — | 3,396 | |||||||||||||||
| Depreciation and amortization |
(112 | ) | (159 | ) | (97 | ) | (6 | ) | (374 | ) | ||||||||||
| Inter-segment sales |
— | — | 133 | — | — | |||||||||||||||
| Cash flows for additions to property, plant and equipment |
1,238 | 133 | 117 | 35 | 1,523 | |||||||||||||||
| 9 | PotashCorp 2012 Third Quarter Quarterly Report on Form 10-Q |
| 8. | Share-Based Compensation |
On May 17, 2012, the company’s shareholders approved the 2012 Performance Option Plan under which the company may, after February 21, 2012 and before January 1, 2013, grant options to acquire up to 3,000,000 common shares. Under the plan, the exercise price shall not be less than the quoted market closing price of the company’s common shares on the last trading day immediately preceding the date of the grant, and an option’s maximum term is 10 years. In general, options will vest, if at all, according to a schedule based on the three-year average excess of the company’s consolidated cash flow return on investment over weighted average cost of capital. As of September 30, 2012, options to purchase a total of 1,499,300 common shares had been granted under the plan. The weighted average fair value of options granted was $16.33 per share, estimated as of the date of grant using the Black-Scholes-Merton option-pricing model with the following weighted average assumptions:
| Exercise price per option |
$ | 39.36 | ||
| Expected dividend per share |
$ | 0.56 | ||
| Expected volatility |
53% | |||
| Risk-free interest rate |
1.06% | |||
| Expected life of options |
5.5 years |
| 9. | Income Taxes |
A separate estimated average annual effective tax rate is determined for each taxing jurisdiction and applied individually to the interim period pre-tax income of each jurisdiction.
| Three Months Ended September 30 |
Nine Months Ended September 30 |
|||||||||||||||
| 2012 | 2011 | 2012 | 2011 | |||||||||||||
| Income tax expense |
$ | 249 | $ | 279 | $ | 713 | $ | 819 | ||||||||
| Actual effective tax rate on ordinary earnings |
26% | 26% | 26% | 26% | ||||||||||||
| Actual effective tax rate including discrete items |
28% | 25% | 30% | 25% | ||||||||||||
The impairment of the company’s available-for-sale investment in Sinofert is not deductible for tax purposes. Total discrete tax adjustments that impacted the rate in the three months ended September 30, 2012 resulted in an income tax expense of $14 compared to an income tax recovery of $5 in the same period last year. Total discrete tax adjustments that impacted the rate in the nine months ended September 30, 2012 resulted in an income tax expense of $17 compared to an income tax recovery of $29 in the same period last year. Significant items recorded included the following:
| Ÿ | In the first nine months of 2012, a tax expense of $17 (of which $12 was recorded in the third quarter) to adjust the 2011 tax provision to the income tax returns filed for that year. |
| Ÿ | In first-quarter 2011, a current tax recovery of $21 for previously paid withholding taxes. |
| Ÿ | In third-quarter 2011, a current tax recovery of $12 due to income tax losses in a foreign jurisdiction. |
Income tax balances within the consolidated statements of financial position were comprised of the following:
| Income Tax Assets (Liabilities) | Statements of Financial Position Location | September 30, 2012 |
December 31, 2011 |
|||||||
| Current income tax assets: |
||||||||||
| Current |
Receivables |
$ | 112 | $ | 21 | |||||
| Non-current |
Other assets |
127 | 117 | |||||||
| Deferred income tax assets |
Other assets |
30 | 19 | |||||||
| Total income tax assets |
$ | 269 | $ | 157 | ||||||
| Current income tax liabilities: |
||||||||||
| Current |
Payables and accrued charges |
$ | (22 | ) | $ | (271 | ) | |||
| Non-current |
Other non-current liabilities and deferred credits |
(99 | ) | (85 | ) | |||||
| Deferred income tax liabilities |
Deferred income tax liabilities |
(1,392 | ) | (1,052 | ) | |||||
| Total income tax liabilities |
$ | (1,513 | ) | $ | (1,408 | ) | ||||
| PotashCorp 2012 Third Quarter Quarterly Report on Form 10-Q | 10 |
| 10. | Net Income per Share |
Net income per share was calculated on the following weighted average number of shares:
| Three Months Ended September 30 |
Nine Months Ended September 30 |
|||||||||||||||
| 2012 | 2011 | 2012 | 2011 | |||||||||||||
| Basic |
859,573,000 | 856,022,000 | 859,118,000 | 855,024,000 | ||||||||||||
| Diluted |
876,026,000 | 876,959,000 | 875,885,000 | 876,844,000 | ||||||||||||
Diluted net income per share was calculated based on the weighted average number of shares issued and outstanding during the period, incorporating the following adjustments. The denominator was: (1) increased by the total of the additional common shares that would have been issued assuming the exercise of all stock options with exercise prices at or below the average market price for the period; and (2) decreased by the number of shares that the company could have repurchased if it had used the assumed proceeds from the exercise of stock options to repurchase them on the open market at the average share price for the period. For performance-based stock option plans, the number of contingently issuable common shares included in the calculation was based on the number of shares, if any, that would be issuable if the end of the reporting period were the end of the performance period and the effect were dilutive.
Excluded from the calculation of diluted net income per share for the three and nine months ended September 30, 2012 were weighted average options outstanding of 2,473,850 relating to the 2011 and 2008 Performance Option Plans, as the options’ exercise prices were greater than the average market price of common shares for the periods.
| 11 | PotashCorp 2012 Third Quarter Quarterly Report on Form 10-Q |
| PotashCorp 2012 Third Quarter Quarterly Report on Form 10-Q | 12 |
| 13 | PotashCorp 2012 Third Quarter Quarterly Report on Form 10-Q |
| PotashCorp 2012 Third Quarter Quarterly Report on Form 10-Q | 14 |
| 15 | PotashCorp 2012 Third Quarter Quarterly Report on Form 10-Q |
Key Performance Drivers — Performance Compared to Goals
In all areas of our business, we set goals and design strategies that focus on delivering sustainable value while appropriately balancing stakeholder interests. We demonstrate our accountability by tracking and reporting our progress against targets related to each goal. Our long-term goals and 2012 targets are set out on pages 31 to 42 of our 2011 Annual Report. A summary of our progress against selected goals and representative annual targets is set out below.
| Goal | Representative 2012 Annual Target |
Performance to September 30, 2012 | ||
| Create superior long-term shareholder value. | Exceed total shareholder return performance for our sector and the DAXglobal Agribusiness Index. | PotashCorp’s total shareholder return was 6 percent in the first nine months of 2012 compared to our sector’s weighted average return (based on market capitalization) of 23 percent and the DAXglobal Agribusiness Index weighted average return (based on market capitalization) of 10 percent. | ||
| Be the supplier of choice to the markets we serve. | Reduce the number of product tonnes involved in customer complaints below the prior three-year average. | For the first nine months of 2012, product tonnes involved in customer complaints fell 43 percent compared to the average for the first nine months of the prior three years. | ||
| Attract and retain talented, motivated and productive employees who are committed to our long-term goals. | Maintain an annual employee turnover rate (excluding retirements) of 5 percent or less. | Employee turnover rate (excluding retirements) on an annualized basis for the first nine months of 2012 was 6 percent, up from 4 percent in the second quarter of 2012, due mainly to a workforce reduction at Aurora. | ||
| Achieve no harm to people. | Achieve zero life-altering injuries at our sites.
Reduce total site severity injury rate by 35 percent from 2008 levels by the end of 2012. |
Sadly, we had a fatality at our Allan potash facility during the second quarter of 2012.
Total site severity injury rate was 46 percent below the 2008 annual level for the first nine months of 2012. It was 42 percent below the 2008 annual level for the first nine months of 2011 and 44 percent below the 2008 annual level by the end of 2011. | ||
| Reduce total site recordable injury rate to 1.30 (per 200,000 hours worked) or lower. | During the first nine months of 2012, total site recordable injury rate was 1.29. | |||
| Achieve no damage to the environment. | Reduce total reportable incidents (releases, permit excursions and spills) by 10 percent from 2011 levels. | Annualized total reportable incidents were up 71 percent during the first nine months of 2012 compared to 2011 annual levels. Compared to the first nine months of 2011, total reportable incidents were up 64 percent. | ||
Financial Overview
This discussion and analysis are based on the company’s unaudited interim condensed consolidated financial statements included in Item 1 of this Quarterly Report on Form 10-Q (financial statements in this Form 10-Q) based on International Financial Reporting Standards (IFRS), as issued by the International Accounting Standards Board (IASB), unless otherwise stated. All references to per-share amounts pertain to diluted net income per share.
For an understanding of trends, events, uncertainties and the effect of critical accounting estimates on our results and financial condition, the entire document should be read carefully, together with our 2011 Annual Report.
Earnings Guidance — Third Quarter 2012
| Company Guidance | Actual Results | |||||||
| Earnings per share |
$ | 0.70 – $0.90 | $ | 0.74 | ||||
| PotashCorp 2012 Third Quarter Quarterly Report on Form 10-Q | 16 |
Overview of Actual Results
| Three Months Ended September 30 | Nine Months Ended September 30 | |||||||||||||||||||||||||||||||
| Dollars (millions) — except per-share amounts | 2012 | 2011 | Change | % Change | 2012 | 2011 | Change | % Change | ||||||||||||||||||||||||
| Sales |
$ | 2,143 | $ | 2,321 | $ | (178 | ) | (8 | ) | $ | 6,285 | $ | 6,850 | $ | (565 | ) | (8 | ) | ||||||||||||||
| Gross Margin |
927 | 1,132 | (205 | ) | (18 | ) | 2,824 | 3,396 | (572 | ) | (17 | ) | ||||||||||||||||||||
| Operating Income |
918 | 1,142 | (224 | ) | (20 | ) | 2,460 | 3,342 | (882 | ) | (26 | ) | ||||||||||||||||||||
| Net Income |
645 | 826 | (181 | ) | (22 | ) | 1,658 | 2,398 | (740 | ) | (31 | ) | ||||||||||||||||||||
| Net Income per Share — Diluted |
0.74 | 0.94 | (0.20 | ) | (21 | ) | 1.89 | 2.73 | (0.84 | ) | (31 | ) | ||||||||||||||||||||
| Other Comprehensive Income (Loss) |
313 | (1,121 | ) | 1,434 | n/m | 444 | (1,461 | ) | 1,905 | n/m | ||||||||||||||||||||||
| n/m | = not meaningful |
| 17 | PotashCorp 2012 Third Quarter Quarterly Report on Form 10-Q |
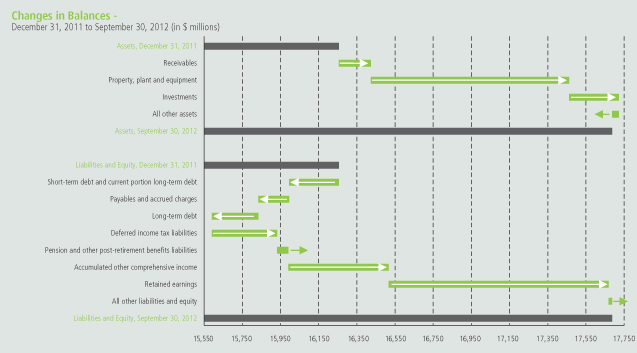
Balance Sheet
| PotashCorp 2012 Third Quarter Quarterly Report on Form 10-Q | 18 |
Operating Segment Review
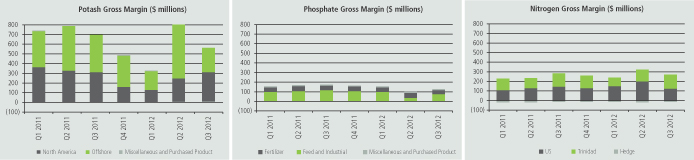
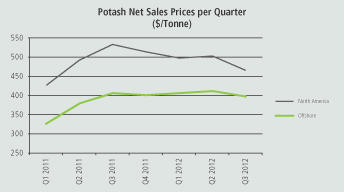
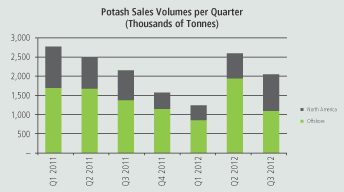
Potash
Financial Performance
| Three Months Ended September 30 | ||||||||||||||||||||||||||||||||||||
| Dollars (millions) | Tonnes (thousands) | Average per Tonne(1) | ||||||||||||||||||||||||||||||||||
| 2012 | 2011 | % Change | 2012 | 2011 | % Change | 2012 | 2011 | % Change | ||||||||||||||||||||||||||||
| Manufactured product |
||||||||||||||||||||||||||||||||||||
| Net sales |
||||||||||||||||||||||||||||||||||||
| North America |
$ | 443 | $ | 410 | 8 | 951 | 769 | 24 | $ | 466 | $ | 533 | (13 | ) | ||||||||||||||||||||||
| Offshore |
441 | 563 | (22 | ) | 1,107 | 1,387 | (20 | ) | $ | 398 | $ | 406 | (2 | ) | ||||||||||||||||||||||
| 884 | 973 | (9 | ) | 2,058 | 2,156 | (5 | ) | $ | 429 | $ | 451 | (5 | ) | |||||||||||||||||||||||
| Cost of goods sold |
(330 | ) | (274 | ) | 20 | $ | (160 | ) | $ | (127 | ) | 26 | ||||||||||||||||||||||||
| Gross margin |
554 | 699 | (21 | ) | $ | 269 | $ | 324 | (17 | ) | ||||||||||||||||||||||||||
| Other miscellaneous and purchased product gross margin(2) |
— | 1 | (100 | ) | ||||||||||||||||||||||||||||||||
| Gross Margin |
$ | 554 | $ | 700 | (21 | ) | $ | 269 | $ | 325 | (17 | ) | ||||||||||||||||||||||||
| (1) | Rounding differences may occur due to the use of whole dollars in per-tonne calculations. |
| (2) | Comprised of net sales of $3 million (2011 — $3 million) less cost of goods sold of $3 million (2011 — $2 million). |
| 19 | PotashCorp 2012 Third Quarter Quarterly Report on Form 10-Q |
| Nine Months Ended September 30 | ||||||||||||||||||||||||||||||||||||
| Dollars (millions) | Tonnes (thousands) | Average per Tonne(1) | ||||||||||||||||||||||||||||||||||
| 2012 | 2011 | % Change | 2012 | 2011 | % Change | 2012 | 2011 | % Change | ||||||||||||||||||||||||||||
| Manufactured product |
||||||||||||||||||||||||||||||||||||
| Net sales |
||||||||||||||||||||||||||||||||||||
| North America |
$ | 968 | $ | 1,285 | (25 | ) | 2,002 | 2,692 | (26 | ) | $ | 484 | $ | 477 | 1 | |||||||||||||||||||||
| Offshore |
1,588 | 1,758 | (10 | ) | 3,911 | 4,773 | (18 | ) | $ | 406 | $ | 368 | 10 | |||||||||||||||||||||||
| 2,556 | 3,043 | (16 | ) | 5,913 | 7,465 | (21 | ) | $ | 432 | $ | 408 | 6 | ||||||||||||||||||||||||
| Cost of goods sold |
(876 | ) | (810 | ) | 8 | $ | (148 | ) | $ | (109 | ) | 36 | ||||||||||||||||||||||||
| Gross margin |
1,680 | 2,233 | (25 | ) | $ | 284 | $ | 299 | (5 | ) | ||||||||||||||||||||||||||
| Other miscellaneous and purchased product gross margin(2) |
2 | 3 | (33 | ) | ||||||||||||||||||||||||||||||||
| Gross Margin |
$ | 1,682 | $ | 2,236 | (25 | ) | $ | 284 | $ | 300 | (5 | ) | ||||||||||||||||||||||||
| (1) | Rounding differences may occur due to the use of whole dollars in per-tonne calculations. |
| (2) | Comprised of net sales of $10 million (2011 — $10 million) less cost of goods sold of $8 million (2011 — $7 million). |
Potash gross margin variance attributable to:
| Three Months Ended September 30 2012 vs. 2011 |
Nine Months Ended September 30 2012 vs. 2011 |
|||||||||||||||||||||||||||||||
| Change in Prices/Costs |
Change in Prices/Costs |
|||||||||||||||||||||||||||||||
| Dollars (millions) | Change in Sales Volumes |
Net Sales |
Cost of Goods Sold |
Total | Change in Sales Volumes |
Net Sales |
Cost of Goods Sold |
Total | ||||||||||||||||||||||||
| Manufactured product |
||||||||||||||||||||||||||||||||
| North America |
$ | 55 | $ | (34 | ) | $ | (28 | ) | $ | (7 | ) | $ | (286 | ) | $ | 13 | $ | (56 | ) | $ | (329 | ) | ||||||||||
| Offshore |
(90 | ) | (10 | ) | (38 | ) | (138 | ) | (252 | ) | 147 | (119 | ) | (224 | ) | |||||||||||||||||
| Change in market mix |
(23 | ) | 21 | 2 | — | 16 | (15 | ) | (1 | ) | — | |||||||||||||||||||||
| Total manufactured product |
$ | (58 | ) | $ | (23 | ) | $ | (64 | ) | (145 | ) | $ | (522 | ) | $ | 145 | $ | (176 | ) | (553 | ) | |||||||||||
| Other miscellaneous and purchased product |
(1 | ) | (1 | ) | ||||||||||||||||||||||||||||
| Total |
$ | (146 | ) | $ | (554 | ) | ||||||||||||||||||||||||||
|
|
| PotashCorp 2012 Third Quarter Quarterly Report on Form 10-Q | 20 |
|
| |
Canpotex Limited (Canpotex) sales to major markets, by percentage of sales volumes, were as follows:
| Three Months Ended September 30 | Nine Months Ended September 30 | |||||||||||||||||||||||||||||||
| 2012 | 2011 | Change | % Change | 2012 | 2011 | Change | % Change | |||||||||||||||||||||||||
| Asia (excluding China and India) |
41 | 40 | 1 | 3 | 45 | 45 | — | — | ||||||||||||||||||||||||
| Latin America |
32 | 26 | 6 | 23 | 29 | 28 | 1 | 4 | ||||||||||||||||||||||||
| China |
12 | 20 | (8 | ) | (40 | ) | 15 | 17 | (2 | ) | (12 | ) | ||||||||||||||||||||
| India |
5 | 9 | (4 | ) | (44 | ) | 6 | 5 | 1 | 20 | ||||||||||||||||||||||
| Oceania, Europe and Other |
10 | 5 | 5 | 100 | 5 | 5 | — | — | ||||||||||||||||||||||||
| 100 | 100 | 100 | 100 | |||||||||||||||||||||||||||||
The most significant contributors to the change in total gross margin quarter over quarter were as follows(1):
| (1) | Direction of arrows refers to impact on gross margin. |
| Net Sales Prices | Sales Volumes | Cost of Goods Sold | ||
| i Our third-quarter average realized potash price was relatively flat compared to second quarter 2012, but declined from the same period last year on softening prices in spot markets. |
h Strong demand pushed North American potash sales volumes to a third-quarter record.
i Shipments to Latin America outpaced last year’s third quarter, but strength from this market was more than offset by the decline in Canpotex sales to China and India. |
i At Esterhazy, brine management costs and other operating costs were higher.
| ||
|
i 15 shutdown weeks were taken in 2012 mainly as a result of our strategy to match production with market demand and for expansion-related activities (9 shutdown weeks taken in 2011 mainly for expansion-related activities).
i Depreciation costs increased due to higher asset levels associated with our mine expansion activity. | ||||
The change in market mix produced an unfavorable variance of $23 million related to sales volumes and a favorable variance of $21 million in sales prices due to more higher-priced granular sales being sold to North America whereas last year, lower-priced standard product to the offshore market comprised a larger proportion of total sales.
| 21 | PotashCorp 2012 Third Quarter Quarterly Report on Form 10-Q |
The most significant contributors to the change in total gross margin year over year were as follows(1):
| (1) | Direction of arrows refers to impact on gross margin. |
| Net Sales Prices | Sales Volumes | Cost of Goods Sold | ||
| h Our average realized potash price was up, reflecting price gains in spot and contract markets achieved in 2012 and 2011. Although prices in most major spot markets declined from fourth-quarter 2011, our average realized price moved higher and reflected a lower percentage of sales shipped to offshore contract markets. |
i Shipments to India declined drastically due to its fertilizer subsidy changes, which led to higher retail prices and reduced demand. Volumes to China were impacted by a 2012 first-half contract that was lower than 2011 and a second-half contract being signed in 2011 but not yet in 2012.
i In North America our sales volumes were well below the first nine months of 2011 largely because of buyer destocking during the first six months of this year. |
i 55 shutdown weeks incurred in 2012 (at our Lanigan, Rocanville, Allan and Patience Lake facilities) primarily to match production to market demand (9 shutdown weeks were taken in 2011 at Allan, due to expansion-related activities, and Patience Lake). During this downtime in 2012, we opted to allocate resources to non-production activities rather than lay off employees, which resulted in higher shutdown costs.
i Depreciation costs increased due to higher asset levels associated with our mine expansion activity.
i At Esterhazy, brine management costs, other operating costs and depreciation were higher.
i More product from our higher-cost mines went to offshore customers resulting in a higher cost of goods sold variance than North America. | ||
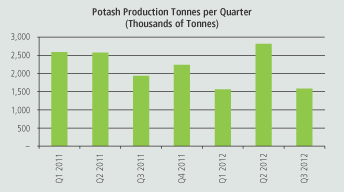
Non-Financial Performance
| Three Months Ended September 30 | Nine Months Ended September 30 | |||||||||||||||||||||||
| 2012 | 2011 | % Change | 2012 | 2011 | % Change | |||||||||||||||||||
| KCl tonnes produced (thousands) |
1,579 | 1,937 | (18 | ) | 5,961 | 7,099 | (16 | ) | ||||||||||||||||
| Total site severity injury rate |
1.28 | 0.64 | 100 | 0.93 | 0.60 | 55 | ||||||||||||||||||
| Environmental incidents |
2 | 2 | — | 7 | 6 | 17 | ||||||||||||||||||
A rise in modified work injuries, partly offset by lower lost-time injuries, caused the increase in the total site severity injury rate for the three and nine months ended September 30, 2012. An external consultant has been retained to help improve safety performance at three sites with the highest number of injuries.
| PotashCorp 2012 Third Quarter Quarterly Report on Form 10-Q | 22 |
Phosphate
Financial Performance
| Three Months Ended September 30 | ||||||||||||||||||||||||||||||||||||
| Dollars (millions) | Tonnes (thousands) | Average per Tonne(1) | ||||||||||||||||||||||||||||||||||
| 2012 | 2011 | % Change | 2012 | 2011 | % Change | 2012 | 2011 | % Change | ||||||||||||||||||||||||||||
| Manufactured product |
||||||||||||||||||||||||||||||||||||
| Net sales |
||||||||||||||||||||||||||||||||||||
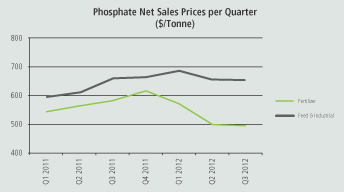
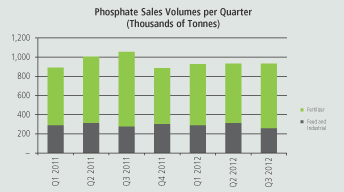
| Fertilizer |
$ | 333 | $ | 454 | (27 | ) | 676 | 780 | (13 | ) | $ | 493 | $ | 582 | (15 | ) | ||||||||||||||||||||
| Feed and Industrial |
172 | 182 | (5 | ) | 263 | 278 | (5 | ) | $ | 654 | $ | 659 | (1 | ) | ||||||||||||||||||||||
| 505 | 636 | (21 | ) | 939 | 1,058 | (11 | ) | $ | 537 | $ | 602 | (11 | ) | |||||||||||||||||||||||
| Cost of goods sold |
(388 | ) | (471 | ) | (18 | ) | $ | (413 | ) | $ | (445 | ) | (7 | ) | ||||||||||||||||||||||
| Gross margin |
117 | 165 | (29 | ) | $ | 124 | $ | 157 | (21 | ) | ||||||||||||||||||||||||||
| Other miscellaneous and purchased product |
5 | 4 | 25 | |||||||||||||||||||||||||||||||||
| Gross Margin |
$ | 122 | $ | 169 | (28 | ) | $ | 130 | $ | 160 | (19 | ) | ||||||||||||||||||||||||
| (1) | Rounding differences may occur due to the use of whole dollars in per-tonne calculations. |
| (2) | Comprised of net sales of $8 million (2011 — $8 million) less cost of goods sold of $3 million (2011 — $4 million). |
| Nine Months Ended September 30 | ||||||||||||||||||||||||||||||||||||
| Dollars (millions) | Tonnes (thousands) | Average per Tonne(1) | ||||||||||||||||||||||||||||||||||
| 2012 | 2011 | % Change | 2012 | 2011 | % Change | 2012 | 2011 | % Change | ||||||||||||||||||||||||||||
| Manufactured product |
||||||||||||||||||||||||||||||||||||
| Net sales |
||||||||||||||||||||||||||||||||||||
| Fertilizer |
$ | 1,004 | $ | 1,173 | (14 | ) | 1,932 | 2,080 | (7 | ) | $ | 520 | $ | 564 | (8 | ) | ||||||||||||||||||||
| Feed and Industrial |
581 | 548 | 6 | 873 | 884 | (1 | ) | $ | 666 | $ | 620 | 7 | ||||||||||||||||||||||||
| 1,585 | 1,721 | (8 | ) | 2,805 | 2,964 | (5 | ) | $ | 565 | $ | 581 | (3 | ) | |||||||||||||||||||||||
| Cost of goods sold |
(1,229 | ) | (1,247 | ) | (1 | ) | $ | (438 | ) | $ | (421 | ) | 4 | |||||||||||||||||||||||
| Gross margin |
356 | 474 | (25 | ) | $ | 127 | $ | 160 | (21 | ) | ||||||||||||||||||||||||||
| Other miscellaneous and purchased product |
14 | 11 | 27 | |||||||||||||||||||||||||||||||||
| Gross Margin |
$ | 370 | $ | 485 | (24 | ) | $ | 132 | $ | 164 | (20 | ) | ||||||||||||||||||||||||
| (1) | Rounding differences may occur due to the use of whole dollars in per-tonne calculations. |
| (2) | Comprised of net sales of $25 million (2011 — $22 million) less cost of goods sold of $11 million (2011 — $11 million). |
| 23 | PotashCorp 2012 Third Quarter Quarterly Report on Form 10-Q |
Phosphate gross margin variance attributable to:
| Three Months Ended September 30 2012 vs. 2011 |
Nine Months Ended September 30 2012 vs. 2011 |
|||||||||||||||||||||||||||||||
| Change in Prices/Costs |
Change in Prices/Costs |
|||||||||||||||||||||||||||||||
| Dollars (millions) | Change in Sales Volumes |
Net Sales |
Cost of Goods Sold |
Total | Change in Sales Volumes |
Net Sales |
Cost of Goods Sold |
Total | ||||||||||||||||||||||||
| Manufactured product |
||||||||||||||||||||||||||||||||
| Fertilizer |
$ | (27 | ) | $ | (56 | ) | $ | 37 | $ | (46 | ) | $ | (36 | ) | $ | (82 | ) | $ | (1 | ) | $ | (119 | ) | |||||||||
| Feed and Industrial |
(4 | ) | — | 2 | (2 | ) | (5 | ) | 41 | (35 | ) | 1 | ||||||||||||||||||||
| Change in market mix |
7 | (8 | ) | 1 | — | 3 | (4 | ) | 1 | — | ||||||||||||||||||||||
| Total manufactured product |
$ | (24 | ) | $ | (64 | ) | $ | 40 | (48 | ) | $ | (38 | ) | $ | (45 | ) | $ | (35 | ) | (118 | ) | |||||||||||
| Other miscellaneous and purchased product |
1 | 3 | ||||||||||||||||||||||||||||||
| Total |
$ | (47 | ) | $ | (115 | ) | ||||||||||||||||||||||||||
|
|
The most significant contributors to the change in total gross margin quarter over quarter were as follows(1):
| (1) | Direction of arrows refers to impact on gross margin. |
| Net Sales Prices | Sales Volumes | Cost of Goods Sold | ||||||||
| i | Average realized phosphate prices reflected lower prices for solid and liquid fertilizers, although the relative strength of our diversified feed and industrial products – where pricing is typically less volatile than products with agricultural exposure – helped limit the overall decline. |
i | The impacts of tropical storm Debby, a turnaround at our Geismar facility and challenging mining conditions in a new portion of our Aurora mine limited production during the quarter. As a result, third-quarter sales volumes were below the same quarter last year, reflecting our decision to allocate a larger percentage of our limited phosphoric acid production to higher-margin products. |
h
h |
Sulfur costs were down 16 percent.
A small favorable adjustment to our asset retirement obligations was recorded in 2012 due to an increase in relevant discount rates while a larger unfavorable adjustment was recorded in 2011 due to a decrease in the relevant discount rates. | |||||
| PotashCorp 2012 Third Quarter Quarterly Report on Form 10-Q | 24 |
The most significant contributors to the change in total gross margin year over year were as follows(1):
| (1) | Direction of arrows refers to impact on gross margin. |
| Net Sales Prices | Sales Volumes | Cost of Goods Sold | ||||||||
| i
h |
Our average realized phosphate price reflected lower prices for both solid and liquid fertilizers as a result of key benchmark prices resetting.
Feed and industrial products benefit from a time lag on quarterly contract sales. |
i | Volumes were primarily impacted by our decision to allocate a larger percentage of our limited phosphoric acid production to higher-margin products. | i | Ammonia costs were up 14 percent. | |||||
|
h |
Negative adjustments to our phosphate asset retirement obligations in 2012 were lower than in 2011. | |||||||||
|
i |
Costs associated with our Aurora workforce reduction were incurred during the second quarter of 2012. |
Non-Financial Performance
| Three Months Ended September 30 | Nine Months Ended September 30 | |||||||||||||||||||||||
| 2012 | 2011 | % Change | 2012 | 2011 | % Change | |||||||||||||||||||
|
P2O5 tonnes produced (thousands) |
493 | 565 | (13 | ) | 1,479 | 1,649 | (10 | ) | ||||||||||||||||
|
P2O5 operating rate percentage |
83% | 95% | (13 | ) | 83% | 93% | (11 | ) | ||||||||||||||||
| Total site severity injury rate |
0.12 | 0.57 | (79 | ) | 0.31 | 0.90 | (66 | ) | ||||||||||||||||
| Environmental incidents |
1 | 1 | — | 5 | 2 | 150 | ||||||||||||||||||
Safety improvement plans implemented in 2012 focused on improving employee and contractor safety, resulting in a reduced total site severity injury rate for the three and nine months ended September 30, 2012.
The rise in environmental incidents year over year was the result of four incidents occurring during or immediately following extreme weather events.
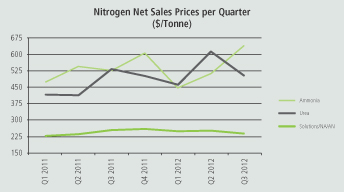
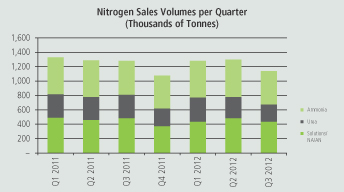
Nitrogen
Financial Performance
| Three Months Ended September 30 | ||||||||||||||||||||||||||||||||||||
| Dollars (millions) | Tonnes (thousands) | Average per Tonne(1) | ||||||||||||||||||||||||||||||||||
| 2012 | 2011 | % Change | 2012 | 2011 | % Change | 2012 | 2011 | % Change | ||||||||||||||||||||||||||||
| Manufactured product |
||||||||||||||||||||||||||||||||||||
| Net sales |
||||||||||||||||||||||||||||||||||||
| Ammonia |
$ | 299 | $ | 250 | 20 | 466 | 475 | (2 | ) | $ | 641 | $ | 526 | 22 | ||||||||||||||||||||||
| Urea |
121 | 174 | (30 | ) | 241 | 325 | (26 | ) | $ | 504 | $ | 534 | (6 | ) | ||||||||||||||||||||||
| Nitrogen solutions/Nitric acid/Ammonium nitrate |
104 | 124 | (16 | ) | 438 | 492 | (11 | ) | $ | 238 | $ | 254 | (6 | ) | ||||||||||||||||||||||
| 524 | 548 | (4 | ) | 1,145 | 1,292 | (11 | ) | $ | 458 | $ | 424 | 8 | ||||||||||||||||||||||||
| Cost of goods sold |
(291 | ) | (300 | ) | (3 | ) | $ | (254 | ) | $ | (232 | ) | 9 | |||||||||||||||||||||||
| Gross margin |
233 | 248 | (6 | ) | $ | 204 | $ | 192 | 6 | |||||||||||||||||||||||||||
| Other miscellaneous and purchased product |
18 | 15 | 20 | |||||||||||||||||||||||||||||||||
| Gross Margin |
$ | 251 | $ | 263 | (5 | ) | $ | 219 | $ | 204 | 7 | |||||||||||||||||||||||||
|
(1) Rounding differences may occur due to the use of whole dollars in per-tonne calculations.
(2) Comprised of net sales of $65 million (2011 — $24 million) less cost of goods sold of $47 million (2011 — $9 million). |
| |||||||||||||||||||||||||||||||||||
| 25 | PotashCorp 2012 Third Quarter Quarterly Report on Form 10-Q |
| Nine Months Ended September 30 | ||||||||||||||||||||||||||||||||||||
| Dollars (millions) | Tonnes (thousands) | Average per Tonne(1) | ||||||||||||||||||||||||||||||||||
| 2012 | 2011 | % Change | 2012 | 2011 | % Change | 2012 | 2011 | % Change | ||||||||||||||||||||||||||||
| Manufactured product |
||||||||||||||||||||||||||||||||||||
| Net sales |
||||||||||||||||||||||||||||||||||||
| Ammonia |
$ | 794 | $ | 774 | 3 | 1,499 | 1,503 | — | $ | 530 | $ | 515 | 3 | |||||||||||||||||||||||
| Urea |
456 | 442 | 3 | 870 | 972 | (10 | ) | $ | 525 | $ | 455 | 15 | ||||||||||||||||||||||||
| Nitrogen solutions/Nitric acid/Ammonium nitrate |
338 | 346 | (2 | ) | 1,371 | 1,456 | (6 | ) | $ | 246 | $ | 238 | 3 | |||||||||||||||||||||||
| 1,588 | 1,562 | 2 | 3,740 | 3,931 | (5 | ) | $ | 425 | $ | 397 | 7 | |||||||||||||||||||||||||
| Cost of goods sold |
(869 | ) | (921 | ) | (6 | ) | $ | (233 | ) | $ | (234 | ) | — | |||||||||||||||||||||||
| Gross margin |
719 | 641 | 12 | $ | 192 | $ | 163 | 18 | ||||||||||||||||||||||||||||
| Other miscellaneous and purchased product gross margin(2) |
53 | 34 | 56 | |||||||||||||||||||||||||||||||||
| Gross Margin |
$ | 772 | $ | 675 | 14 | $ | 206 | $ | 172 | 20 | ||||||||||||||||||||||||||
|
(1) Rounding differences may occur due to the use of whole dollars in per-tonne calculations.
(2) Comprised of net sales of $140 million (2011 — $82 million) less cost of goods sold of $87 million (2011 — $48 million). |
| |||||||||||||||||||||||||||||||||||
Nitrogen gross margin variance attributable to:
| Three Months Ended September 30 2012 vs. 2011 |
Nine Months Ended September 30 2012 vs. 2011 |
|||||||||||||||||||||||||||||||
| Change in Prices/Costs |
Change in Prices/Costs |
|||||||||||||||||||||||||||||||
| Dollars (millions) | Change in Sales Volumes |
Net Sales |
Cost of Goods Sold |
Total | Change in Sales Volumes |
Net Sales |
Cost of Goods Sold |
Total | ||||||||||||||||||||||||
| Manufactured product |
||||||||||||||||||||||||||||||||
| Ammonia |
$ | (4 | ) | $ | 54 | $ | (14 | ) | $ | 36 | $ | (2 | ) | $ | 23 | $ | 12 | $ | 33 | |||||||||||||
| Urea |
(24 | ) | (14 | ) | 4 | (34 | ) | (28 | ) | 62 | 14 | 48 | ||||||||||||||||||||
| Solutions, NA, AN |
(4 | ) | (7 | ) | (6 | ) | (17 | ) | (11 | ) | 12 | (9 | ) | (8 | ) | |||||||||||||||||
| Hedge |
— | — | — | — | — | — | 5 | 5 | ||||||||||||||||||||||||
| Change in market mix |
(3 | ) | 4 | (1 | ) | — | (10 | ) | 7 | 3 | — | |||||||||||||||||||||
| Total manufactured product |
$ | (35 | ) | $ | 37 | $ | (17 | ) | (15 | ) | $ | (51 | ) | $ | 104 | $ | 25 | 78 | ||||||||||||||
| Other miscellaneous and purchased product |
3 | 19 | ||||||||||||||||||||||||||||||
| Total |
$ | (12 | ) | $ | 97 | |||||||||||||||||||||||||||
|
|
| PotashCorp 2012 Third Quarter Quarterly Report on Form 10-Q | 26 |
| Three Months Ended September 30 | Nine Months Ended September 30 | |||||||||||||||||||||||||||||||
| Sales Tonnes (thousands) |
Price per Tonne | Sales Tonnes (thousands) |
Price per Tonne | |||||||||||||||||||||||||||||
| 2012 | 2011 | 2012 | 2011 | 2012 | 2011 | 2012 | 2011 | |||||||||||||||||||||||||
| Fertilizer |
301 | 445 | $ | 455 | $ | 469 | 1,108 | 1,281 | $ | 474 | $ | 425 | ||||||||||||||||||||
| Industrial and Feed |
844 | 847 | $ | 459 | $ | 401 | 2,632 | 2,650 | $ | 404 | $ | 384 | ||||||||||||||||||||
| 1,145 | 1,292 | $ | 458 | $ | 424 | 3,740 | 3,931 | $ | 425 | $ | 397 | |||||||||||||||||||||
The most significant contributors to the change in total gross margin quarter over quarter were as follows(1):
| (1) | Direction of arrows refers to impact on gross margin. |
| Net Sales Prices | Sales Volumes | Cost of Goods Sold | ||||||||
| h | Tight ammonia market fundamentals pushed prices higher. |
i | Gas interruptions in Trinidad and expansion-related downtime at our Augusta facility resulted in sales volumes for the third-quarter declining from the same period last year. |
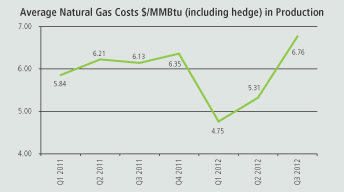
i | Average natural gas costs in production, including hedge, increased 10 percent. Natural gas costs in Trinidad production rose 22 percent (contract price indexed, in part, to Tampa ammonia prices) while our US spot costs for natural gas used in production fell 29 percent. Including losses on our hedge position, US gas prices declined 13 percent. | |||||
The most significant contributors to the change in total gross margin year over year were as follows(1):
| (1) | Direction of arrows refers to impact on gross margin. |
| Net Sales Prices | Sales Volumes | Cost of Goods Sold | ||||||||
| h | Strong demand for urea, nitrogen solutions and nitric acid, combined with limited supply, pushed prices for these products higher. |
i | Sales volumes were below the same period last year, largely as a result of reduced production at Geismar and natural gas limitations at Trinidad impacting our production in 2012. | h | Average natural gas costs in production, including hedge, decreased 8 percent. Natural gas costs in Trinidad production rose 3 percent while our US spot costs for natural gas used in production fell 35 percent. Including losses on our hedge position, US gas prices declined 26 percent. | |||||
| 27 | PotashCorp 2012 Third Quarter Quarterly Report on Form 10-Q |
Non-Financial Performance
| Three Months Ended September 30 | Nine Months Ended September 30 | |||||||||||||||||||||||
| 2012 | 2011 | % Change | 2012 | 2011 | % Change | |||||||||||||||||||
| N tonnes produced (thousands) |
651 | 724 | (10 | ) | 2,029 | 2,115 | (4 | ) | ||||||||||||||||
| Total site severity injury rate |
0.08 | 0.13 | (38 | ) | 0.13 | 0.14 | (7 | ) | ||||||||||||||||
| Environmental incidents |
3 | — | n/m | 6 | 3 | 100 | ||||||||||||||||||
| n/m | = not meaningful |
Other Expenses and Income
| Three Months Ended September 30 | Nine Months Ended September 30 | |||||||||||||||||||||||||||||||
| Dollars (millions) | 2012 | 2011 | Change | % Change | 2012 | 2011 | Change | % Change | ||||||||||||||||||||||||
| Selling and administrative expenses |
$ | (53 | ) | $ | (46 | ) | $ | (7 | ) | 15 | $ | (166 | ) | $ | (176 | ) | $ | 10 | (6 | ) | ||||||||||||
| Provincial mining and other taxes |
(62 | ) | (53 | ) | (9 | ) | 17 | (162 | ) | (147 | ) | (15 | ) | 10 | ||||||||||||||||||
| Share of earnings of equity-accounted investees |
77 | 68 | 9 | 13 | 220 | 185 | 35 | 19 | ||||||||||||||||||||||||
| Dividend income |
39 | 41 | (2 | ) | (5 | ) | 106 | 94 | 12 | 13 | ||||||||||||||||||||||
| Impairment of available-for-sale investment |
— | — | — | n/m | (341 | ) | — | (341 | ) | n/m | ||||||||||||||||||||||
| Other expenses |
(10 | ) | — | (10 | ) | n/m | (21 | ) | (10 | ) | (11 | ) | 110 | |||||||||||||||||||
| Finance costs |
(24 | ) | (37 | ) | 13 | (35 | ) | (89 | ) | (125 | ) | 36 | (29 | ) | ||||||||||||||||||
| Income taxes |
(249 | ) | (279 | ) | 30 | (11 | ) | (713 | ) | (819 | ) | 106 | (13 | ) | ||||||||||||||||||
| n/m | = not meaningful |
Provincial mining and other taxes are comprised mainly of the Saskatchewan Potash Production Tax (PPT) and a resource surcharge. The PPT is comprised of a base tax per tonne of product sold and an additional tax based on mine profit, which is reduced by an amount based on potash capital expenditures. The resource surcharge is a percentage (3 percent) of the value of the company’s Saskatchewan resource sales. The PPT expense in the third quarter and first nine months of 2012 was higher than in the same periods in 2011 as a result of loss carry-forwards used in the prior year. The resource surcharge decreased year over year as a result of lower potash sales revenues in the first nine months of 2012 compared to the same period in 2011.
Share of earnings of equity-accounted investees, primarily Arab Potash Company and Sociedad Quimica y Minera de Chile S.A., was higher due to increased earnings by these companies. ICL paid higher dividends in the first nine months of 2012 compared to the same periods last year.
In the second quarter of 2012, we concluded there was objective evidence that our available-for-sale investment in Sinofert was impaired due to the significance by which fair value was below cost. As a result, we recognized a non-tax deductible impairment loss of $341 million in net income for the nine months ended September 30, 2012. No such losses were recognized in 2011.
Finance costs were lower as a result of higher capitalized interest and the repayment of 10-year senior notes in the second quarter of 2011. Weighted average debt obligations outstanding and the associated interest rates were as follows:
| Three Months Ended September 30 | Nine Months Ended September 30 | |||||||||||||||||||||||||||||||
| Dollars (millions) — except percentage amounts |
2012 | 2011 | Change | % Change | 2012 | 2011 | Change | % Change | ||||||||||||||||||||||||
| Long-term debt obligations, including current portion |
||||||||||||||||||||||||||||||||
| Weighted average outstanding |
$ | 3,756 | $ | 3,757 | $ | (1) | — | $ | 3,757 | $ | 4,124 | $ | (367) | (9 | ) | |||||||||||||||||
| Weighted average effective interest rate |
5.2% | 5.2% | — | — | 5.2% | 5.4% | (0.2)% | (4 | ) | |||||||||||||||||||||||
| Short-term debt obligations |
||||||||||||||||||||||||||||||||
| Weighted average outstanding |
$ | 330 | $ | 1,003 | $ | (673) | (67 | ) | $ | 621 | $ | 1,020 | $ | (399) | (39 | ) | ||||||||||||||||
| Weighted average effective interest rate |
0.4% | 0.4% | — | — | 0.4% | 0.4% | — | — | ||||||||||||||||||||||||
| PotashCorp 2012 Third Quarter Quarterly Report on Form 10-Q | 28 |
Income taxes decreased due to lower income before income taxes. Effective tax rates were as follows:
| Three Months Ended September 30 |
Nine Months Ended September 30 |
|||||||||||||||
| 2012 | 2011 | 2012 | 2011 | |||||||||||||
| Actual effective tax rate on ordinary earnings |
26% | 26% | 26% | 26% | ||||||||||||
| Actual effective tax rate including discrete items |
28% | 25% | 30% | 25% | ||||||||||||
The impairment of our available-for-sale investment in Sinofert is not deductible for tax purposes. Total discrete tax adjustments that impacted the rate in the third quarter of 2012 resulted in an income tax expense of $14 million compared to an income tax recovery of $5 million in the same period last year. Total discrete tax adjustments that impacted the rate in the first nine months of 2012 resulted in an income tax expense of $17 million compared to an income tax recovery of $29 million in the same period last year. In the first nine months of 2012, a tax expense of $17 million (of which $12 million was recorded in the third quarter) was recognized to adjust the 2011 tax provision to the income tax returns filed for that year. Significant items recorded in 2011 were a current tax recovery of $21 million for previously paid withholding taxes in the first quarter, and a current tax recovery of $12 million due to income tax losses in a foreign jurisdiction in the third quarter. For the first nine months of 2012, 54 percent of the effective tax rate on the current year’s ordinary earnings pertained to current income taxes and 46 percent related to deferred income taxes. For the first nine months of 2011, 64 percent of the effective tax rate on the year’s ordinary earnings pertained to current income taxes and 36 percent related to deferred income taxes. The decrease in the current portion was largely due to lower earnings and increased tax depreciation in Canada.
Liquidity and Capital Resources
Cash Requirements
Contractual Obligations and Other Commitments
Our contractual obligations and other commitments detailed on pages 68 and 69 of our 2011 Annual Report summarize certain of our liquidity and capital resource requirements, excluding obligations that have original maturities of less than one year, planned (but not legally committed) capital expenditures or potential share repurchases.
Capital Expenditures
Based on anticipated exchange rates, during 2012 we expect to incur capital expenditures, including capitalized interest, of approximately $1,690 million for opportunity capital, approximately $420 million to sustain operations at existing levels, approximately $140 million for major repairs and maintenance (including plant turnarounds) and approximately $30 million for site improvements.
Page 47 of our 2011 Annual Report outlines key potash construction projects and their expected total cost, as well as the impact of these projects on capacity expansion/debottlenecking and any expected remaining spending on each project still in progress. The most significant of these potash projects(1) on which funds are expected to be spent in 2012, excluding capitalized interest, are outlined in the table below:
| CDN Dollars (millions) | 2012 Forecast | Total Forecast(2) | Started | Expected Completion(3
) (Description) |
Forecasted Remaining Spending (after 2012)(2) |
|||||||||||||
| Allan, Saskatchewan |
$ | 200 | $ | 770 | 2008 | 2012 (general expansion) | $ | 50 | ||||||||||
| Cory, Saskatchewan |
$ | 30 | $ | 1,650 | 2007 | 2012 (general expansion) | $ | 10 | ||||||||||
| Picadilly, New Brunswick |
$ | 360 | $ | 2,180 | 2007 | 2013 (mine shaft and mill) | $ | 490 | ||||||||||
| Rocanville, Saskatchewan |
$ | 660 | $ | 2,800 | 2008 | 2014 (mine shaft and mill) | $ | 680 | ||||||||||
| (1) | The expansion at each of these projects is discussed in the technical report for such project filed on SEDAR in accordance with National Instrument 43-101 Standards of Disclosure for Mineral Projects. |
| (2) | Amounts are based on the most recent forecast amounts approved by the Board of Directors, and are subject to change based on project timelines, cost changes and ongoing project reviews. |
| (3) | Excludes ramp-up time. We expect these projects will be fully ramped up by the end of 2015, provided market conditions warrant. |
| 29 | PotashCorp 2012 Third Quarter Quarterly Report on Form 10-Q |
In 2011, we began the process to restart our anhydrous ammonia plant in Geismar, Louisiana. We are investing an aggregate of approximately $260 million ($160 million in 2012) to increase ammonia production by an estimated 500,000 tonnes. We anticipate this process will be completed in the first quarter of 2013.
We anticipate that all capital spending will be financed by internally generated cash flows supplemented, if and as necessary, by borrowing from existing financing sources.
Sources and Uses of Cash
Cash flows from operating, investing and financing activities, as reflected in the unaudited interim Condensed Consolidated Statements of Cash Flow, are summarized in the following table:
| Three Months Ended September 30 | Nine Months Ended September 30 | |||||||||||||||||||||||||||||||
| Dollars (millions) | 2012 | 2011 | Change | % Change | 2012 | 2011 | Change | % Change | ||||||||||||||||||||||||
| Cash provided by operating activities |
$ | 759 | $ | 865 | $ | (106 | ) | (12 | ) | $ | 2,353 | $ | 2,619 | $ | (266 | ) | (10 | ) | ||||||||||||||
| Cash used in investing activities |
(569 | ) | (598 | ) | 29 | (5 | ) | (1,542 | ) | (1,534 | ) | (8 | ) | 1 | ||||||||||||||||||
| Cash used in financing activities |
(220 | ) | (281 | ) | 61 | (22 | ) | (780 | ) | (1,103 | ) | 323 | (29 | ) | ||||||||||||||||||
The following table presents summarized working capital information:
| Dollars (millions) — except ratio amounts | September 30, 2012 | December 31, 2011 | Change | % Change | ||||||||||||
| Current assets |
$ | 2,571 | $ | 2,408 | $ | 163 | 7 | |||||||||
| Current liabilities |
$ | (1,760 | ) | $ | (2,194 | ) | $ | 434 | (20 | ) | ||||||
| Working capital |
$ | 811 | $ | 214 | $ | 597 | 279 | |||||||||
| Current ratio |
1.46 | 1.10 | 0.36 | 33 | ||||||||||||
| PotashCorp 2012 Third Quarter Quarterly Report on Form 10-Q | 30 |
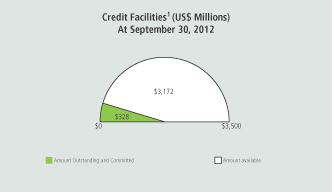
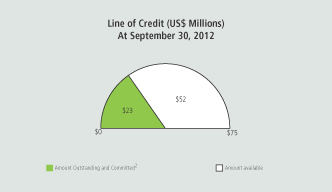
| 31 | PotashCorp 2012 Third Quarter Quarterly Report on Form 10-Q |
Off-Balance Sheet Arrangements
Quarterly Financial Highlights
| Dollars (millions) — | September 30, | June 30, | March 31, | December 31, | September 30, | June 30, | March 31, | December 31, | ||||||||||||||||||||||||
| except per-share amounts | 2012 | 2012 | 2012 | 2011 | 2011 | 2011 | 2011 | 2010 | ||||||||||||||||||||||||
| Sales |
$2,143 | $2,396 | $1,746 | $1,865 | $2,321 | $2,325 | $2,204 | $1,813 | ||||||||||||||||||||||||
| Gross margin |
927 | 1,199 | 698 | 890 | 1,132 | 1,168 | 1,096 | 826 | ||||||||||||||||||||||||
| Net income |
645 | 522 | 491 | 683 | 826 | 840 | 732 | 508 | ||||||||||||||||||||||||
| Net income per share — basic |
0.75 | 0.61 | 0.57 | 0.80 | 0.96 | 0.98 | 0.86 | 0.58 | ||||||||||||||||||||||||
| Net income per share — diluted |
0.74 | 0.60 | 0.56 | 0.78 | 0.94 | 0.96 | 0.84 | 0.56 | ||||||||||||||||||||||||
| PotashCorp 2012 Third Quarter Quarterly Report on Form 10-Q | 32 |
| 33 | PotashCorp 2012 Third Quarter Quarterly Report on Form 10-Q |
| PotashCorp 2012 Third Quarter Quarterly Report on Form 10-Q | 34 |
| 35 | PotashCorp 2012 Third Quarter Quarterly Report on Form 10-Q |
Part II. Other Information
Item 1. Legal Proceedings
For a description of certain other legal and environmental proceedings, see Note 12 to the unaudited interim condensed consolidated financial statements included in Part I of this Quarterly Report on Form 10-Q.
Item 4. Other Information
Mine Safety Disclosures
Safety is the company’s top priority and we are committed to providing a healthy and safe work environment for our employees, contractors and all others at our sites to help meet our company-wide goal of achieving no harm to people.
The operations at the company’s Aurora, Weeping Water and White Springs facilities are subject to the Federal Mine Safety and Health Act of 1977, as amended by the Mine Improvement and New Emergency Response Act of 2006, and the implementing regulations, which impose stringent health and safety standards on numerous aspects of mineral extraction and processing operations, including the training of personnel, operating procedures, operating equipment and other matters. Our Senior Safety Leadership Team is responsible for managing compliance with applicable government regulations, as well as implementing and overseeing the elements of our safety program as outlined in our Safety, Health and Environment Manual.
Section 1503(a) of the Dodd-Frank Wall Street Reform and Consumer Protection Act (Section 1503(a)) requires us to include certain safety information in the periodic reports we file with the United States Securities and Exchange Commission. The information concerning mine safety violations and other regulatory matters required by Section 1503(a) and Item 104 of Regulation S-K is included in Exhibit 95 to this Quarterly Report on Form 10-Q.
Item 6. Exhibits
| (a) | Exhibits |
| Incorporated by Reference | ||||||||||||
| Exhibit Number |
Description of Document | Form | Filing Date/Period End Date |
Exhibit Number (if different) | ||||||||
| 3(a) | Articles of Continuance of the registrant dated May 15, 2002. | 10-Q | 6/30/2002 | |||||||||
| 3(b) | Bylaws of the registrant effective May 15, 2002. | 10-Q | 6/30/2002 | |||||||||
| 4(a) | Term Credit Agreement between The Bank of Nova Scotia and other financial institutions and the registrant dated September 25, 2001. | 10-Q | 9/30/2001 | |||||||||
| 4(b) | Syndicated Term Credit Facility Amending Agreement between The Bank of Nova Scotia and other financial institutions and the registrant dated as of September 23, 2003. | 10-Q | 9/30/2003 | |||||||||
| 4(c) | Syndicated Term Credit Facility Second Amending Agreement between The Bank of Nova Scotia and other financial institutions and the registrant dated as of September 21, 2004. | 8-K | 9/24/2004 | |||||||||
| 4(d) | Syndicated Term Credit Facility Third Amending Agreement between The Bank of Nova Scotia and other financial institutions and the registrant dated as of September 20, 2005. | 8-K | 9/22/2005 | 4(a) | ||||||||
| 4(e) | Syndicated Term Credit Facility Fourth Amending Agreement between The Bank of Nova Scotia and other financial institutions and the registrant dated as of September 27, 2006. | 10-Q | 9/30/2006 | |||||||||
| 4(f) | Syndicated Term Credit Facility Fifth Amending Agreement between the Bank of Nova Scotia and other financial institutions and the registrant dated as of October 19, 2007. | 8-K | 10/22/2007 | 4(a) | ||||||||
| 4(g) | Indenture dated as of February 27, 2003, between the registrant and The Bank of Nova Scotia Trust Company of New York. | 10-K | 12/31/2002 | 4(c) | ||||||||
| 4(h) | Form of Note relating to the registrant’s offering of $250,000,000 principal amount of 4.875% Notes due March 1, 2013. | 8-K | 2/28/2003 | 4 | ||||||||
| 4(i) | Form of Note relating to the registrant’s offering of $500,000,000 principal amount of 5.875% Notes due December 1, 2036. | 8-K | 11/30/2006 | 4(a) | ||||||||
| PotashCorp 2012 Third Quarter Quarterly Report on Form 10-Q | 36 |
| Incorporated by Reference | ||||||||||||
| Exhibit Number |
Description of Document | Form | Filing Date/Period End Date |
Exhibit Number (if different) | ||||||||
| 4(j) | Form of Note relating to the registrant’s offering of $500,000,000 principal amount of 5.25% Notes due May 15, 2014. | 8-K | 5/1/2009 | 4(a) | ||||||||
| 4(k) | Form of Note relating to the registrant’s offering of $500,000,000 principal amount of 6.50% Notes due May 15, 2019. | 8-K | 5/1/2009 | 4(b) | ||||||||
| 4(l) | Form of Note relating to the registrant’s offering of $500,000,000 principal amount of 3.75% Notes due September 30, 2015. | 8-K | 9/25/2009 | 4(a) | ||||||||
| 4(m) | Form of Note relating to the registrant’s offering of $500,000,000 principal amount of 4.875% Notes due March 30, 2020. | 8-K | 9/25/2009 | 4(b) | ||||||||
| 4(n) | Revolving Term Credit Facility Agreement between The Bank of Nova Scotia and other financial institutions and the registrant dated December 11, 2009. | 8-K | 12/15/2009 | 4(a) | ||||||||
| 4(o) | Revolving Term Credit Facility First Amending Agreement between The Bank of Nova Scotia and other financial institutions and the registrant dated as of September 23, 2011. | 8-K | 9/26/2011 | 4(a) | ||||||||
| 4(p) | Form of Note relating to the registrant’s offering of $500,000,000 principal amount of 3.25% Notes due December 1, 2017. | 8-K | 11/29/2010 | 4(a) | ||||||||
| 4(q) | Form of Note relating to the registrant’s offering of $500,000,000 principal amount of 5.625% Notes due December 1, 2040. | 8-K | 11/29/2010 | 4(b) | ||||||||
The registrant hereby undertakes to file with the Securities and Exchange Commission, upon request, copies of any constituent instruments defining the rights of holders of long-term debt of the registrant or its subsidiaries that have not been filed herewith because the amounts represented thereby are less than 10% of the total assets of the registrant and its subsidiaries on a consolidated basis.
| Incorporated by Reference | ||||||||||
| Exhibit Number |
Description of Document | Form | Filing Date/Period End Date |
Exhibit Number (if different) | ||||||
| 10(a) | Sixth Voting Agreement dated April 22, 1978, between Central Canada Potash, Division of Noranda, Inc., Cominco Ltd., International Minerals and Chemical Corporation (Canada) Limited, PCS Sales and Texasgulf Inc. | F-1 (File No. |
9/28/1989 | 10(f) | ||||||
| 10(b) | Canpotex Limited Shareholders Seventh Memorandum of Agreement effective April 21, 1978, between Central Canada Potash, Division of Noranda Inc., Cominco Ltd., International Minerals and Chemical Corporation (Canada) Limited, PCS Sales, Texasgulf Inc. and Canpotex Limited as amended by Canpotex S&P amending agreement dated November 4, 1987. | F-1 (File No. |
9/28/1989 | 10(g) | ||||||
| 10(c) | Producer Agreement dated April 21, 1978, between Canpotex Limited and PCS Sales. | F-1 (File No. |
9/28/1989 | 10(h) | ||||||
| 10(d) | Canpotex/PCS Amending Agreement, dated as of October 1, 1992. | 10-K | 12/31/1995 | 10(f) | ||||||
| 10(e) | Canpotex PCA Collateral Withdrawing/PCS Amending Agreement, dated as of October 7, 1993. | 10-K | 12/31/1995 | 10(g) | ||||||
| 10(f) | Canpotex Producer Agreement amending agreement dated as of July 1, 2002. | 10-Q | 6/30/2004 | 10(g) | ||||||
| 10(g) | Esterhazy Restated Mining and Processing Agreement dated January 31, 1978, between International Minerals & Chemical Corporation (Canada) Limited and the registrant’s predecessor. | F-1 (File No. |
9/28/1989 | 10(e) | ||||||
| 10(h) | Agreement dated December 21, 1990, between International Minerals & Chemical Corporation (Canada) Limited and the registrant, amending the Esterhazy Restated Mining and Processing Agreement dated January 31, 1978. | 10-K | 12/31/1990 | 10(p) | ||||||
| 10(i) | Agreement effective August 27, 1998, between International Minerals & Chemical (Canada) Global Limited and the registrant, amending the Esterhazy Restated Mining and Processing Agreement dated January 31, 1978 (as amended). | 10-K | 12/31/1998 | 10(l) | ||||||
| 37 | PotashCorp 2012 Third Quarter Quarterly Report on Form 10-Q |
| Incorporated by Reference | ||||||||||
| Exhibit Number |
Description of Document | Form | Filing Date/Period End Date |
Exhibit Number (if different) | ||||||
| 10(j) | Agreement effective August 31, 1998, among International Minerals & Chemical (Canada) Global Limited, International Minerals & Chemical (Canada) Limited Partnership and the registrant assigning the interest in the Esterhazy Restated Mining and Processing Agreement dated January 31, 1978 (as amended) held by International Minerals & Chemical (Canada) Global Limited to International Minerals & Chemical (Canada) Limited Partnership. | 10-K |
12/31/1998 | 10(m) | ||||||
| 10(k) | Potash Corporation of Saskatchewan Inc. Stock Option Plan — Directors, as amended. | 10-K | 12/31/2006 | 10(l) | ||||||
| 10(l) | Potash Corporation of Saskatchewan Inc. Stock Option Plan — Officers and Employees, as amended. | 10-K | 12/31/2006 | 10(m) | ||||||
| 10(m) | Short-Term Incentive Plan of the registrant effective January 1, 2000, as amended. | 8-K | 3/13/2012 | 10(a) | ||||||
| 10(n) | Resolution and Forms of Agreement for Supplemental Executive Retirement Income Plan, for officers and key employees of the registrant. | 10-K | 12/31/1995 | 10(o) | ||||||
| 10(o) | Amending Resolution and revised forms of agreement regarding Supplemental Retirement Income Plan of the registrant. | 10-Q | 6/30/1996 | 10(x) | ||||||
| 10(p) | Amended and restated Supplemental Executive Retirement Income Plan of the registrant and text of amendment to existing supplemental income plan agreements. | 10-Q | 9/30/2000 | 10(mm) | ||||||
| 10(q) | Amendment, dated February 23, 2009, to the amended and restated Supplemental Executive Retirement Income Plan. | 10-K | 12/31/2008 | 10(r) | ||||||
| 10(r) | Amendment, dated December 29, 2010, to the amended and restated Supplemental Executive Retirement Income Plan. | 10-K | 12/31/2010 | |||||||
| 10(s) | Form of Letter of amendment to existing supplemental income plan agreements of the registrant. | 10-K | 12/31/2002 | 10(cc) | ||||||
| 10(t) | Amended and restated agreement dated February 20, 2007, between the registrant and William J. Doyle concerning the Supplemental Executive Retirement Income Plan. | 10-K | 12/31/2006 | 10(s) | ||||||
| 10(u) | Amendment, dated December 24, 2008, to the amended and restated agreement, dated February 20, 2007, between the registrant and William J. Doyle concerning the Supplemental Executive Retirement Income Plan. | 10-K | 12/31/2008 | |||||||
| 10(v) | Amendment, dated February 23, 2009, to the amended and restated agreement, dated February 20, 2007, between the registrant and William J. Doyle concerning the Supplemental Executive Retirement Income Plan. | 10-K | 12/31/2008 | |||||||
| 10(w) | Amendment, dated February 23, 2009, to the amended and restated agreement, dated August 2, 1996, between the registrant and Wayne R. Brownlee concerning the Supplemental Executive Retirement Income Plan. | 10-K | 12/31/2008 | |||||||
| 10(x) | Amendment, dated December 29, 2010, to the amended and restated agreement, dated February 20, 2007, between the registrant and William J. Doyle concerning the Supplemental Executive Retirement Income Plan. | 10-K | 12/31/2010 | 10(y) | ||||||
| 10(y) | Amendment, dated December 29, 2010, to the amended and restated agreement, dated August 2, 1996, between the registrant and Wayne R. Brownlee concerning the Supplemental Executive Retirement Income Plan. | 10-K | 12/31/2010 | 10(z) | ||||||
| 10(z) | Supplemental Retirement Agreement dated December 24, 2008, between the registrant and Stephen F. Dowdle. | 10-K | 12/31/2011 | 10(bb) | ||||||
| 10(aa) | Supplemental Retirement Benefits Plan for U.S. Executives dated effective January 1, 1999. | 10-Q | 6/30/2002 | 10(aa) | ||||||
| 10(bb) | Amendment No. 1, dated December 24, 2008, to the Supplemental Retirement Plan for U.S. Executives. | 10-K | 12/31/2008 | 10(z) | ||||||
| PotashCorp 2012 Third Quarter Quarterly Report on Form 10-Q | 38 |
| Incorporated by Reference | ||||||||||
| Exhibit Number |
Description of Document | Form | Filing Date/Period End Date |
Exhibit Number (if different) | ||||||
| 10(cc) | Amendment No. 2, dated February 23, 2009, to the Supplemental Retirement Plan for U.S. Executives. | 10-K |
12/31/2008 | 10(aa) | ||||||
| 10(dd) | Forms of Agreement dated December 30, 1994, between the registrant and certain officers of the registrant. | 10-K | 12/31/1995 | 10(p) | ||||||
| 10(ee) | Amendment, dated December 31, 2010, to the Agreement, dated December 30, 1994 between the registrant and William J. Doyle. | 10-K | 12/31/2010 | 10(ee) | ||||||
| 10(ff) | Form of Agreement of Indemnification dated August 8, 1995, between the registrant and certain officers and directors of the registrant. | 10-K | 12/31/1995 | 10(q) | ||||||
| 10(gg) | Resolution and Form of Agreement of Indemnification dated January 24, 2001. | 10-K | 12/31/2000 | |||||||
| 10(hh) | Resolution and Form of Agreement of Indemnification — July 21, 2004. | 10-Q | 6/30/2004 | 10(ii) | ||||||
| 10(ii) | Chief Executive Officer Medical and Dental Benefits. | 10-K | 12/31/2010 | 10(jj) | ||||||
| 10(jj) | Deferred Share Unit Plan for Non-Employee Directors, as amended. | 10-Q | 3/31/2012 | |||||||
| 10(kk) | U.S. Participant Addendum No. 1 to the Deferred Share Unit Plan for Non-Employee Directors. | 10-K | 12/31/2008 | 10(jj) | ||||||
| 10(ll) | Potash Corporation of Saskatchewan Inc. 2005 Performance Option Plan and Form of Option Agreement, as amended. | 10-K | 12/31/2006 | 10(cc) | ||||||
| 10(mm) | Potash Corporation of Saskatchewan Inc. 2006 Performance Option Plan and Form of Option Agreement, as amended. | 10-K | 12/31/2006 | 10(dd) | ||||||
| 10(nn) | Potash Corporation of Saskatchewan Inc. 2007 Performance Option Plan and Form of Option Agreement. | 10-Q | 3/31/2007 | 10(ee) | ||||||
| 10(oo) | Potash Corporation of Saskatchewan Inc. 2008 Performance Option Plan and Form of Option Agreement. | 10-Q | 3/31/2008 | 10(ff) | ||||||
| 10(pp) | Potash Corporation of Saskatchewan Inc. 2009 Performance Option Plan and Form of Option Agreement. | 10-Q | 3/31/2009 | 10(mm) | ||||||
| 10(qq) | Potash Corporation of Saskatchewan Inc. 2010 Performance Option Plan and Form of Option Agreement. | 8-K | 5/7/2010 | 10.1 | ||||||
| 10(rr) | Potash Corporation of Saskatchewan Inc. 2011 Performance Option Plan and Form of Option Agreement. | 8-K | 5/13/2011 | 10(a) | ||||||
| 10(ss) | Potash Corporation of Saskatchewan Inc. 2012 Performance Option Plan and Form of Option Agreement. | 8-K | 5/18/2012 | 10(a) | ||||||
| 10(tt) | Medium-Term Incentive Plan of the registrant effective January 1, 2012. | 10-K | 12/31/2011 | 10(uu) | ||||||
| 11 | Statement re Computation of Per Share Earnings. | |||||||||
| 31(a) | Certification pursuant to Section 302 of the Sarbanes-Oxley Act of 2002. | |||||||||
| 31(b) | Certification pursuant to Section 302 of the Sarbanes-Oxley Act of 2002. | |||||||||
| 32 | Certification pursuant to Section 906 of the Sarbanes-Oxley Act of 2002. | |||||||||
| 95 | Information concerning mine safety violations or other regulatory matters required by Section 1503(a) of the Dodd-Frank Wall Street Reform and Consumer Protection Act. | |||||||||
| 39 | PotashCorp 2012 Third Quarter Quarterly Report on Form 10-Q |
Signatures
Pursuant to the requirements of the Securities Exchange Act of 1934, the registrant has duly caused this report to be signed on its behalf by the undersigned, thereunto duly authorized.
| POTASH CORPORATION OF SASKATCHEWAN INC. | ||||||
| October 31, 2012 | By: | /s/ JOSEPH PODWIKA | ||||
| Joseph Podwika | ||||||
| Senior Vice President, General Counsel and Secretary | ||||||
| October 31, 2012 | By: | /s/ WAYNE R. BROWNLEE | ||||
| Wayne R. Brownlee | ||||||
| Executive Vice President, Treasurer and Chief Financial Officer (Principal Financial and Accounting Officer) | ||||||
| PotashCorp 2012 Third Quarter Quarterly Report on Form 10-Q | 40 |
EXHIBIT INDEX
| Incorporated by Reference | ||||||||||||
| Exhibit Number |
Description of Document | Form | Filing Date/Period End Date |
Exhibit Number (if different) | ||||||||
| 3(a) | Articles of Continuance of the registrant dated May 15, 2002. | 10-Q | 6/30/2002 | |||||||||
| 3(b) | Bylaws of the registrant effective May 15, 2002. | 10-Q | 6/30/2002 | |||||||||
| 4(a) | Term Credit Agreement between The Bank of Nova Scotia and other financial institutions and the registrant dated September 25, 2001. | 10-Q | 9/30/2001 | |||||||||
| 4(b) | Syndicated Term Credit Facility Amending Agreement between The Bank of Nova Scotia and other financial institutions and the registrant dated as of September 23, 2003. | 10-Q | 9/30/2003 | |||||||||
| 4(c) | Syndicated Term Credit Facility Second Amending Agreement between The Bank of Nova Scotia and other financial institutions and the registrant dated as of September 21, 2004. | 8-K | 9/24/2004 | |||||||||
| 4(d) | Syndicated Term Credit Facility Third Amending Agreement between The Bank of Nova Scotia and other financial institutions and the registrant dated as of September 20, 2005. | 8-K | 9/22/2005 | 4(a) | ||||||||
| 4(e) | Syndicated Term Credit Facility Fourth Amending Agreement between The Bank of Nova Scotia and other financial institutions and the registrant dated as of September 27, 2006. | 10-Q | 9/30/2006 | |||||||||
| 4(f) | Syndicated Term Credit Facility Fifth Amending Agreement between the Bank of Nova Scotia and other financial institutions and the registrant dated as of October 19, 2007. | 8-K | 10/22/2007 | 4(a) | ||||||||
| 4(g) | Indenture dated as of February 27, 2003, between the registrant and The Bank of Nova Scotia Trust Company of New York. | 10-K | 12/31/2002 | 4(c) | ||||||||
| 4(h) | Form of Note relating to the registrant’s offering of $250,000,000 principal amount of 4.875% Notes due March 1, 2013. | 8-K | 2/28/2003 | 4 | ||||||||
| 4(i) | Form of Note relating to the registrant’s offering of $500,000,000 principal amount of 5.875% Notes due December 1, 2036. | 8-K | 11/30/2006 | 4(a) | ||||||||
| 4(j) | Form of Note relating to the registrant’s offering of $500,000,000 principal amount of 5.25% Notes due May 15, 2014. | 8-K | 5/1/2009 | 4(a) | ||||||||
| 4(k) | Form of Note relating to the registrant’s offering of $500,000,000 principal amount of 6.50% Notes due May 15, 2019. | 8-K | 5/1/2009 | 4(b) | ||||||||
| 4(l) | Form of Note relating to the registrant’s offering of $500,000,000 principal amount of 3.75% Notes due September 30, 2015. | 8-K | 9/25/2009 | 4(a) | ||||||||
| 4(m) | Form of Note relating to the registrant’s offering of $500,000,000 principal amount of 4.875% Notes due March 30, 2020. | 8-K | 9/25/2009 | 4(b) | ||||||||
| 4(n) | Revolving Term Credit Facility Agreement between The Bank of Nova Scotia and other financial institutions and the registrant dated December 11, 2009. | 8-K | 12/15/2009 | 4(a) | ||||||||
| 4(o) | Revolving Term Credit Facility First Amending Agreement between The Bank of Nova Scotia and other financial institutions and the registrant dated as of September 23, 2011. | 8-K | 9/26/2011 | 4(a) | ||||||||
| 4(p) | Form of Note relating to the registrant’s offering of $500,000,000 principal amount of 3.25% Notes due December 1, 2017. | 8-K | 11/29/2010 | 4(a) | ||||||||
| 4(q) | Form of Note relating to the registrant’s offering of $500,000,000 principal amount of 5.625% Notes due December 1, 2040. | 8-K | 11/29/2010 | 4(b) | ||||||||
The registrant hereby undertakes to file with the Securities and Exchange Commission, upon request, copies of any constituent instruments defining the rights of holders of long-term debt of the registrant or its subsidiaries that have not been filed herewith because the amounts represented thereby are less than 10% of the total assets of the registrant and its subsidiaries on a consolidated basis.
| Incorporated by Reference | ||||||||||
| Exhibit Number |
Description of Document | Form | Filing Date/Period End Date |
Exhibit Number (if different) | ||||||
| 10(a) | Sixth Voting Agreement dated April 22, 1978, between Central Canada Potash, Division of Noranda, Inc., Cominco Ltd., International Minerals and Chemical Corporation (Canada) Limited, PCS Sales and Texasgulf Inc. | F-1 (File No. |
9/28/1989 | 10(f) | ||||||
| 10(b) | Canpotex Limited Shareholders Seventh Memorandum of Agreement effective April 21, 1978, between Central Canada Potash, Division of Noranda Inc., Cominco Ltd., International Minerals and Chemical Corporation (Canada) Limited, PCS Sales, Texasgulf Inc. and Canpotex Limited as amended by Canpotex S&P amending agreement dated November 4, 1987. | F-1 (File No. |
9/28/1989 | 10(g) | ||||||
| 10(c) | Producer Agreement dated April 21, 1978, between Canpotex Limited and PCS Sales. | F-1 (File No. |
9/28/1989 | 10(h) | ||||||
| 10(d) | Canpotex/PCS Amending Agreement, dated as of October 1, 1992. | 10-K | 12/31/1995 | 10(f) | ||||||
| 10(e) | Canpotex PCA Collateral Withdrawing/PCS Amending Agreement, dated as of October 7, 1993. | 10-K | 12/31/1995 | 10(g) | ||||||
| 10(f) | Canpotex Producer Agreement amending agreement dated as of July 1, 2002. | 10-Q | 6/30/2004 | 10(g) | ||||||
| 10(g) | Esterhazy Restated Mining and Processing Agreement dated January 31, 1978, between International Minerals & Chemical Corporation (Canada) Limited and the registrant’s predecessor. | F-1 (File No. |
9/28/1989 | 10(e) | ||||||
| 10(h) | Agreement dated December 21, 1990, between International Minerals & Chemical Corporation (Canada) Limited and the registrant, amending the Esterhazy Restated Mining and Processing Agreement dated January 31, 1978. | 10-K | 12/31/1990 | 10(p) | ||||||
| 10(i) | Agreement effective August 27, 1998, between International Minerals & Chemical (Canada) Global Limited and the registrant, amending the Esterhazy Restated Mining and Processing Agreement dated January 31, 1978 (as amended). | 10-K | 12/31/1998 | 10(l) | ||||||
| 10(j) | Agreement effective August 31, 1998, among International Minerals & Chemical (Canada) Global Limited, International Minerals & Chemical (Canada) Limited Partnership and the registrant assigning the interest in the Esterhazy Restated Mining and Processing Agreement dated January 31, 1978 (as amended) held by International Minerals & Chemical (Canada) Global Limited to International Minerals & Chemical (Canada) Limited Partnership. | 10-K |
12/31/1998 | 10(m) | ||||||
| 10(k) | Potash Corporation of Saskatchewan Inc. Stock Option Plan — Directors, as amended. | 10-K | 12/31/2006 | 10(l) | ||||||
| 10(l) | Potash Corporation of Saskatchewan Inc. Stock Option Plan — Officers and Employees, as amended. | 10-K | 12/31/2006 | 10(m) | ||||||
| 10(m) | Short-Term Incentive Plan of the registrant effective January 1, 2000, as amended. | 8-K | 3/13/2012 | 10(a) | ||||||
| 10(n) | Resolution and Forms of Agreement for Supplemental Executive Retirement Income Plan, for officers and key employees of the registrant. | 10-K | 12/31/1995 | 10(o) | ||||||
| 10(o) | Amending Resolution and revised forms of agreement regarding Supplemental Retirement Income Plan of the registrant. | 10-Q | 6/30/1996 | 10(x) | ||||||
| 10(p) | Amended and restated Supplemental Executive Retirement Income Plan of the registrant and text of amendment to existing supplemental income plan agreements. | 10-Q | 9/30/2000 | 10(mm) | ||||||
| 10(q) | Amendment, dated February 23, 2009, to the amended and restated Supplemental Executive Retirement Income Plan. | 10-K | 12/31/2008 | 10(r) | ||||||
| Incorporated by Reference | ||||||||||
| Exhibit Number |
Description of Document | Form | Filing Date/Period End Date |
Exhibit Number (if different) | ||||||
| 10(r) | Amendment, dated December 29, 2010, to the amended and restated Supplemental Executive Retirement Income Plan. | 10-K | 12/31/2010 | |||||||
| 10(s) | Form of Letter of amendment to existing supplemental income plan agreements of the registrant. | 10-K | 12/31/2002 | 10(cc) | ||||||
| 10(t) | Amended and restated agreement dated February 20, 2007, between the registrant and William J. Doyle concerning the Supplemental Executive Retirement Income Plan. | 10-K | 12/31/2006 | 10(s) | ||||||
| 10(u) | Amendment, dated December 24, 2008, to the amended and restated agreement, dated February 20, 2007, between the registrant and William J. Doyle concerning the Supplemental Executive Retirement Income Plan. | 10-K | 12/31/2008 | |||||||
| 10(v) | Amendment, dated February 23, 2009, to the amended and restated agreement, dated February 20, 2007, between the registrant and William J. Doyle concerning the Supplemental Executive Retirement Income Plan. | 10-K | 12/31/2008 | |||||||
| 10(w) | Amendment, dated February 23, 2009, to the amended and restated agreement, dated August 2, 1996, between the registrant and Wayne R. Brownlee concerning the Supplemental Executive Retirement Income Plan. | 10-K | 12/31/2008 | |||||||
| 10(x) | Amendment, dated December 29, 2010, to the amended and restated agreement, dated February 20, 2007, between the registrant and William J. Doyle concerning the Supplemental Executive Retirement Income Plan. | 10-K | 12/31/2010 | 10(y) | ||||||
| 10(y) | Amendment, dated December 29, 2010, to the amended and restated agreement, dated August 2, 1996, between the registrant and Wayne R. Brownlee concerning the Supplemental Executive Retirement Income Plan. | 10-K | 12/31/2010 | 10(z) | ||||||
| 10(z) | Supplemental Retirement Agreement dated December 24, 2008, between the registrant and Stephen F. Dowdle. | 10-K | 12/31/2011 | 10(bb) | ||||||
| 10(aa) | Supplemental Retirement Benefits Plan for U.S. Executives dated effective January 1, 1999. | 10-Q | 6/30/2002 | 10(aa) | ||||||
| 10(bb) | Amendment No. 1, dated December 24, 2008, to the Supplemental Retirement Plan for U.S. Executives. | 10-K | 12/31/2008 | 10(z) | ||||||
| 10(cc) | Amendment No. 2, dated February 23, 2009, to the Supplemental Retirement Plan for U.S. Executives. | 10-K |
12/31/2008 | 10(aa) | ||||||
| 10(dd) | Forms of Agreement dated December 30, 1994, between the registrant and certain officers of the registrant. | 10-K | 12/31/1995 | 10(p) | ||||||
| 10(ee) | Amendment, dated December 31, 2010, to the Agreement, dated December 30, 1994 between the registrant and William J. Doyle. | 10-K | 12/31/2010 | 10(ee) | ||||||
| 10(ff) | Form of Agreement of Indemnification dated August 8, 1995, between the registrant and certain officers and directors of the registrant. | 10-K | 12/31/1995 | 10(q) | ||||||
| 10(gg) | Resolution and Form of Agreement of Indemnification dated January 24, 2001. | 10-K | 12/31/2000 | |||||||
| 10(hh) | Resolution and Form of Agreement of Indemnification — July 21, 2004. | 10-Q | 6/30/2004 | 10(ii) | ||||||
| 10(ii) | Chief Executive Officer Medical and Dental Benefits. | 10-K | 12/31/2010 | 10(jj) | ||||||
| 10(jj) | Deferred Share Unit Plan for Non-Employee Directors, as amended. | 10-Q | 3/31/2012 | |||||||
| 10(kk) | U.S. Participant Addendum No. 1 to the Deferred Share Unit Plan for Non-Employee Directors. | 10-K | 12/31/2008 | 10(jj) | ||||||
| 10(ll) | Potash Corporation of Saskatchewan Inc. 2005 Performance Option Plan and Form of Option Agreement, as amended. | 10-K | 12/31/2006 | 10(cc) | ||||||
| 10(mm) | Potash Corporation of Saskatchewan Inc. 2006 Performance Option Plan and Form of Option Agreement, as amended. | 10-K | 12/31/2006 | 10(dd) | ||||||
| Incorporated by Reference | ||||||||||
| Exhibit Number |
Description of Document | Form | Filing Date/Period End Date |
Exhibit Number (if different) | ||||||
| 10(nn) | Potash Corporation of Saskatchewan Inc. 2007 Performance Option Plan and Form of Option Agreement. | 10-Q | 3/31/2007 | 10(ee) | ||||||
| 10(oo) | Potash Corporation of Saskatchewan Inc. 2008 Performance Option Plan and Form of Option Agreement. | 10-Q | 3/31/2008 | 10(ff) | ||||||
| 10(pp) | Potash Corporation of Saskatchewan Inc. 2009 Performance Option Plan and Form of Option Agreement. | 10-Q | 3/31/2009 | 10(mm) | ||||||
| 10(qq) | Potash Corporation of Saskatchewan Inc. 2010 Performance Option Plan and Form of Option Agreement. | 8-K | 5/7/2010 | 10.1 | ||||||
| 10(rr) | Potash Corporation of Saskatchewan Inc. 2011 Performance Option Plan and Form of Option Agreement. | 8-K | 5/13/2011 | 10(a) | ||||||
| 10(ss) | Potash Corporation of Saskatchewan Inc. 2012 Performance Option Plan and Form of Option Agreement. | 8-K | 5/18/2012 | 10(a) | ||||||
| 10(tt) | Medium-Term Incentive Plan of the registrant effective January 1, 2012. | 10-K | 12/31/2011 | 10(uu) | ||||||
| 11 | Statement re Computation of Per Share Earnings. | |||||||||
| 31(a) | Certification pursuant to Section 302 of the Sarbanes-Oxley Act of 2002. | |||||||||
| 31(b) | Certification pursuant to Section 302 of the Sarbanes-Oxley Act of 2002. | |||||||||
| 32 | Certification pursuant to Section 906 of the Sarbanes-Oxley Act of 2002. | |||||||||
| 95 | Information concerning mine safety violations or other regulatory matters required by Section 1503(a) of the Dodd-Frank Wall Street Reform and Consumer Protection Act. | |||||||||