Attached files
| file | filename |
|---|---|
| 8-K - 8-K - CONSUMERS ENERGY CO | d431025d8k.htm |
Exhibit 99.1
Hilliard Lyons Meeting
October 31, 2012
Foote Hydro 1918
Zeeland 2007
Lake Winds 2012
This presentation is made as of the date hereof and contains “forward-looking statements” as defined in Rule 3b-6 of the Securities Exchange Act of 1934, as amended, Rule 175 of the Securities Act of 1933, as amended, and relevant legal decisions. The forward-looking statements are subject to risks and uncertainties. They should be read in conjunction with “FORWARD-LOOKING STATEMENTS AND INFORMATION” and “RISK FACTORS” sections of CMS Energy’s and Consumers Energy’s Form 10-K for the year ended December 31 and as updated in subsequent 10-Qs. CMS Energy’s and Consumers Energy’s “FORWARD-LOOKING STATEMENTS AND INFORMATION” and “RISK FACTORS” sections are incorporated herein by reference and discuss important factors that could cause CMS Energy’s and Consumers Energy’s results to differ materially from those anticipated in such statements. CMS Energy and Consumers Energy undertake no obligation to update any of the information presented herein to reflect facts, events or circumstances after the date hereof.
The presentation also includes non-GAAP measures when describing CMS Energy’s results of operations and financial performance. A reconciliation of each of these measures to the most directly comparable GAAP measure is included in the appendix and posted on our website at www.cmsenergy.com.
CMS Energy provides financial results on both a reported (Generally Accepted Accounting Principles) and adjusted (non-GAAP) basis. Management views adjusted earnings as a key measure of the company’s present operating financial performance, unaffected by discontinued operations, asset sales, impairments, regulatory items from prior years, or other items. Certain of these items have the potential to impact, favorably or unfavorably, the company’s reported earnings in 2012. The company is not able to estimate the impact of these matters and is not providing reported earnings guidance.
| 2 |
|
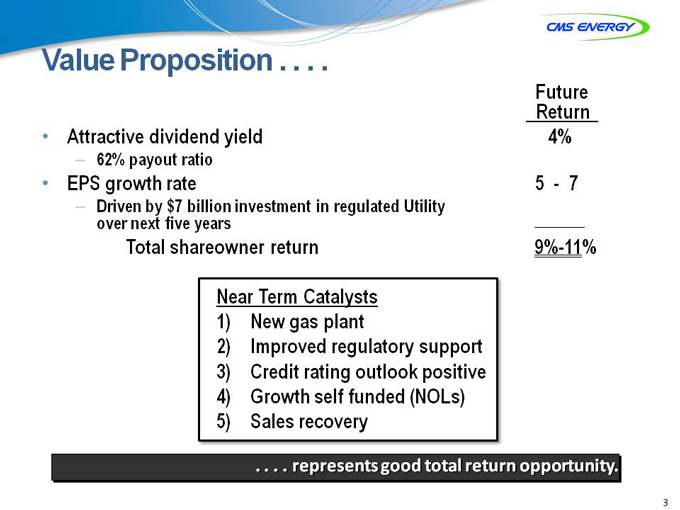
Value Proposition....
Future
Return
• Attractive dividend yield 4%
– 62% payout ratio
• EPS growth rate 5—7
– Driven by $7 billion investment in regulated Utility
over next five years
Total shareowner return 9%-11%
Near Term Catalysts
1) New gas plant
2) Improved regulatory support
3) Credit rating outlook positive
4) Growth self funded (NOLs)
5) Sales recovery
. . . . represents good total return opportunity.
| 3 |
|
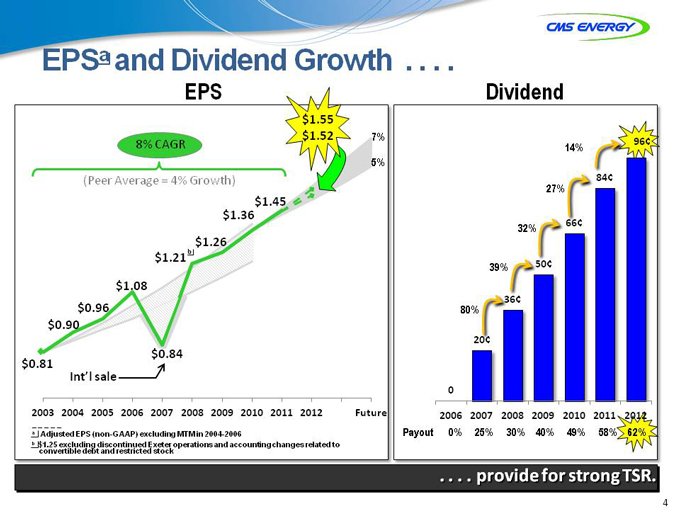
EPSa and Dividend Growth . . . .
EPS
8% CAGR
(Peer Average = 4% Growth)
$1.55 $1.52
$0.81
Int’l sale
$0.84
$0.90
$0.96
$1.08
b
$1.21
$1.26
$1.36
$1.45
5%
7%
2003 2004 2005 2006 2007 2008 2009 2010 2011 2012 Future
a Adjusted EPS (non-GAAP) excluding MTM in 2004-2006
b $1.25 excluding discontinued Exeter operations and accounting changes related to convertible debt and restricted stock
Dividend
14%
27%
32%
39%
80%
20¢
36¢
50¢
66¢
84¢
96¢
0
2006 2007 2008 2009 2010 2011 2012
Payout 0% 25% 30% 40% 49% 58% 62%
. . . . provide for strong TSR.
4
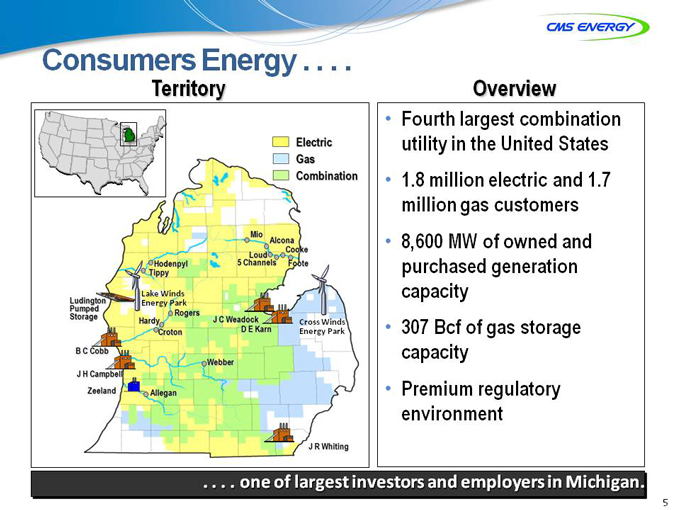
Consumers Energy . . . .
Territory
Electric
Gas
Combination
Overview
Fourth largest combination utility in the United States
1.8 million electric and 1.7 million gas customers
8,600 MW of owned and purchased generation capacity
307 Bcf of gas storage capacity
Premium regulatory environment
. . . . one of largest investors and employers in Michigan.
5
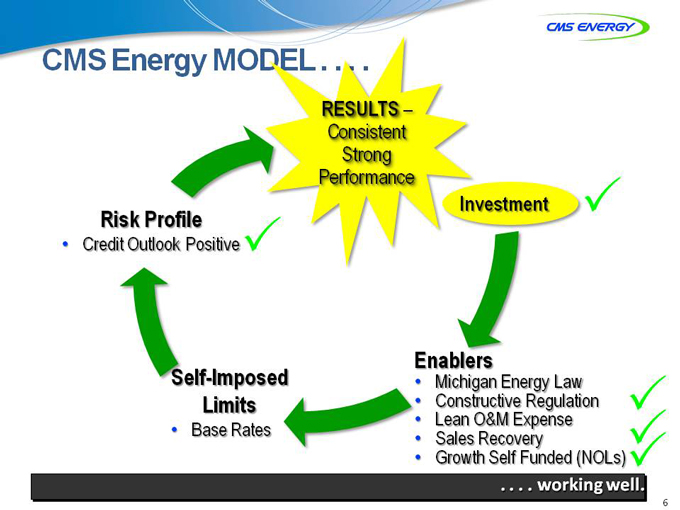
CMS Energy MODEL . . . .
RESULTS –
Consistent
Strong Performance
Risk Profile
Credit Outlook Positive
Investment
Self-Imposed
Limits
•
Base Rates
Enablers
•
Michigan Energy Law
•
Constructive Regulation
•
Lean O&M Expense
•
Sales Recovery
•
Growth Self Funded (NOLs)
. . . . working well.
6
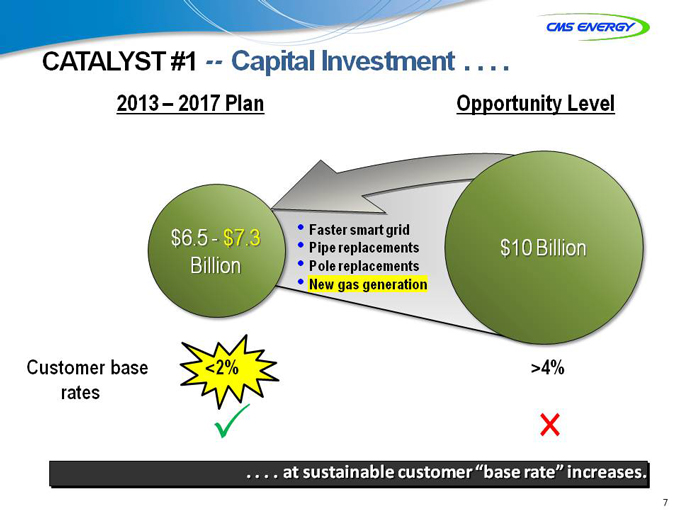
CATALYST #1 — Capital Investment . . . .
2013 – 2017 Plan
Opportunity Level
$6.5—$7.3 Billion
Faster smart grid
Pipe replacements
Pole replacements
New gas generation
$10 Billion
Customer base rates
<2%
>4%
. . . . at sustainable customer “base rate” increases.
7
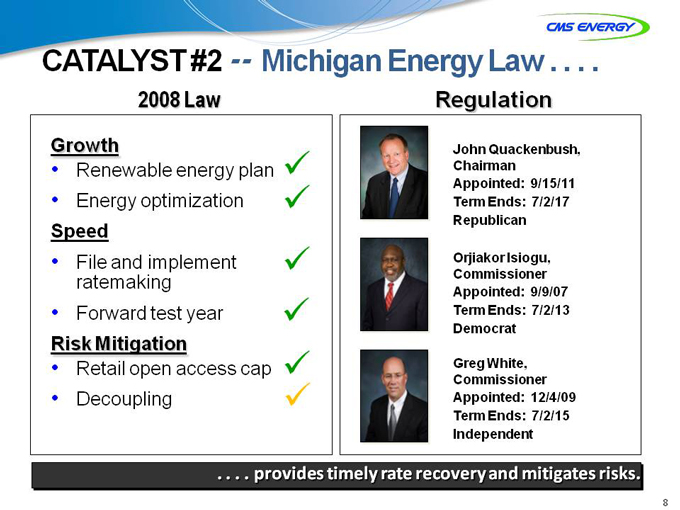
CATALYST #2 — Michigan Energy Law . . . .
2008 Law
Regulation
Growth
• Renewable energy plan
•
Energy optimization
Speed
•
File and implement
ratemaking
•
Forward test year
Risk Mitigation
•
Retail open access cap
•
Decoupling
John Quackenbush, Chairman Appointed: 9/15/11 Term Ends: 7/2/17 Republican
Orjiakor Isiogu, Commissioner Appointed: 9/9/07 Term Ends: 7/2/13 Democrat
Greg White, Commissioner Appointed: 12/4/09 Term Ends: 7/2/15 Independent
. . . . provides timely rate recovery and mitigates risks.
| 8 |
|
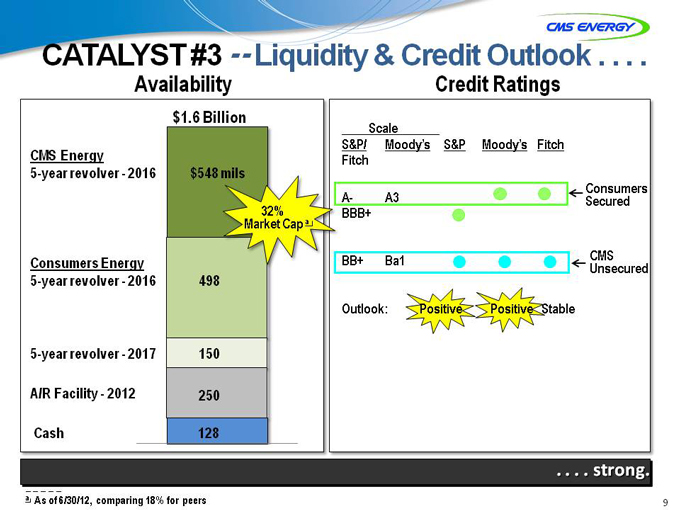
CATALYST #3 — Liquidity & Credit Outlook . . . .
Availability Credit Ratings
CMS Energy
5-year revolver—2016
Consumers Energy 5-year revolver—2016
5-year revolver—2017 A/R Facility—2012 Cash
$548 mils
$1.6 Billion
498
150
250
128
32% Market Cap a
Scale
S&P/ Moody’s S&P Moody’s Fitch
Fitch
A- A3
BBB+
Consumers Secured
BB+ Ba1
CMS Unsecured
Outlook:
Positive Positive Stable
. . . . strong.
a As of 6/30/12, comparing 18% for peers
9
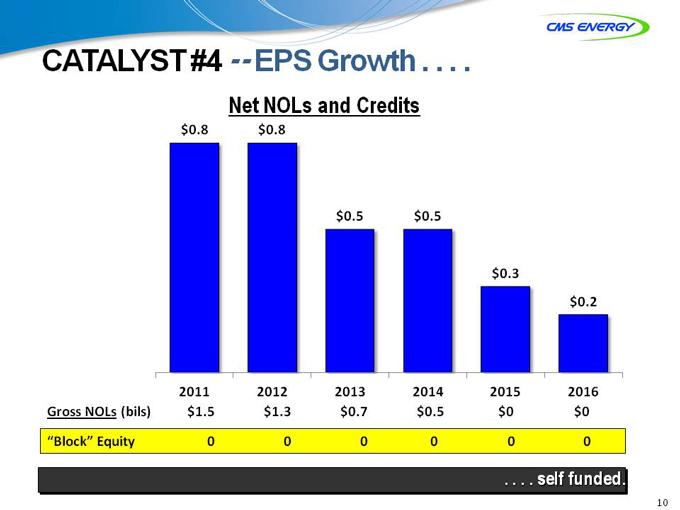
CATALYST #4 — EPS Growth . . . .
Net NOLs and Credits
$0.8 $0.8
$0.5 $0.5
$0.3
$0.2
2011 2012 2013 2014 2015 2016 Gross NOLs (bils) $1.5 $1.3 $0.7 $0.5 $0 $0
“Block” Equity 0 0 0 0 0 0
. . . . self funded.
10
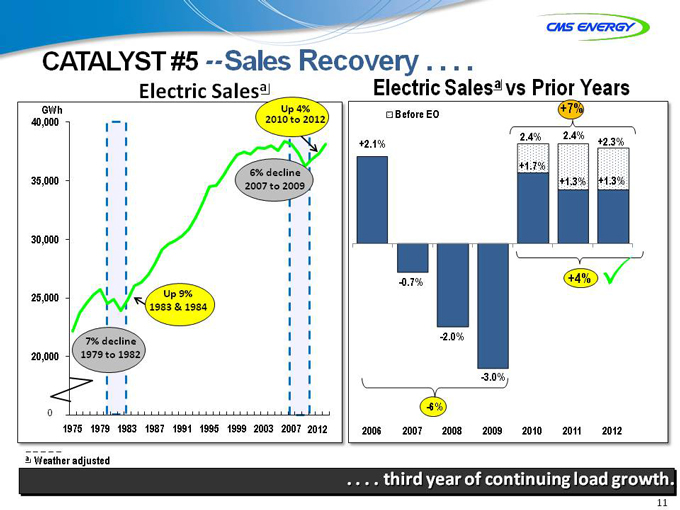
CATALYST #5 — Sales Recovery . . . .
Electric Salesa Electric Salesa vs Prior Years
GWh 40,000
35,000 30,000 25,000 20,000
0
7% decline 1979 to 1982
Up 9% 1983 & 1984
6% decline 2007 to 2009
Up 5% 2010 to 2012
1975 1979 1983 1987 1991 1995 1999 2003 2007 2012
+2.1%
Before EO
+7%
2.4% 2.4%
+2.3%
+1.7%
+1.3% +1.3%
+4%
-0.7%
-2.0%
-3.0%
-6%
2006 2007 2008 2009 2010 2011 2012
Weather adjusted
. . . . thirhird year of continuing load growth.
11
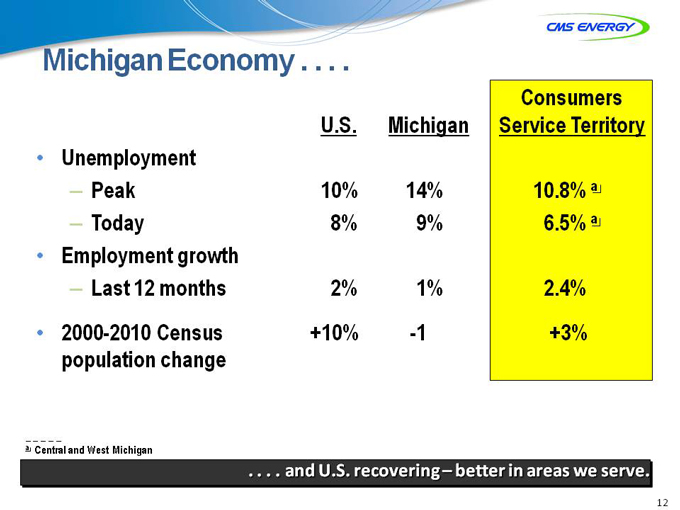
Michigan Economy . . . .
Consumers
U.S. Michigan Service Territory
• Unemployment
– Peak 10% 14% 10.8% a
– Today 8% 9% 6.5% a
• Employment growth
– Last 12 months 2% 1% 2.4%
• 2000-2010 Census +10% -1 +3%
population change
Central and West Michigan
. . . . and U.S. recovering – better in areas we serve.
12
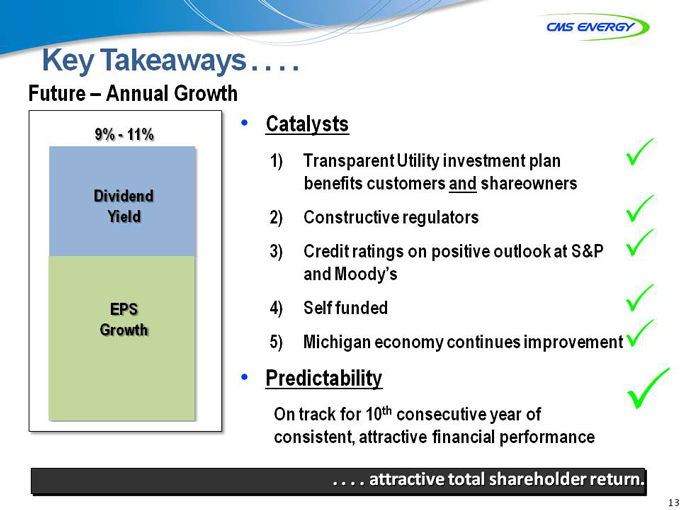
Key Takeaways . . . .
Future – Annual Growth
9%—11%
Dividend Yield
EPS Growth
Catalysts
1) Transparent Utility investment plan benefits customers and shareowners
2) Constructive regulators
3) Credit ratings on positive outlook at S&P and Moody’s
4) Self funded
5) Michigan economy continues improvement
Predictability
On track for 10th consecutive year of consistent, attractive financial performance
. . . . attractive total shareholder return.
13

APPENDIX
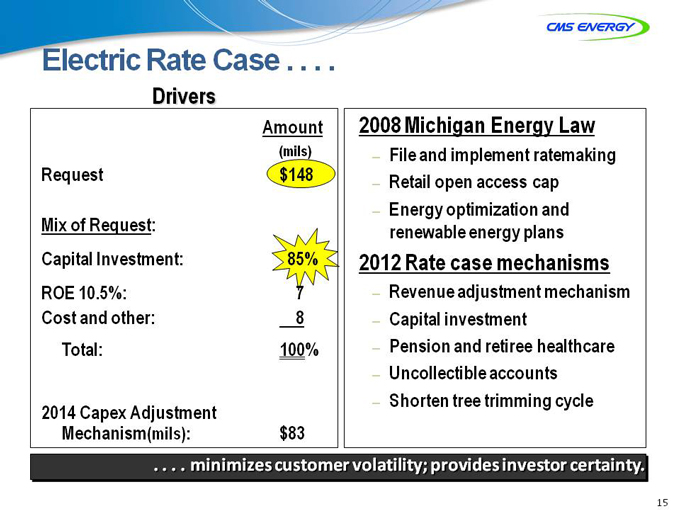
Electric Rate Case . . . .
Drivers
Amount
(mils)
Request $148
Mix of Request:
Capital Investment: 85%
ROE 10.5%: 7
Cost and other: 8
Total: 100%
2014 Capex Adjustment
Mechanism(mils): $83
2008 Michigan Energy Law
– File and implement ratemaking
– Retail open access cap
– Energy optimization and renewable energy plans
2012 Rate case mechanisms
Revenue adjustment mechanism
– Capital investment
– Pension and retiree healthcare
– Uncollectible accounts
– Shorten tree trimming cycle
. . . . minimizes customer volatility; provides investor certainty.
15

GAAP Reconciliation
CMS ENERGY CORPORATION
Earnings Per Share By Year GAAP Reconciliation
(Unaudited)
| 2003 |
2004 |
2005 |
2006 |
2007 |
2008 |
2009 |
2010 |
2011 |
||||||||||||||||||||||||||||
| Reported earnings (loss) per share - GAAP |
($ | 0.30 | ) | $ | 0.64 | ($ | 0.44 | ) | ($ | 0.41 | ) | ($ | 1.02 | ) | $ | 1.20 | $ | 0.91 | $ | 1.28 | $ | 1.58 | ||||||||||||||
| After-tax items: |
||||||||||||||||||||||||||||||||||||
| Electric and gas utility |
0.21 | (0.39 | ) | — | — | (0.07 | ) | 0.05 | 0.33 | 0.03 | 0.00 | |||||||||||||||||||||||||
| Enterprises |
0.74 | 0.62 | 0.04 | (0.02 | ) | 1.25 | (0.02 | ) | 0.09 | (0.03 | ) | (0.11 | ) | |||||||||||||||||||||||
| Corporate interest and other |
0.16 | (0.03 | ) | 0.04 | 0.27 | (0.32 | ) | (0.02 | ) | 0.01 | * | (0.01 | ) | |||||||||||||||||||||||
| Discontinued operations (income) loss |
(0.16 | ) | 0.02 | (0.07 | ) | (0.03 | ) | 0.40 | ( | *) | (0.08 | ) | 0.08 | (0.01 | ) | |||||||||||||||||||||
| Asset impairment charges, net |
— | — | 1.82 | 0.76 | 0.60 | — | — | — | — | |||||||||||||||||||||||||||
| Cumulative accounting changes |
0.16 | 0.01 | — | — | — | — | — | — | — | |||||||||||||||||||||||||||
| Adjusted earnings per share, including MTM - non-GAAP |
$ | 0.81 | $ | 0.87 | $ | 1.39 | $ | 0.57 | $ | 0.84 | $ | 1.21 | (a) | $ | 1.26 | $ | 1.36 | $ | 1.45 | |||||||||||||||||
| Mark-to-market impacts |
0.03 | (0.43 | ) | 0.51 | ||||||||||||||||||||||||||||||||
| Adjusted earnings per share, excluding MTM - non-GAAP |
NA | $ | 0.90 | $ | 0.96 | $ | 1.08 | NA | NA | NA | NA | NA | ||||||||||||||||||||||||
| * | Less than $500 thousand or $0.01 per share. |
| (a) | $1.25 excluding discontinued Exeter operations and accounting changes related to convertible debt and restricted stock. |
2003–11EPS