Attached files
| file | filename |
|---|---|
| 8-K - CIRRUS LOGIC, INC. 8-K - CIRRUS LOGIC, INC. | a50457677.htm |
| EX-99.1 - EXHIBIT 99.1 - CIRRUS LOGIC, INC. | a50457677-ex991.htm |
Exhibit 99.2
1 8 0 0 W e s t S i x t h S t r e e t , A u s t i n , T e x a s 7 8 7 0 1 Cirrus Logic, Inc. October 31, 2012 Letter Actually, it is like rocket science.
October 31, 2012 Dear Shareholders, We are delighted with our Q2 revenue and earnings results. During the quarter we began volume shipments of multiple new products, while design activity continued to be strong in both LED lighting and portable audio. The collaboration between our product design teams and our customers results in leading edge products that solve complex problems for some of the most innovative products in the world. We believe the magnitude of the growth we are experiencing affirms our success in identifying the right markets and customers, investing significantly, and executing on our R&D initiatives. As we look at new and emerging markets, our audio team is heavily focused on new technologies related to enhanced voice and audio features, which are applicable in a broad array of audio products. In our energy product line, we continue to be actively engaged with the key LED lighting players and expect our customers to have more products on the shelf in both the United States and Europe by the end of CY12. We expect FY13 to be another outstanding year for Cirrus Logic and our long-term shareholders.
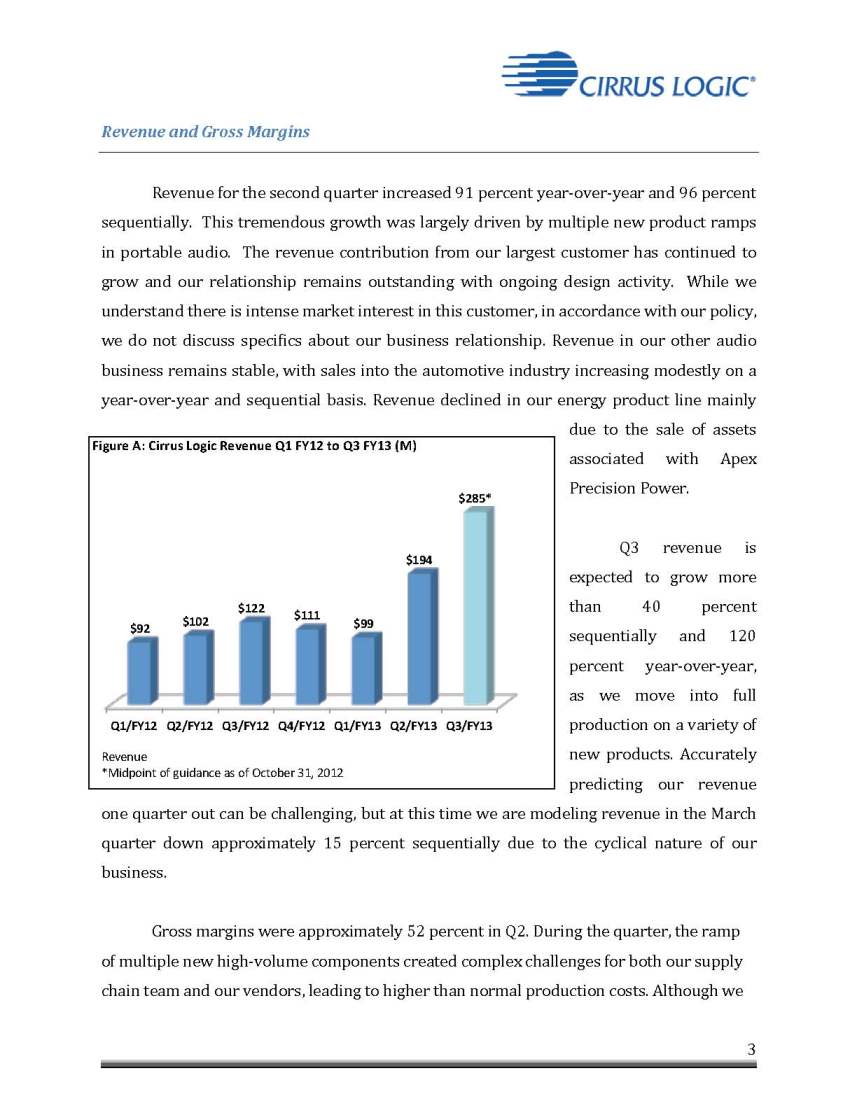
Revenue for the second quarter increased 91 percent year-over-year and 96 percent sequentially. This tremendous growth was largely driven by multiple new product ramps in portable audio. The revenue contribution from our largest customer has continued to grow and our relationship remains outstanding with ongoing design activity. While we understand there is intense market interest in this customer, in accordance with our policy, we do not discuss specifics about our business relationship. Revenue in our other audio business remains stable, with sales into the automotive industry increasing modestly on a year-over-year and sequential basis. Revenue declined in our energy product line mainly due to the sale of assets associated with Apex Precision Power. Q3 revenue is expected to grow more than 40 percent sequentially and 120 percent year-over-year, as we move into full production on a variety of new products. Accurately predicting our revenue one quarter out can be challenging, but at this time we are modeling revenue in the March quarter down approximately 15 percent sequentially due to the cyclical nature of our business. Gross margins were approximately 52 percent in Q2. During the quarter, the ramp of multiple new high-volume components created complex challenges for both our supply chain team and our vendors, leading to higher than normal production costs. Although we believe that we will work through our production challenges during the December quarter, we expect our overall gross margins to remain in the low 50 percent range for the Revenue and Gross Margins Figure Figure A: Cirrus Logic Revenue Q1 FY12 to Q3 FY13 (M) Q1/FY12 Q2/FY12 Q3/FY12 Q4/FY12 Q1/FY13 Q2/FY13 Q3/FY13 $92 $102 $122 $111 $99 $194 $285* Revenue *Midpoint of guidance as of October 31, 2012
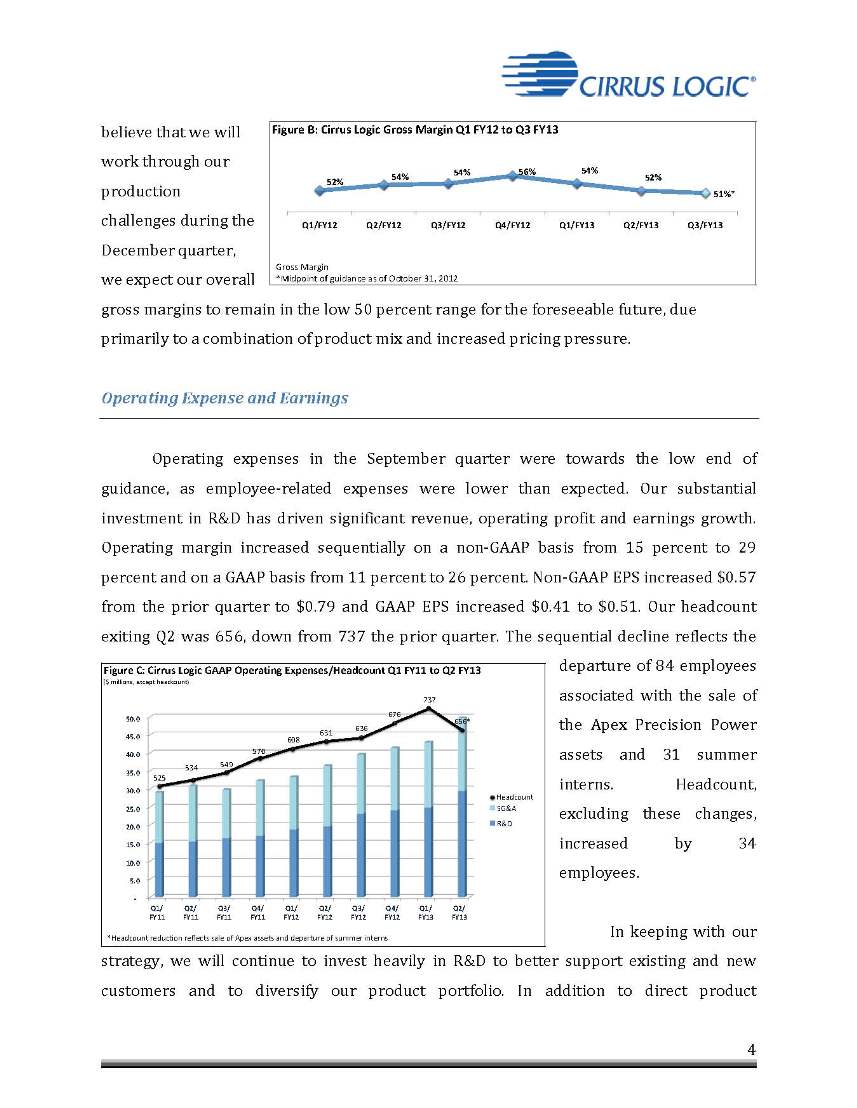
foreseeable future, due primarily to a combination of product mix and increased pricing pressure. Operating Expense and Earnings Operating expenses in the September quarter were towards the low end of guidance, as employee-related expenses were lower than expected. Our substantial investment in R&D has driven significant revenue, operating profit and earnings growth. Operating margin increased sequentially on a non-GAAP basis from 15 percent to 29 percent and on a GAAP basis from 11 percent to 26 percent. Non-GAAP EPS increased $0.57 from the prior quarter to $0.79 and GAAP EPS increased $0.41 to $0.51. Our headcount exiting Q2 was 656, down from 737 the prior quarter. The sequential decline reflects the departure of 84 employees associated with the sale of the Apex Precision Power assets and 31 summer interns. Headcount, excluding these changes, increased by 34 employees. In keeping with our strategy, we will continue to invest heavily in R&D to better support existing and new customers and to diversify our product portfolio. In addition to direct product development expense, our significantly increased production volumes and incredibly tight development schedules require us to further expand our infrastructure in areas such as Quality, Project Management and Product Figure B: Cirrus Logic Gross Margin Q1 FY12 to Q3 FY13 52% 53% 54% 56% 54% 52% 51%* Q1/FY12 Q2/FY12 Q3/FY12 Q4/FY12 Q1/FY13 Q2/FY13 Q3/FY13 Gross Margin *Midpoint of guidance as of October 31, 2012 Figure C: Cirrus Logic GAAP Operating Expenses/Headcount Q1 FY11 to Q2 FY13 ($ millions, except headcount) - 5.0 10.0 15.0 20.0 25.0 30.0 35.0 40.0 45.0 50.0 Q1/ FY11 Q2/ FY11 Q3/ FY11 Q4/ FY11 Q1/ FY12 Q2/ FY12 Q3/ FY12 Q4/ FY12 Q1/ FY13 Q2/ FY13 SG&A R&D 534 525 570 676 631 636 608 737 Headcount *Headcount reduc on reflects sale of Apex assets and departure of summer interns 656* 5
Sustaining Engineering. We believe that this represents an excellent opportunity to put even more distance between Cirrus and our typical competitors. Even with this level of investment, we expect our operating expenses to be relatively flat in Q3 as increases in R&D and other product development expenses will likely be offset by a decline in employee expenses and costs associated with the move to our new headquarters. Taxes and Inventory During the quarter we recorded a GAAP tax expense of $15.1 million, which includes $13.6 million of non-cash expense associated with our deferred tax asset. We have approximately $125.3 million of deferred tax assets remaining on our balance sheet. For FY13, we expect our effective quarterly cash tax rate to be less than four percent. As we continue to utilize our deferred tax assets, we are actively evaluating various tax strategies to reduce our corporate tax rate. Q2 inventory increased 50 percent sequentially to $144.9 million and we expect inventory to begin to decrease by the end of Q3 as sell through of product built in Q2 and Q3 accelerates. Company Strategy Cirrus Logic has worked hard to build a company with a business model that leverages our core values and technical strengths. This commitment has allowed us to develop a clear understanding of our expertise and the laser focus to identify niche markets and key customers where we can add value. Our business model seeks to leverage these attributes into solid relationships with tier-one leaders in the audio and energy markets. Our ability to provide meaningful innovation, coupled with timely execution, enables our expansion into new products, the addition of new features and the elimination or integration of functionality and components. We believe the powerful corporate culture at Cirrus Logic fosters efficiency, innovation and creativity, while maintaining a focus on delivering products to market in a timely manner. Our excellent financial results are
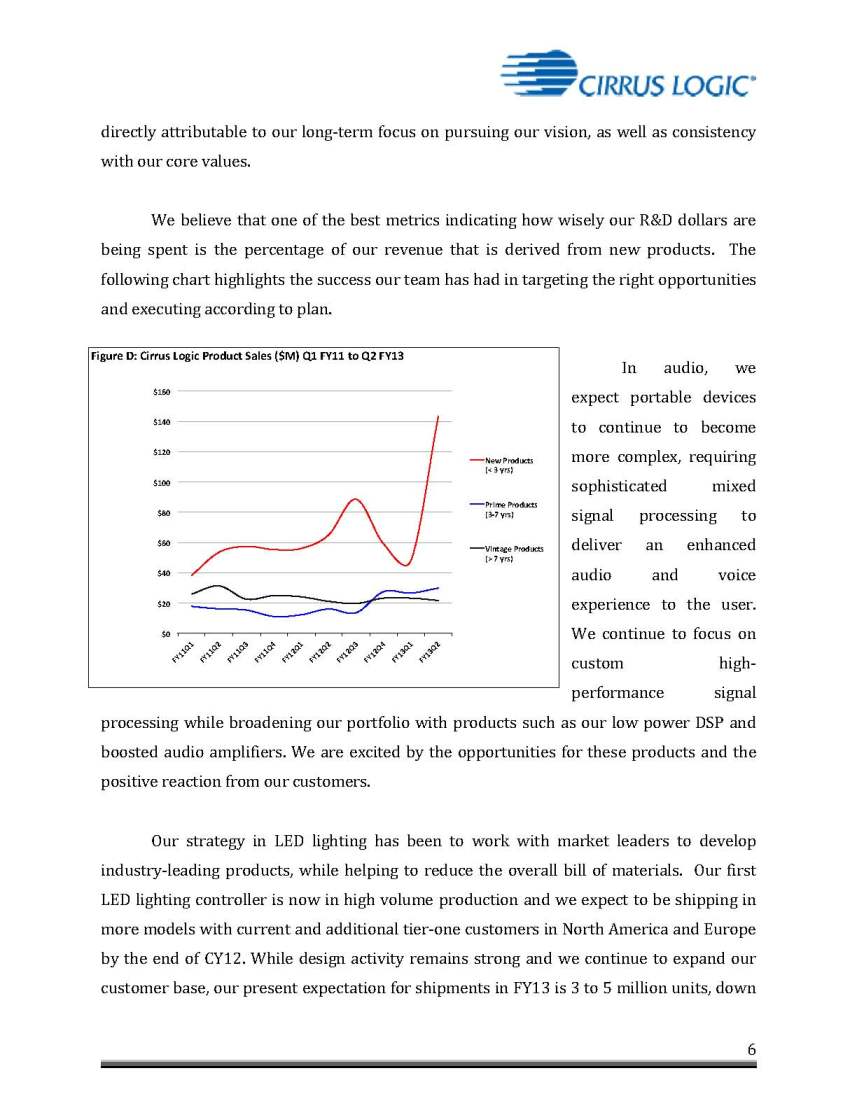
directly attributable to our long-term focus on pursuing our vision, as well as consistency with our core values. We believe that one of the best metrics indicating how wisely our R&D dollars are being spent is the percentage of our revenue that is derived from new products. The following chart highlights the success our team has had in targeting the right opportunities and executing according to plan. In audio, we expect portable devices to continue to become more complex, requiring sophisticated mixed signal processing to deliver an enhanced audio and voice experience to the user. We continue to focus on custom highperformance signal processing while broadening our portfolio with products such as our low power DSP and boosted audio amplifiers. We are excited by the opportunities for these products and the positive reaction from our customers. Our strategy in LED lighting has been to work with market leaders to develop industry-leading products, while helping to reduce the overall bill of materials. Our first LED lighting controller is now in high volume production and we expect to be shipping in more models with current and additional tier-one customers in North America and Europe by the end of CY12. While design activity remains strong and we continue to expand our customer base, our present expectation for shipments in FY13 is 3 to 5 million units, down Figure D: Cirrus Logic Product Sales ($M) Q1 FY11 to Q2 FY13 $0 $20 $40 $60 $80 $100 $120 $140 $160 FY11Q1 FY11Q2 FY11Q3 FY11Q4 FY12Q1 FY12Q2 FY12Q3 FY12Q4 FY13Q1 FY13Q2 New Products (< 3 yrs) Prime Products (3-7 yrs) Vintage Products (> 7 yrs)
from our initial expectations due to the delay of several models. One exciting trend we have seen in this market over the past few months is an active interest in high performance dimmer compatible LED lighting by large retailers as they grapple with high return rates and a generally poor user experience with typical LED bulbs. We believe this increased market pull for near perfect dimmer compatibility will help fuel further adoption of our technology. This is an outstanding opportunity for Cirrus Logic and builds on our mixed signal expertise and strong customer relationships. As expected, during the quarter we completed the sale of certain assets associated with the Apex Precision Power products located in Tucson, Arizona, for approximately $26 million. Other Interesting Stuff We would like to take a moment to highlight several awards we recently received. For the second year in a row, we have been ranked as one of the year’s top 50 Best Small and Medium Work Places in America by the Great Place to Work® Institute. The ranking is based on a comprehensive audit including an in-depth employee survey about the company’s corporate culture, employee programs and practices. The Great Place to Work Institute then evaluated each application using its unique and rigorous methodology based on credibility, respect, fairness, pride and camaraderie. Cirrus Logic was also ranked #8 in the Forbes America’s Best Small Companies and #2 on Fortune’s Fastest Growing Companies for 2012. These awards are based on sales and earnings per share growth, as well as return on equity.
Summary and Guidance For the December quarter, we expect the following results: • Revenue to range between $270 million and $300 million; • Gross margin to be between 50 percent and 52 percent; • Combined R&D and SG&A expenses to range between $49 million and $53 million, including approximately $6 million in share-based compensation expense. We are very excited about the extraordinary growth we experienced in Q2 and anticipate in Q3. Our substantial investment in R&D continues to pay off and we expect design activity to accelerate in the December quarter as we continue to gain traction with our audio and energy products. Once again, we would like to thank all of the Cirrus Logic employees for their exceptional dedication and performance over the past few years, which is at the core of our success. We expect FY13 to be an outstanding year for Cirrus Logic and our long-term shareholders. Sincerely, Jason Rhode Thurman Case President and Chief Executive Officer Chief Financial Officer
Conference Call Q&A Session Cirrus Logic management will host a live Q&A session today at 5 p.m. EDT to answer questions about the Company’s financial results and business outlook. Shareholders who would like to submit a question to be addressed during this session are requested to email the company at investor.relations@cirrus.com. A live webcast of the Q&A session can be accessed on the Cirrus Logic website, and a replay will be available approximately two hours following its completion, or by calling (404) 537-3406, or toll-free at (855) 859-2056 (Access Code: 35941792). Use of Non-GAAP Measures This shareholder letter and its attachments include references to non-GAAP financial information, including operating expenses, net income, operating margin and diluted earnings per share. A reconciliation of the adjustments to GAAP results is included in the tables below. Non-GAAP financial information is not meant as a substitute for GAAP results, but is included because management believes such information is useful to our investors for informational and comparative purposes. In addition, certain non-GAAP financial information is used internally by management to evaluate and manage the company. As a note, the non-GAAP financial information used by Cirrus Logic may differ from that used by other companies. These non-GAAP measures should be considered in addition to, and not as a substitute for, the results prepared in accordance with GAAP. Safe Harbor Statement Except for historical information contained herein, the matters set forth in this news release contain forward-looking statements, including our estimates of third and fourth quarter fiscal year 2013 revenue, gross margin, combined research and development and selling, general and administrative expense levels, share-based compensation expense, and ending inventory, as well as estimates for fourth quarter and fiscal year 2013 annual revenue growth rate, combined R&D and SG&A expenses. In some cases, forward-looking statements are identified by words such as “expect,” “anticipate,” “target,” “project,” “believe,” “goals,” “opportunity,” “estimates,” “intend,” and variations of these types of words and similar expressions. In addition, any statements that refer to our plans, expectations, strategies or other characterizations of future events or circumstances are forward-looking statements. These
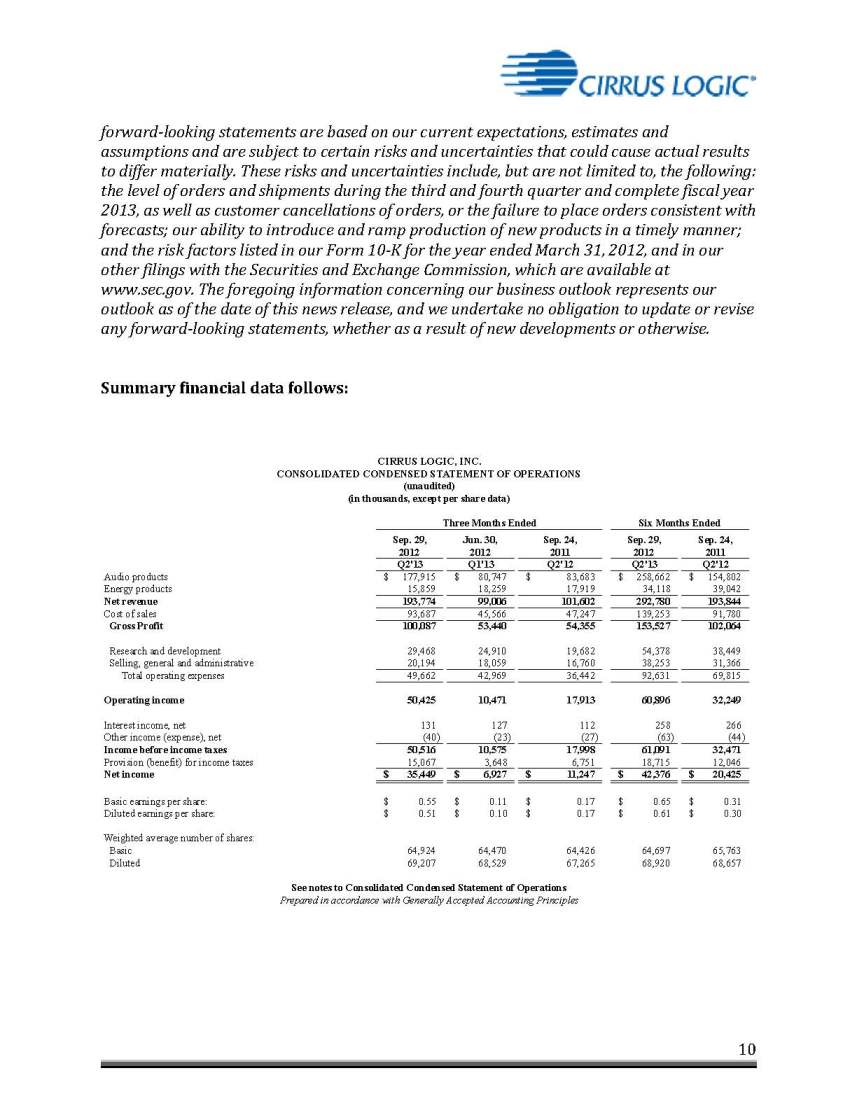
forward-looking statements are based on our current expectations, estimates and assumptions and are subject to certain risks and uncertainties that could cause actual results to differ materially. These risks and uncertainties include, but are not limited to, the following: the level of orders and shipments during the third and fourth quarter and complete fiscal year 2013, as well as customer cancellations of orders, or the failure to place orders consistent with forecasts; our ability to introduce and ramp production of new products in a timely manner; and the risk factors listed in our Form 10-K for the year ended March 31, 2012, and in our other filings with the Securities and Exchange Commission, which are available at www.sec.gov. The foregoing information concerning our business outlook represents our outlook as of the date of this news release, and we undertake no obligation to update or revise any forward-looking statements, whether as a result of new developments or otherwise. Summary financial data follows: Sep. 29, Jun. 30, Sep. 24, Sep. 29, Sep. 24, 2012 2012 2011 2012 2011 Q2'13 Q1'13 Q2'12 Q2'13 Q2'12 Audio products 177,915 $ 80,747 $ 83,683 $ 258,662 $ 154,802 $ Energy products 15,859 18,259 17,919 34,118 39,042 CIRRUS LOGIC, INC. CONSOLIDATED CONDENSED STATEMENT OF OPERATIONS (unaudited) (in thousands, except per share data) Three Months Ended Six Months Ended Net revenue 193,774 99,006 101,602 292,780 193,844 Cost of sales 93,687 45,566 47,247 139,253 91,780 Gross Profit 100,087 53,440 54,355 153,527 102,064 Research and development 29,468 24,910 19,682 54,378 38,449 Selling, general and administrative 20,194 18,059 16,760 38,253 31,366 Total operating expenses 49,662 42,969 36,442 92,631 69,815 Operating income 50,425 10,471 17,913 60,896 32,249 Interest income, net 131 127 112 258 266 Other income (expense), net (40) (23) (27) (63) (44) Income before income taxes 50,516 10,575 17,998 61,091 32,471 Provision (benefit) for income taxes 15,067 3,648 6,751 18,715 12,046 Net income 35,449 $ 6,927 $ 11,247 $ 42,376 $ 20,425 $ Basic earnings per share: 0.55 $ 0.11 $ 0.17 $ 0.65 $ 0.31 $ Diluted earnings per share: 0.51 $ 0.10 $ 0.17 $ 0.61 $ 0.30 $ Weighted average number of shares: Basic 64,924 64,470 64,426 64,697 65,763 Diluted 69,207 68,529 67,265 68,920 68,657 See notes to Consolidated Condensed Statement of Operations Prepared in accordance with Generally Accepted Accounting Principles
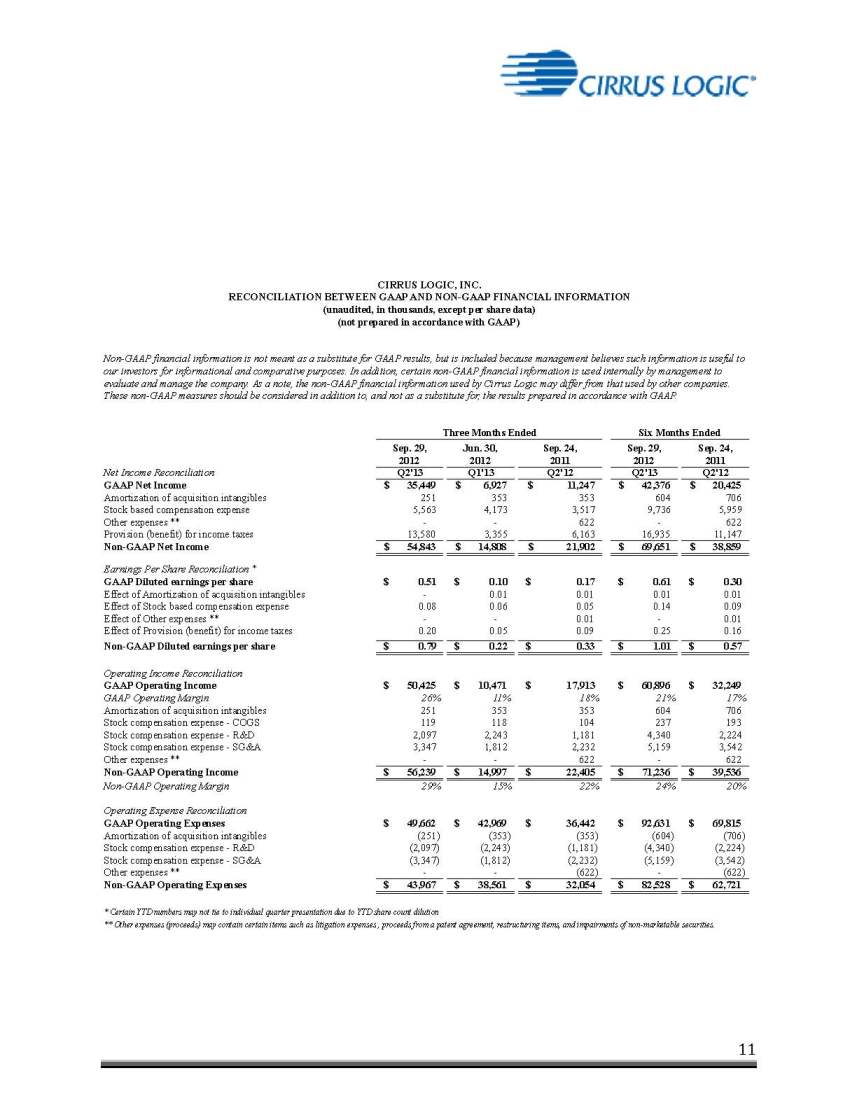
CIRRUS LOGIC, INC. RECONCILIATION BETWEEN GAAP AND NON-GAAP FINANCIAL INFORMATION (unaudited, in thousands, except per share data) Other expenses ** - - 622 - 622 Provision (benefit) for income taxes 13,580 3,355 6,163 16,935 11,147 Non-GAAP Net Income 54,843 $ 14,808 $ 21,902 $ 69,651 $ 38,859 $ Earnings Per Share Reconciliation * GAAP Diluted earnings per share 0.51 $ 0.10 $ 0.17 $ 0.61 $ 0.30 $ Effect of Amortization of acquisition intangibles - 0.01 0.01 0.01 0.01 Effect of Stock based compensation expense 0.08 0.06 0.05 0.14 0.09 Effect of Other expenses ** - - 0.01 - 0.01 Effect of Provision (benefit) for income taxes 0.20 0.05 0.09 0.25 0.16 Non-GAAP Diluted earnings per share 0.79 $ 0.22 $ 0.33 $ 1.01 $ 0.57 $ Operating Income Reconciliation GAAP Operating Income 50,425 $ 10,471 $ 17,913 $ 60,896 $ 32,249 $ GAAP Operating Margin 26% 11% 18% 21% 17% Amortization of acquisition intangibles 251 353 353 604 706 Stock compensation expense - COGS 119 118 104 237 193 Stock compensation expense - R&D 2,097 2,243 1,181 4,340 2,224 Stock compensation expense - SG&A 3,347 1,812 2,232 5,159 3,542 Other expenses ** - - 622 - 622 Non-GAAP Operating Income 56,239 $ 14,997 $ 22,405 $ 71,236 $ 39,536 $ Non-GAAP Operating Margin 29% 15% 22% 24% 20% Operating Expense Reconciliation GAAP Operating Expenses 49,662 $ 42,969 $ 36,442 $ 92,631 $ 69,815 $ Amortization of acquisition intangibles (251) (353) (353) (604) (706) Stock compensation expense - R&D (2,097) (2,243) (1,181) (4,340) (2,224) Stock compensation expense - SG&A (3,347) (1,812) (2,232) (5,159) (3,542) Other expenses ** - - (622) - (622) Non-GAAP Operating Expenses 43,967 $ 38,561 $ 32,054 $ 82,528 $ 62,721 $ * Certain YTD numbers may not tie to individual quarter presentation due to YTD share count dilution ** Other expenses (proceeds) may contain certain items such as litigation expenses , proceeds from a patent agreement, restructuring items, and impairments of non-marketable securities. GAAP financial information is not meant as a substitute for GAAP results, but is included because management believes such information is useful to our investors for informational and comparative purposes. In addition, certain non-GAAP financial information is used internally by management to evaluate and manage the company. As a note, the non-GAAP financial information used by Cirrus Logic may differ from that used by other companies. These non-GAAP measures should be considered in addition to, and not as a substitute for, the results prepared in accordance with GAAP. Three Months Ended Six Months Ended ( (not prepared in accordance with GAAP)
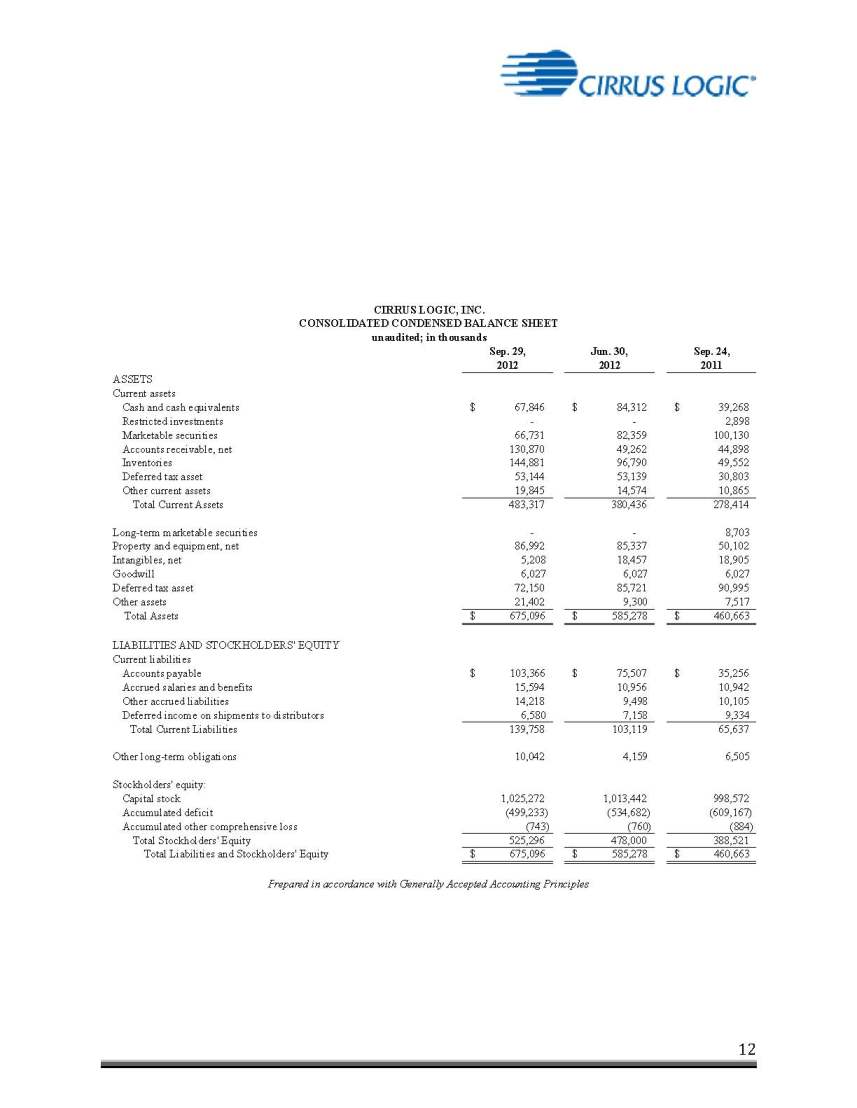
CIRRUS LOGIC, INC. CONSOLIDATED CONDENSED BALANCE SHEET unaudited; in thousands Sep. 29, Jun. 30, Sep. 24, 2012 2012 2011 ASSETS Current assets Cash and cash equivalents 67,846 $ 84,312 $ 39,268 $ Restricted investments - - 2,898 Marketable securities 66,731 82,359 100,130 Accounts receivable, net 130,870 49,262 44,898 Inventories 144,881 96,790 49,552 Deferred tax asset 53,144 53,139 30,803 Other current assets 19,845 14,574 10,865 Total Current Assets 483,317 380,436 278,414 Long-term marketable securities - - 8,703 Property and equipment, net 86,992 85,337 50,102 Intangibles, net 5,208 18,457 18,905 Goodwill 6,027 6,027 6,027 Deferred tax asset 72,150 85,721 90,995 Other assets 21,402 9,300 7,517 Total Assets 675,096 $ 585,278 $ 460,663 $ LIABILITIES AND STOCKHOLDERS' EQUITY Current liabilities Accounts payable 103,366 $ 75,507 $ 35,256 $ Accrued salaries and benefits 15,594 10,956 10,942 Other accrued liabilities 14,218 9,498 10,105 Deferred income on shipments to distributors 6,580 7,158 9,334 Total Current Liabilities 139,758 103,119 65,637 Other long-term obligations 10,042 4,159 6,505 Stockholders' equity: Capital stock 1,025,272 1,013,442 998,572 Accumulated deficit (499,233) (534,682) (609,167) Accumulated other comprehensive loss (743) (760) (884) Total Stockholders' Equity 525,296 478,000 388,521 Total Liabilities and Stockholders' Equity 675,096 $ 585,278 $ 460,663 $ Prepared in accordance with Generally Accepted Accounting Principles CIRRUS LOGIC, INC. CONSOLIDATED CONDENSED BALANCE