Attached files
| file | filename |
|---|---|
| 8-K - FORM 8-K - WESTERN DIGITAL CORP | d425868d8k.htm |
| EX-99.1 - EX-99.1 - WESTERN DIGITAL CORP | d425868dex991.htm |
Exhibit 99.2
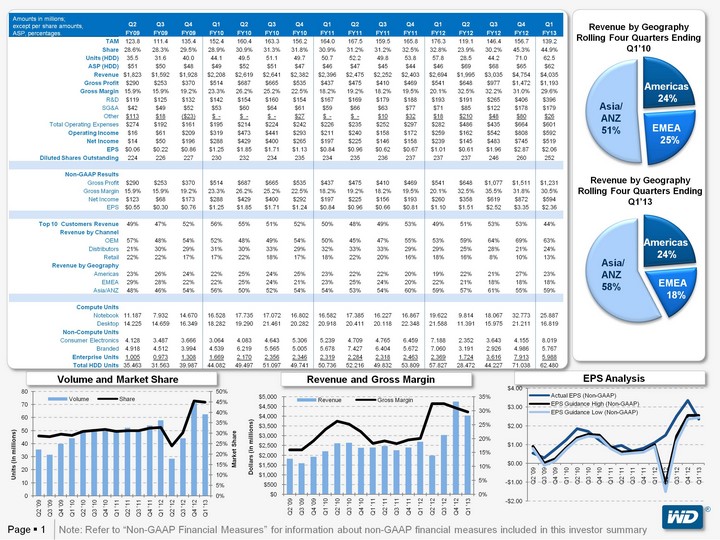
| (CHART) Page ? 1 Volume and Market Share EPS Analysis Revenue and Gross Margin Note: Refer to "Non-GAAP Financial Measures" for information about non-GAAP financial measures included in this investor summary (r) Q2 Q3 Q4 Q1 Q2 Q3 Q4 Q1 Q2 Q3 Q4 Q1 Q2 Q3 Q4 Q1 FY09 FY09 FY09 FY10 FY10 FY10 FY10 FY11 FY11 FY11 FY11 FY12 FY12 FY12 FY12 FY13 TAM 123.8 111.4 135.4 152.4 160.4 163.3 156.2 164.0 167.5 159.5 165.8 176.3 119.1 146.4 156.7 139.2 Share 28.6% 28.3% 29.5% 28.9% 30.9% 31.3% 31.8% 30.9% 31.2% 31.2% 32.5% 32.8% 23.9% 30.2% 45.3% 44.9% Units (HDD) 35.5 31.6 40.0 44.1 49.5 51.1 49.7 50.7 52.2 49.8 53.8 57.8 28.5 44.2 71.0 62.5 ASP (HDD) $51 $50 $48 $49 $52 $51 $47 $46 $47 $45 $44 $46 $69 $68 $65 $62 Revenue $1,823 $1,592 $1,928 $2,208 $2,619 $2,641 $2,382 $2,396 $2,475 $2,252 $2,403 $2,694 $1,995 $3,035 $4,754 $4,035 Gross Profit $290 $253 $370 $514 $687 $665 $535 $437 $475 $410 $469 $541 $648 $977 $1,472 $1,193 Gross Margin 15.9% 15.9% 19.2% 23.3% 26.2% 25.2% 22.5% 18.2% 19.2% 18.2% 19.5% 20.1% 32.5% 32.2% 31.0% 29.6% R&D $119 $125 $132 $142 $154 $160 $154 $167 $169 $179 $188 $193 $191 $265 $406 $396 SG&A $42 $49 $52 $53 $60 $64 $61 $59 $66 $63 $77 $71 $85 $122 $178 $179 Other $113 $18 ($23) $ - $ - $ - $27 $ - $ - $10 $32 $18 $210 $48 $80 $26 Total Operating Expenses $274 $192 $161 $195 $214 $224 $242 $226 $235 $252 $297 $282 $486 $435 $664 $601 Operating Income $16 $61 $209 $319 $473 $441 $293 $211 $240 $158 $172 $259 $162 $542 $808 $592 Net Income $14 $50 $196 $288 $429 $400 $265 $197 $225 $146 $158 $239 $145 $483 $745 $519 EPS $0.06 $0.22 $0.86 $1.25 $1.85 $1.71 $1.13 $0.84 $0.96 $0.62 $0.67 $1.01 $0.61 $1.96 $2.87 $2.06 Diluted Shares Outstanding 224 226 227 230 232 234 235 234 235 236 237 237 237 246 260 252 Non-GAAP Results Gross Profit $290 $253 $370 $514 $687 $665 $535 $437 $475 $410 $469 $541 $648 $1,077 $1,511 $1,231 Gross Margin 15.9% 15.9% 19.2% 23.3% 26.2% 25.2% 22.5% 18.2% 19.2% 18.2% 19.5% 20.1% 32.5% 35.5% 31.8% 30.5% Net Income $123 $68 $173 $288 $429 $400 $292 $197 $225 $156 $193 $260 $358 $619 $872 $594 EPS $0.55 $0.30 $0.76 $1.25 $1.85 $1.71 $1.24 $0.84 $0.96 $0.66 $0.81 $1.10 $1.51 $2.52 $3.35 $2.36 Top 10 Customers Revenue 49% 47% 52% 56% 55% 51% 52% 50% 48% 49% 53% 49% 51% 53% 53% 44% Revenue by Channel OEM 57% 48% 54% 52% 48% 49% 54% 50% 45% 47% 55% 53% 59% 64% 69% 63% Distributors 21% 30% 29% 31% 30% 33% 29% 32% 33% 33% 29% 29% 25% 28% 21% 24% Retail 22% 22% 17% 17% 22% 18% 17% 18% 22% 20% 16% 18% 16% 8% 10% 13% Revenue by Geography Americas 23% 26% 24% 22% 25% 24% 25% 23% 22% 22% 20% 19% 22% 21% 27% 23% EMEA 29% 28% 22% 22% 25% 24% 21% 23% 25% 24% 20% 22% 21% 18% 18% 18% Asia/ANZ 48% 46% 54% 56% 50% 52% 54% 54% 53% 54% 60% 59% 57% 61% 55% 59% Compute Units Notebook 11.187 7.932 14.670 16.528 17.735 17.072 16.802 16.582 17.385 16.227 16.867 19.622 9.814 18.067 32.773 25.887 Desktop 14.225 14.659 16.349 18.282 19.290 21.461 20.282 20.918 20.411 20.118 22.348 21.588 11.391 15.975 21.211 16.819 Non-Compute Units Consumer Electronics 4.128 3.487 3.666 3.064 4.083 4.643 5.306 5.239 4.709 4.765 6.459 7.188 2.352 3.643 4.155 8.019 Branded 4.918 4.512 3.994 4.539 6.219 5.565 5.005 5.678 7.427 6.404 5.672 7.060 3.191 2.926 4.986 5.767 Enterprise Units 1.005 0.973 1.308 1.669 2.170 2.356 2.346 2.319 2.284 2.318 2.463 2.369 1.724 3.616 7.913 5.988 Total HDD Units 35.463 31.563 39.987 44.082 49.497 51.097 49.741 50.736 52.216 49.832 53.809 57.827 28.472 44.227 71.038 62.480 Amounts in millions; except per share amounts, ASP, percentages. Revenue by Geography Rolling Four Quarters Ending Q1'10 Revenue by Geography Rolling Four Quarters Ending Q1'13 (CHART) (CHART) Asia/ ANZ 58% EMEA 18% Americas 24% (CHART) Asia/ ANZ 51% EMEA 25% Americas 24% (CHART) (CHART) |
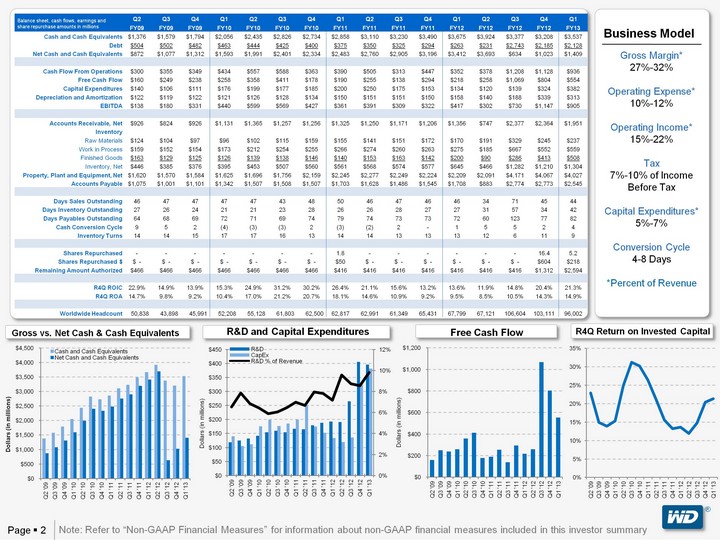
| Page ? 2 (r) Free Cash Flow R4Q Return on Invested Capital R&D and Capital Expenditures Gross vs. Net Cash & Cash Equivalents Business Model Gross Margin* 27%-32% Operating Expense* 10%-12% Operating Income* 15%-22% Tax 7%-10% of Income Before Tax Capital Expenditures* 5%-7% Conversion Cycle 4-8 Days *Percent of Revenue Q2 Q3 Q4 Q1 Q2 Q3 Q4 Q1 Q2 Q3 Q4 Q1 Q2 Q3 Q4 Q1 FY09 FY09 FY09 FY10 FY10 FY10 FY10 FY11 FY11 FY11 FY11 FY12 FY12 FY12 FY12 FY13 Cash and Cash Equivalents $1,376 $1,579 $1,794 $2,056 $2,435 $2,826 $2,734 $2,858 $3,110 $3,230 $3,490 $3,675 $3,924 $3,377 $3,208 $3,537 Debt $504 $502 $482 $463 $444 $425 $400 $375 $350 $325 $294 $263 $231 $2,743 $2,185 $2,128 Net Cash and Cash Equivalents $872 $1,077 $1,312 $1,593 $1,991 $2,401 $2,334 $2,483 $2,760 $2,905 $3,196 $3,412 $3,693 $634 $1,023 $1,409 Cash Flow From Operations $300 $355 $349 $434 $557 $588 $363 $390 $505 $313 $447 $352 $378 $1,208 $1,128 $936 Free Cash Flow $160 $249 $238 $258 $358 $411 $178 $190 $255 $138 $294 $218 $258 $1,069 $804 $554 Capital Expenditures $140 $106 $111 $176 $199 $177 $185 $200 $250 $175 $153 $134 $120 $139 $324 $382 Depreciation and Amortization $122 $119 $122 $121 $126 $128 $134 $150 $151 $151 $150 $158 $140 $188 $339 $313 EBITDA $138 $180 $331 $440 $599 $569 $427 $361 $391 $309 $322 $417 $302 $730 $1,147 $905 Accounts Receivable, Net $926 $824 $926 $1,131 $1,365 $1,257 $1,256 $1,325 $1,250 $1,171 $1,206 $1,356 $747 $2,377 $2,364 $1,951 Inventory Raw Materials $124 $104 $97 $96 $102 $115 $159 $155 $141 $151 $172 $170 $191 $329 $245 $237 Work in Process $159 $152 $154 $173 $212 $254 $255 $266 $274 $260 $263 $275 $185 $667 $552 $559 Finished Goods $163 $129 $125 $126 $139 $138 $146 $140 $153 $163 $142 $200 $90 $286 $413 $508 Inventory, Net $446 $385 $376 $395 $453 $507 $560 $561 $568 $574 $577 $645 $466 $1,282 $1,210 $1,304 Property, Plant and Equipment, Net $1,620 $1,570 $1,584 $1,625 $1,696 $1,756 $2,159 $2,245 $2,277 $2,249 $2,224 $2,209 $2,091 $4,171 $4,067 $4,027 Accounts Payable $1,075 $1,001 $1,101 $1,342 $1,507 $1,508 $1,507 $1,703 $1,628 $1,486 $1,545 $1,708 $883 $2,774 $2,773 $2,545 Days Sales Outstanding 46 47 47 47 47 43 48 50 46 47 46 46 34 71 45 44 Days Inventory Outstanding 27 26 24 21 21 23 28 26 26 28 27 27 31 57 34 42 Days Payables Outstanding 64 68 69 72 71 69 74 79 74 73 73 72 60 123 77 82 Cash Conversion Cycle 9 5 2 (4) (3) (3) 2 (3) (2) 2 - 1 5 5 2 4 Inventory Turns 14 14 15 17 17 16 13 14 14 13 13 13 12 6 11 9 Shares Repurchased - - - - - - - 1.8 - - - - - - 16.4 5.2 Shares Repurchased $ $ - $ - $ - $ - $ - $ - $ - $50 $ - $ - $ - $ - $ - $ - $604 $218 Remaining Amount Authorized $466 $466 $466 $466 $466 $466 $466 $416 $416 $416 $416 $416 $416 $416 $1,312 $2,594 R4Q ROIC 22.9% 14.9% 13.9% 15.3% 24.9% 31.2% 30.2% 26.4% 21.1% 15.6% 13.2% 13.6% 11.9% 14.8% 20.4% 21.3% R4Q ROA 14.7% 9.8% 9.2% 10.4% 17.0% 21.2% 20.7% 18.1% 14.6% 10.9% 9.2% 9.5% 8.5% 10.5% 14.3% 14.9% Worldwide Headcount 50,838 43,898 45,991 52,208 55,128 61,803 62,500 62,817 62,991 61,349 65,431 67,799 67,121 106,604 103,111 96,002 Balance sheet, cash flows, earnings and share repurchase amounts in millions (CHART) (CHART) (CHART) (CHART) Note: Refer to "Non-GAAP Financial Measures" for information about non-GAAP financial measures included in this investor summary |
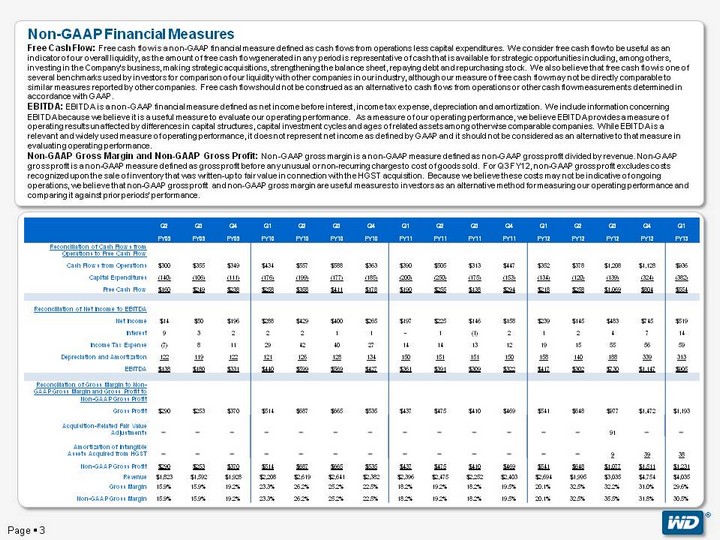
| Page ? 3 (r) Non-GAAP Financial Measures Free Cash Flow: Free cash flow is a non-GAAP financial measure defined as cash flows from operations less capital expenditures. We consider free cash flow to be useful as an indicator of our overall liquidity, as the amount of free cash flow generated in any period is representative of cash that is available for strategic opportunities including, among others, investing in the Company's business, making strategic acquisitions, strengthening the balance sheet, repaying debt and repurchasing stock. We also believe that free cash flow is one of several benchmarks used by investors for comparison of our liquidity with other companies in our industry, although our measure of free cash flow may not be directly comparable to similar measures reported by other companies. Free cash flow should not be construed as an alternative to cash flows from operations or other cash flow measurements determined in accordance with GAAP. EBITDA: EBITDA is a non-GAAP financial measure defined as net income before interest, income tax expense, depreciation and amortization. We include information concerning EBITDA because we believe it is a useful measure to evaluate our operating performance. As a measure of our operating performance, we believe EBITDA provides a measure of operating results unaffected by differences in capital structures, capital investment cycles and ages of related assets among otherwise comparable companies. While EBITDA is a relevant and widely used measure of operating performance, it does not represent net income as defined by GAAP and it should not be considered as an alternative to that measure in evaluating operating performance. Non-GAAP Gross Margin and Non-GAAP Gross Profit: Non-GAAP gross margin is a non-GAAP measure defined as non-GAAP gross profit divided by revenue. Non-GAAP gross profit is a non-GAAP measure defined as gross profit before any unusual or non-recurring charges to cost of goods sold. For Q3 FY12, non-GAAP gross profit excludes costs recognized upon the sale of inventory that was written-up to fair value in connection with the HGST acquisition. Because we believe these costs may not be indicative of ongoing operations, we believe that non-GAAP gross profit and non-GAAP gross margin are useful measures to investors as an alternative method for measuring our operating performance and comparing it against prior periods' performance. Q2 Q3 Q4 Q1 Q2 Q3 Q4 Q1 Q2 Q3 Q4 Q1 Q2 Q3 Q4 Q1 FY09 FY09 FY09 FY10 FY10 FY10 FY10 FY11 FY11 FY11 FY11 FY12 FY12 FY12 FY12 FY13 Reconciliation of Cash Flows from Operations to Free Cash Flow Cash Flows from Operations $300 $355 $349 $434 $557 $588 $363 $390 $505 $313 $447 $352 $378 $1,208 $1,128 $936 Capital Expenditures (140) (106) (111) (176) (199) (177) (185) (200) (250) (175) (153) (134) (120) (139) (324) (382) Free Cash Flow $160 $249 $238 $258 $358 $411 $178 $190 $255 $138 $294 $218 $258 $1,069 $804 $554 Reconciliation of Net Income to EBITDA Net Income $14 $50 $196 $288 $429 $400 $265 $197 $225 $146 $158 $239 $145 $483 $745 $519 Interest 9 3 2 2 2 1 1 - 1 (1) 2 1 2 4 7 14 Income Tax Expense (7) 8 11 29 42 40 27 14 14 13 12 19 15 55 56 59 Depreciation and Amortization 122 119 122 121 126 128 134 150 151 151 150 158 140 188 339 313 EBITDA $138 $180 $331 $440 $599 $569 $427 $361 $391 $309 $322 $417 $302 $730 $1,147 $905 Reconciliation of Gross Margin to Non-GAAP Gross Margin and Gross Profit to Non-GAAP Gross Profit Gross Profit $290 $253 $370 $514 $687 $665 $535 $437 $475 $410 $469 $541 $648 $977 $1,472 $1,193 Acquisition-Related Fair Value Adjustments 91 Amortization of Intangible Assets Acquired from HGST 9 39 38 Non-GAAP Gross Profit $290 $253 $370 $514 $687 $665 $535 $437 $475 $410 $469 $541 $648 $1,077 $1,511 $1,231 Revenue $1,823 $1,592 $1,928 $2,208 $2,619 $2,641 $2,382 $2,396 $2,475 $2,252 $2,403 $2,694 $1,995 $3,035 $4,754 $4,035 Gross Margin 15.9% 15.9% 19.2% 23.3% 26.2% 25.2% 22.5% 18.2% 19.2% 18.2% 19.5% 20.1% 32.5% 32.2% 31.0% 29.6% Non-GAAP Gross Margin 15.9% 15.9% 19.2% 23.3% 26.2% 25.2% 22.5% 18.2% 19.2% 18.2% 19.5% 20.1% 32.5% 35.5% 31.8% 30.5% |
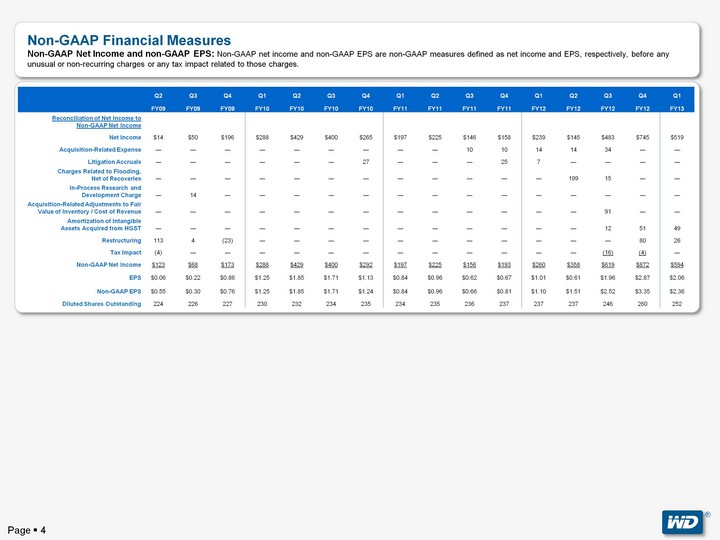
| Page ? 4 (r) Non-GAAP Financial Measures Non-GAAP Net Income and non-GAAP EPS: Non-GAAP net income and non-GAAP EPS are non-GAAP measures defined as net income and EPS, respectively, before any unusual or non-recurring charges or any tax impact related to those charges. Q2 Q3 Q4 Q1 Q2 Q3 Q4 Q1 Q2 Q3 Q4 Q1 Q2 Q3 Q4 Q1 FY09 FY09 FY09 FY10 FY10 FY10 FY10 FY11 FY11 FY11 FY11 FY12 FY12 FY12 FY12 FY13 Reconciliation of Net Income to Non-GAAP Net Income Net Income $14 $50 $196 $288 $429 $400 $265 $197 $225 $146 $158 $239 $145 $483 $745 $519 Acquisition-Related Expense ^ ^ ^ ^ ^ ^ ^ ^ ^ 10 10 14 14 34 ^ ^ Litigation Accruals ^ ^ ^ ^ ^ ^ 27 ^ ^ ^ 25 7 ^ ^ ^ ^ Charges Related to Flooding, Net of Recoveries ^ ^ ^ ^ ^ ^ ^ ^ ^ ^ ^ ^ 199 15 ^ ^ In-Process Research and Development Charge ^ 14 ^ ^ ^ ^ ^ ^ ^ ^ ^ ^ ^ ^ ^ ^ Acquisition-Related Adjustments to Fair Value of Inventory / Cost of Revenue ^ ^ ^ ^ ^ ^ ^ ^ ^ ^ ^ ^ ^ 91 ^ ^ Amortization of Intangible Assets Acquired from HGST ^ ^ ^ ^ ^ ^ ^ ^ ^ ^ ^ ^ ^ 12 51 49 Restructuring 113 4 (23) ^ ^ ^ ^ ^ ^ ^ ^ ^ ^ ^ 80 26 Tax Impact (4) ^ ^ ^ ^ ^ ^ ^ ^ ^ ^ ^ ^ (16) (4) ^ Non-GAAP Net Income $123 $68 $173 $288 $429 $400 $292 $197 $225 $156 $193 $260 $358 $619 $872 $594 EPS $0.06 $0.22 $0.86 $1.25 $1.85 $1.71 $1.13 $0.84 $0.96 $0.62 $0.67 $1.01 $0.61 $1.96 $2.87 $2.06 Non-GAAP EPS $0.55 $0.30 $0.76 $1.25 $1.85 $1.71 $1.24 $0.84 $0.96 $0.66 $0.81 $1.10 $1.51 $2.52 $3.35 $2.36 Diluted Shares Outstanding 224 226 227 230 232 234 235 234 235 236 237 237 237 246 260 252 |
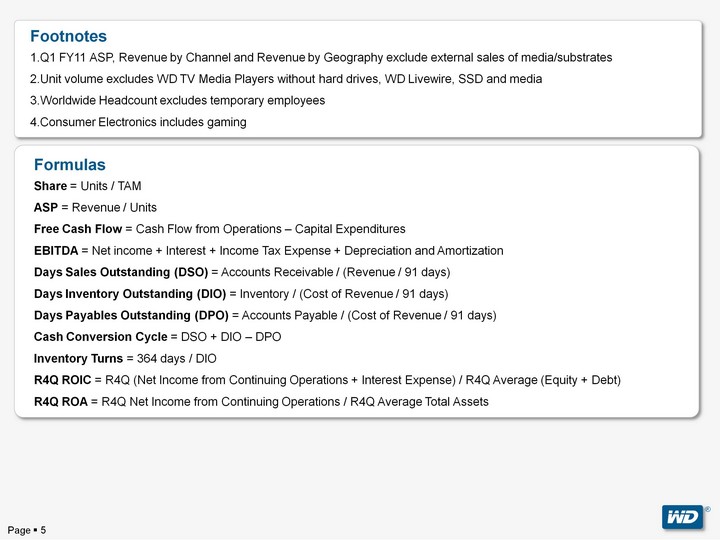
| Page ? 5 Footnotes Q1 FY11 ASP, Revenue by Channel and Revenue by Geography exclude external sales of media/substrates Unit volume excludes WD TV Media Players without hard drives, WD Livewire, SSD and media Worldwide Headcount excludes temporary employees Consumer Electronics includes gaming (r) Formulas Share = Units / TAM ASP = Revenue / Units Free Cash Flow = Cash Flow from Operations - Capital Expenditures EBITDA = Net income + Interest + Income Tax Expense + Depreciation and Amortization Days Sales Outstanding (DSO) = Accounts Receivable / (Revenue / 91 days) Days Inventory Outstanding (DIO) = Inventory / (Cost of Revenue / 91 days) Days Payables Outstanding (DPO) = Accounts Payable / (Cost of Revenue / 91 days) Cash Conversion Cycle = DSO + DIO - DPO Inventory Turns = 364 days / DIO R4Q ROIC = R4Q (Net Income from Continuing Operations + Interest Expense) / R4Q Average (Equity + Debt) R4Q ROA = R4Q Net Income from Continuing Operations / R4Q Average Total Assets |