Attached files
| file | filename |
|---|---|
| 8-K - WESTERN ALLIANCE BANCORPORATION 8-K - WESTERN ALLIANCE BANCORPORATION | a50445475.htm |
| EX-99.1 - EXHIBIT 99.1 - WESTERN ALLIANCE BANCORPORATION | a50445475ex99_1.htm |
Exhibit 99.2
3rd Quarter 2012 Earnings Call October 19, 2012 Western Alliance Bancorporation (NYSE: WAL)
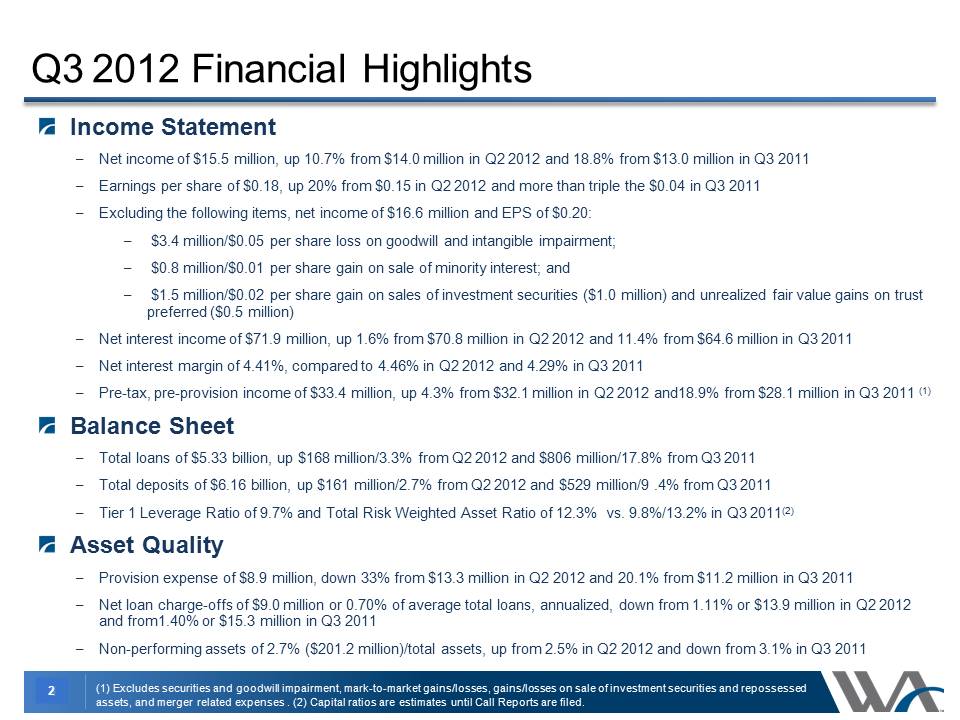
2 Income Statement –Net income of $15.5 million, up 10.7% from $14.0 million in Q2 2012 and 18.8% from $13.0 million in Q3 2011 –Earnings per share of $0.18, up 20% from $0.15 in Q2 2012 and more than triple the $0.04 in Q3 2011 –Excluding the following items, net income of $16.6 million and EPS of $0.20: – $3.4 million/ $0.05 per share loss on goodwill and intangible impairment, – $0.8 million/ $0.01 per share gain on sale of minority interest – $1.5 million/ $0.02 per share gain on sales of investment securities ($1.0 million) and unrealized fair value gains on trust preferred ($0.5 million) –Net interest income of $71.9 million, up 1.6% from $70.8 million in Q2 2012 and 11.4% from $64.6 million in Q2 2011 –Net interest margin of 4.41%, compared to 4.46% in Q2 2012 and 4.29% in Q3 2011 –Pre-tax, pre-provision income of $33.4 million, up 4.3% from $32.1 million in Q2 2012 and 18.9% from $28.1 million in Q3 2011 (1) Balance Sheet –Total loans of $5.33 billion, up $168 million /3.3% from Q2 2012 and $806 million/17.8% from Q3 2011 –Total deposits of $6.16 billion, up $161 million/ 2.7% from Q2 2012 and $529 million /9.4% from Q3 2011 –Tier 1 Leverage Ratio of 9.7% and Total Risk Weighted Asset Ratio of 12.3% vs. 9.8% /13.2% in Q3 2011(2) Asset Quality –Provision expense of $8.9 million, down 33% from $13.3 million in Q2 2012 and 20.1% from $11.2 million in Q3 2011 –Net loan charge-offs of $9.0 million or 0.70% of average total loans, annualized, down from 1.11% or $13.9 million in Q2 2012 and from1.40% or $15.3 million in Q3 2011 –Non-performing assets of 2.7% ($201.2 million) /total assets, up from 2.5% in Q2 2012 and down from 3.1% in Q3 2011 Q3 Quarter 2012 Financial Highlights (1) Excludes securities and goodwill impairment, mark-to-market gains/losses, gains/losses on sale of investment securities and repossessed assets, and merger related expenses . (2) Capital ratios are estimates until Call Reports are filed.
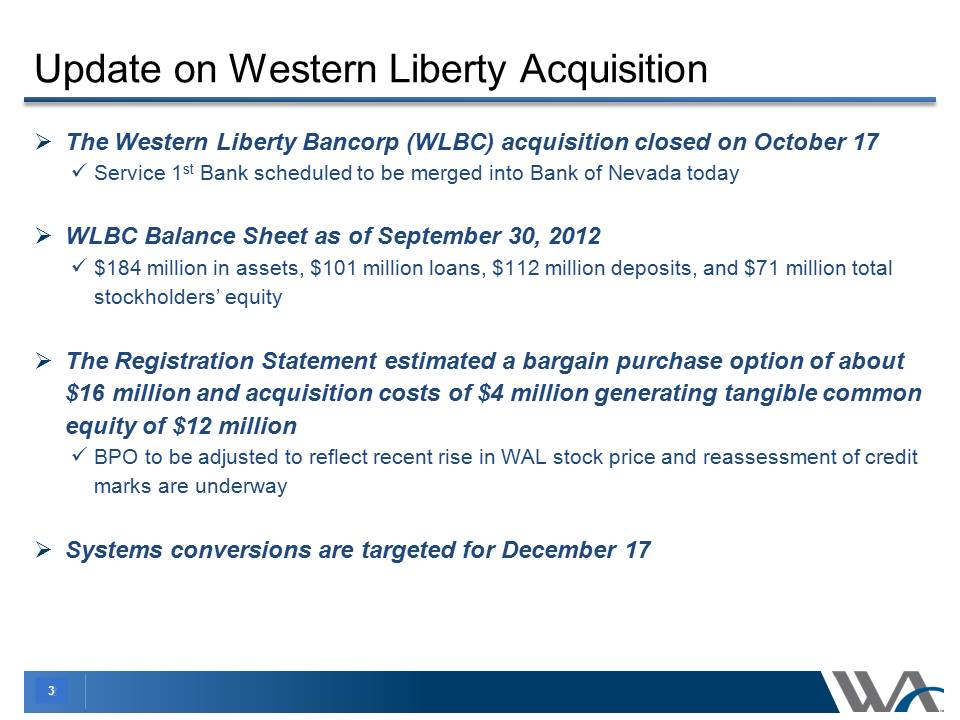
3 Update on Western Liberty Acquisition The Western Liberty Bancorp (WLBC) acquisition closed on October 17 Service 1st Bank scheduled to be merged into Bank of Nevada today WLBC Balance Sheet as of September 30, 2012 $184 million in assets, $101 million loans, $112 million deposits, and $71 million total stockholders’ equity The Registration Statement estimated a bargain purchase option of about $16 million and acquisition costs of $4 million generating tangible common equity of $12 million BPO to be adjusted to reflect recent rise in WAL stock price and reassessment of marks are underway Systems conversions are targeted for December 17
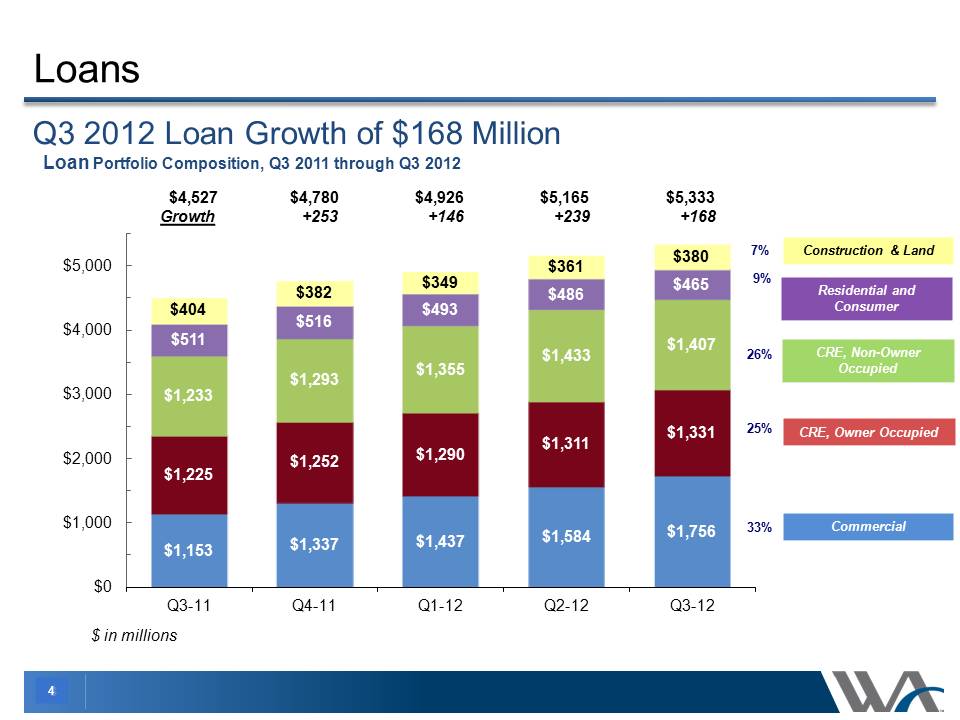
4 Loans Q3 2012 Loan Growth of $168 Million Loan Portfolio Composition, Q3 11 through Q3 2012 $1,153 $1,337 $1,437 $1,584 $1,756 $1,225 $1,252 $1,290$1,233 $1,293 $1,355 $1,433 $1,407 $511 $516 $493 $486 $465 $404 $382 $349 $361 $380 $0 $1,000 $2,000 $3,000 $4,000 $5,000 Q3-11 Q4-11 Q1-12 Q2-12 Q3-12 Commercial CRE, Owner Occupied CRE, Non-Owner Occupied Construction & Land Residential and Consumer 33% 9% 26% 25% 7% $ in millions $4,527 $4,780 $4,926 $5,165 $5,333 Growth +253 +146 +239 +168
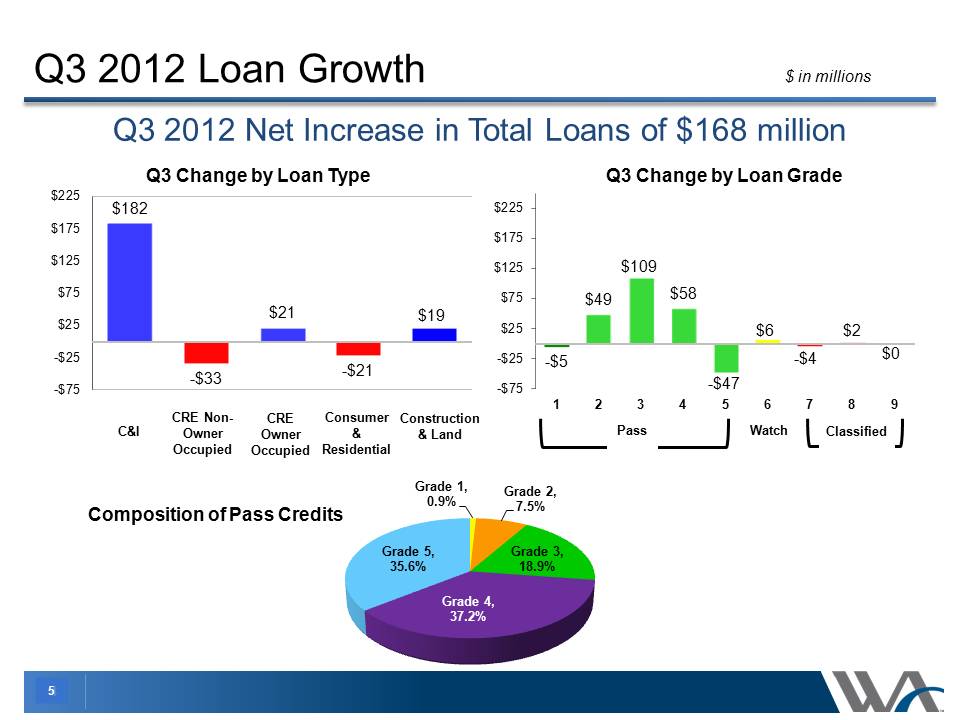
5 Q3 2012 Loan Growth Q3 2012 Quarter net increase in Total Loans of $168 million $182 -$33 $21 -$21 $19 -$75 -$25 $25 $75 $125 $175 $225 Q3 Change by Loan Type -$5 $49 $109 $58 -$47 $6 -$4 $2 $0 -$75 -$25 $25 $75 $125 $175 $225 1 2 3 4 5 6 7 8 9 Q3 Change by Loan Grade Pass Watch Classified C&I CRE Non- Owner Occupied CRE Owner Occupied Consumer & Residential Construction & Land Composition of Pass Credits Grade 1, 0.9% Grade 2, 7.5% Grade 3, 18.9% Grade 4, 37.2% Grade 5, 35.6%$ in millions
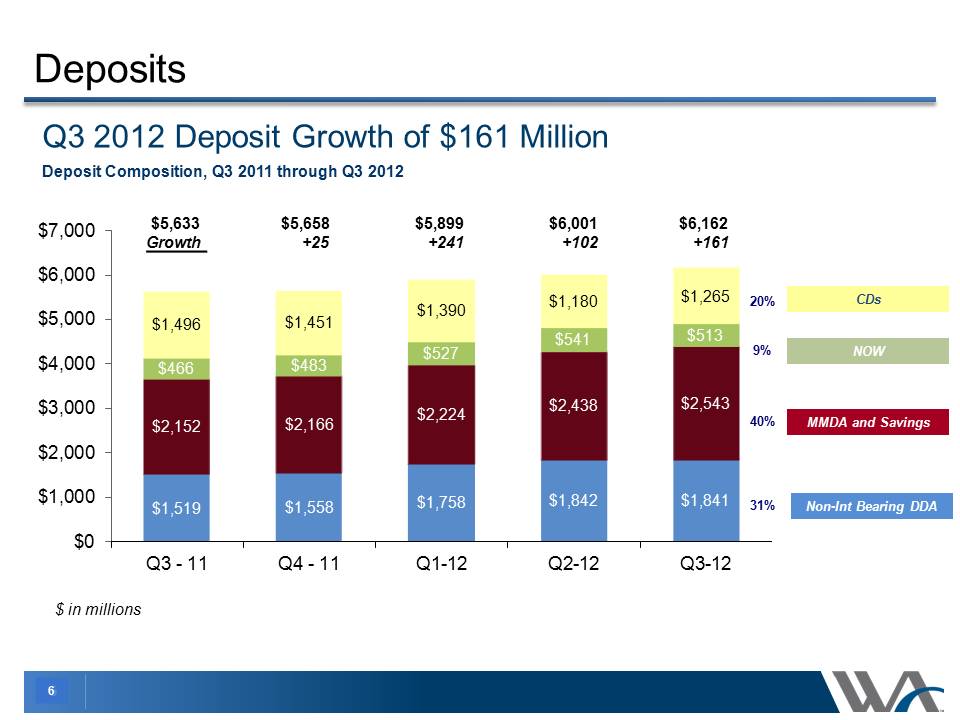
6 Deposits Q3 2012 Deposit Growth of $161 Million $1,519 $1,558 $1,758 $1,842 $1,841 $2,152 $2,166 $2,224 $2,438 $2,543 $466 $483 $527 $541 $513 $1,496 $1,451 $1,390 $1,180 $1,265 $0 $1,000 $2,000 $3,000 $4,000 $5,000 $6,000 $7,000 Q3 - 11 Q4 - 11 Q1-12 Q2-12 Q3-12 Deposit Composition, Q3 11 through Q3 2012 $5,633 $5,658 $5,899 $6,001 $6,162 Growth +25 +241 +102 +161 MMDA and Savings NOW CDs Non-Int Bearing DDA 9% 40% 31% 20% $ in millions
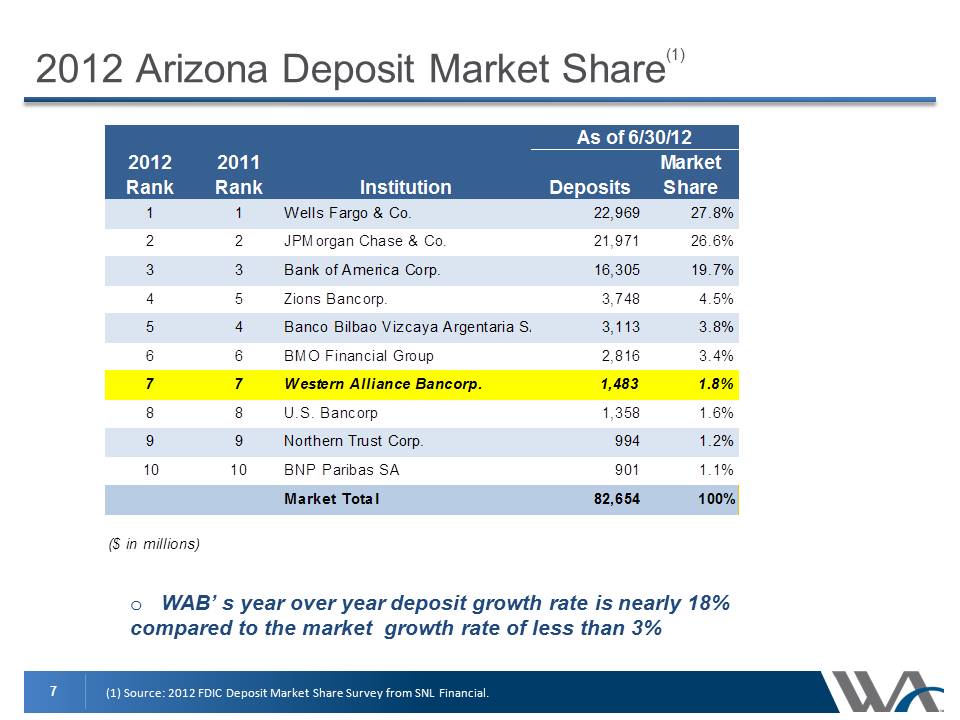
7 As of 6/30/122012 Rank 2011 Rank DepositsMarket Share11Wells Fargo & Co.22,96927.8%22JPMorgan Chase & Co.21,97126.6%33Bank of America Corp.16,30519.7%45Zions Bancorp.3,7484.5%54Banco Bilbao Vizcaya Argentaria SA3,1133.8%66BMO Financial Group2,8163.4%77Western Alliance Bancorp.1,4831.8%88U.S. Bancorp1,3581.6%99Northern Trust Corp.9941.2%1010BNP Paribas SA9011.1% Market Total82,654100%($ in millions)Institution 2012 Arizona Deposit Market Share(1) (1) Source: 2012 FDIC Deposit Market Share Survey from SNL Financial. o WAB’ s year over year deposit growth rate is nearly 18% compared to the market growth rate of less than 3% As of 6/30/122012 Rank 2011 Rank DepositsMarket Share11Wells Fargo & Co.22,96927.8%22JPMorgan Chase & Co.21,97126.6%33Bank of America Corp.16,30519.7%45Zions Bancorp.3,7484.5%54Banco Bilbao Vizcaya Argentaria SA3,1133.8%66BMO Financial Group2,8163.4%77Western Alliance Bancorp.1,4831.8%88U.S. Bancorp1,3581.6%99Northern Trust Corp.9941.2%1010BNP Paribas SA9011.1% Market Total82,654100% Institution
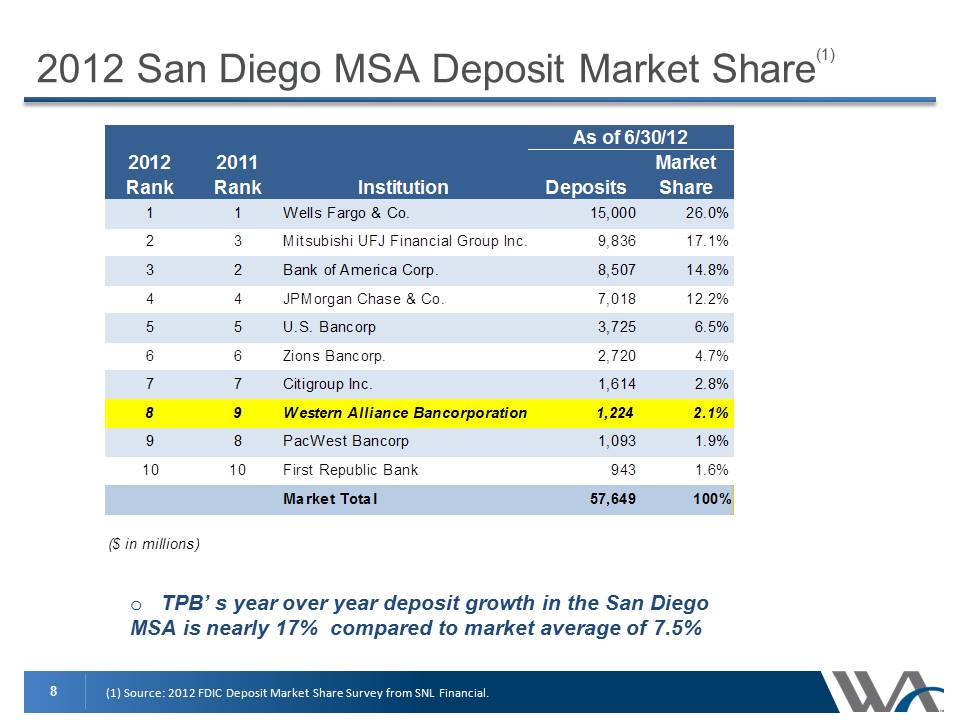
8 2012 San Diego MSA Deposit Market Share(1) (1) Source: 2012 FDIC Deposit Market Share Survey from SNL Financial. o TPB’ s year over year deposit growth in the San Diego MSA is nearly 17% compared to market average of 7.5% As of 6/30/122012 Rank 2011 Rank DepositsMarket Share11Wells Fargo & Co.15,000 26.0% 23 Mitsubishi UFJ Financial Group Inc.9,83617.1%32 Bank of America Corp.8,50714.8%44JPMorgan Chase & Co.7,01812.2%55U.S. Bancorp3,7256.5%66Zions Bancorp. 2,7204.7%77 Citigroup Inc.1,6142.8%89Western Alliance Bancorporation1,2242.1%98 Pac West Bancorp1,0931.9%1010First Republic Bank9431.6%Market Total57,649100%($ in millions) Instituion
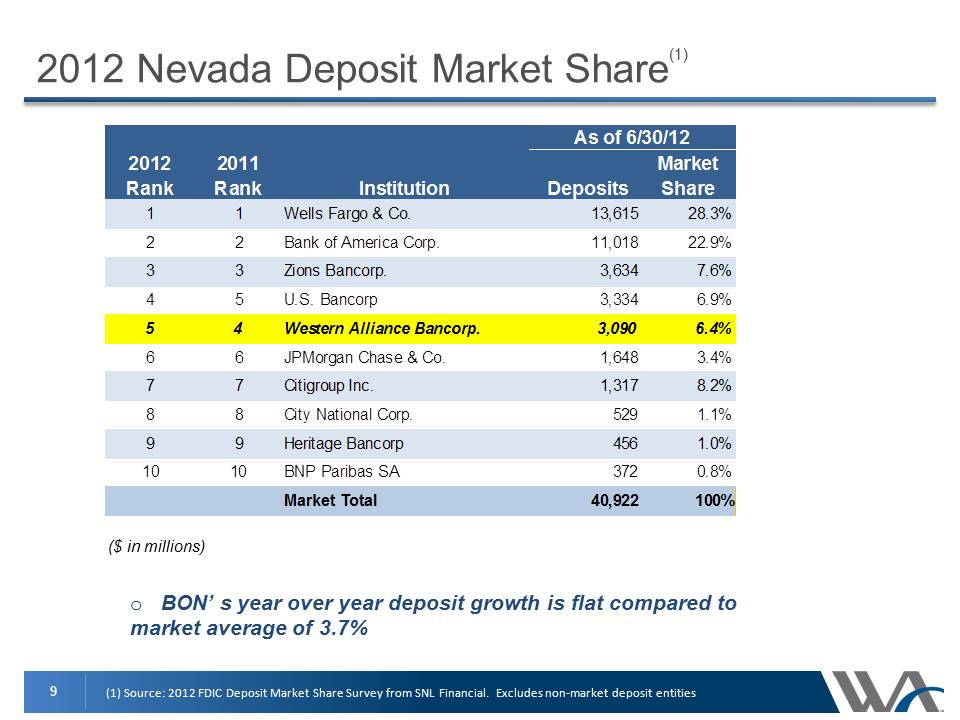
9 2012 Nevada Deposit Market Share(1) (1) Source: 2012 FDIC Deposit Market Share Survey from SNL Financial. Excludes non-market deposit entities o BON’ s year over year deposit growth is flat compared to market average of 3.7% As of 6/30/122012 Rank 2011 Rank DepositsMarket Share11Wells Fargo & Co.13,61528.3%22Bank of America Corp.11,01822.9%33Zions Bancorp.3,6347.6%45U.S. Bancorp3,3346.9%54 Western Alliance Bancorp.3,0906.4%66JPMorgan Chase & Co.1,6483.4%77Citigroup Inc.1,3178.2%88City National Corp.5291.1%99Heritage Bancorp4561.0%1010BNP Paribas SA3720.8%Market Total40,922100%Institution ($ in millions)
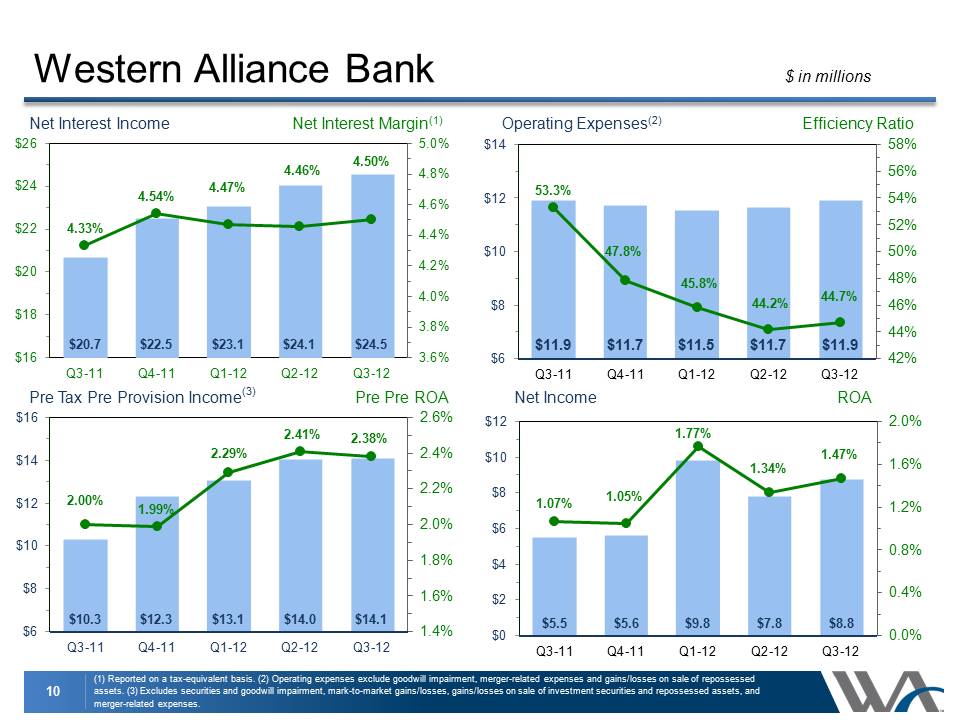
10 $20.7 $22.5 $23.1 $24.1 $24.5 4.33% 4.54% 4.47% 4.46% 4.50% 3.6% 3.8% 4.0% 4.2% 4.4% 4.6% 4.8% 5.0% $16 $18 $20 $22 $24 $26 Q3-11 Q4-11 Q1-12 Q2-12 Q3-12 $11.9 $11.7 $11.5 $11.7 $11.9 53.3% 47.8% 45.8% 44.2% 44.7% 42% 44% 46% 48% 50% 52% 54% 56% 58% $6 $8 $10 $12 $14 Q3-11 Q4-11 Q1-12 Q2-12 Q3-12 Western Alliance Bank (1) Reported on a tax-equivalent basis. (2) Operating expenses exclude goodwill impairment, merger-related expenses and gains/losses on sale of repossessed assets. (3) Excludes securities and goodwill impairment, mark-to-market gains/losses, gains/losses on sale of investment securities and repossessed assets, and merger-related expenses. Net Interest Income Operating Expenses(2) $ in millions Net Interest Margin(1) Efficiency Ratio Pre Pre ROA $10.3 $12.3 $13.1 $14.0 $14.1 2.00% 1.99% 2.29% 2.41% 2.38% 1.4% 1.6% 1.8% 2.0% 2.2% 2.4% 2.6% $6 $8 $10 $12 $14 $16 Q3-11 Q4-11 Q1-12 Q2-12 Q3-12 ROA $5.5 $5.6 $9.8 $7.8 $8.8 1.07% 1.05% 1.77% 1.34% 1.47% 0.0% 0.4% 0.8% 1.2% 1.6% 2.0% $0 $2 $4 $6 $8 $10 $12 Q3-11 Q4-11 Q1-12 Q2-12 Q3-12 Pre Tax Pre Provision Income(3) Net Income
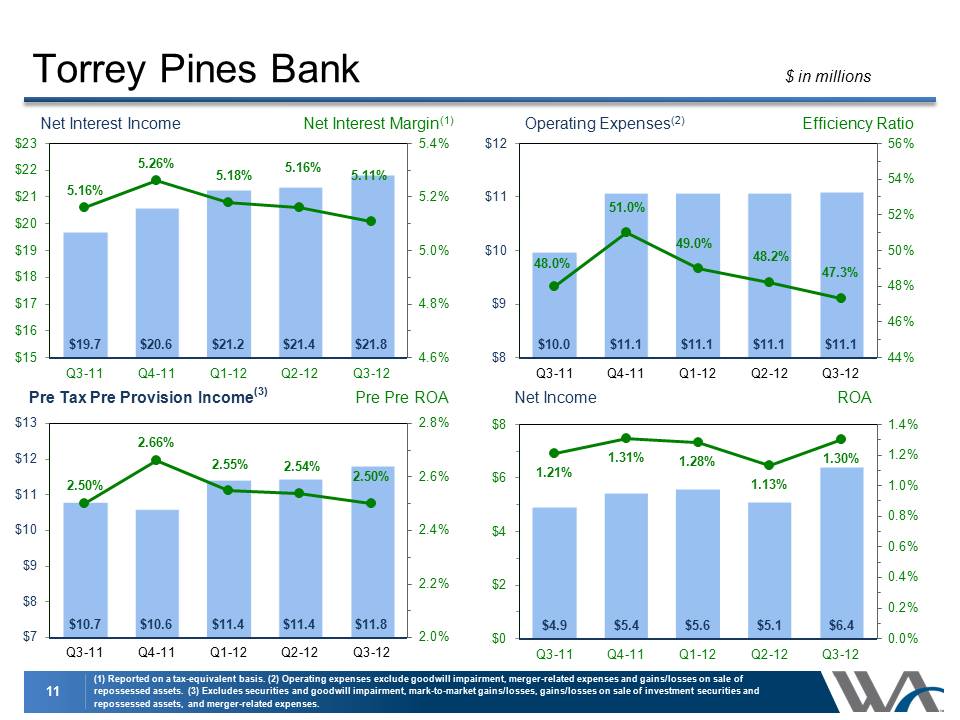
11 $19.7 $20.6 $21.2 $21.4 $21.8 5.16% 5.26% 5.18% 5.16% 5.11% 4.6% 4.8% 5.0% 5.2% 5.4% $15 $16 $17 $18 $19 $20 $21 $22 $23 Q3-11 Q4-11 Q1-12 Q2-12 Q3-12 $10.0 $11.1 $11.1 $11.1 $11.1 48.0% 51.0% 49.0% 48.2% 47.3% 44% 46% 48% 50% 52% 54% 56% $8 $9 $10 $11 $12 Q3-11 Q4-11 Q1-12 Q2-12 Q3-12 Torrey Pines Bank (1) Reported on a tax-equivalent basis. (2) Operating expenses exclude goodwill impairment, merger-related expenses and gains/losses on sale of repossessed assets. (3) Excludes securities and goodwill impairment, mark-to-market gains/losses, gains/losses on sale of investment securities and repossessed assets, and merger-related expenses. Net Interest Income Operating Expenses(2) $ in millions Net Interest Margin(1) Efficiency Ratio Pre Pre ROA $10.7 $10.6 $11.4 $11.4 $11.8 2.50% 2.66% 2.55% 2.54% 2.50% 2.0% 2.2% 2.4% 2.6% 2.8% $7 $8 $9 $10 $11 $12 $13 Q3-11 Q4-11 Q1-12 Q2-12 Q3-12 ROA $4.9 $5.4 $5.6 $5.1 $6.4 1.21% 1.31% 1.28% 1.13% 1.30% 0.0% 0.2% 0.4% 0.6% 0.8% 1.0% 1.2% 1.4% $0 $2 $4 $6 $8 Q3-11 Q4-11 Q1-12 Q2-12 Q3-12 Net Income Pre Tax Pre Provision Income(3)
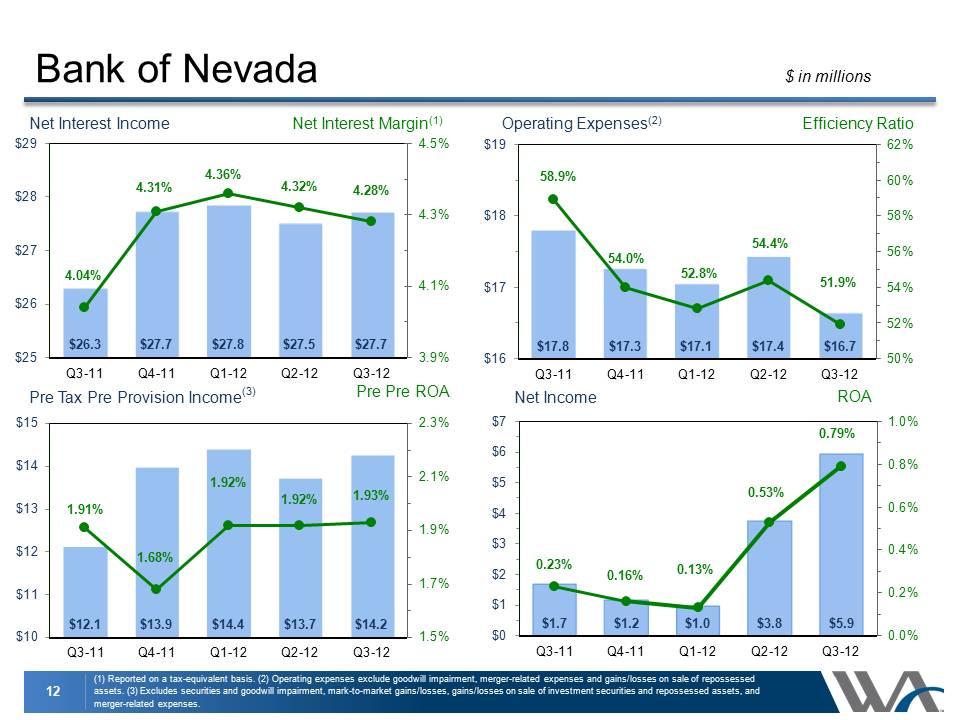
12 $26.3 $27.7 $27.8 $27.5 $27.7 4.04% 4.31% 4.36% 4.32% 4.28% 3.9% 4.1% 4.3% 4.5% $25 $26 $27 $28 $29 Q3-11 Q4-11 Q1-12 Q2-12 Q3-12 $17.8 $17.3 $17.1 $17.4 $16.7 58.9% 54.0% 52.8% 54.4% 51.9% 50% 52% 54% 56% 58% 60% 62% $16 $17 $18 $19 Q3-11 Q4-11 Q1-12 Q2-12 Q3-12 Bank of Nevada (1) Reported on a tax-equivalent basis. (2) Operating expenses exclude goodwill impairment, merger-related expenses and gains/losses on sale of repossessed assets. (3) Excludes securities and goodwill impairment, mark-to-market gains/losses, gains/losses on sale of investment securities and repossessed assets, and merger-related expenses. Net Interest Income Operating Expenses(2) $ in millions Net Interest Margin(1) Efficiency Ratio Pre Pre ROA $12.1 $13.9 $14.4 $13.7 $14.2 1.91% 1.68% 1.92% 1.92% 1.93% 1.5% 1.7% 1.9% 2.1% 2.3% $10 $11 $12 $13 $14 $15 Q3-11 Q4-11 Q1-12 Q2-12 Q3-12 ROA $1.7 $1.2 $1.0 $3.8 $5.9 0.23% 0.16% 0.13% 0.53% 0.79% 0.0% 0.2% 0.4% 0.6% 0.8% 1.0% $0 $1 $2 $3 $4 $5 $6 $7 Q3-11 Q4-11 Q1-12 Q2-12 Q3-12 Net Income Pre Tax Pre Provision Income(3)
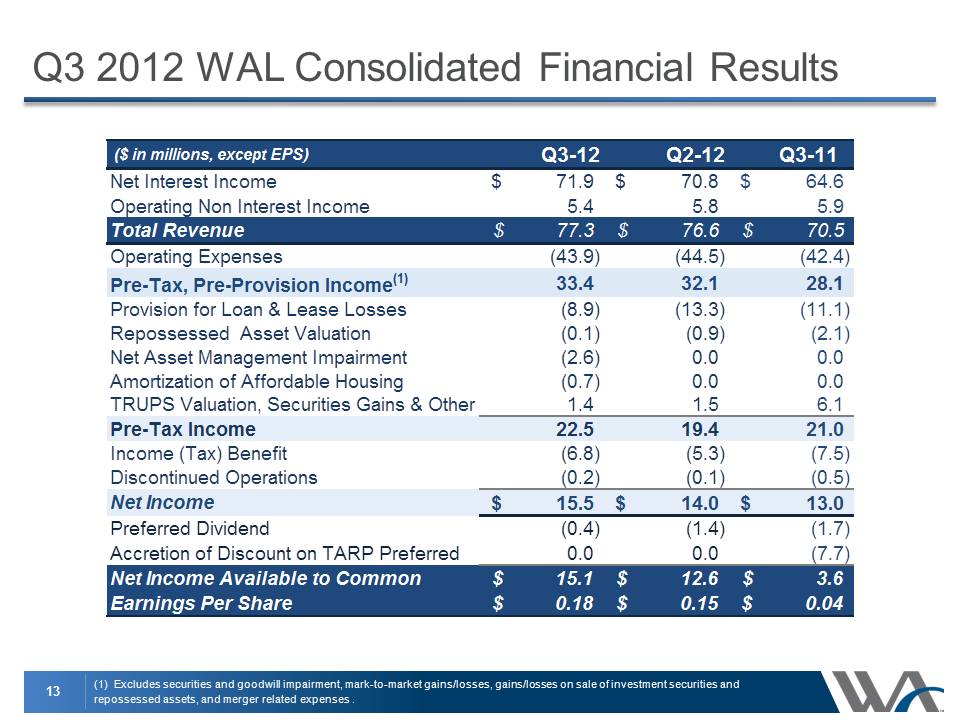
13 Q3 2012 WAL Consolidated Financial Results (1) Excludes securities and goodwill impairment, mark-to-market gains/losses, gains/losses on sale of investment securities and repossessed assets, and merger related expenses . ($ in millions, except EPS) Q3-12Q2-12Q3-11 Net Interest Income 71.9$ 70.8$ 64.6$ Operating Non Interest Income5.45.85.9Total Revenue77.3$ 76.6$ 70.5$ Operating Expenses(43.9)(44.5)(42.4)Pre-Tax, Pre-Provision Income(1)33.432.128.1 Provision for Loan & Lease Losses (8.9)(13.3)(11.1)Repossessed Asset Valuation (0.1)(0.9)(2.1)Net Asset Management Impairment(2.6)0.00.0Amortization of Affordable Housing(0.7)0.00.0TRUPS Valuation, Securities Gains & Other Items1.41.56.1Pre-Tax Income 22.519.421.0Income (Tax) Benefit(6.8)(5.3)(7.5)Discontinued Operations(0.2)(0.1)(0.5)Net Income 15.5$ 14.0$ 13.0$ Preferred Dividend(0.4)(1.4)(1.7)Accretion of Discount on TARP Preferred0.00.0(7.7)Net Income Available to Common 15.1$ 12.6$ 3.6$ Earnings Per Share0.18$ 0.15$ 0.04$
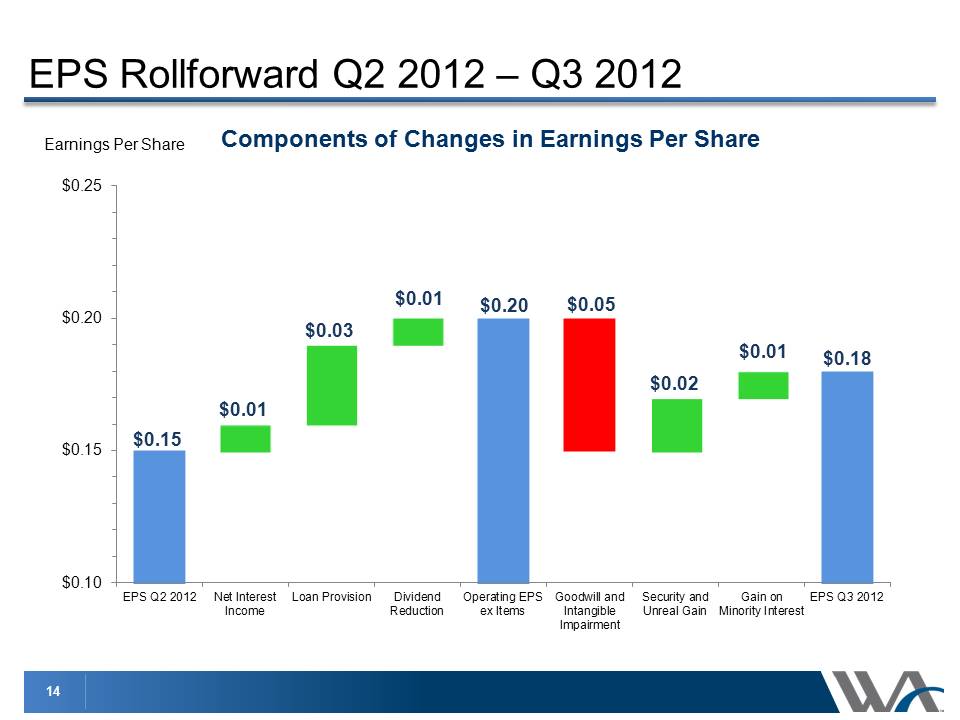
14 Components of Changes in Earnings Per Share $0.15 $0.01 $0.03 $0.01 $0.20 $0.05 $0.02 $0.01 $0.18 $0.10 $0.15 $0.20 $0.25 EPS Q2 2012 Net Interest Income Loan Provision Dividend Reduction Operating EPS ex Items Goodwill and Intangible Impairment Security and Unreal Gain Gain on Minority Interest EPS Q3 2012 EPS Rollforward Q2 2012 – Q3 2012 Earnings Per Share
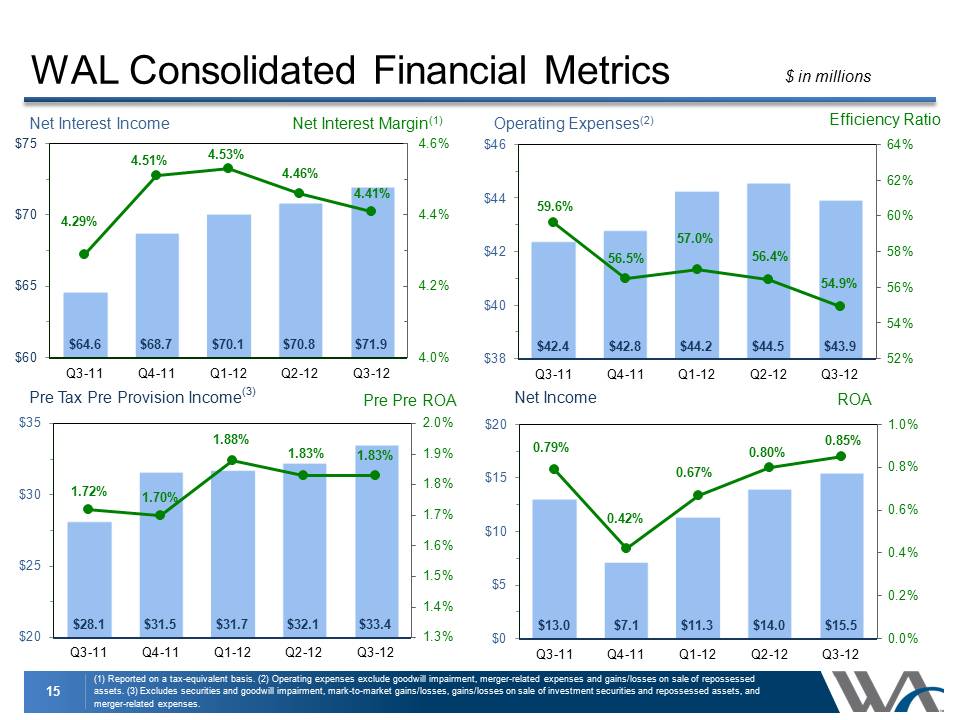
15 $42.4 $42.8 $44.2 $44.5 $43.9 59.6% 56.5% 57.0% 56.4% 54.9% 52% 54% 56% 58% 60% 62% 64% $38 $40 $42 $44 $46 Q3-11 Q4-11 Q1-12 Q2-12 Q3-12 WAL Consolidated Financial Metrics (1) Reported on a tax-equivalent basis. (2) Operating expenses exclude goodwill impairment, merger-related expenses and gains/losses on sale of repossessed assets. (3) Excludes securities and goodwill impairment, mark-to-market gains/losses, gains/losses on sale of investment securities and repossessed assets, and merger-related expenses. Net Interest Income Operating Expenses(2) $ in millions Net Interest Margin(1) Efficiency Ratio Pre Pre ROA $28.1 $31.5 $31.7 $32.1 $33.4 1.72% 1.70% 1.88% 1.83% 1.83% 1.3% 1.4% 1.5% 1.6% 1.7% 1.8% 1.9% 2.0% $20 $25 $30 $35 Q3-11 Q4-11 Q1-12 Q2-12 Q3-12 ROA $13.0 $7.1 $11.3 $14.0 $15.5 0.79% 0.42% 0.67% 0.80% 0.85% 0.0% 0.2% 0.4% 0.6% 0.8% 1.0% $0 $5 $10 $15 $20 Q3-11 Q4-11 Q1-12 Q2-12 Q3-12 Net Income $64.6 $68.7 $70.1 $70.8 $71.9 4.29% 4.51% 4.53% 4.46% 4.41% 4.0% 4.2% 4.4% 4.6% $60 $65 $70 $75 Q3-11 Q4-11 Q1-12 Q2-12 Q3-12 Pre Tax Pre Provision Income(3)
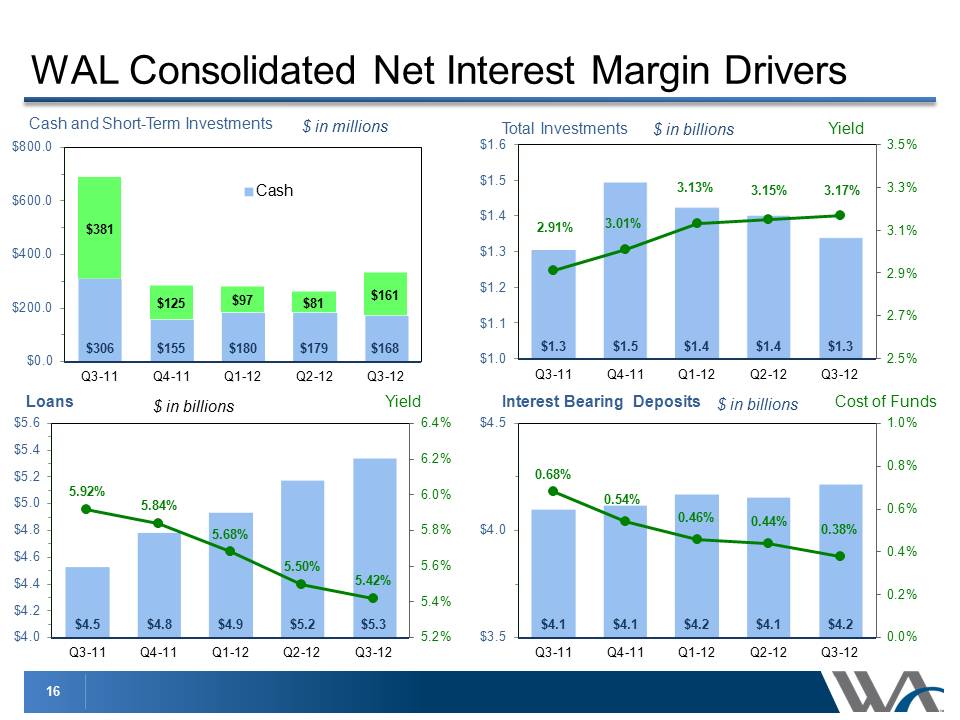
16 $306 $155 $180 $179 $168 $381 $125 $97 $81 $161 $0.0 $200.0 $400.0 $600.0 $800.0 Q3-11 Q4-11 Q1-12 Q2-12 Q3-12 Cash Short-Term Investments $1.3 $1.5 $1.4 $1.4 $1.3 2.91% 3.01% 3.13% 3.15% 3.17% 2.5% 2.7% 2.9% 3.1% 3.3% 3.5% $1.0 $1.1 $1.2 $1.3 $1.4 $1.5 $1.6 Q3-11 Q4-11 Q1-12 Q2-12 Q3-12 WAL Consolidated Net Interest Margin Drivers Cash and Short-Term Investments Loans $ in billions Yield $4.5 $4.8 $4.9 $5.2 $5.3 5.92% 5.84% 5.68% 5.50% 5.42% 5.2% 5.4% 5.6% 5.8% 6.0% 6.2% 6.4% $4.0 $4.2 $4.4 $4.6 $4.8 $5.0 $5.2 $5.4 $5.6 Q3-11 Q4-11 Q1-12 Q2-12 Q3-12 Interest Bearing Deposits Cost of Funds $4.1 $4.1 $4.2 $4.1 $4.2 0.68% 0.54% 0.46% 0.44% 0.38% 0.0% 0.2% 0.4% 0.6% 0.8% 1.0% $3.5 $4.0 $4.5 Q3-11 Q4-11 Q1-12 Q2-12 Q3-12 Total Investments Yield $ in billions $ in billions $ in millions
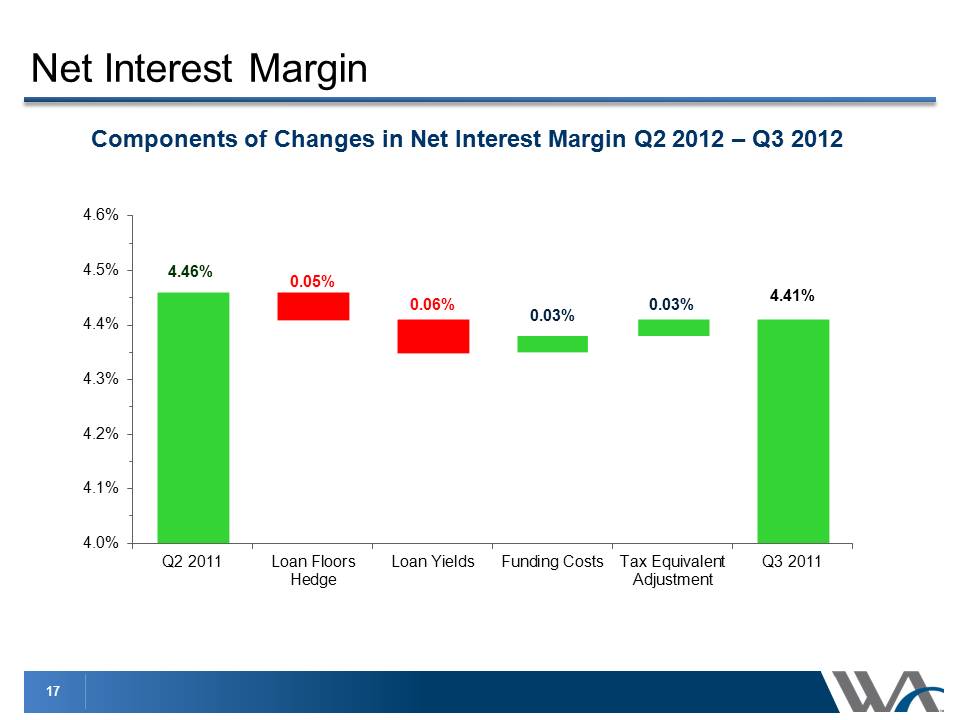
17 Components of Changes in Net Interest Margin Q2 2012 – Q3 2012 4.46% 0.05% 0.06% 0.03% 0.03% 4.0% 4.1% 4.2% 4.3% 4.4% 4.5% 4.6% Q2 2011 Loan Floors Hedge Loan Yields Funding Costs Tax Equivalent Adjustment Q3 2011 4.41% Net Interest Margin
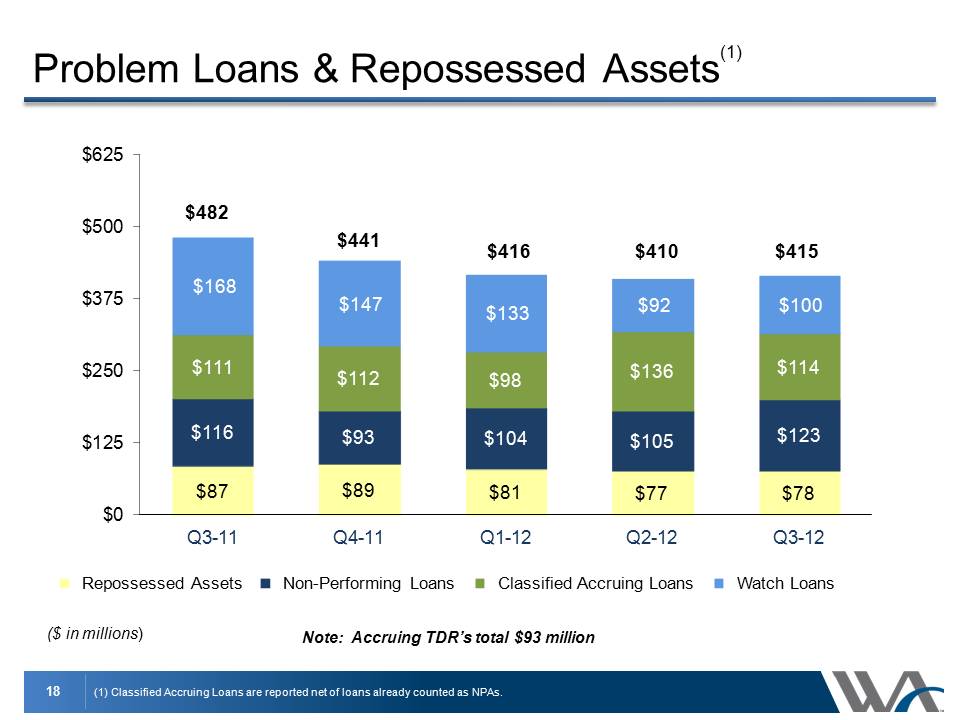
18 $87 $89 $81 $77 $78 $116 $93 $104 $105 $123 $111 $112 $98 $136 $114 $168 $147 $133 $92 $100 $0 $125 $250 $375 $500 $625 Q3-11 Q4-11 Q1-12 Q2-12 Q3-12 Repossessed Assets Non-Performing Loans Classified Accruing Loans Watch Loans $482 $441 $416 $410 $415 Problem Loans & Repossessed Assets(1) (1) Classified Accruing Loans are reported net of loans already counted as NPAs. ($ in millions) Note: Accruing TDR’s total $93 million
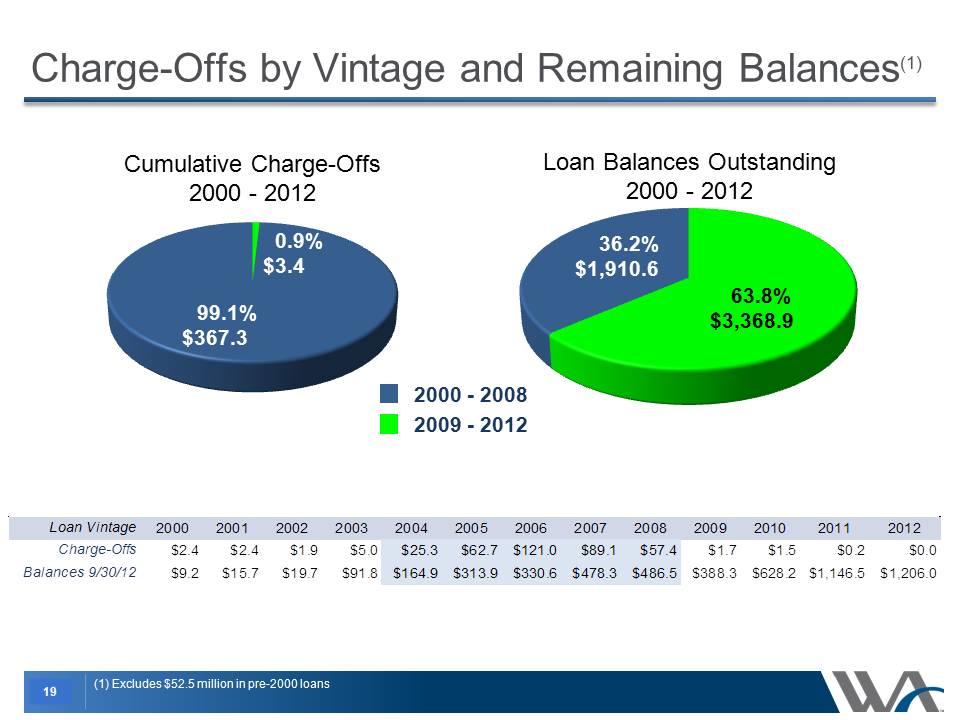
19 80.0% 20.0% Charge-Offs by Vintage and Remaining Balances(1) Cumulative Charge-Offs 2000 - 2012 Loan Balances Outstanding 2000 - 2012 2000 - 2008 2009 - 2012 63.8% $3,368.9 0.9% $3.4 99.1% $367.3 2000 2001 2002 2003 2004 2005 2006 2007 2008 2009 2010 2011 2012 Charge Offs $2.4$2.4 $1.9 $5.0 $25.3 $62.7 $121.0 $89.1 $57.4 $1.7 $1.5 $0.2 $0.0 Balances $9.2 $15.7 $19.7 $91.8 $164.9 $313.9 $330.6 $478.3 $486.5 $388.3 $628.2 $1,146.5 $1,206.0 36.2% $1,910.6 (1) Excludes $52.5 million in pre-2000 loans
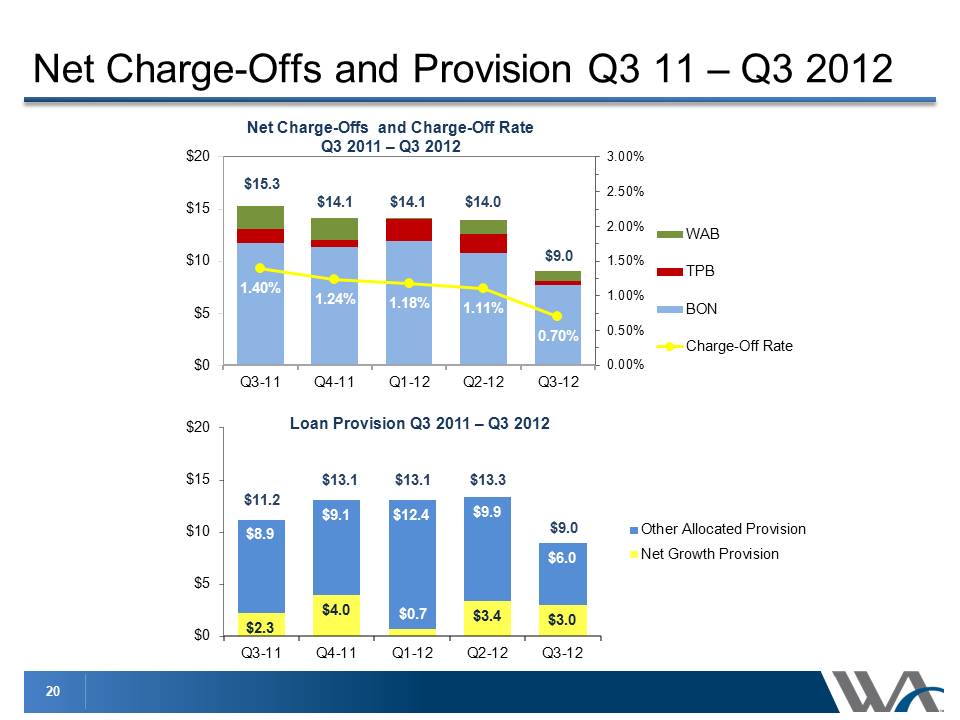
20 $2.3 $4.0 $0.7 $3.4 $3.0 $8.9 $9.1 $12.4 $9.9 $6.0 $0 $5 $10 $15 $20 Q3-11 Q4-11 Q1-12 Q2-12 Q3-12 Other Allocated Provision Net Growth Provision Net Charge-Offs and Provision Q3 11 – Q3 2012 1.40% 1.24% 1.18% 1.11% 0.70% 0.00% 0.50% 1.00% 1.50% 2.00% 2.50% 3.00% $0 $5 $10 $15 $20 Q3-11 Q4-11 Q1-12 Q2-12 Q3-12 WAB TPB BON Charge-Off Rate Net Charge-Offs and Charge-Off Rate Q3 2011 – Q3 2012 $15.3 $14.1 $14.1 $9.0 $14.0 Loan Provision Q3 2011 – Q3 2012 $11.2 $13.1 $13.1 $13.3 $9.0
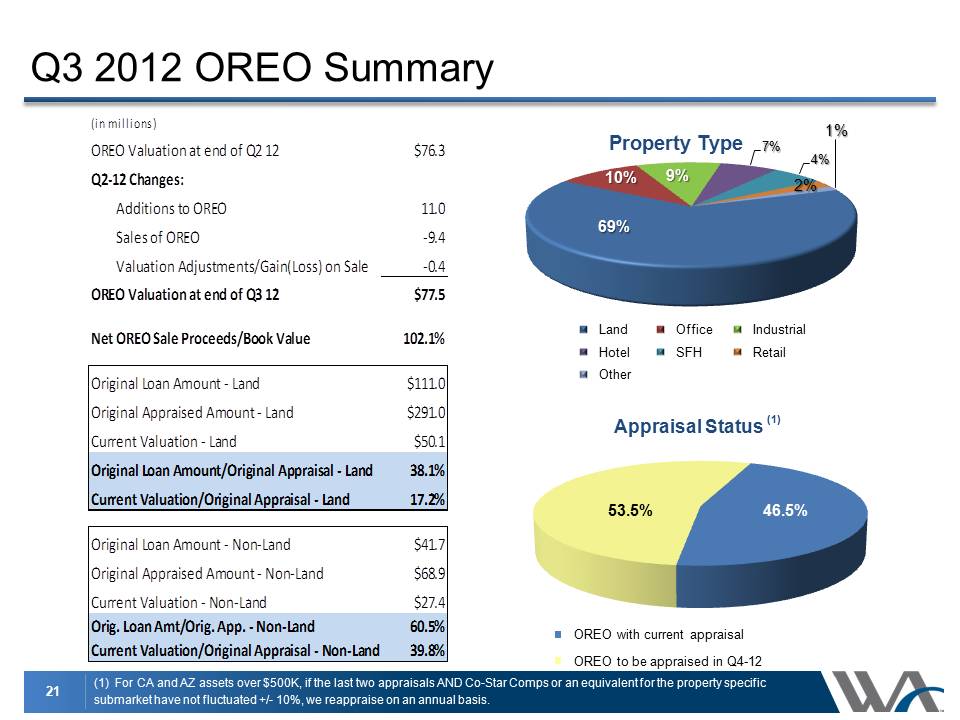
21 Q3 2012 OREO Summary 69% 10% 9% 7% 4% 2% 1% Property Type Land Office Industrial Hotel SFH Retail Other Appraisal Status (1) OREO with current appraisal OREO to be appraised in Q4-12 (in millions)OREO Valuation at end of Q2 12$76.3Q2-12 Changes:Additions to OREO11.0Sales of OREO-9.4Valuation Adjustments/Gain(Loss) on Sale-0.4OREO Valuation at end of Q3 12$77.5Net OREO Sale Proceeds/Book Value102.1%Original Loan Amount - Land$111.0Original Appraised Amount - Land$291.0Current Valuation - Land$50.1Original Loan Amount/Original Appraisal - Land38.1%Current Valuation/Original Appraisal - Land17.2%Original Loan Amount - Non-Land$41.7Original Appraised Amount - Non-Land$68.9Current Valuation - Non-Land$27.4Orig. Loan Amt/Orig. App. - Non-Land60.5%Current Valuation/Original Appraisal - Non-Land39.8% (1) For CA and AZ assets over $500K, if the last two appraisals AND Co-Star Comps or an equivalent for the property specific submarket have not fluctuated +/- 10%, we reappraise on an annual basis. 46.5% 53.5%
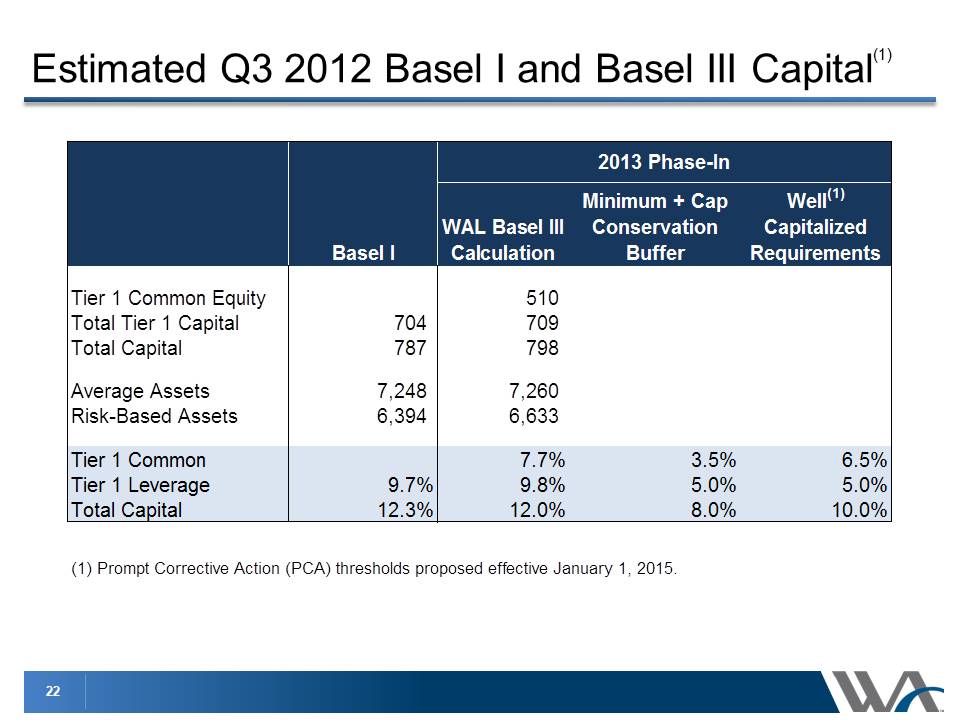
22 Estimated Q3 2012 Basel I and Basel III Capital(1) Basel IWAL Basel III CalculationMinimum + Cap Conservation BufferWell(1) Capitalized RequirementsTier 1 Common Equity510 Total Tier 1 Capital704 709 Total Capital787 798 Average Assets7,248 7,260 Risk-Based Assets 6,394 6,633 Tier 1 Common7.7%3.5%6.5%Tier 1 Leverage9.7%9.8%5.0%5.0%Total Capital12.3%12.0%8.0%10.0%(1) Prompt Corrective Action (PCA) thresholds proposed effective January 1, 2015.2013 Phase-In
23 Loan and deposit growth Net interest margin Efficiency ratio Asset quality Acquisition Integration Outlook 4th Quarter 2012
24 Question & Answer
25 This presentation contains forward-looking statements that relate to expectations, beliefs, projections, future plans and strategies, anticipated events or trends and similar expressions concerning matters that are not historical facts. The forward-looking statements contained herein reflect our current views about future events and financial performance and are subject to risks, uncertainties, assumptions and changes in circumstances that may cause our actual results to differ significantly from historical results and those expressed in any forward-looking statement. Some factors that could cause actual results to differ materially from historical or expected results include: factors listed in the Company’s annual report on Form 10-K as filed with the Securities and Exchange Commission; changes in general economic conditions, either nationally or locally in the areas in which we conduct or will conduct our business; inflation, interest rate, market and monetary fluctuations; increases in competitive pressures among financial institutions and businesses offering similar products and services; higher defaults on our loan portfolio than we expect; changes in management’s estimate of the adequacy of the allowance for loan losses; legislative or regulatory changes or changes in accounting principles, policies or guidelines; supervisory actions by regulatory agencies which may limit our ability to pursue certain growth opportunities; management’s estimates and projections of interest rates and interest rate policy; the execution of our business plan; and other factors affecting the financial services industry generally or the banking industry in particular. We do not intend and disclaim any duty or obligation to update or revise any industry information or forward-looking statements set forth in this presentation to reflect new information, future events or otherwise. Forward-Looking Information