Attached files
| file | filename |
|---|---|
| 8-K - FORM 8-K - BlackRock Inc. | d424760d8k.htm |
| EX-99.1 - PRESS RELEASE DATED OCTOBER 17, 2012 - BlackRock Inc. | d424760dex991.htm |
 Q3
2012 Earnings Press Release Supplement
October 17, 2012
Exhibit 99.2 |
 1
Important Notes
This presentation, and other statements that BlackRock may make, may contain forward-looking
statements within the meaning of the Private Securities Litigation Reform Act, with respect to
BlackRock’s future financial or business performance, strategies or expectations. Forward-looking
statements are typically identified by words or phrases such as “trend,”
“potential,” “opportunity,” “pipeline,” “believe,” “comfortable,” “expect,”
“anticipate,” “current,” “intention,” “estimate,”
“position,” “assume,” “outlook,” “continue,” “remain,” “maintain,” “sustain,” “seek,” “achieve,” and
similar expressions, or future or conditional verbs such as “will,” “would,”
“should,” “could,” “may” or similar expressions.
BlackRock cautions that forward-looking statements are subject to numerous assumptions, risks and
uncertainties, which change over time. Forward-looking statements speak only as of
the date they are made, and BlackRock assumes no duty to and does not undertake to update
forward-looking statements. Actual results could differ materially from those anticipated in
forward-looking statements and future results could differ materially from historical
performance.
In addition to risk factors previously disclosed in BlackRock’s Securities and Exchange
Commission (“SEC”) reports and those identified elsewhere in this presentation the
following factors, among others, could cause actual results to differ materially from forward-looking statements
or historical performance: (1) the introduction, withdrawal, success and timing of business
initiatives and strategies; (2) changes and volatility in political, economic or industry
conditions, the interest rate environment, foreign exchange rates or financial and capital markets, which could result
in changes in demand for products or services or in the value of assets under management; (3) the
relative and absolute investment performance of BlackRock’s investment products; (4) the
impact of increased competition; (5) the impact of future acquisitions or divestitures; (6) the
unfavorable resolution of legal proceedings; (7) the extent and timing of any share repurchases; (8)
the impact, extent and timing of technological changes and the adequacy of intellectual
property and information security protection; (9) the impact of legislative and regulatory actions and
reforms, including the Dodd-Frank Wall Street Reform and Consumer Protection Act, and regulatory,
supervisory or enforcement actions of government agencies relating to BlackRock or The PNC
Financial Services Group, Inc. (“PNC”); (10) terrorist activities, international hostilities and
natural disasters, which may adversely affect the general economy, domestic and local financial and
capital markets, specific industries or BlackRock; (11) the ability to attract and retain
highly talented professionals; (12) fluctuations in the carrying value of BlackRock’s economic
investments; (13) the impact of changes to tax legislation, including income, payroll and transaction
taxes, and taxation on products or transactions, which could affect the value proposition to
clients and, generally, the tax position of the Company; (14) BlackRock’s success in
maintaining the distribution of its products; (15) the impact of BlackRock electing to provide support
to its products from time to time and any liabilities related to securities lending or other
indemnification obligations; and (16) the impact of problems at other financial institutions or the
failure or negative performance of products at other financial institutions. This
presentation also includes non-GAAP financial measures. You can find our presentations on the most directly comparable GAAP financial
measures calculated in accordance with GAAP and our reconciliations in the appendix to this earnings
release supplement, our current earnings release dated October 17, 2012, and BlackRock’s
other periodic reports, which are available on BlackRock’s web site at www.blackrock.com.
|
 2
Table of Contents
Operating and Net Income/Diluted EPS, as adjusted
Page 3
Operating Margin, as adjusted
Page 4
Q3 2012 Mix by Product, Client Type, Style and Region
Page 5
Market Indices
Page 6
Year-over-Year: Q3 2012 vs. Q3 2011
Pages 7-12
Sequential Quarters: Q3 2012 vs. Q2 2012
Pages 13-18
Non-operating and Cash Flow
Pages 19-21
Appendix
Pages 22-28 |
 3
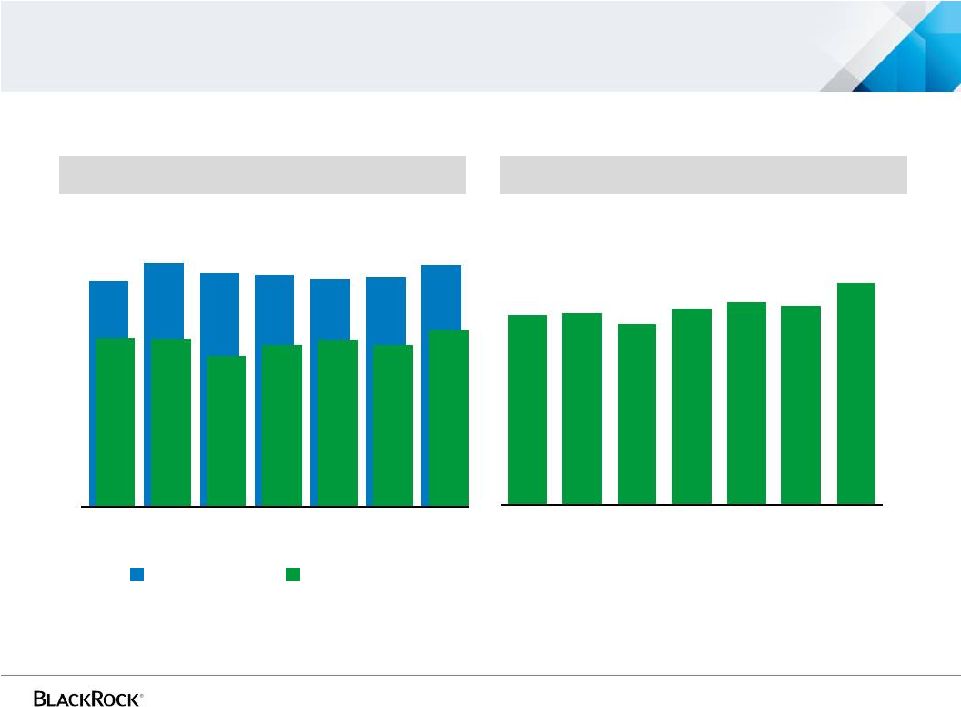
Record diluted EPS of $3.47, up 23% year-over-year and 12% sequentially
Operating and Net Income, as adjusted ($ in millions)
Diluted Earnings Per Share, as adjusted
For further information and reconciliation between GAAP and as adjusted, see the
appendix, notes (a) through (f) in the current earnings release as well as previously filed Form 10-Ks, 10-Qs and 8-Ks.
Operating Income
Net Income
$819
$883
$849
$841
$825
$832
$876
$582
$578
$521
$558
$575
$558
$610
$2.96
$3.00
$2.83
$3.06
$3.16
$3.10
$3.47
Q1
2011
Q2
2011
Q3
2011
Q4
2011
Q1
2012
Q2
2012
Q3
2012
Q1
2011
Q2
2011
Q3
2011
Q4
2011
Q1
2012
Q2
2012
Q3
2012 |
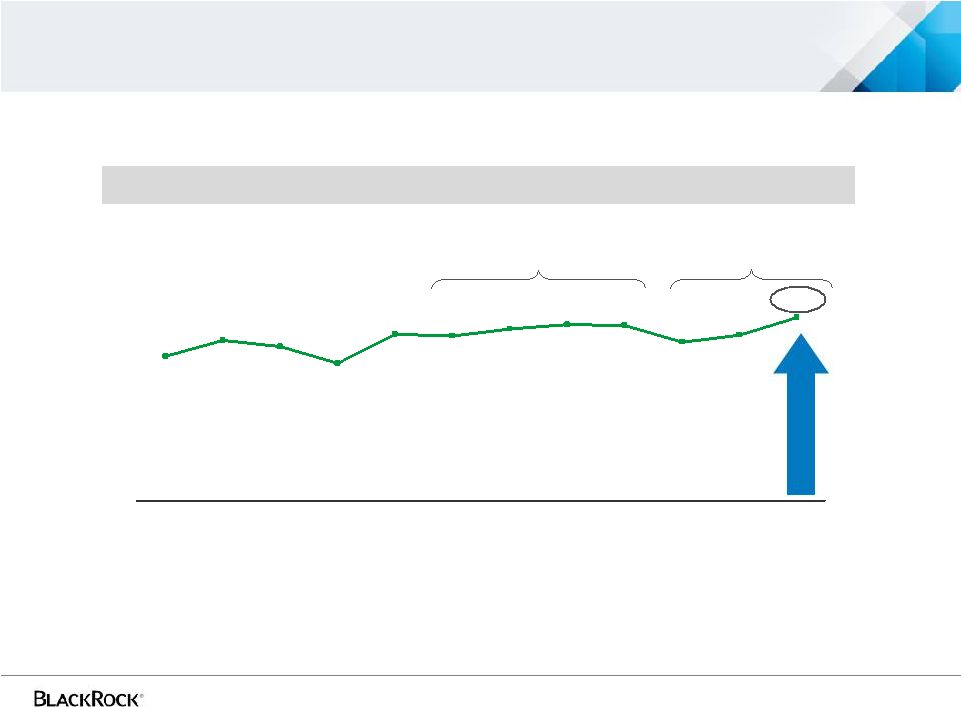 4
40.0%
38.6%
40.7%
39.2%
40.1%
39.7%
37.4%
38.7%
38.2%
36.8%
39.3%
39.1%
2007
2008
2009
2009
2010
Q1
2011
Q2
2011
Q3
2011
Q4
2011
Q1
2012
Q2
2012
Q3
2012
YTD 2012 = 39.5%
Sequential and year-over-year operating margin improvement
Operating Margin, as adjusted
For further information and reconciliation between GAAP and as adjusted, see the
appendix, notes (a) through (f) in the current earnings release as well as previously filed Form 10-Ks, 10-Qs and 8-Ks.
Full Year 2011 = 39.7%
BGI/BLK
Pro Forma |
 5
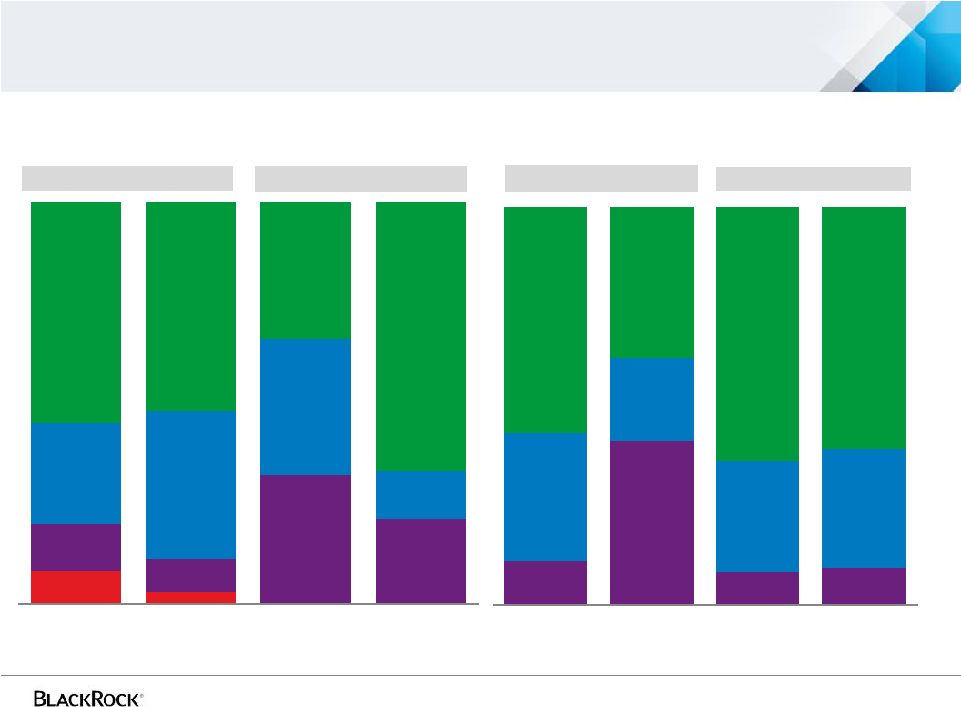
Q3 2012 Long-term Base Fees of $1.934 billion
Long-term Assets Under Management of $3.378 trillion at September 30,
2012
Q3 2012 mix by product, client type, style and region
Product Type
Client Type
Style
Region
Alternatives
8%
Alternatives 3%
Multi-Asset 12%
Multi-Asset 8%
Fixed Income
25%
Fixed Income
37%
Equity
55%
Equity
52%
iShares
32%
iShares
21%
Retail
34%
Retail
12%
Institutional
34%
Institutional
67%
Base Fees
AUM
Base Fees
AUM
Index
11%
Index
41%
iShares
32%
iShares
21%
Asia-Pacific
9%
Asia-Pacific
9%
EMEA
27%
EMEA
30%
Americas
64%
Americas
61%
Active
57%
Active
38%
Base Fees
AUM
Base Fees
AUM |
 6
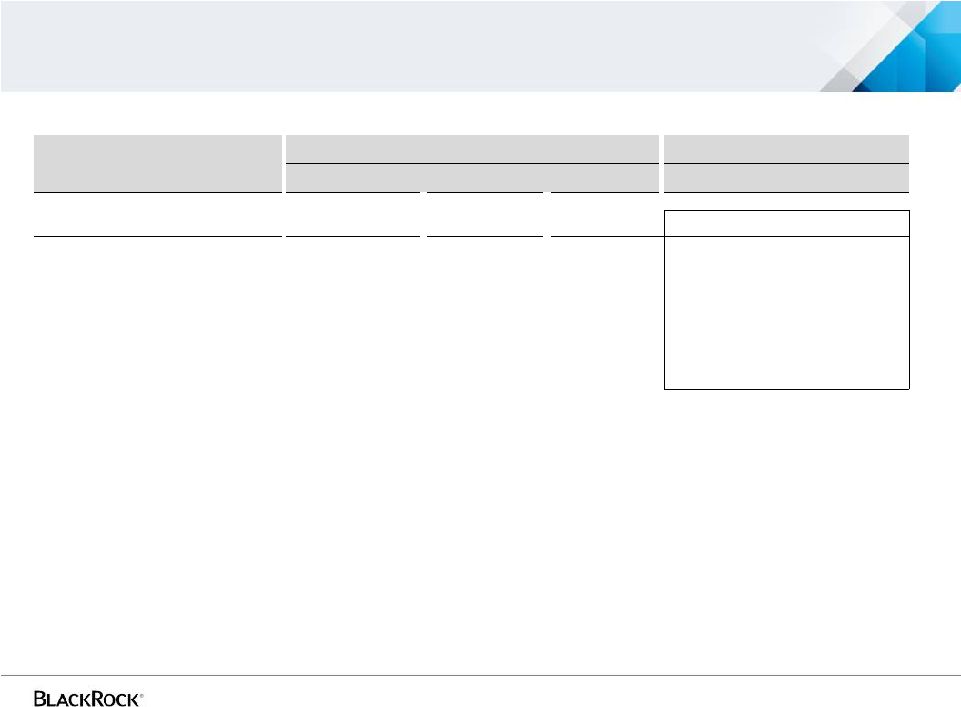
Major global equity markets indices
Index
Average Index Level
Q3 2012 vs.
Q3 2011
Q2 2012
Q3 2012
Q3 2011
Q2 2012
S&P 500
1,225
1,350
1,401
14.4%
3.8%
MSCI Barra World Index
1,216
1,233
1,274
4.8%
3.3%
MSCI Europe Index
84
86
92
9.5%
7.0%
MSCI AC Asia Pacific Index
126
118
119
(5.6%)
0.8%
MSCI Emerging Markets Index
1,035
963
961
(7.1%)
(0.2%)
S&P Global Natural Resources
3,585
3,209
3,291
(8.2%)
2.6% |
 Year-over-year
Q3 2012 vs. Q3 2011 |
 8
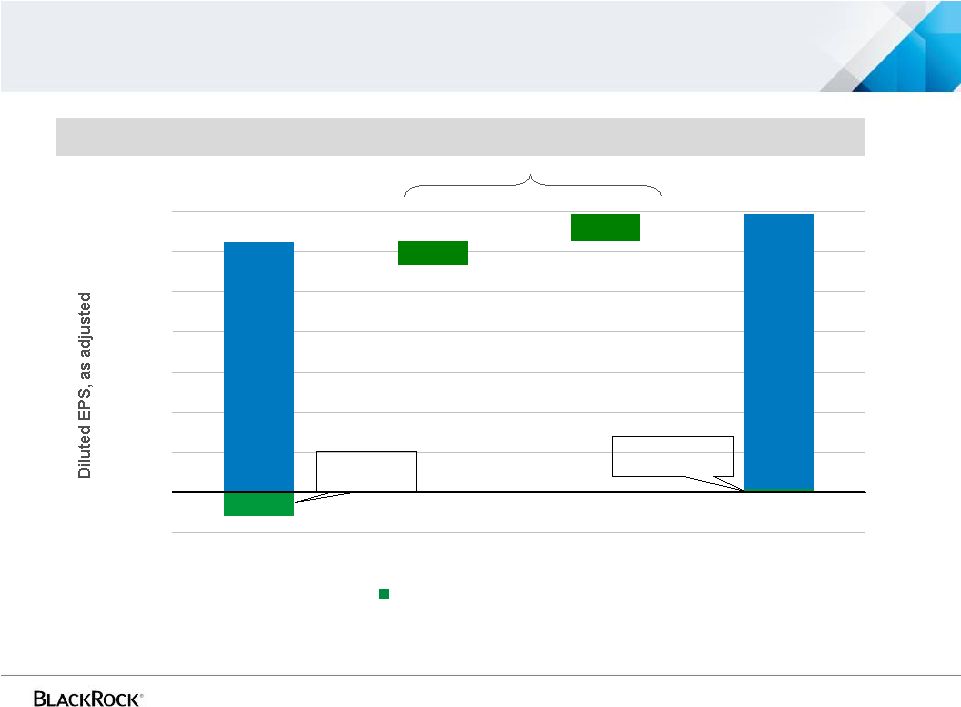
Record EPS up 23% year-over-year
$3.42
$0.30
$0.34
$3.12
($0.50)
$0.00
$0.50
$1.00
$1.50
$2.00
$2.50
$3.00
$3.50
Q3 2011 EPS
Operating EPS
Non-Operating EPS
Q3 2012 EPS
Q3 2012 Compared to Q3 2011, as adjusted
Total EPS:
$3.47
Total EPS:
$2.83
Non-Operating:
($0.29)
Operating
EPS:
Operating
EPS:
For further information and reconciliation between GAAP and as adjusted, see the
appendix and notes (a) through (f) in the current earnings release.
Non-Operating:
$0.05
$0.64
Increasing EPS |
 9
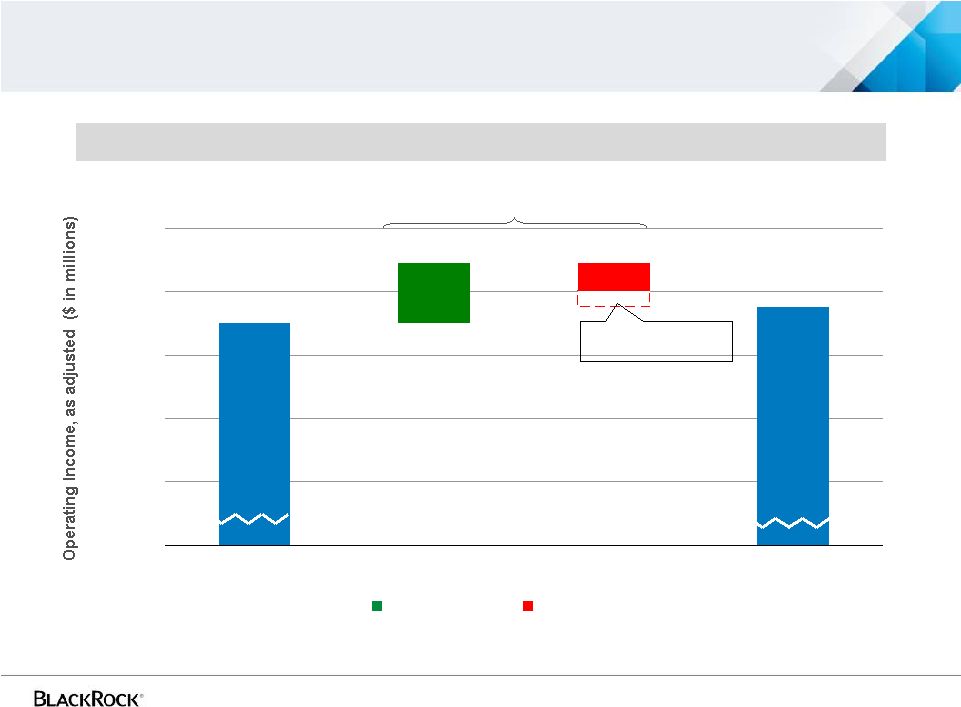
Year-over-year operating income reflected growth in markets and flows
Q3 2012 Compared to Q3 2011, as adjusted
For further information and reconciliation between GAAP and as adjusted, see the
appendix and notes (a) through (f) in the current earnings release.
Increasing Revenue
Increasing Expense
$27 million
($68)
$876
$849
$95
($43)
$600
$700
$800
$900
$1,000
Q3 2011
Revenue
Expenses
Q3 2012
$0
($25) Fund Launch Costs |
 10
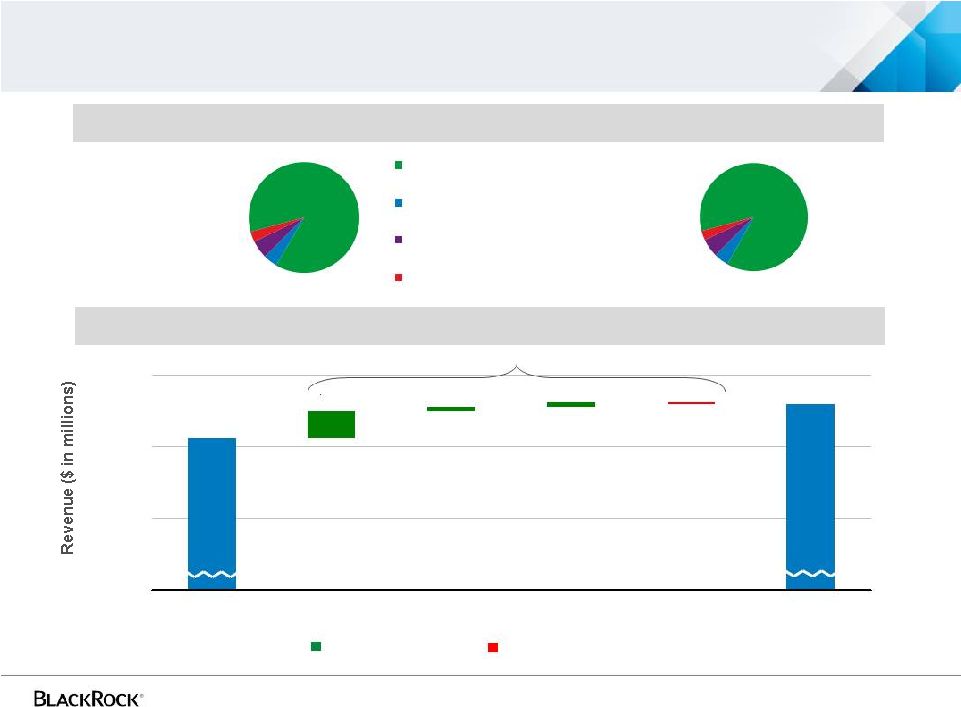
Year-over-year revenue reflected market growth, net inflows and improved
performance Q3 2012 Compared to Q3 2011
$0
$95 million
Total Revenue
Q3 2011
$2.23 billion
Q3 2012
$2.32 billion
Decreasing Revenue
Increasing Revenue
88%
4%
5%
3%
Base Fees
Performance Fees
BRS and Advisory
Other Revenue/Distribution
Fees
87%
4%
6%
3%
$2,225
$2,320
$75
$12
$11
($3)
$2,000
$2,200
$2,400
Q3 2011
Base Fees
Performance Fees
BRS & Advisory
Other Revenue /
Distribution Fees
Q3 2012 |
 11
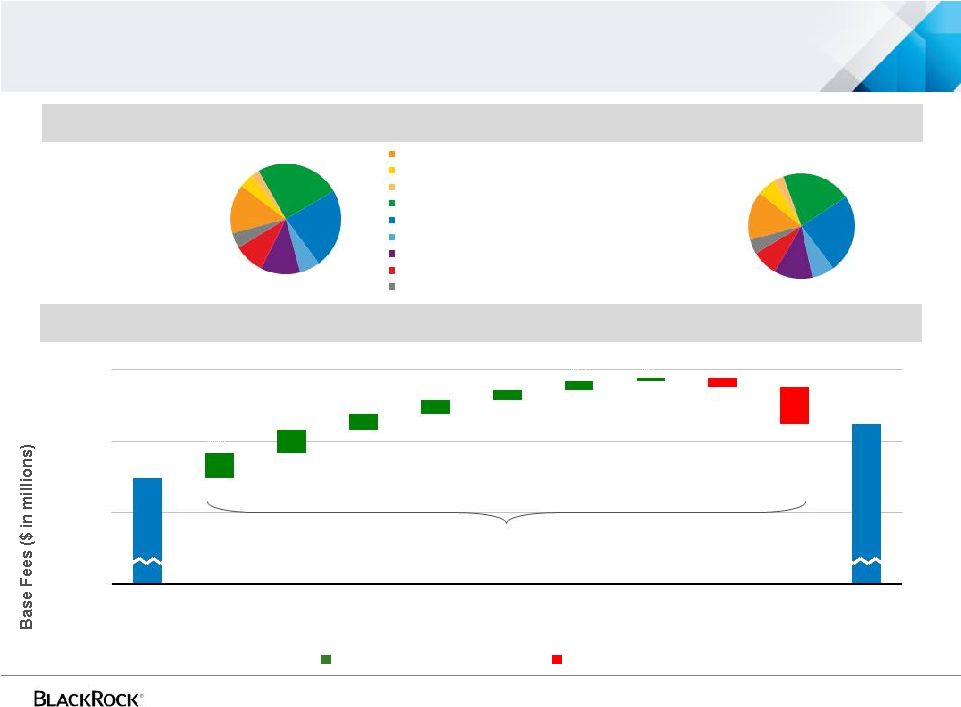
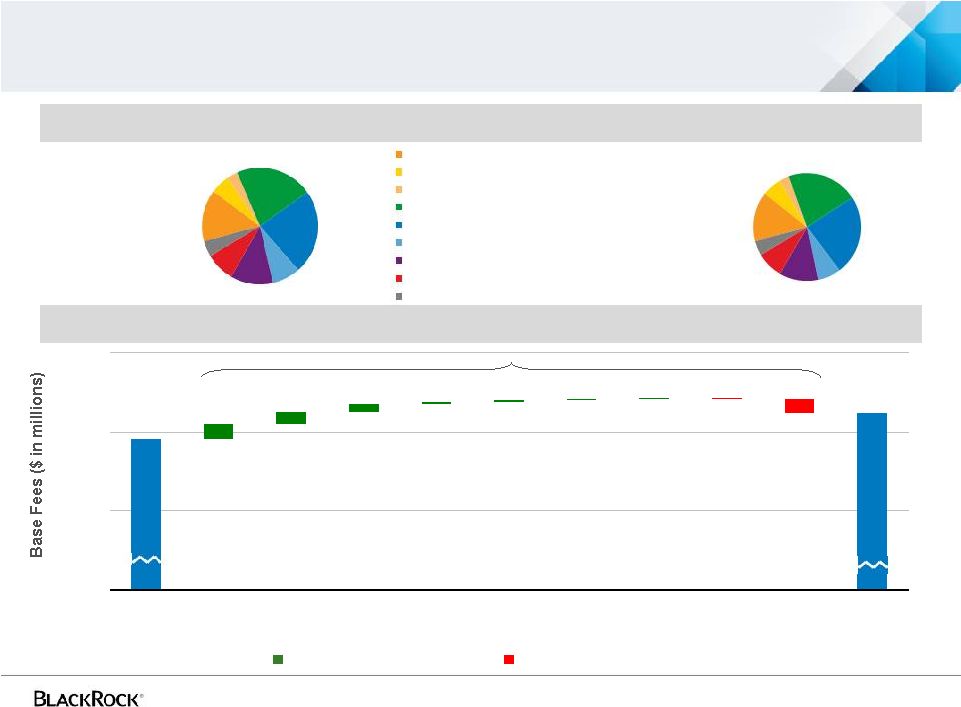
Year-over-year base fees reflected growth in index and income products
Q3 2012 Compared to Q3 2011
Base fees
14%
4%
2%
26%
23%
6%
12%
9%
4%
Active Fixed Income
iShares Fixed Income
Institutional Index Fixed Income
Active Equity
iShares Equity
Institutional Index Equity
Multi
Asset
Alternatives
Cash
Q3 2011
$1.95 billion
15%
6%
3%
21%
24%
7%
12%
8%
4%
Q3 2012
$2.02 billion
$2,024
$1,949
($52)
($13)
$4
$13
$14
$20
$22
$32
$35
$0
$1,900
$2,000
$2,100
Q3 2011
iShares
Fixed
Income
iShares
Equity
Institutional
Index Equity
Active Fixed
Income
Institutional
Index Fixed
Income
Multi-Asset
Cash
Alternatives
Active Equity
Q3 2012
$75 million
Increasing Base Fees
Decreasing Base Fees |
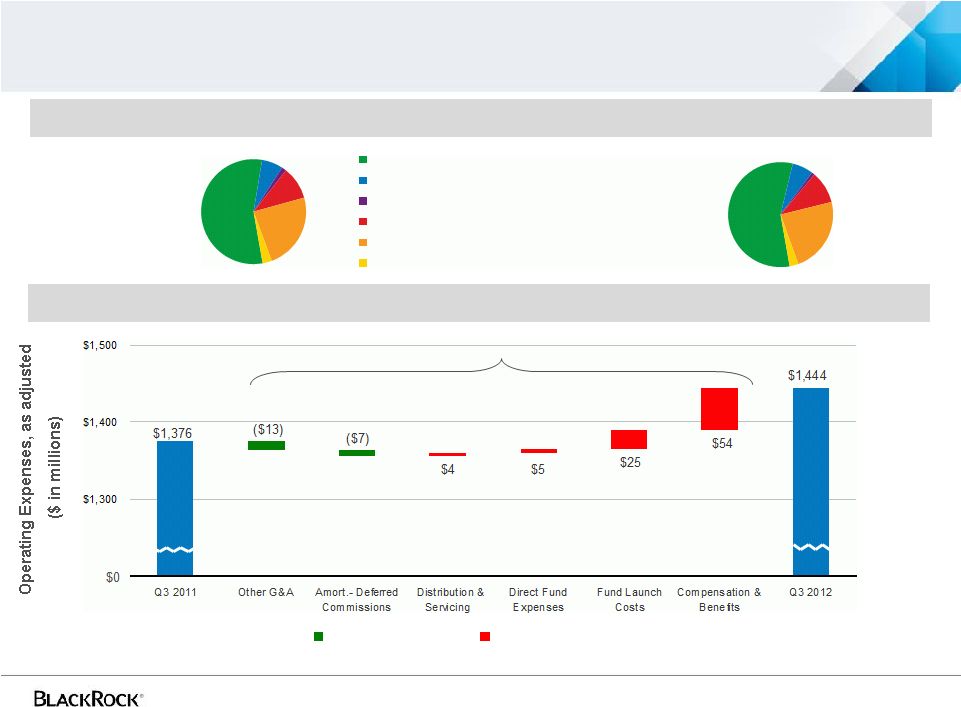 12
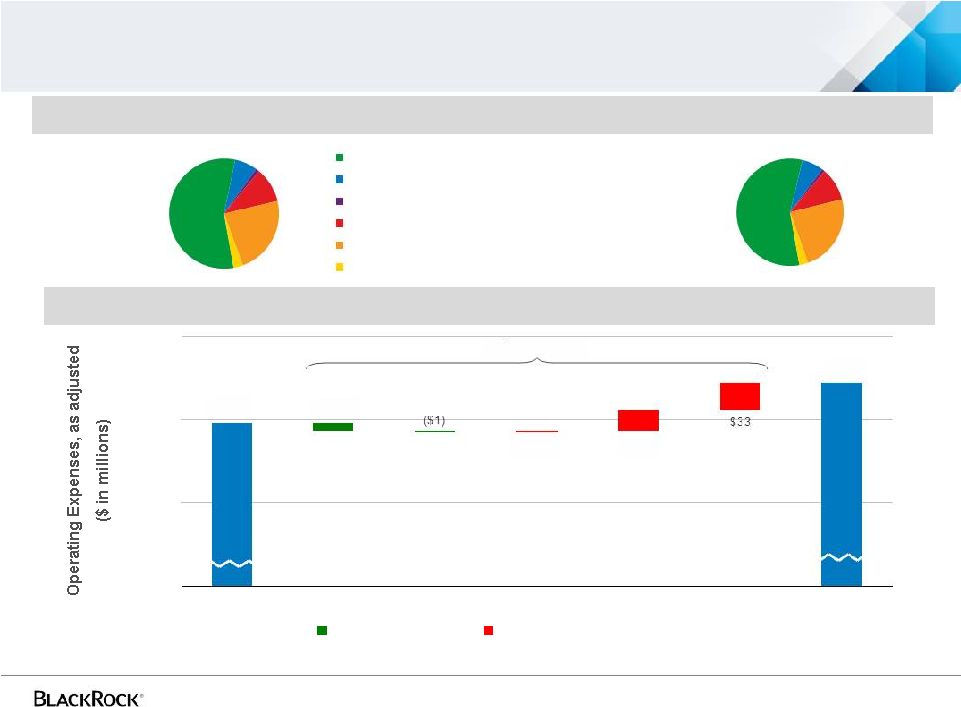
Year-over-year expenses reflected revenue growth and fund launch costs
Increasing Expenses
Decreasing Expenses
Q3 2012
$1.44 billion
Expenses, as adjusted, by Category
Q3 2012 Compared to Q3 2011, as adjusted
Q3 2011
$1.38 billion
$68 million
55%
7%
1%
10%
24%
3%
Employee Comp. & Benefits
Distribution & Servicing Costs
Amort. of Deferred Sales Commissions
Direct Fund Expenses
General & Administration
Amortization of Intangibles
56%
7%
1%
10%
23%
3%
(1)
(1)
Amounts exclude fund launch costs which are presented separately above.
For further information and reconciliation between GAAP and as adjusted, see the appendix and notes (a) through (f) in the current earnings release.
(1) |
 Sequential Quarters
Q3 2012 vs. Q2 2012 |
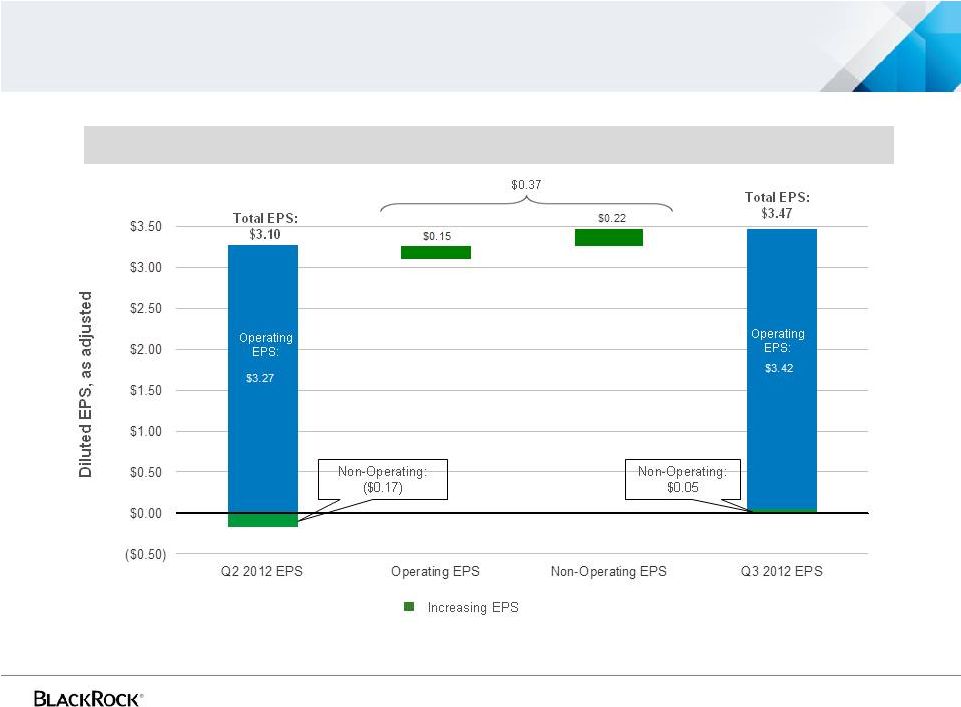 14
Sequential EPS up 12%
For further information and reconciliation between GAAP and as adjusted, see the
appendix and notes (a) through (f) in the current earnings release. Q3 2012
Compared to Q2 2012, as adjusted |
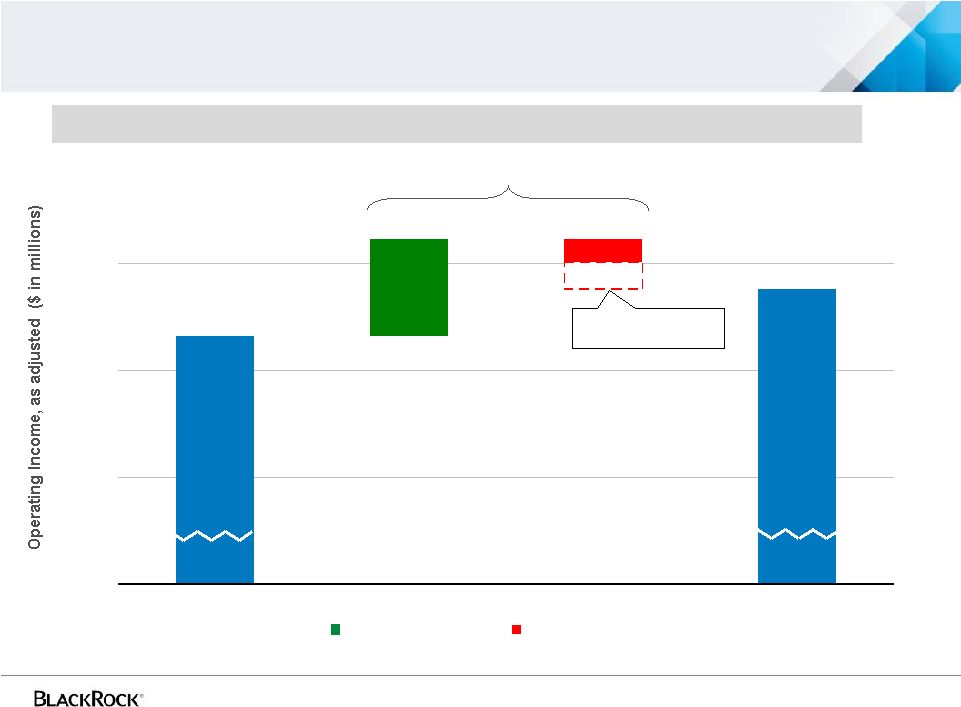 15
Q3 2012 operating income reflected market effects and positive flows
Q3 2012 Compared to Q2 2012, as adjusted
$44 million
$0
For further information and reconciliation between GAAP and as adjusted, see the
appendix and notes (a) through (f) in the current earnings release.
Increasing Revenue
Increasing Expense
($25) Fund Launch Costs
($47)
$876
$832
$91
($22)
$700
$800
$900
Q2 2012
Revenue
Expenses
Q3 2012 |
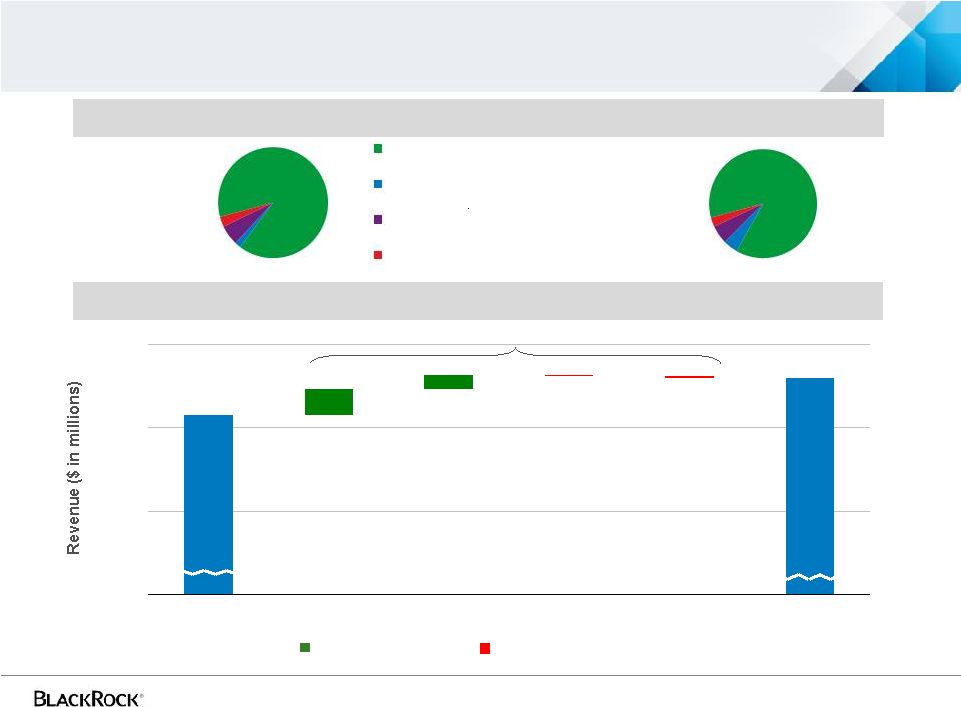 16
Sequential revenue reflected higher performance and base fees
$91 million
Decreasing Revenue
$0
Q3 2012 Compared to Q2 2012
Increasing Revenue
Total Revenue
Q3 2012
$2.32 billion
Q2 2012
$2.23 billion
$2,229
$2,320
($2)
$62
($3)
$34
$2,000
$2,200
$2,400
Q2 2012
Performance Fees
Base Fees
BRS & Advisory
Other Revenue /
Distribution Fees
Q3 2012
89%
2%
6%
3%
Base Fees
Performance Fees
BRS and Advisory
Other Revenue/Distribution
Fees
87%
4%
6%
3% |
 17
Sequential base fees reflected growth in AUM and lower seasonal securities
lending $34 million
Increasing Base Fees
Base Fees
Q3 2012 Compared to Q2 2012
Decreasing Base Fees
Q3 2012
$2.02 billion
15%
6%
3%
21%
24%
7%
12%
8%
4%
14%
5%
3%
22%
23%
8%
12%
9%
4%
Active Fixed Income
iShares Fixed Income
Institutional Index Fixed Income
Active Equity
iShares Equity
Institutional Index Equity
Multi
Asset
Alternatives
Cash
Q2 2012
$1.99 billion
$1,990
($17)
($1)
$1
$2
$2
$3
$9
$16
$19
$2,024
$0
$1,900
$2,000
$2,100
Q2 2012
iShares
Equity
Active
Fixed
Income
iShares
Fixed
Income
Multi-asset
Cash
Active
Equity
Institutional
Index Fixed
Income
Alternatives
Institutional
Index Equity
Q3 2012 |
 18
Increasing Expenses
Decreasing Expenses
Expense, as adjusted, by Category
Q3 2012 Compared to Q2 2012, as adjusted
$47 million
Q2 2012
$1.40 billion
Q3 2012
$1.44 billion
$1,444
$1,397
$25
$1
($11)
$1,300
$1,400
$1,500
Q2 2012
Other
G&A
(1)
Amort. -
Deferred
Commission
Distribution &
Servicing
Fund Launch
Costs
Compensation &
Benefits
(1)
Q3 2012
$0
56%
7%
1%
10%
23%
3%
Employee Comp. & Benefits
Distribution & Servicing Costs
Amort. of Deferred Sales
Commissions
Direct Fund Expenses
General & Administration
Amort. of Intangible Assets
56%
7%
1%
10%
23%
3%
Sequential expenses reflected growth in revenue related expenses and fund launch costs
Amount excludes fund launch costs which are presented separately above.
For further information and reconciliation between GAAP and as adjusted, see the appendix and notes (a) through (f) in the current earnings release.
(1) |
 Non-operating and cash flow |
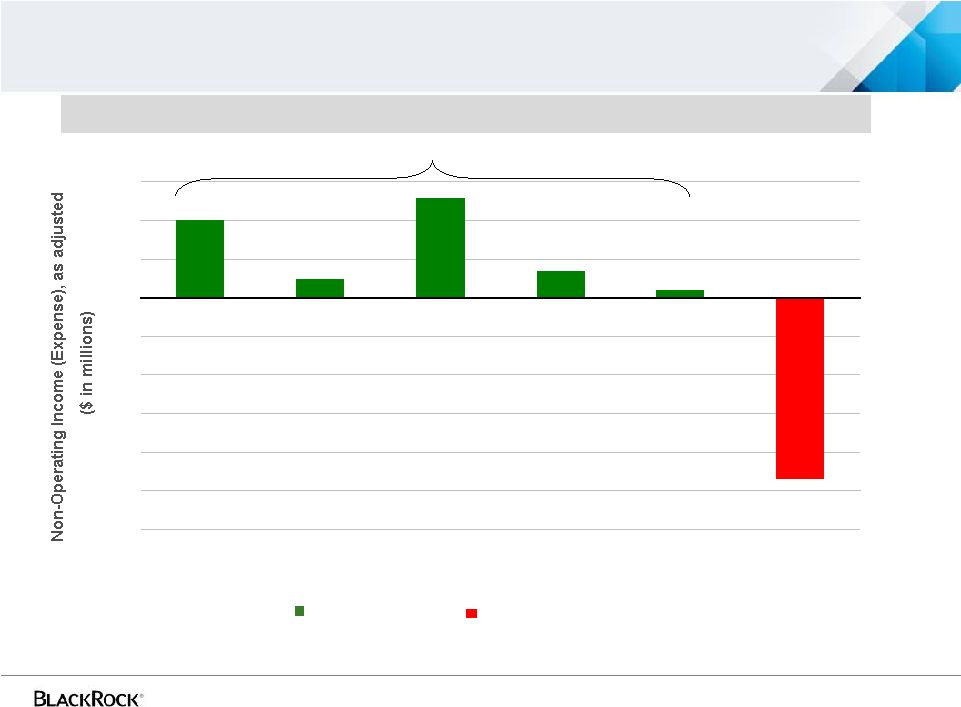 20
Q3 2012 non-operating income
$20
$26
$5
$7
$2
($47)
($60)
($50)
($40)
($30)
($20)
($10)
$0
$10
$20
$30
Private Equity
Real Estate
Distressed Credit/
Mortgage Funds
Hedge Funds/
Funds of Hedge
Funds
Other Investments
Net Interest
Expense
For further information and reconciliation between GAAP and as adjusted, see the
appendix and notes (a) through (f) in the current earnings release. Q3 2012 $13
million Non-Operating Income by Category, as adjusted Net Interest
Expense Investment Gains
$60 million Net Investment Gain |
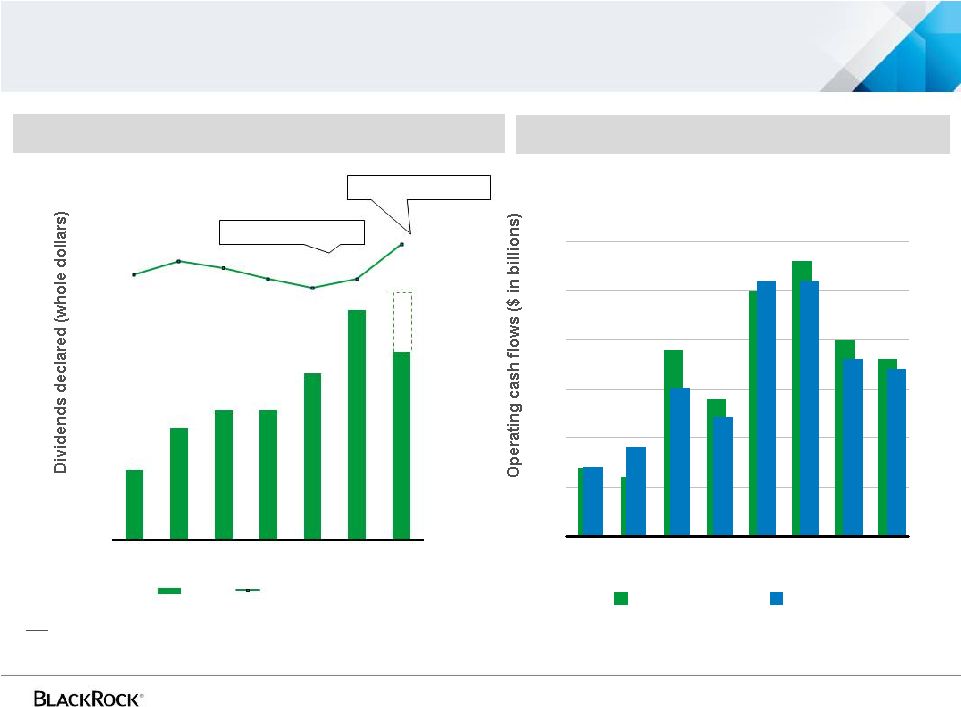 21
$1.8
$2.0
$0.7
$0.6
$1.9
$1.4
$2.5
$2.8
$0.0
$0.5
$1.0
$1.5
$2.0
$2.5
$3.0
2006
2007
2008
2009
2010
2011
YTD Q3
2011
Est.
YTD Q3
2012
$2.6
$2.6
$1.2
$1.5
$0.9
$0.7
$1.8
$1.7
`
Operating cash flow and payout ratio
Notes:
(A)
Payout ratio = (dividends declared + share repurchases) / GAAP net
income. 2/17/06
2/27/07 2/15/08
N/A 2/25/10 2/24/11 2/23/12
Dividend Change
Declared:
Excludes $2.5 bn June 2011
buyback of 13.6 million shares
Payout Ratio
Operating cash flow
GAAP
as adjusted
For further information and reconciliation between GAAP and as adjusted, see the
Company’s previously filed Form 10-Ks, Form 10-Qs and 8-Ks
and the appendix to this earnings release supplement. Excludes $1.0 bn May
2012 buyback of 6.4 million shares
Annualized
$6.00
$4.50
$5.50
$4.00
$3.12
$3.12
$2.68
$1.68
64%
44%
48%
53%
56%
50%
YTD Q3
2012
2011
2010
2009
2008
2007
2006
Dividend
Payout Ratio (A)
48% |
 Appendix |
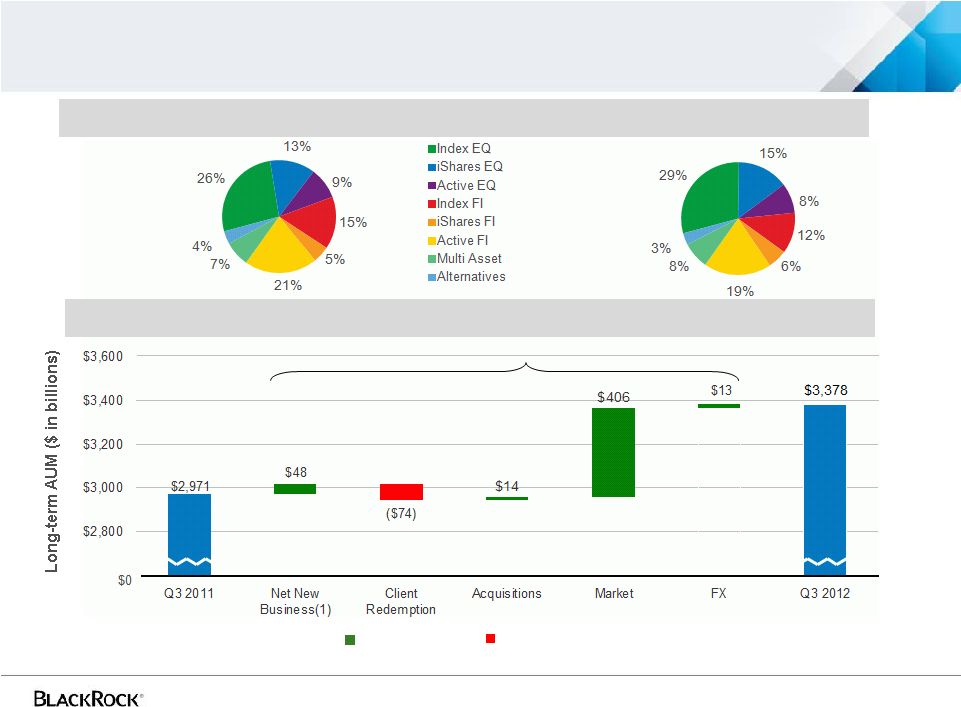 23
Q3 2012 long-term AUM up 14% from Q3 2011
Q3 2012 Compared to Q3 2011
Long-term AUM
Q3 2011
$2.971 trillion
Q3 2012
$3.378 trillion
Increasing AUM
(1) Q3 2012 net new business excludes the effect of an institutional fixed income
index redemption that totaled $74.2 billion from a single client, which is shown separately above.
Decreasing AUM
$407 billion |
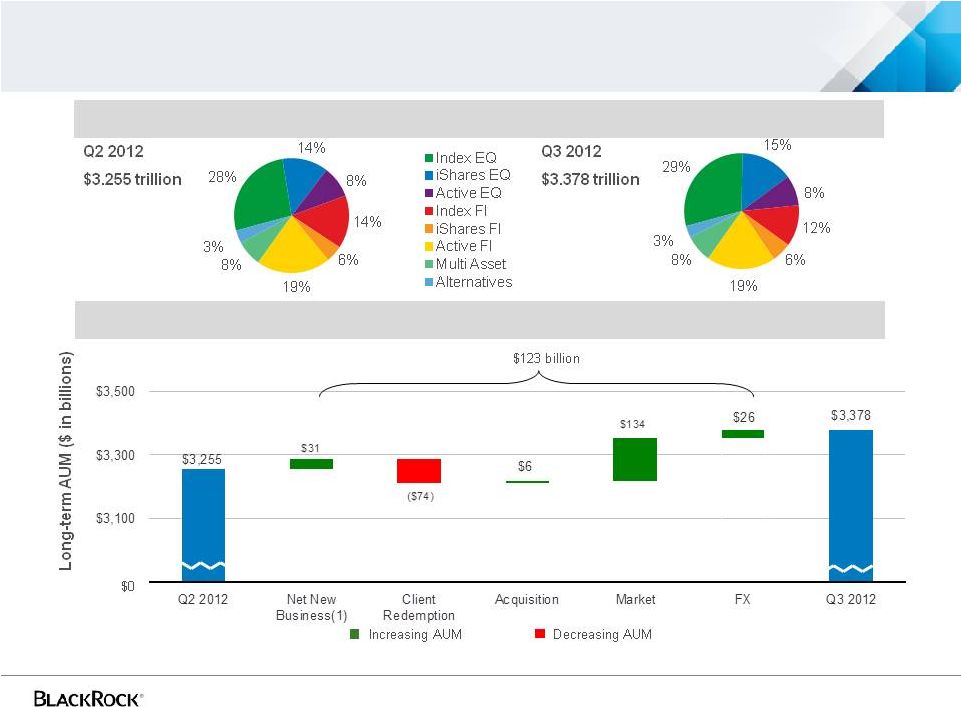 24
Q3 2012 long-term AUM up 4% from Q2 2012
(1) Q3 2012 net new business excludes the effect of an institutional fixed income
index redemption that totaled $74.2 billion from a single client, which is shown separately above.
Q3 2012 Compared to Q2 2012
Long-term AUM |
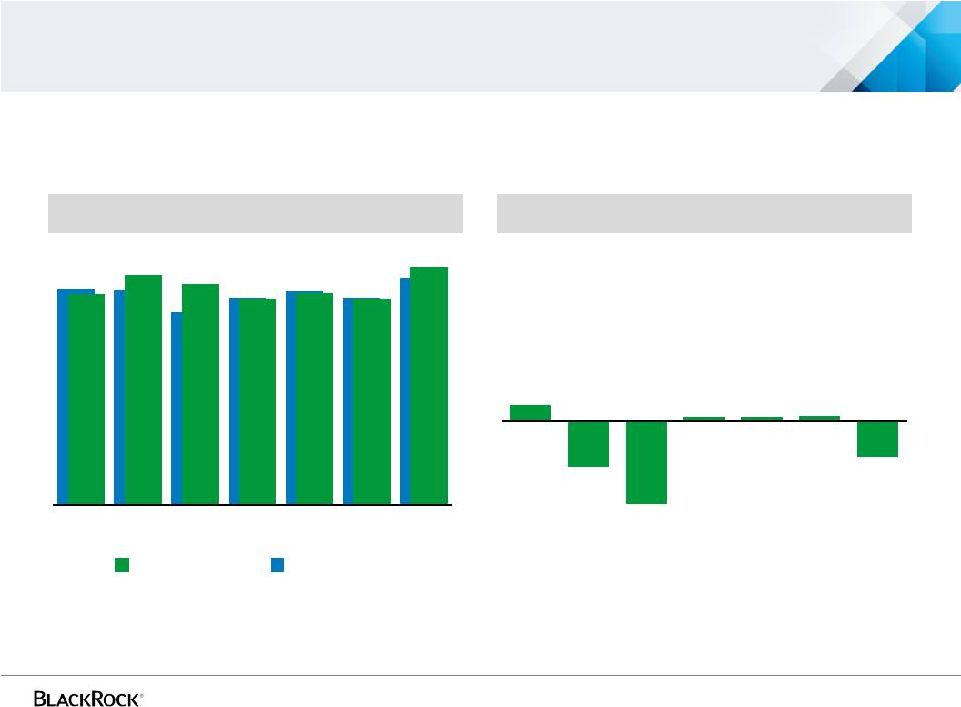
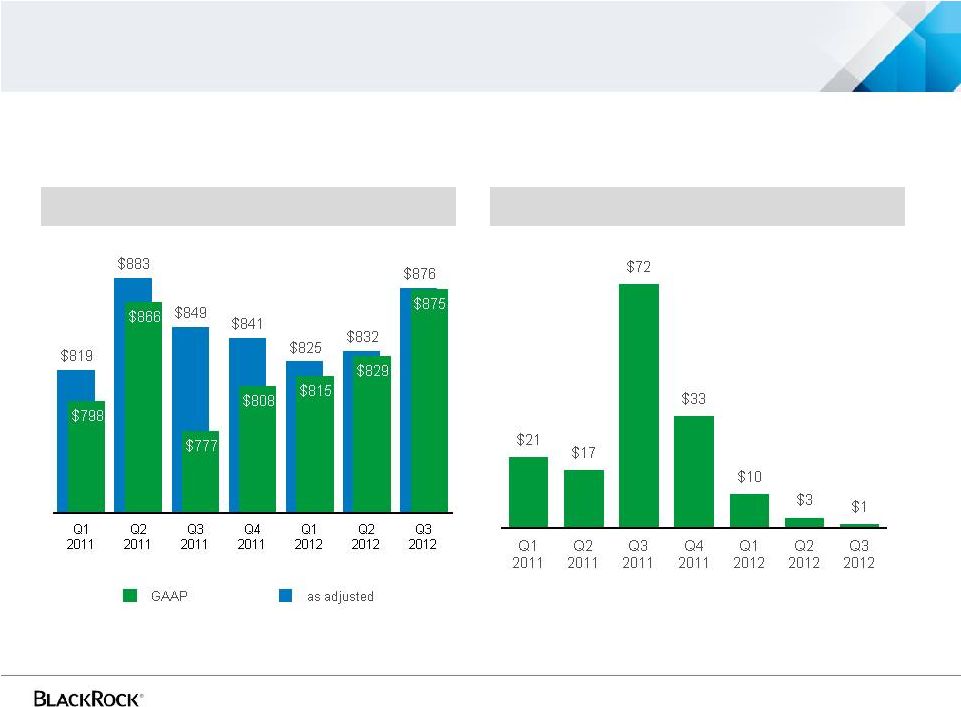 25
Quarterly operating income –
GAAP and as adjusted
Operating Income ($ in millions)
Non-GAAP Adjustments ($ in millions)
Non-GAAP adjustments include PNC LTIP funding obligation, Merrill Lynch
compensation contribution, U.K. lease exit costs, restructuring charges, and
compensation related to appreciation (depreciation) on certain deferred compensation
plans
For further information and reconciliation between GAAP and as adjusted, see notes
(a) through (f) in the current earnings release as well as previously filed Form 10-Ks, 10-Qs and 8-Ks. |
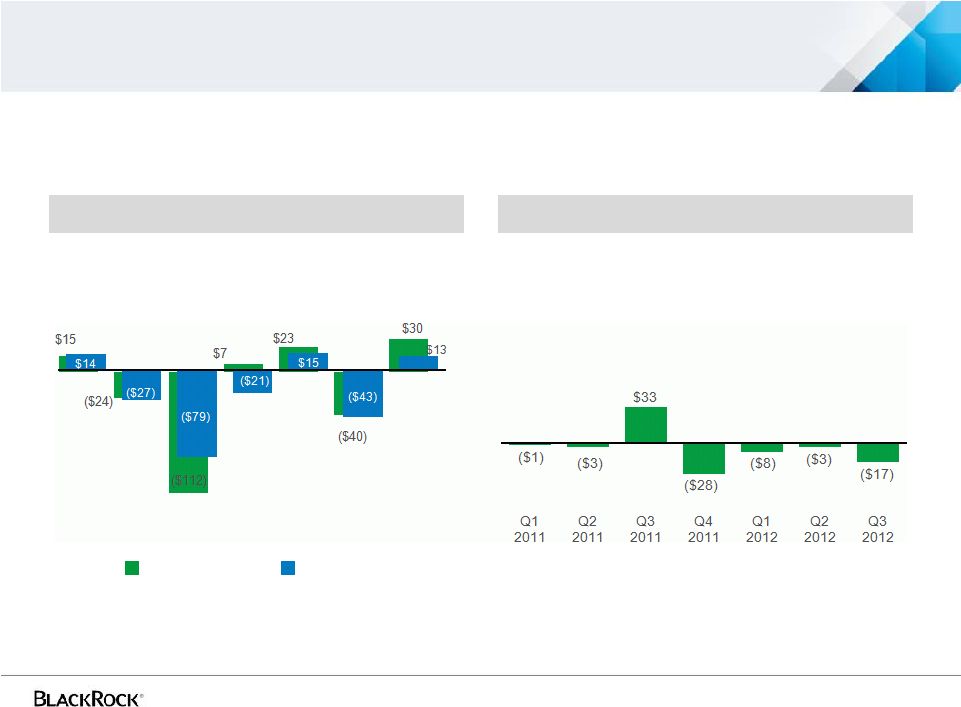
 26
Net Income ($ in millions)
Non-GAAP Adjustments ($ in millions)
GAAP
as
adjusted
Quarterly
net
income
–
GAAP
and
as
adjusted
Non-GAAP adjustments include PNC LTIP funding obligation, Merrill Lynch
compensation contribution, U.K. lease exit costs,
restructuring
charges,
income
tax
law
changes
and
a
state
tax
election
For further information and reconciliation between GAAP and as adjusted, see notes
(a) through (f) in the current earnings release as well as previously filed Form 10-Ks, 10-Qs and 8-Ks.
$14
($41)
($74)
$3
$3
$4
($32)
Q1
2011
Q2
2011
Q3
2011
Q4
2011
Q1
2012
Q2
2012
Q3
2012
$582
$578
$521
$558
$575
$558
$610
$568
$619
$595
$555
$572
$554
$642
Q1
2011
Q2
2011
Q3
2011
Q4
2011
Q1
2012
Q2
2012
Q3
2012 |
 27
Quarterly
non-operating
income
–
GAAP
and
as
adjusted
GAAP
as adjusted
Non-Operating Income (Expense) ($ in millions)
Non-GAAP Adjustments ($ in millions)
Non-GAAP adjustments include net income (loss) attributable to
non-controlling interests and compensation expense related to
(appreciation) depreciation on certain deferred compensation plans Q1
2011
Q2
2011
Q3
2011
Q4
2011
Q1
2012
For further information and reconciliation between GAAP and as adjusted, see notes
(a) through (f) in the current earnings release as well as previously filed Form 10-Ks, 10-Qs and 8-Ks.
Q2
2012
Q3
2012 |
 28
Cash Flow GAAP and As Adjusted
Cash Flow GAAP and As Adjusted
(in millions)
2006
2007
2008
2009
2010
2011
YTD
Q3 2011
EST YTD
Q3 2012
Operating Cash Flows
Operating Cash flows, GAAP
basis
$721
$587
$1,916
$1,399
$2,488
$2,826
$1,953
$1,800
Less: Non-GAAP adjustments (1)
21
(337)
413
168
(77)
178
114
100
Operating Cash flows, as
Adjusted
$700
$924
$1,503
$1,231
$2,565
$2,648
$1,839
$1,700
Investing Cash Flows
Investing Cash flows, GAAP
basis
$3
($1,068)
($394)
($5,519)
($627)
($204)
($186)
($500)
Less: Non-GAAP adjustments (1)
2
(201)
(9)
31
(52)
24
(13)
(200)
Investing Cash flows, as
Adjusted
$1
($867)
($385)
($5,550)
($575)
($228)
($173)
($300)
Financing Cash Flows
Financing Cash flows, GAAP
basis
($85)
$959
($887)
$6,749
($3,170)
($2,485)
($2,175)
($700)
Less: Non-GAAP adjustments (1)
68
514
(410)
(185)
110
(71)
(99)
-
Financing Cash flows, as
Adjusted
($153)
$445
($477)
$6,934
($3,280)
($2,414)
($2,076)
($700)
(1) Non-GAAP adjustments include the impact on cash flows of consolidated
sponsored investment funds and consolidated VIEs. |
 |