Attached files
| file | filename |
|---|---|
| 8-K - 8-K - Franchise Group, Inc. | a12-23331_18k.htm |
Exhibit 99.1
|
|
INVESTOR PRESENTATION OCTOBER 2012 JTH HOLDING, INC. PARENT COMPANY OF |
|
|
Safe Harbor Statement 2 This presentation may contain forward-looking statements within the meaning of the securities laws. Forward-looking statements can be identified by the fact that they do not relate strictly to historical or current facts. They often include words or variations of words such as “expects,” “anticipates,” “intends,” “plans,” “believes,” “seeks,” “estimates,” “projects”, “forecasts”, “targets”, “would,” “will”, “should,” “could,” or “may” or other similar expressions. Forward-looking statements provide management’s current expectations or predictions of future conditions, events or results. All statements that address operating performance, events or developments that we expect or anticipate will occur in the future are forward-looking statements. They may include estimates of revenues, income, earnings per share, capital expenditures, dividends, liquidity, capital structure or other financial items, descriptions of management’s plans or objectives for future operations, products or services, or descriptions of assumptions underlying any of the above. All forward-looking statements speak only as of the date they are made and reflect the Company’s good faith beliefs, assumptions and expectations, but they are not guarantees of future performance or events. Furthermore, the Company disclaims any obligation to publicly update or revise any forward-looking statement to reflect changes in underlying assumptions, factors, or expectations, new information, data or methods, future events or other changes, except as required by law. By their nature, forward-looking statements are subject to risks and uncertainties that could cause actual results to differ materially from those suggested by the forward-looking statements. Factors that might cause such differences include, but are not limited to, a variety of economic, competitive and regulatory factors, many of which are beyond the Company’s control and which are described in our Annual Report on Form 10-K for the fiscal year ended April 30, 2012 in the section entitled “Risk Factors”, as well as additional factors we have described and may describe from time to time in other filings with the Securities and Exchange Commission. You should understand that it is not possible to predict or identify all such factors and, consequently, you should not consider any such list to be a complete set of all potential risks or uncertainties. |
|
|
Agenda 3 Industry Overview Company Overview Financial Overview Future Opportunities |
|
|
Industry Overview 4 |
|
|
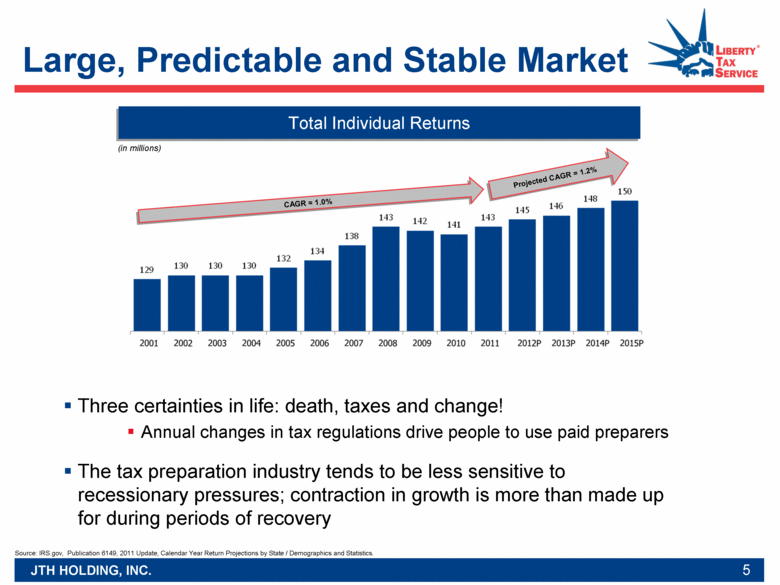
Large, Predictable and Stable Market Total Individual Returns Source: IRS.gov, Publication 6149, 2011 Update, Calendar Year Return Projections by State / Demographics and Statistics. (in millions) Three certainties in life: death, taxes and change! Annual changes in tax regulations drive people to use paid preparers The tax preparation industry tends to be less sensitive to recessionary pressures; contraction in growth is more than made up for during periods of recovery CAGR = 1.0% Projected CAGR = 1.2% 5 |
|
|
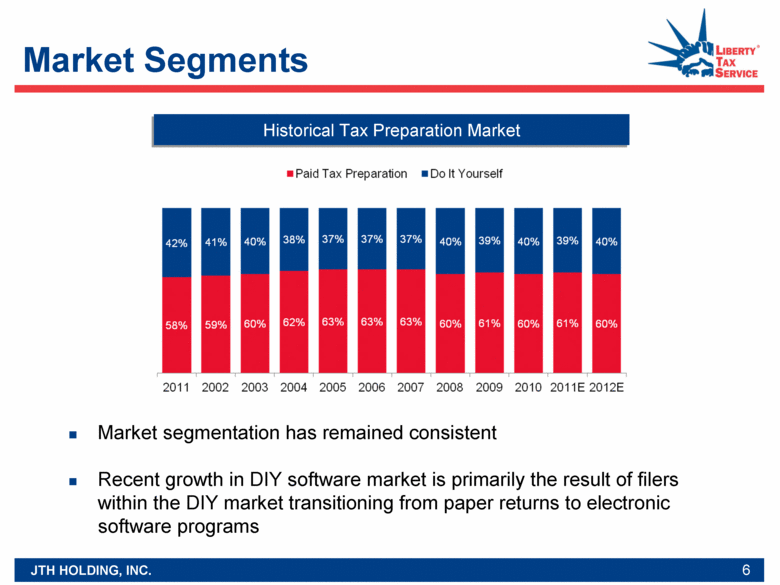
Market Segments Market segmentation has remained consistent Recent growth in DIY software market is primarily the result of filers within the DIY market transitioning from paper returns to electronic software programs 6 Historical Tax Preparation Market |
|
|
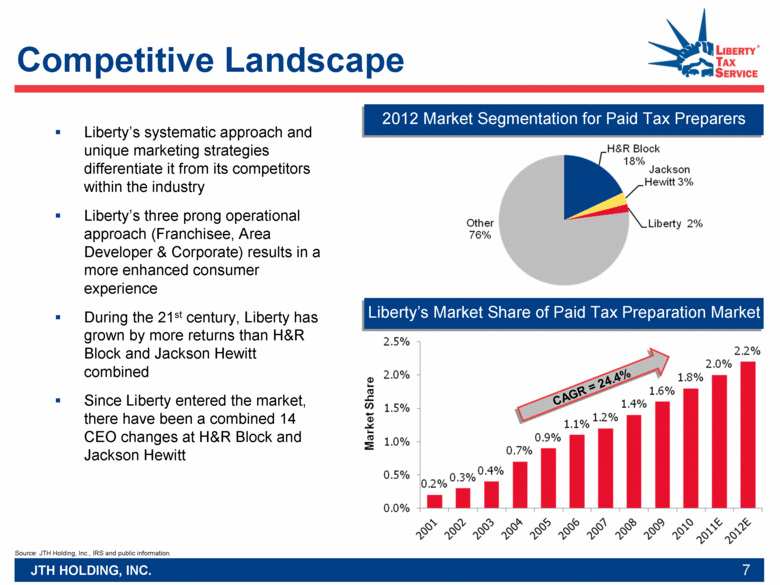
Competitive Landscape Liberty’s systematic approach and unique marketing strategies differentiate it from its competitors within the industry Liberty’s three prong operational approach (Franchisee, Area Developer & Corporate) results in a more enhanced consumer experience During the 21st century, Liberty has grown by more returns than H&R Block and Jackson Hewitt combined Since Liberty entered the market, there have been a combined 14 CEO changes at H&R Block and Jackson Hewitt 2012 Market Segmentation for Paid Tax Preparers Liberty’s Market Share of Paid Tax Preparation Market CAGR = 24.4% Source: JTH Holding, Inc., IRS and public information. 7 |
|
|
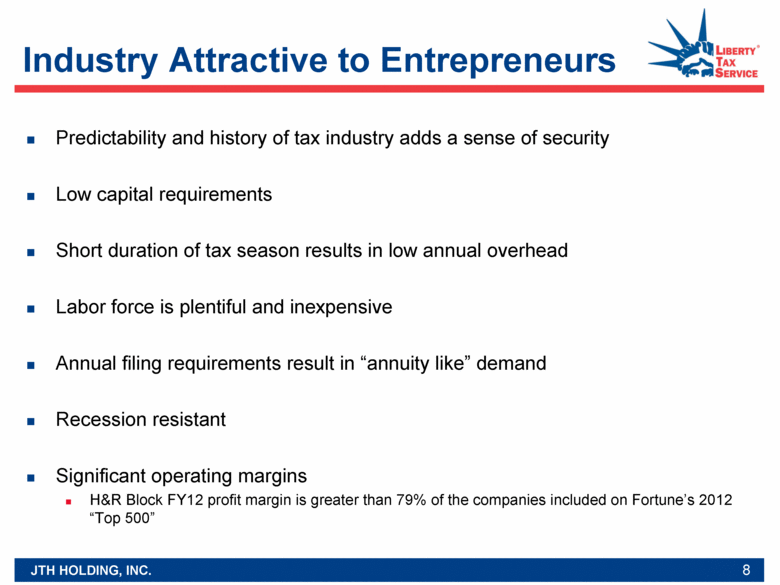
Industry Attractive to Entrepreneurs Predictability and history of tax industry adds a sense of security Low capital requirements Short duration of tax season results in low annual overhead Labor force is plentiful and inexpensive Annual filing requirements result in “annuity like” demand Recession resistant Significant operating margins H&R Block FY12 profit margin is greater than 79% of the companies included on Fortune’s 2012 “Top 500” 8 |
|
|
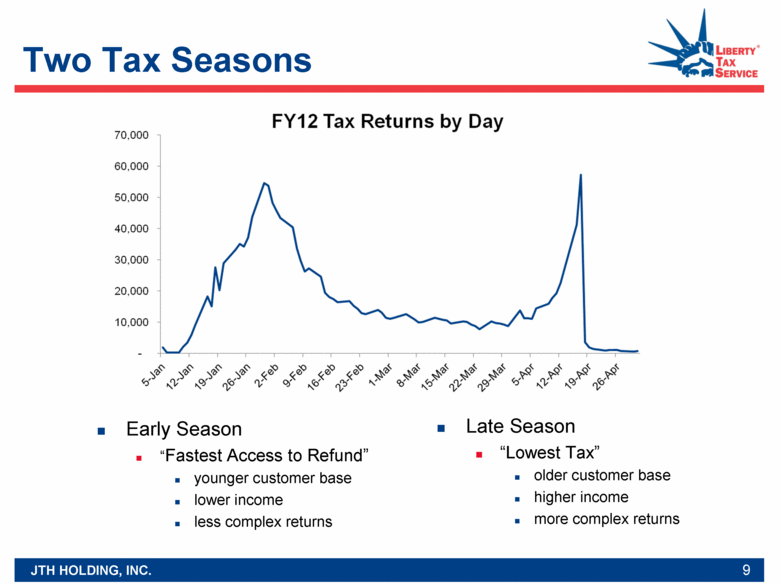
Two Tax Seasons 9 Early Season “Fastest Access to Refund” younger customer base lower income less complex returns Late Season “Lowest Tax” older customer base higher income more complex returns |
|
|
Company Overview 10 |
|
|
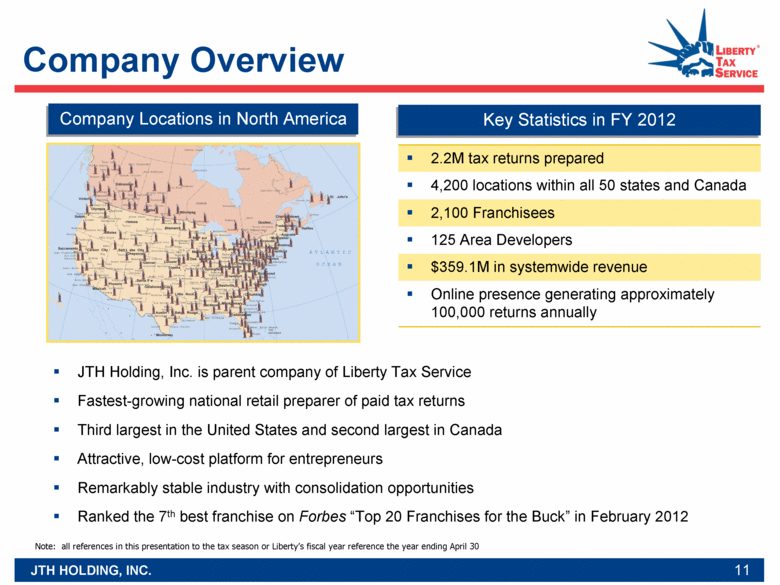
Company Overview 11 JTH Holding, Inc. is parent company of Liberty Tax Service Fastest-growing national retail preparer of paid tax returns Third largest in the United States and second largest in Canada Attractive, low-cost platform for entrepreneurs Remarkably stable industry with consolidation opportunities Ranked the 7th best franchise on Forbes “Top 20 Franchises for the Buck” in February 2012 Company Locations in North America Key Statistics in FY 2012 2.2M tax returns prepared 4,200 locations within all 50 states and Canada 2,100 Franchisees 125 Area Developers $359.1M in systemwide revenue Online presence generating approximately 100,000 returns annually Note: all references in this presentation to the tax season or Liberty’s fiscal year reference the year ending April 30 |
|
|
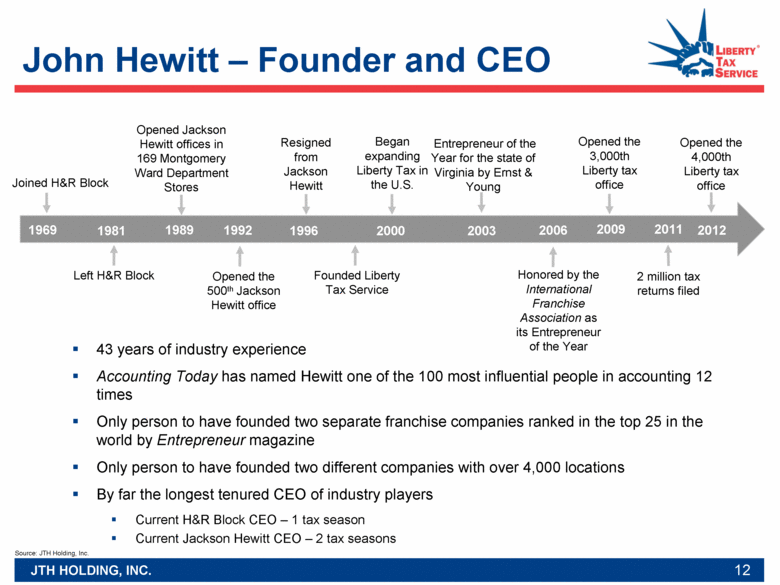
John Hewitt – Founder and CEO Joined H&R Block Opened the 500th Jackson Hewitt office Entrepreneur of the Year for the state of Virginia by Ernst & Young 43 years of industry experience Accounting Today has named Hewitt one of the 100 most influential people in accounting 12 times Only person to have founded two separate franchise companies ranked in the top 25 in the world by Entrepreneur magazine Only person to have founded two different companies with over 4,000 locations By far the longest tenured CEO of industry players Current H&R Block CEO – 1 tax season Current Jackson Hewitt CEO – 2 tax seasons Honored by the International Franchise Association as its Entrepreneur of the Year 1969 1981 Left H&R Block 1992 Resigned from Jackson Hewitt 1996 2003 2006 1989 Opened Jackson Hewitt offices in 169 Montgomery Ward Department Stores Founded Liberty Tax Service 2000 Began expanding Liberty Tax in the U.S. Source: JTH Holding, Inc. 2009 2011 Opened the 3,000th Liberty tax office 2 million tax returns filed 12 2012 Opened the 4,000th Liberty tax office |
|
|
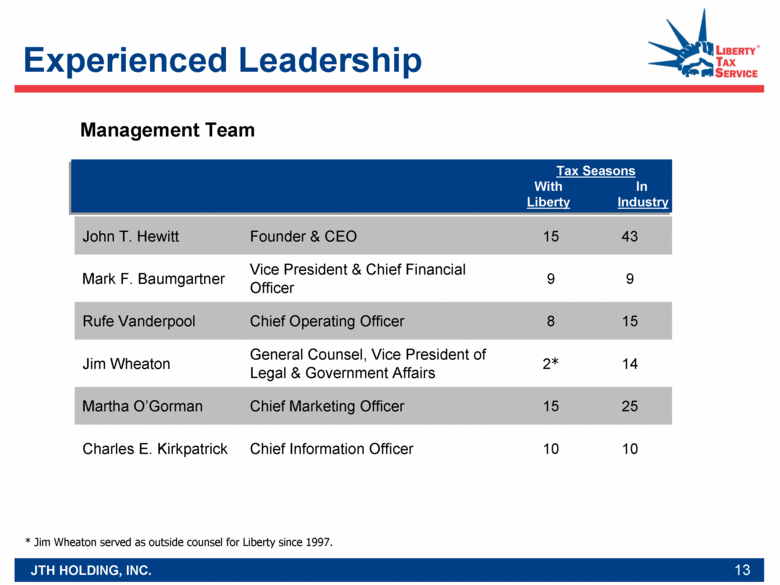
Experienced Leadership 13 Management Team Name Position Tax Seasons With In Liberty Industry * Jim Wheaton served as outside counsel for Liberty since 1997. John T. Hewitt Founder & CEO 15 43 Mark F. Baumgartner Vice President & Chief Financial Officer 9 9 Rufe Vanderpool Chief Operating Officer 8 15 Jim Wheaton General Counsel, Vice President of Legal & Government Affairs 2* 14 Martha O’Gorman Chief Marketing Officer 15 25 Charles E. Kirkpatrick Chief Information Officer 10 10 |
|
|
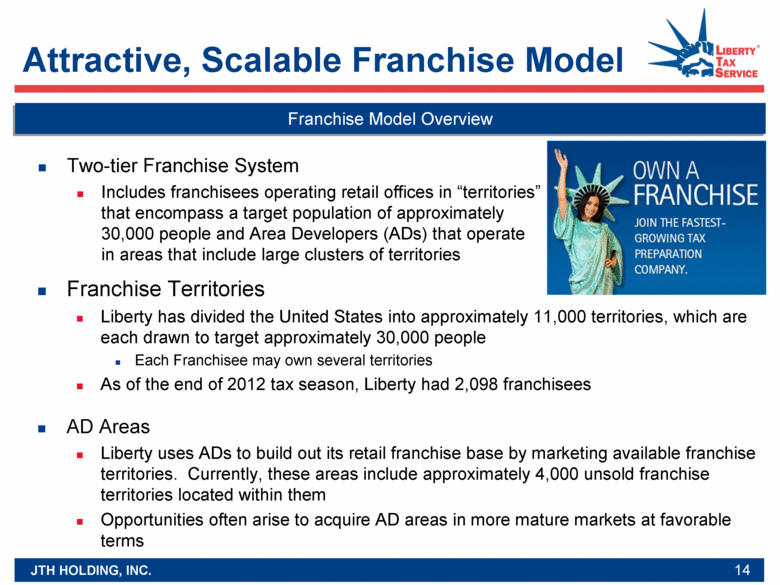
Attractive, Scalable Franchise Model Franchise Territories Liberty has divided the United States into approximately 11,000 territories, which are each drawn to target approximately 30,000 people Each Franchisee may own several territories As of the end of 2012 tax season, Liberty had 2,098 franchisees AD Areas Liberty uses ADs to build out its retail franchise base by marketing available franchise territories. Currently, these areas include approximately 4,000 unsold franchise territories located within them Opportunities often arise to acquire AD areas in more mature markets at favorable terms 14 Franchise Model Overview Two-tier Franchise System Includes franchisees operating retail offices in “territories” that encompass a target population of approximately 30,000 people and Area Developers (ADs) that operate in areas that include large clusters of territories |
|
|
Awards and Recognition 15 The only tax franchise on the Forbes “Top 20 Franchises for the Buck” - February 2012 Ranked #2 in retail tax chains on their annual “Top Tax Firms” list - March 2012 Named Liberty Tax Service on its elite list of “Military Friendly” franchises for the 2nd year in a row - June 2012 Liberty Tax Service is the only tax service that was included on the elite list of “25 Top Franchises for Hispanics” - 2006, 2007, 2009, 2010, 2011 Named Liberty Tax Service as one of the “40 Best Franchises for African Americans” - September 2010 Ranked Liberty Tax Service one of the “75 Hot Franchises to Get Into Now” - Summer 2011 Ranked as one of the top franchise opportunities on the Franchise 500 every year from 1998 to 2012 “#1 Overall Best Places to Work ” in 2009, the “#3 Best Large Company in 2008,” and a “Top 25” company in 2006 and 2007. The company “earned induction” to the Hall of Fame after achieving the #1 status in 2009, and being recognized for four years in a row. |
|
|
Financial Overview 16 |
|
|
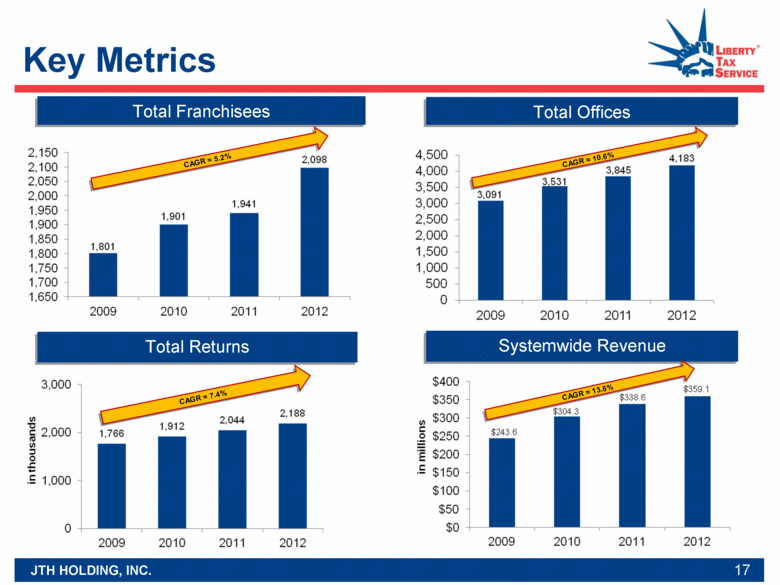
Key Metrics 17 Total Franchisees CAGR = 5.2% Total Offices CAGR = 10.6% Total Returns Systemwide Revenue CAGR = 7.4% CAGR = 13.8% |
|
|
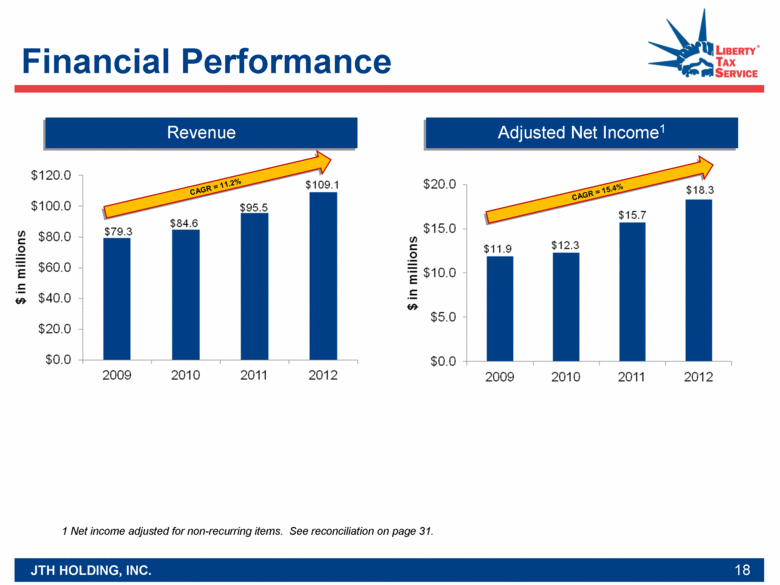
Financial Performance 18 Adjusted Net Income1 Revenue CAGR = 11.2% CAGR = 15.4% 1 Net income adjusted for non-recurring items. See reconciliation on page 31. $ in millions $ in millions |
|
|
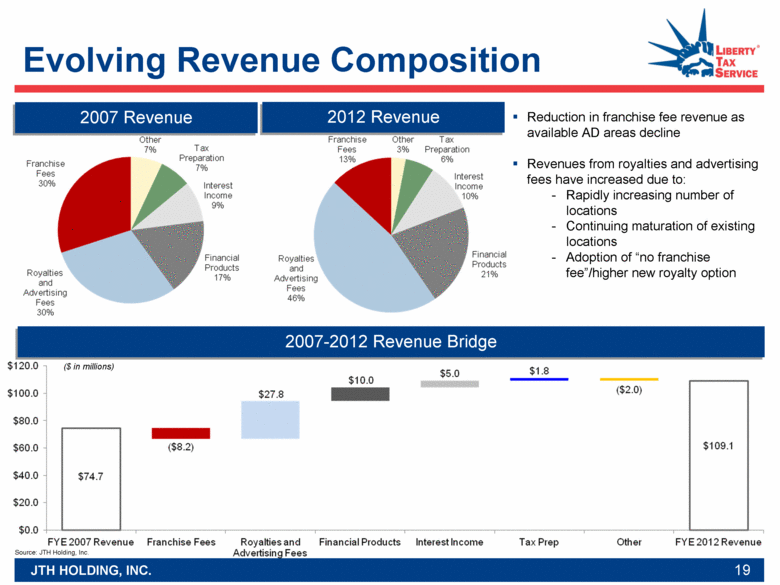
Evolving Revenue Composition 19 2007-2012 Revenue Bridge 2007 Revenue 2012 Revenue Reduction in franchise fee revenue as available AD areas decline Revenues from royalties and advertising fees have increased due to: Rapidly increasing number of locations Continuing maturation of existing locations Adoption of “no franchise fee”/higher new royalty option Source: JTH Holding, Inc. ($ in millions) Franchise Fees 30% Other 7% Tax Preparation 7% Interest Income 9% Financial Products 17% Royalties and Advertising Fees 30% Franchise Fees 13% Other 3% Tax Preparation 6% Interest Income 10% Financial Products 21% Royalties and Advertising Fees 46% |
|
|
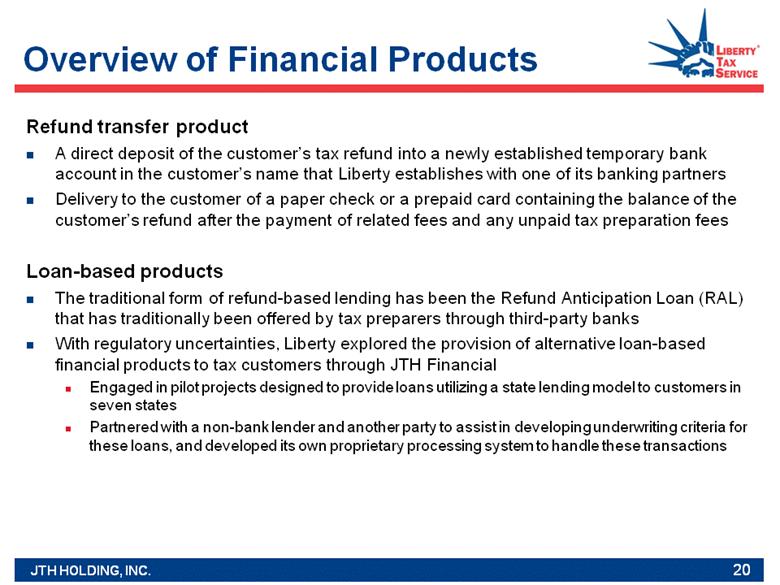
Overview of Financial Products Refund transfer product A direct deposit of the customer’s tax refund into a newly established temporary bank account in the customer’s name that Liberty establishes with one of its banking partners Delivery to the customer of a paper check or a prepaid card containing the balance of the customer’s refund after the payment of related fees and any unpaid tax preparation fees Loan-based products The traditional form of refund-based lending has been the Refund Anticipation Loan (RAL) that has traditionally been offered by tax preparers through third-party banks With regulatory uncertainties, Liberty explored the provision of alternative loan-based financial products to tax customers through JTH Financial Engaged in pilot projects designed to provide loans utilizing a state lending model to customers in seven states Partnered with a non-bank lender and another party to assist in developing underwriting criteria for these loans, and developed its own proprietary processing system to handle these transactions 20 |
|
|
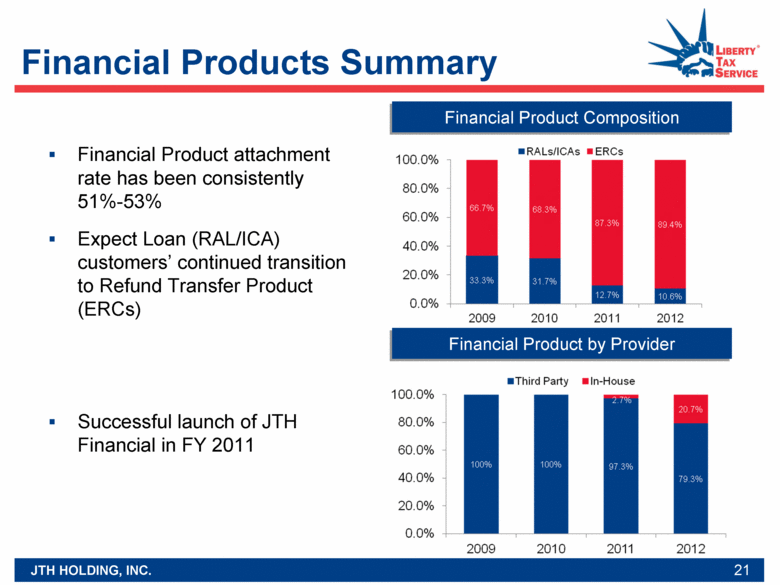
Financial Products Summary 21 Financial Product Composition Financial Product by Provider Financial Product attachment rate has been consistently 51%-53% Expect Loan (RAL/ICA) customers’ continued transition to Refund Transfer Product (ERCs) Successful launch of JTH Financial in FY 2011 |
|
|
Financial Products - Customer Charges Per product charges and attachment rate have been consistent Growth in charges due to return growth 22 Financial Product Charges Paid by Our Customers $0 $10 $20 $30 $40 $50 2010 2011 2012 (in Millions) Refund Transfer Loan Revenue Split $0 $10 $20 $30 $40 $50 2010 2011 2012 (In Millions) In-House Third Party Opportunity….. Leverage internal capabilities, thus retain more revenue in-house |
|
|
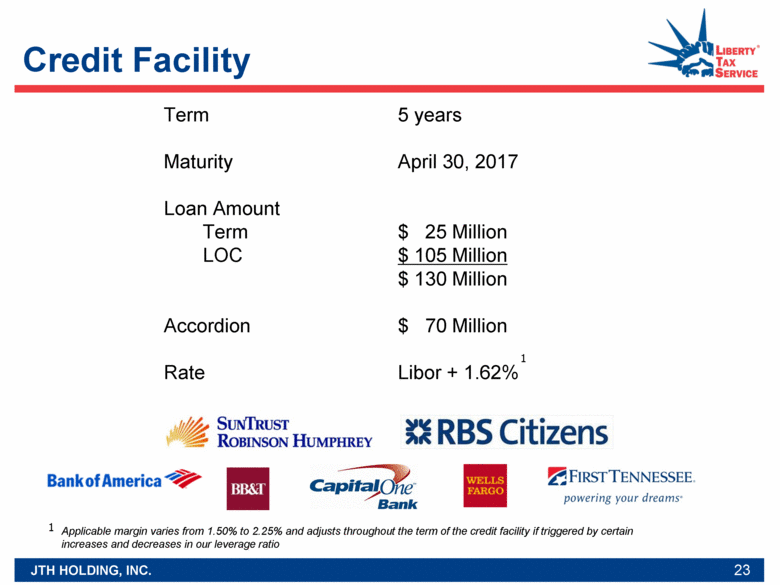
Credit Facility 23 Term 5 years Maturity April 30, 2017 Loan Amount Term $ 25 Million LOC $ 105 Million $ 130 Million Accordion $ 70 Million Rate Libor + 1.62% Applicable margin varies from 1.50% to 2.25% and adjusts throughout the term of the credit facility if triggered by certain increases and decreases in our leverage ratio 1 1 |
|
|
Future Opportunities 24 |
|
|
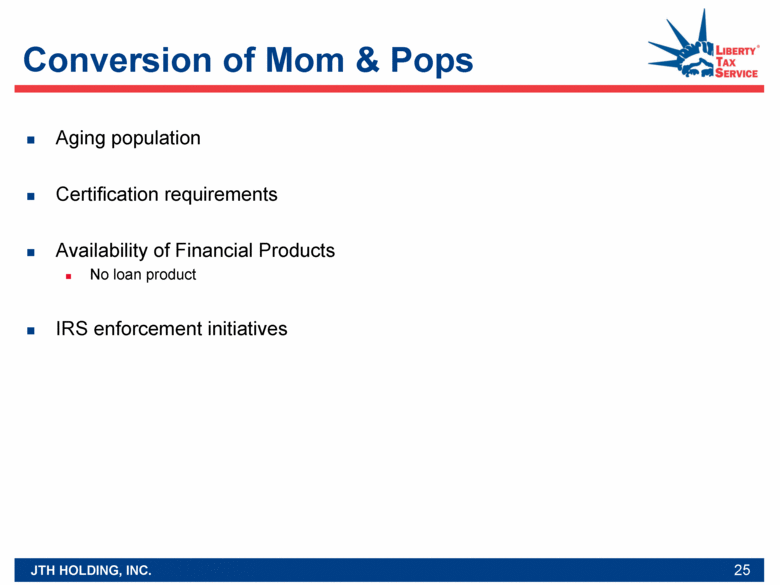
Conversion of Mom & Pops Aging population Certification requirements Availability of Financial Products No loan product IRS enforcement initiatives 25 |
|
|
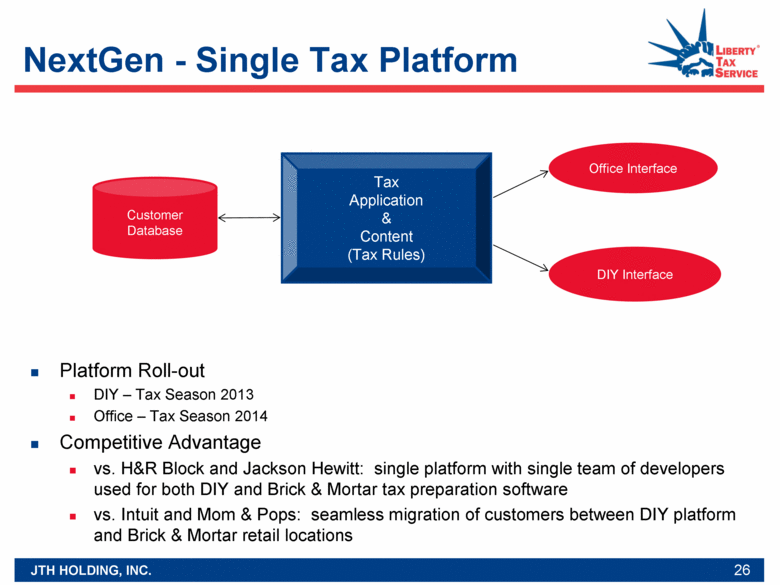
NextGen - Single Tax Platform Platform Roll-out DIY – Tax Season 2013 Office – Tax Season 2014 Competitive Advantage vs. H&R Block and Jackson Hewitt: single platform with single team of developers used for both DIY and Brick & Mortar tax preparation software vs. Intuit and Mom & Pops: seamless migration of customers between DIY platform and Brick & Mortar retail locations 26 Customer Database Tax Application & Content (Tax Rules) Office Interface DIY Interface |
|
|
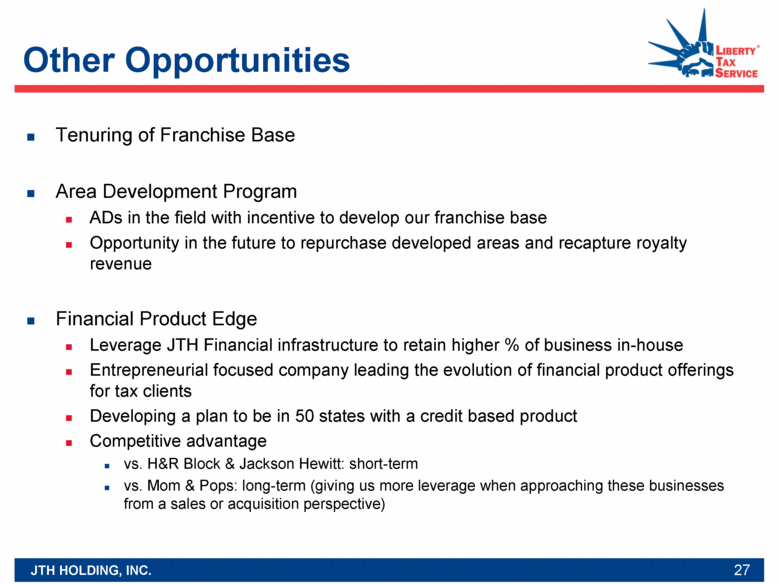
Other Opportunities Tenuring of Franchise Base Area Development Program ADs in the field with incentive to develop our franchise base Opportunity in the future to repurchase developed areas and recapture royalty revenue Financial Product Edge Leverage JTH Financial infrastructure to retain higher % of business in-house Entrepreneurial focused company leading the evolution of financial product offerings for tax clients Developing a plan to be in 50 states with a credit based product Competitive advantage vs. H&R Block & Jackson Hewitt: short-term vs. Mom & Pops: long-term (giving us more leverage when approaching these businesses from a sales or acquisition perspective) 27 |
|
|
Other Opportunities – cont’d. Changes to the Tax Code Reinforces need for paid preparers Health Care Reform 20 million Americans will be forced to take some tax return related action (tax credit or tax penalty) Hispanic Market Segment Potential for mass amnesty program in the future, resulting in an additional 10 million tax returns filed with the IRS Greater upside for Paid Preparer Market vs. DIY Market New Markets India Brazil Australia 28 |
|
|
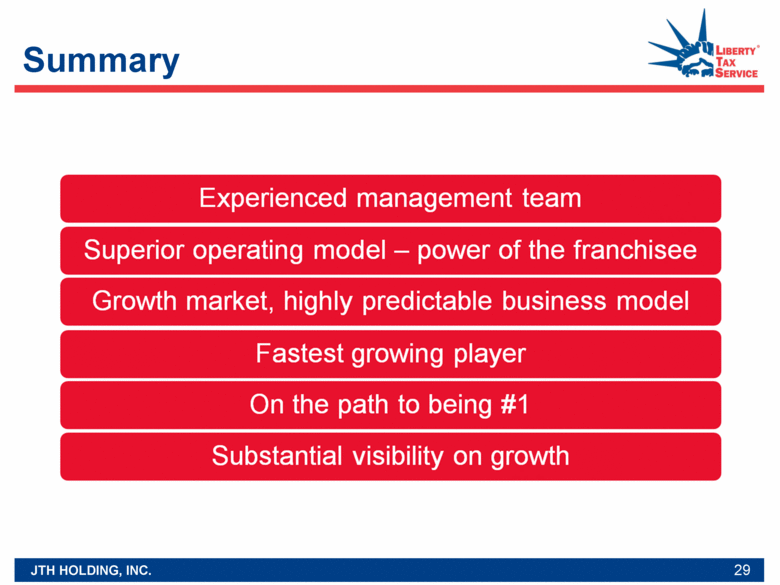
Summary 29 |
|
|
Appendix 30 |
|
|
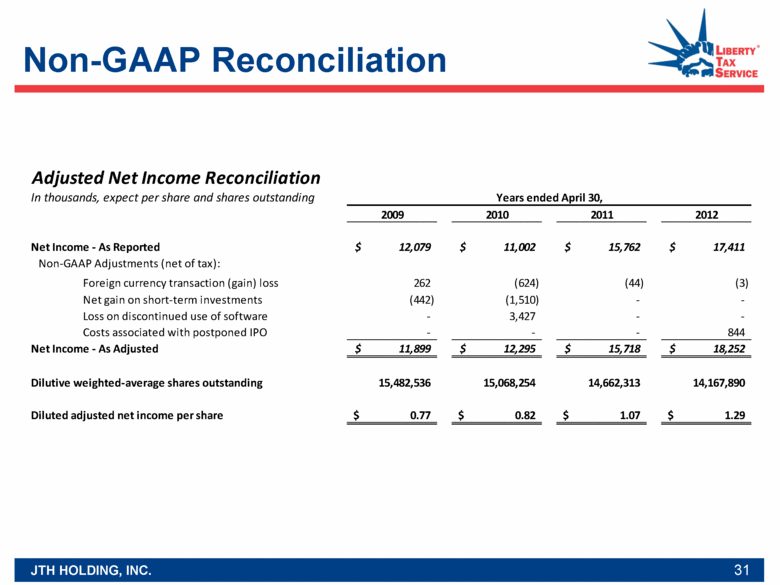
Non-GAAP Reconciliation 31 Adjusted Net Income Reconciliation In thousands, expect per share and shares outstanding 2009 2010 2011 2012 Net Income - As Reported 12,079 $ 11,002 $ 15,762 $ 17,411 $ Non-GAAP Adjustments (net of tax): Foreign currency transaction (gain) loss 262 (624) (44) (3) Net gain on short-term investments (442) (1,510) - - Loss on discontinued use of software - 3,427 - - Costs associated with postponed IPO - - - 844 Net Income - As Adjusted 11,899 $ 12,295 $ 15,718 $ 18,252 $ Dilutive weighted-average shares outstanding 15,482,536 15,068,254 14,662,313 14,167,890 Diluted adjusted net income per share 0.77 $ 0.82 $ 1.07 $ 1.29 $ Years ended April 30, |
|
|
32 |

