Attached files
| file | filename |
|---|---|
| 8-K - FORM 8-K - Bristow Group Inc | d419855d8k.htm |
 Johnson Rice Energy
Conference
Bristow Group Inc.
October 1-4, 2012
Exhibit 99.1 |
 2
Forward-looking statements
This
presentation
may
contain
“forward-looking
statements”
within
the
meaning
of
the
Private
Securities
Litigation
Reform
Act
of
1995.
Forward-looking
statements
include
statements
about
our
future
business,
operations,
capital
expenditures,
fleet
composition,
capabilities
and
results
;
modeling
information,
earnings
guidance,
expected
operating
margins
and
other
financial
projections;
future
dividends,
share
repurchase
and
other
uses
of
excess
cash;
plans,
strategies
and
objectives
of
our
management,
including
our
plans
and
strategies
to
grow
earnings
and
our
business,
our
general
strategy
going
forward
and
our
business
model;
expected
actions
by
us
and
by
third
parties,
including
our
customers,
competitors
and
regulators;
the
valuation
of
our
company
and
its
valuation
relative
to
relevant
financial
indices;
our
ability
to
complete
and
fund
the
Cougar
Helicopters
Inc.
transaction;
the
timing
for
completing
the
transaction;
whether
the
transaction
will
be
approved
by
the
Canadian
Transportation
Agency;
beneficial
to
our
operations
and
accretive
to
our
earnings
per
share,
cash
flow
and
Bristow
Value
Added;
assumptions
underlying
or
relating
to
any
of
the
foregoing,
including
assumptions
regarding
factors
impacting
our
business,
financial
results
and
industry
;
and
other
matters.
Our
forward-looking
statements
reflect
our
views
and
assumptions
on
the
date
of
this
presentation
regarding
future
events
and
operating
performance.
They
involve
known
and
unknown
risks,
uncertainties
and
other
factors,
many
of
which
may
be
beyond
our
control,
that
may
cause
actual
results
to
differ
materially
from
any
future
results,
performance
or
achievements
expressed
or
implied
by
the
forward-looking
statements.
These
risks,
uncertainties
and
other
factors
include
those
discussed
under
the
captions
“Risk
Factors”
and
“Management’s
Discussion
and
Analysis
of
Financial
Condition
and
Results
of
Operations”
in
our
Annual
Report
on
Form
10-K
for
the
fiscal
year-ended
March
31,
2012
and
our
Quarterly
Report
on
Form
10-Q
for
the
quarter
ended
June
30,
2012.
We
do
not
undertake
any
obligation,
other
than
as
required
by
law,
to
update
or
revise
any
forward-looking
statements,
whether
as
a
result
of
new
information,
future
events
or
otherwise. |
 3
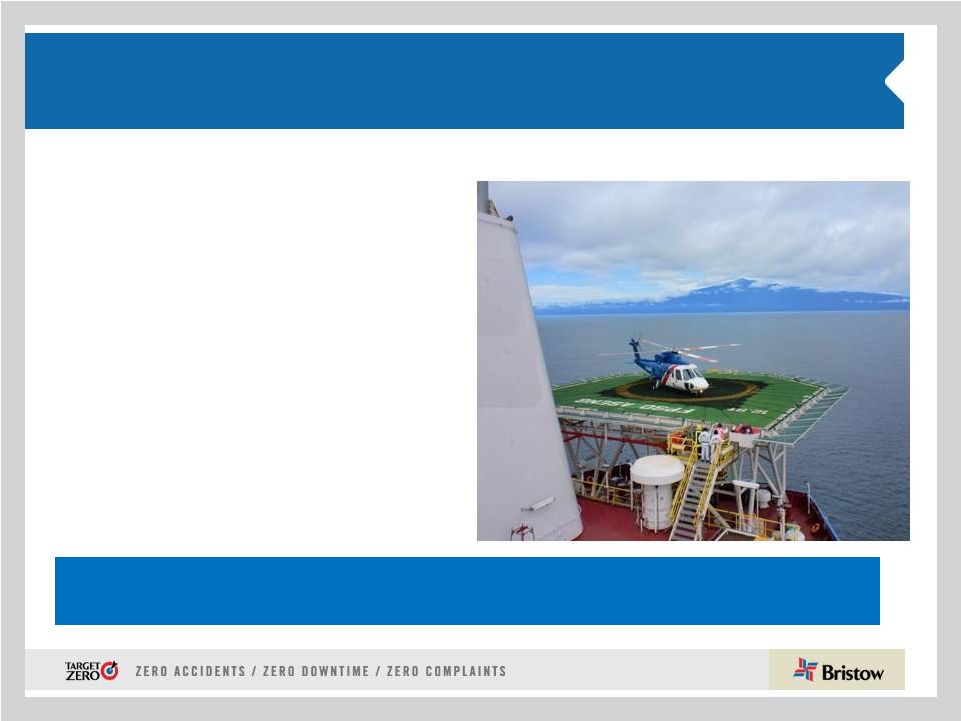
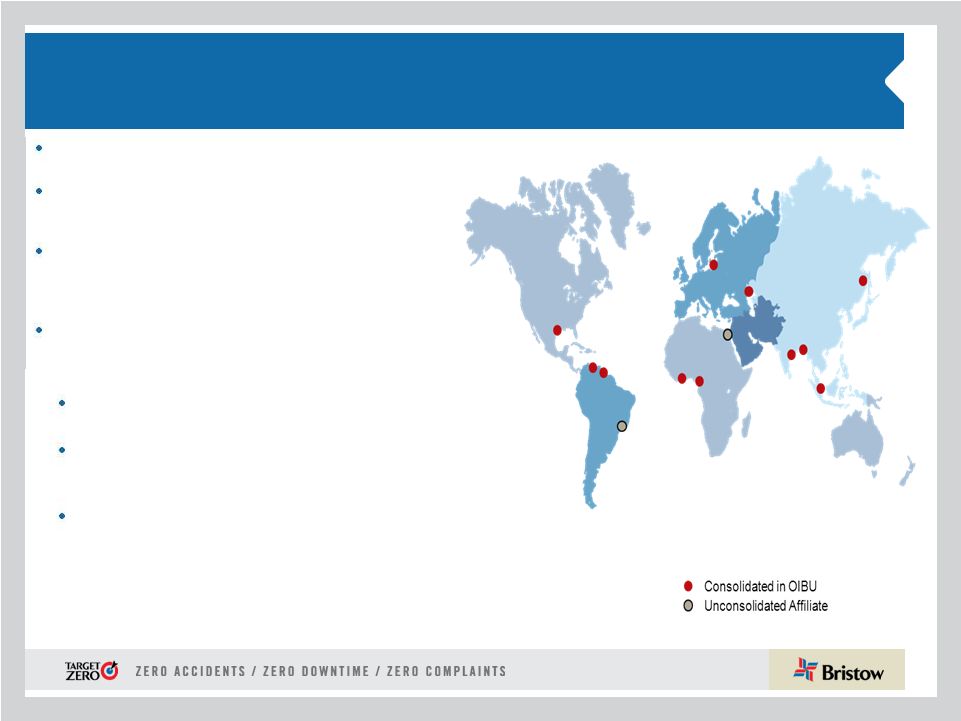
Bristow is the leading provider of helicopter services
and is a unique investment in oil field services
•
~20 countries
•
551 aircraft
•
~3,400 employees
•
Ticker: BRS
•
Stock price
*
: $49.91/share
•
Market cap
*
: ~$1.9 billion
•
Quarterly dividend of $0.20/share
Bristow flies crews and light cargo to production platforms, vessels and rigs
* Based on 36.4 million fully diluted weighted average shares outstanding for the
three months ended 06/30/2012 and stock price as of September 26, 2012 On
September 4 th
, Bristow announced that we are making a US$250M
investment in Cougar, Canada’s premier helicopter services provider
|
 4
Safety is our primary core value
Bristow’s ‘Target Zero’
program is now the leading example
emulated industry-wide
Safety Performance accounts for 25% of management
incentive compensation
2011 National Ocean Industries Association (NOIA) Safety
in Seas Award Winner
our industry leading safety program,
creates differentiation and client loyalty TARGET ZERO, |
 5
$275
•
Bristow
has
changed
its
client
and
capital
allocation
approach
(Client Promise/Bristow Value Added) to generate better cash
returns and fund it’s growth
•
Bristow
is
enjoying
improved
pricing
for
its
services
with
better
utilization especially in North America
•
Bristow
is
growing
with
demand
not
as
dependent
on
economic
or commodity cycles
•
Bristow’s
asset
values
continue
to
be
resilient
even
in
depressed
economic times as there is strong demand for helicopters
outside of exploration and production (E&P)
•
Bristow
cash
flow
has
increased
53%
since
FY11
and
is
more
than 2 times higher than our next four competitors* combined
* Four competitors are CHC, ERA, Inaer Aviation, and PHI. Data from latest filings
as of July 29, 2012. ERA based on S-1 pro-forma. Why
Bristow?
Changes
like
Client
Promise
and
BVA
generate
cash
for
organic
and
external
growth |
 6
•
Bristow has reached agreement with Canadian owned
VIH Aviation Group (VIHAG) to invest in its subsidiary
Cougar Helicopters Inc. (Cougar)
•
Cougar is Canada’s largest and leading offshore oil &
gas and search & rescue (SAR) helicopter services
provider
•
Bristow’s investment is US$250M and includes:
# of Large aircraft
Existing Bristow locations
Existing Cougar locations
CHANGE:
Bristow is making an investment in Cougar, Canada’s premier helicopter
services provider
A 40% economic interest in Cougar and a 25% voting
interest
The acquisition of eight Sikorsky S-92 aircraft and state
of the art passenger, maintenance and SAR facilities
These assets will be leased to Cougar after the
transaction closes with Bristow providing maintenance
and supply chain services to Cougar for its S-92 aircraft
•
VIHAG can earn up to an additional $40M based upon
Cougar achieving certain performance targets
Investment increases the number of large helicopters in Bristow’s North
American Business Unit and is immediately accretive to earnings, cash flow
and BVA |
 7
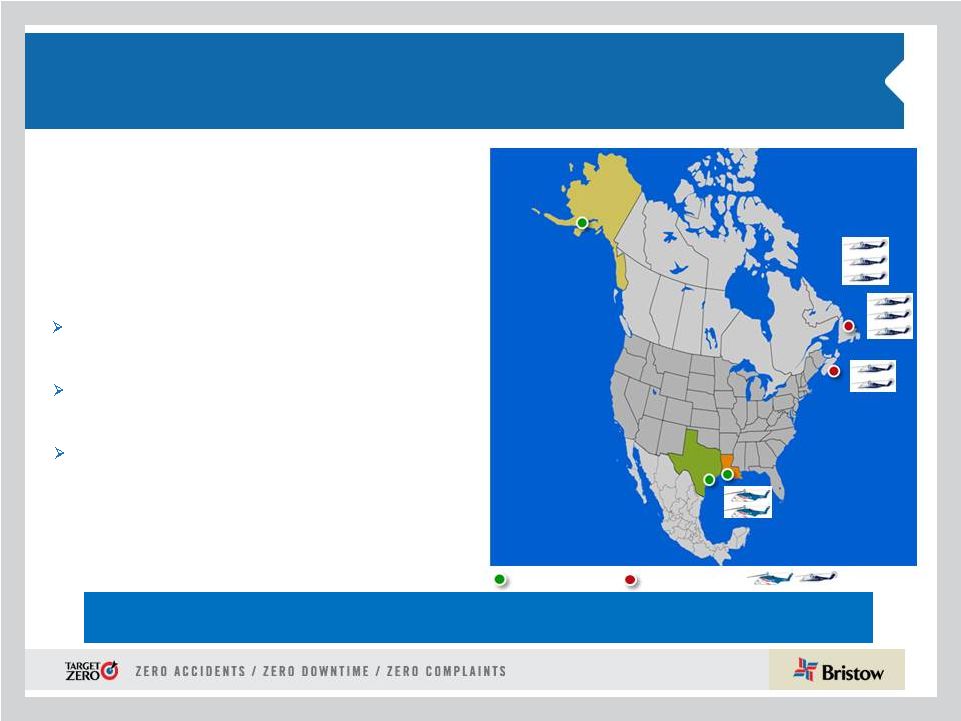
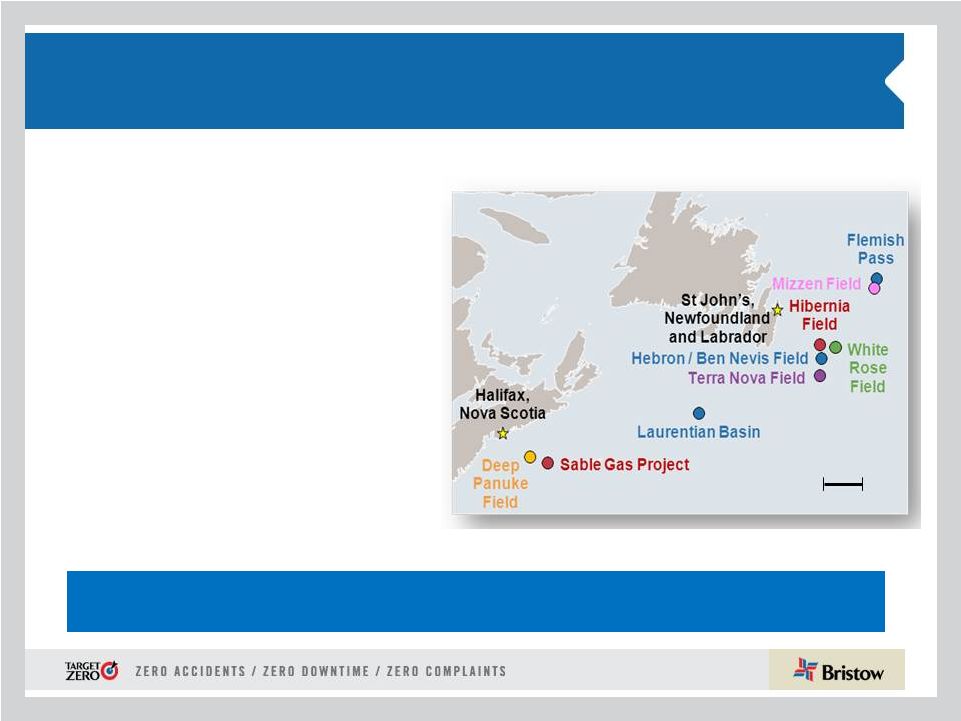
Cougar provides scale, stability and growth to our North
American Business Unit
This
investment
builds
on
the
inherent
strengths
of
both
parties
to
create
value for clients in Canada’s Atlantic coast and beyond
100NM
•
Bristow
gains
exposure
to
the
Canadian
market through this alliance where Cougar
has successfully operated for 15 years with
unmatched infrastructure and skills
•
Cougar
is
best
positioned
as
the
search
for energy expands into emerging
opportunities in the offshore Greenland
and Arctic fields
•
Bristow and Cougar are culturally
aligned
with
shared
core
values
of
safety,
quality and service
•
Bristow expansion into SAR accelerates
with Cougar creating a capability on both
sides of the Atlantic Ocean |
 8
Bristow’s strong liquidity position makes the
investment both financially attractive
and
financeable
within
our
prudent
balance
sheet
management
principles without issuing equity
The
investment
is
expected
to
close
in
the
fourth
quarter
of
calendar
year
2012,
subject
to
approval
by
the
Canadian
Transportation
Agency
(which
was
received
on
September 13, 2012) and the final syndication of an interim $250M, 364-day term
loan facility
Bristow has already received a lead bank commitment for
the interim acquisition facility
with repayment to be made from a combination of cash on
hand, cash flow from operations and proceeds from future financings
All internally mandated
credit metrics are expected to be maintained or
enhanced
and both rating agencies have affirmed our Ba2/BB corporate rating
Bristow's investment and associated asset purchase are expected to be at least
seven percent accretive to annual EPS, cash flow from operations, and
BVA Our equity investment and purchase of eight modern
aircraft is prudently financed and immediately accretive
The
investment
and
asset
acquisition
are
anticipated
to
close
in
early
Q4
CY12 |
 9
9
BV and FMV per share updated for the Cougar
Investment including eight S-92s
Note: June’s numbers are June’s actual adjusted for the investment in
Cougar with the exception of shares outstanding and average closing price which are calculated as of 8/27/2012.
42.29
55.29
45.94
38
43
48
53
58
J
A
S
O
N
D
J
F
M
A
M
J
J
A
Book value of equity per share
FMV of assets per share
Avg Closing Price
BV and FMV per Share ($) |
 10
CONCLUSION:
Bristow enjoys the strongest balance sheet
in our industry with ample cash flow for EPS Growth
Cash Flow
generation
provides EPS
growth
Bristow generated 53% more operating cash flow in
FY12 compared to FY11
Adj. EPS growth is improving with FY13 YTD delivering
better than previous year’s annual growth rate
Prudent
Balance
Sheet
management
Adjusted Debt/Capital Ratio less than 45% with a BBB-
rating from Standard & Poor’s for secured debt
Operating lease strategy used to finance growth with a
competitive cost of capital
Ample
Liquidity with
underlying
asset value
Bristow closed Q1 FY13 with almost $400 million of
liquidity, part of which will fund the Cougar investment
Fair market value of aircraft is well above share price at
June 30, 2012, especially with the addition of Cougar
10 |
 11
Appendix |
 12
CHANGE:
Bristow’s Client Promise initiative is gaining
traction and is behind our organic margin improvement
Target Zero accidents, downtime and complaints
programs deliver value to operators.
More zero-accident flight hours than anyone,
more uptime than anyone,
and hassle-free service
creates confidence in flight. Worldwide.
Lowers client’s offshore operating costs
and improves productivity.
Earns us more business
to improve BVA. |
 13
CHANGE:
Bristow Value Added (BVA) makes employees
treat the cost of capital like any other expense . . .
BRISTOW VALUE ADDED CALCUALTION SAMPLE
BVA
=Gross
Cash
Flow
–
(Gross
Operating
Assets
X
Capital
Charge)
BVA
=
GCF
-
(
GOA
X
10.5%**
)
Bristow Value Added calculation for Q1 FY12
($15.4)
=
$60*
-
(
$2,874*
X
2.625%**
)
Bristow Value Added calculation for Q1 FY13
$1.9
=
$80*
-
(
$2,976*
X
2.625%**
)
•
BVA is the key measure to define Bristow’s financial success
and charges managers for the capital they use every day
•
BVA has changed i) the way working capital is managed, and
ii) has led to our operating lease initiative
* Reconciliation for these items is in the appendix
** Quarterly capital charge of 2.625% is based on annual capital charge
of 10.5% |
 14
. . . Leading to our operating lease initiative: lowering
the
cost
and
amount
of
capital
needed
to
grow
•
Of the 56 aircraft currently leased in our fleet, 30 are training and 26 are
commercial (18 LACE)
•
18 LACE aircraft represent approximately 12% of our commercial fleet
•
Our
goal
is
for
commercial
fleet
operating
leases
to
account
for
20-30%
of
our
LACE
Leased aircraft as of June 30, 2012
Large
Medium
Small
Total
Leased LACE
Total LACE
% Leased
EBU
8
-
-
8
8
47
17%
WASBU
-
1
-
1
1
22
2%
NABU
2
11
1
14
8
30
26%
AUSBU
1
-
2
3
2
18
11%
OIBU
-
-
-
-
-
32
0%
Total
11
12
3
26
18
147
12% |
 15
CHANGE:
Our
focus
on
BVA
has
yielded
much
higher
operating
cash
flow
generation
.
.
.
Net cash provided by operating activities
See June 30, 2012 10-Q for more information on cash flow provided by operating
activities 29.6
35.0
25.7
52.9
55.4
127.9
195.4
151.4
231.3
0
40
80
120
160
200
240
280
320
FY09
FY10
FY11
FY12
Q1 FY13 |
 16
. . . And when combined with leasing, creates a
significantly higher cash and liquidity position
Total Liquidity
178
261
402
387
100
145
140
160
78
116
262
227
0
50
100
150
200
250
300
350
400
450
31-Mar-
10
31-
Mar-
11
31-
Mar-
12
30-
Jun-12
Undrawn borrowing capacity
Cash |
 17
. . . Which allows us to pursue the larger scope of
organic growth identified between FY13 and FY17 |
 18
. . . With the market outlook even better in FY13
Overall
activity
above pre-
2008 levels
•
The overall market both in terms of tender activity and pricing is
improving
•
North Sea tender activity remains at historic levels
•
Aircraft supply is tightening with significant search and rescue
(SAR) requirements (both governmental and O&G) and faster
Brazilian expansion
Brazil growth
accelerates
NABU
market
returning
•
Petrobras board approved 52 incremental aircraft through FY15
with a focus on heavy aircraft. First ten were awarded, of which
Lider will provide five, and a new bid is expected later this year
for the next tranche.
•
International demand outside of Brazil expected to be at least
equal to Brazilian demand suggesting further tightening of
supply/demand for large a/c
•
Most clients increasing activity in USGoM as rigs go back to
work
•
Atlantic Canada new drilling activity increasing with Statoil,
ExxonMobil and Chevron |
 19
…Providing
investors
with
a
unique
combination
of
growth
and
balanced return opportunities in various market environments
The “Growth Price Signal”
is provided
by the commercial markets and outlook
for ANNUAL EPS Growth
Cash
Flow Yield
=
OCF + A/C sales –
Depreciation
Market Capitalization
We can provide a balanced return, but some years we
will “Go Faster”
depending on price signals
The “Capital Return Price Signal”
is
provided by the financial markets and
our current free cash flow yield
Today this equals 13.5 %*
FY13 EPS Guidance: $3.25 -
$3.55
FY12
–
FY13
EPS
Midpoint Growth
9.0 %
=
*Trailing twelve months as of June 30, 2012 |
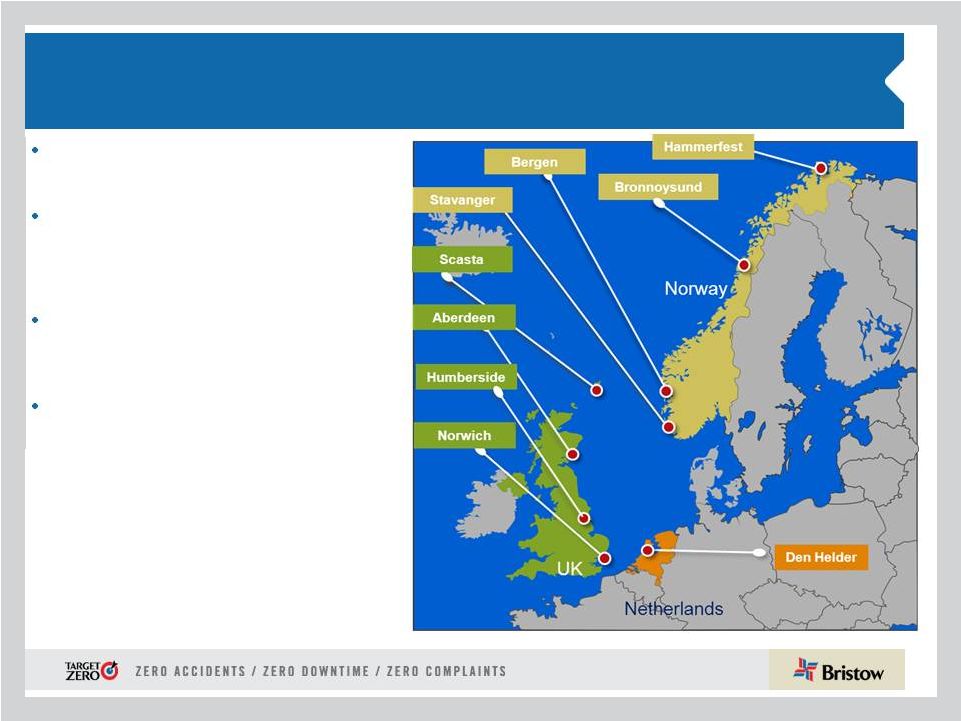 20
Europe represented 39% of Bristow operating
revenue and 42% of adjusted EBITDAR* in Q1
FY13
Operating revenue increased to $123.2M in Q1
FY13 from $108.3M in Q1 FY12 with the
addition of four large aircraft and increased
activity with new and existing contracts in the
UK and Norway
Adjusted EBITDAR increased to $39.7M in Q1
FY13 from $35.7M in Q1 FY12, while adjusted
EBITDAR margin remained relatively flat at
32.2% in Q1 FY13 versus 33.0% in Q1 FY12
Outlook:
•
Bristow is shortlisted for UK SAR program
with results to be announced in early 2013
•
High activity continues as demonstrated by
new awards for nine aircraft recently
announced. Additional awards are
anticipated next quarter.
FY13 adjusted EBITDAR margin
expected to be ~ low thirties
Europe (EBU)
* Operating revenue and adjusted EBITDAR percentages exclude corporate and
other. |
 21
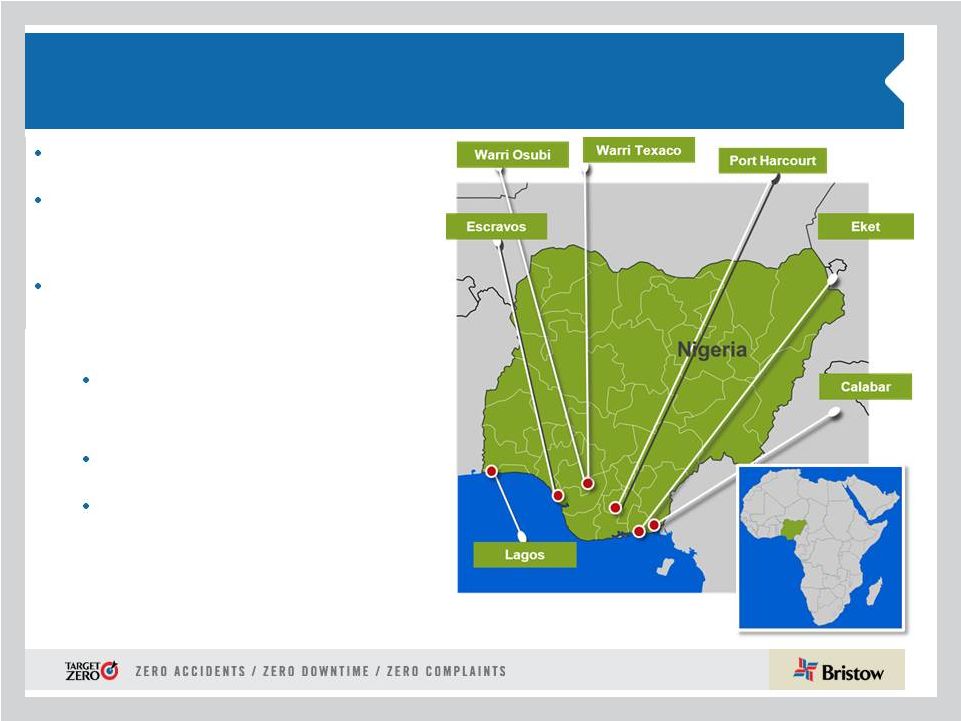
West Africa (WASBU)
Nigeria represented 21% of Bristow operating
revenue and 22% of adjusted EBITDAR* in Q1 FY13
Operating revenue of $66.4M in Q1 FY13 increased
27% from $52.3M in Q1 FY12 due to strong activity
and a 12% increase in flight hours compared to Q1
FY12
Adjusted EBITDAR increased to $21.2M in Q1 FY13
from $15.4M in Q1 FY12 with adjusted EBITDAR
margin of 32% in Q1 FY13 vs 30% in Q1 FY12
Outlook:
Improved service through Client Promise
initiative continues to drive strong results: Two
existing contracts extended with better pricing
and terms
Upcoming heavy maintenance on several
aircraft will impact Q2 and Q3 FY13
We continue to work on optimizing the
operating model in this business unit as part
of the local content initiative
FY13 adjusted EBITDAR margin expected
to be ~ low thirties
* Operating revenue and adjusted EBITDAR percentages exclude corporate and
other. |
 22
•
North America represented 17% of Bristow operating
revenue and 13% of adjusted EBITDAR* in Q1 FY13
Adjusted EBITDAR doubled to $12.2M in Q1 FY13 vs.
$6.3M in Q1 FY12 and adjusted EBITDAR margin was
23.2% in Q1 FY13 versus 14.3% in Q1 FY12
Sequential improvement of almost 50% in adjusted
EBITDAR from $8.2M in Q4 FY12 to $12.2M in the
current quarter
Business model performed with key parameters
significantly better; several mid-teen price increases;
large aircraft working and costs contained
Outlook:
Our business is improving in FY13 similar to other
oil
service
sector
recoveries
-
more
rigs,
more
people, and more investment
Client Promise initiative continues to deliver
positive results
FY13 adjusted EBITDAR expected to be ~ low
twenties
North America (NABU)
* Operating revenue and adjusted EBITDAR percentages exclude corporate and
other. |
 23
Australia (AUSBU)
Australia represented 12% of Bristow operating
revenue and 11% of adjusted EBITDAR* in Q1 FY13
Operating revenue of $38.2M in Q1 FY13 decreased
from $40.9M in Q1 FY12 due to a decrease in overall
flight activity
Adjusted EBITDAR increased to $10.3M in Q1 FY13
from $8.3M in Q1 FY12 and adjusted EBITDAR
margin increased to 27.0% in Q1 FY13 from 20.2% in
Q1 FY12 reflecting better asset utilization along with
lower operating costs
Outlook:
INPEX award of a ten-year contract for up to
six large aircraft with an option to add a long
term SAR aircraft with the start date in FY14
Aircraft
will
be
redeployed
as
short
-
term
contracts roll off; will impact performance in Q2
and Q3 FY13
An additional medium aircraft contract award
with improved terms
* Operating revenue and adjusted EBITDAR percentages exclude corporate and
other. FY13
adjusted
EBITDAR
margin
expected to be ~ mid to high twenties |
 24
Other International (OIBU)
Other International represented 11% of Bristow operating revenue
and 12% of adjusted EBITDAR* in Q1 FY13
Operating revenue decreased to $33.2M in Q1 FY13 vs. $34.5M
in Q1 FY12 due to decrease in activity in Ghana and the end of a
contract in the Baltic Sea
Adjusted EBITDAR margin of 36.2% in Q1 FY13 decreased from
48.1% in Q1 FY12 due primarily to decreased earnings from
unconsolidated affiliates (particularly Lider in Brazil), activity
reduction in Mexico, and increased operating costs in Trinidad
Lider equity earnings decreased to $0.0M in Q1 FY13 compared
to $2.7M in Q1 FY12
* Operating revenue and adjusted EBITDAR percentages exclude corporate and
other. Potential new opportunities in Caspian, East Africa, Southeast
Asia and the Caribbean
FY13 adjusted EBITDAR margin expected to be ~ low
to mid forties
Outlook:
Petrobras awarded Lider contracts for five new large aircraft, with
one leased by Bristow to Lider, with operations scheduled to
commence starting in August 2012 through April 2013
Lider’s second half of the year is expected to be better than the first
half as operations under new contracts begin. Currency fluctuations
make it difficult to predict if this will translate into higher equity
earnings |
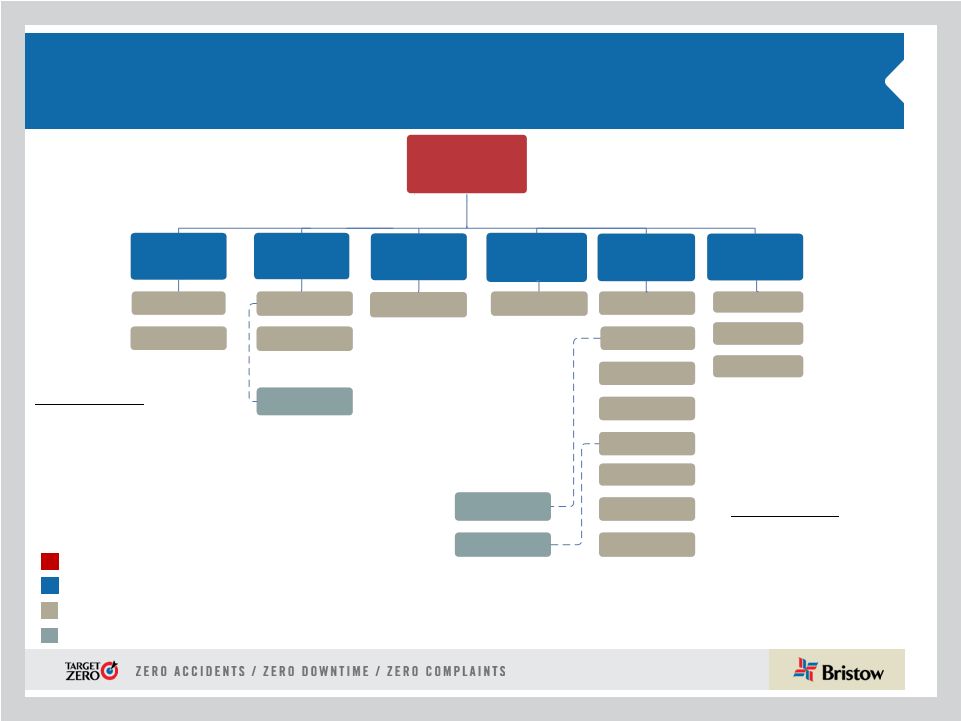 25
Business
Unit
(%
of
FY13
Operating
Revenue)
Corporate
Region
( # of Aircraft / # of Locations)
Joint
Venture
(#
of
aircraft)
Key
Operated Aircraft
Bristow owned and/or operated
357 aircraft as of June 30, 2012
Affiliated Aircraft
Bristow affiliates and joint
ventures operated 194 aircraft
as of June 30, 2012
Bristow
NABU
16%
U
S
GoM
–
79/
7
Trinidad
–
10/
1
Alaska
–
3
Mexico
–
12/
5
Brazil
10/
9
Lider
-
85
UK –32/
Norway
–
3
FBH -
64
Nigeria
–
7
Australia
–28/
10
Other
–
12/
1
Russia
–
3
Egypt –
–
Turkmenistan
–
1
PAS
-
45
AUSBU
12%
EBU
39%
Florida
–
/1
Louisiana
–
1
U
K
–
1
Malaysia
–
2
WASBU
21%
OIBU
10%
BRS Academy
2%
.
.
12/
–
26/
45/
7/
–
/
2/
14/
.
.
5/
5/
4
Organizational chart - as of June 30, 2012
58 |
 26
Aircraft fleet –
medium and large
as of June 30, 2012
Next Generation Aircraft
Medium capacity 12-16 passengers
Large capacity 18-25 passengers
Mature Aircraft Models
Aircraft
Type
No. of PAX
Engine
Consl
Unconsl
Total
Ordered
Large Helicopters
AS332L Super Puma
18
Twin Turbine
23
-
23
-
AW189
16
Twin Turbine
-
-
-
6
EC225
25
Twin Turbine
18
-
18
-
Mil MI 8
20
Twin Turbine
7
-
7
-
Sikorsky S-61
18
Twin Turbine
2
-
2
-
Sikorsky S-92
19
Twin Turbine
32
4
36
11
82
4
86
17
LACE
76
Medium Helicopters
AW139
12
Twin Turbine
7
2
9
-
Bell 212
12
Twin Turbine
1
14
15
-
Bell 412
13
Twin Turbine
34
20
54
-
EC155
13
Twin Turbine
3
-
3
-
Sikorsky S-76A/A++
12
Twin Turbine
15
5
20
-
Sikorsky S-76C/C++
12
Twin Turbine
52
31
83
-
112
72
184
-
LACE
51 |
 27
27
Aircraft fleet –
small, training and fixed
as of June 30, 2012 (continued)
Next Generation Aircraft
Mature Aircraft Models
Small capacity 4-7 passengers
Training capacity 2-6 passengers
LACE does not include held for sale, training and fixed wing helicopters
Aircraft
Type
No. of PAX
Engine
Consl
Unconsl
Total
Ordered
Small Helicopters
Bell 206B
4
Turbine
1
2
3
-
Bell 206 L-3
6
Turbine
4
6
10
-
Bell 206 L-4
6
Turbine
29
1
30
-
Bell 407
6
Turbine
39
-
39
-
BK 117
7
Twin Turbine
2
-
2
-
BO-105
4
Twin Turbine
2
-
2
-
EC135
7
Twin Turbine
6
3
9
-
83
12
95
-
LACE
21
Training Helicopters
AW139
12
Twin Turbine
-
3
3
-
Bell 412
13
Twin Turbine
-
8
8
-
Bell 212
12
Twin Turbine
-
15
15
-
AS355
4
Twin Turbine
5
-
5
-
AS350BB
4
Turbine
-
36
36
-
Agusta 109
8
Twin Turbine
-
2
2
-
Bell 206B
6
Single Engine
12
-
12
-
Robinson R22
2
Piston
12
-
12
-
Robinson R44
2
Piston
2
-
2
-
Sikorsky 300CB/Cbi
2
Piston
45
-
45
-
Fixed Wing
1
-
1
-
77
64
141
-
Fixed Wing
3
42
45
-
Total
357
194
551
17
TOTAL LACE (Large Aircraft Equivalent)
147 |
  28
Order and options book as of June 30, 2012
#
Helicopter
Class
Delivery Date
Location
Contracted
#
Helicopter
Class
Delivery Date
3
Large
December 2012
EBU
3
1
Large
September 2013
2
Large
December 2012
WASBU
0
1
Large
December 2013
2
Large
March 2013
EBU
2
1
Large
March 2014
1
Large
September 2013
EBU
0
1
Large
June 2014
1
Large
September 2013
NABU
0
1
Large
September 2014
2
Large
December 2013
OIBU
0
1
Large
December 2014
1
Large
September 2014
NABU
0
1
Large
March 2015
1
Large
December 2014
OIBU
0
2
Large
June 2015
1
Large
March 2015
OIBU
0
2
Large
September 2015
1
Large
June 2015
EBU
0
2
Large
December 2015
1
Large
March 2016
EBU
0
1
Large
March 2016
1
Large
June 2016
AUSBU
0
2
Large
June 2016
17
5
2
Large
September 2016
2
Large
December 2016
* Six large ordered aircraft expected to enter service beginning
1
Large
March 2017
in calendar year 2014 are subject to the successful development
1
Large
June 2017
and certification of the aircraft.
1
Large
September 2017
1
Large
December 2017
1
Medium
June 2013
4
Medium
December 2013
3
Medium
June 2014
2
Medium
September 2014
2
Medium
June 2015
36
ORDER BOOK*
OPTIONS BOOK |
  29
Consolidated fleet changes and aircraft sales for
Q1 FY13
EBU
WASBU
NABU
AUSBU
OIBU
Total
Large
3
-
-
3
-
6
Medium
2
1
-
1
7
11
Small
-
-
-
-
-
-
Total
5
1
-
4
7
17
Aircraft held for sale by BU
# of A/C Sold
Received*
Q1 FY13
4
19
$
Totals
4
19
$
* $ in millions
Q 1 FY13
Fleet Count Beginning Period
361
Delivered
S-92
2
Total Delivered
2
Removed
Sales
(4)
Other*
(2)
Total Removed
(6)
357
* Includes destroyed aircraft, lease returns
and commencements
Fleet changes
Large
8
-
2
1
-
-
11
Medium
-
1
11
-
-
-
12
Small
-
-
1
2
-
-
3
Fixed
-
-
-
-
-
-
-
Training
-
-
-
-
-
30
30
Total
8
1
14
3
-
30
56
Leased aircraft in consolidated fleet
WASBU
EBU
NABU
AUSBU
OIBU
BA
Total |
 30
Operating Revenue, LACE and LACE Rate by BU
1) $ in millions
2) LACE Rate is annualized
3) $ in millions per LACE
4) OIBU LACE rate is lower than other business units’ LACE rate due to a large proportion of
revenue being from dry leases Operating revenue
1
LACE
LACE Rate
2, 3
EBU
$123.2
47
$10.60
WASBU
66.4
22
12.35
NABU
52.6
30
7.05
AUSBU
38.2
18
8.48
OIBU
4
33.2
32
4.22
Total
$313.6
147
$8.55
Operating Revenue, LACE, and LACE Rate by BU
as of June 30, 2012 |
 31
Historical LACE and LACE Rate by BU
1) LACE Rate is annualized ($ millions)
2) OIBU
LACE
rate
is
lower
than
other
business
units’
LACE
rate
due
to
a
large
proportion
of
revenue
being
from
dry
leases
2013
Q1
Q2
Q3
Q4
Q1
Q2
Q3
Q4
Q1
EBU
42
43
48
46
44
46
46
45
47
WASBU
24
24
21
22
23
22
22
22
22
NABU
39
35
34
29
30
29
30
30
30
AUSBU
20
23
24
20
19
20
20
19
18
OIBU
33
33
33
38
39
38
38
34
32
Consolidated
157
158
159
154
154
154
155
149
147
2013
Q1
Q2
Q3
Q4
Q1
Q2
Q3
Q4
Q1
EBU
$8.20
$8.50
$7.90
$8.40
$9.80
$9.60
$9.63
$10.09
$10.60
WASBU
9.70
9.40
10.70
9.90
9.10
10.30
11.17
11.46
12.35
NABU
5.40
6.10
6.00
6.60
5.80
6.30
5.89
5.79
7.05
AUSBU
6.80
6.00
6.00
7.50
8.60
7.10
6.96
7.78
8.48
OIBU
3.90
4.10
4.40
3.90
3.50
3.70
3.78
4.22
4.22
Consolidated
6.70
6.90
6.90
7.10
7.30
7.40
7.43
7.89
8.55
2011
2012
LACE
LACE Rate
1,2
2011
2012 |
 32
Adjusted EBITDAR margin* trend
Q1
Q2
Q3
Q4
Full Year
Q1
Q2
Q3
Q4
Full Year
EBU
31.2%
31.7%
31.9%
28.0%
30.8%
29.8%
31.5%
34.6%
34.4%
32.7%
WASBU
31.7%
36.8%
33.7%
39.1%
36.0%
33.7%
36.9%
35.8%
34.3%
35.2%
NABU
18.3%
20.0%
14.9%
17.7%
17.8%
20.8%
25.8%
15.9%
8.5%
18.5%
AUSBU
26.5%
36.7%
34.4%
31.3%
32.4%
33.2%
26.1%
27.0%
31.1%
29.3%
OIBU
34.4%
37.6%
25.9%
25.1%
31.0%
18.3%
40.2%
37.4%
59.4%
39.3%
Consolidated
24.7%
27.8%
24.7%
23.9%
25.3%
23.8%
27.5%
25.9%
29.6%
26.7%
2013
Q1
Q2
Q3
Q4
Full Year
Q1
EBU
33.0%
31.4%
30.7%
36.1%
32.9%
32.2%
WASBU
29.5%
35.5%
37.2%
36.6%
35.0%
31.9%
NABU
14.3%
20.6%
14.8%
19.4%
17.3%
23.2%
AUSBU
20.2%
14.4%
23.5%
35.6%
24.3%
27.0%
OIBU
48.1%
19.1%
47.8%
42.9%
39.5%
36.2%
Consolidated
23.4%
24.0%
27.6%
31.2%
26.6%
26.3%
2010
2011
2012
* Adjusted EBITDAR excludes special items and asset dispositions and
calculated by taking adjusted EBITDAR divided by operating revenue |
 33
Adjusted EBITDAR* reconciliation
* Adjusted EBITDAR excludes special items and asset dispositions
($ in millions)
Q1
Q2
Q3
Q4
Full Year
Q1
Q2
Q3
Q4
Full Year
Net income
$24.0
$33.7
$27.1
$28.7
$113.5
$20.9
$38.8
$42.3
$31.2
$133.3
Income tax expense
9.5
11.2
5.7
2.6
29.0
8.5
3.3
-11.8
7.1
7.1
Interest expense
10.0
10.6
11.0
10.8
42.4
11.0
11.5
13.8
9.9
46.2
Gain on disposal of assets
-6.0
-4.9
-2.4
-5.3
-18.7
-1.7
-1.9
0.0
-5.1
-8.7
Depreciation and amortization
18.2
18.5
20.7
17.4
74.7
19.3
21.0
21.3
27.7
89.4
Special items
2.6
-2.5
-1.1
1.0
0.0
0.0
0.0
-1.2
2.4
1.2
EBITDA Subtotal
58.2
66.7
60.9
55.1
240.9
58.1
72.7
64.4
73.3
268.5
Rental expense
7.0
7.0
7.2
6.3
27.3
6.6
6.1
8.7
7.7
29.2
Adjusted EBITDAR
$65.2
$73.6
$68.1
$61.3
$268.2
$64.7
$78.8
$73.1
$81.1
$297.7
3/31/2013
($ in millions)
Q1
Q2
Q3
Q4
Full Year
Q1
Net income
$21.2
$3.0
$26.5
$14.6
$65.2
$24.2
Income tax expense
6.6
-1.9
7.1
2.4
14.2
6.2
Interest expense
9.0
9.5
9.8
10.0
38.1
8.8
Gain on disposal of assets
-1.4
1.6
2.9
28.6
31.7
5.3
Depreciation and amortization
22.7
25.4
22.7
25.3
96.1
21.4
Special items
0.0
24.6
0.0
3.4
28.1
2.2
EBITDA Subtotal
58.1
62.1
68.9
84.3
273.4
68.0
Rental expense
9.0
9.1
12.8
15.1
46.0
16.3
Adjusted EBITDAR
$67.0
$71.2
$81.8
$99.5
$319.5
$84.3
3/31/2010
3/31/2011
3/31/2012
Fiscal year ended
Fiscal year ended |
 34
Gross cash flow presentation
($ in millions)
Gross Cash Flow Reconciliation
Q1 FY12
Q1 FY13
Net Income
$21
$24
Depreciation and Amortization
23
21
Interest Expense
9
9
Interest Income
(0)
(0)
Rent
9
16
Other Income/expense-net
(0)
1
Gain/loss on Asset Sale
(1)
5
Special Items
0
2
Tax Effect from Special Items
0
(2)
Earnings (losses) from Unconsolidated Affiliates, Net
(6)
(2)
Non-controlling Interests
0
1
Gross Cash Flow before Lider
$54
$75
Gross Cash Flow - Lider proportional
6
5
Gross Cash Flow after Lider
$60
$80
Special items:
FY13 includes: $2.2m special charge for severance costs related to the termination of a contract
in the Southern North Sea |
 35
Gross operating asset presentation
($ in millions)
Adjusted Gross Operating Assets Reconciliation
Q1 FY12
Q1 FY13
Total Assets
$2,701
$2,740
Accumulated Depreciation
463
468
Capitalized Operating Leases
136
194
Cash and Cash Equivalents
(117)
(227)
Investment in Unconsolidated Entities
(210)
(201)
Goodwill
(30)
(29)
Intangibles
(7)
(4)
Assets Held for Sale: Net
(34)
(18)
Assets Held for Sale: Gross
77
86
Adj. for gains & losses on assets sales
(0)
116
Accounts Payable
(51)
(58)
Accrued Maintenance and Repairs
(11)
(16)
Other Accrued Taxes
(4)
(7)
Accrued Wages, Benefits and Related Taxes
(33)
(43)
Other Accrued Liabilities
(18)
(27)
Income Taxes Payable
(16)
(10)
Deferred Revenue
(9)
(13)
ST Deferred Taxes
(10)
(15)
LT Deferred Taxes
(155)
(142)
Adjusted Gross Operating Assets before Lider
$2,672
$2,794
Adjusted
Gross
Operating
Assets
-
Lider
proportional
202
182
Adjusted Gross Operating Assets after Lider
$2,874
$2,976 |
 36
GAAP reconciliation
(i)
These amounts are presented after applying the appropriate tax effect to each item
and dividing by the weighted average shares outstanding during the related
period to calculate the earnings per share impact. Three Months Ended
June 30,
2012
2011
(In thousands, except per
share amounts)
Adjusted operating income
$
47,470
$
34,989
Gain (loss) on disposal of assets
(5,315)
1,416
Severance costs for termination of a contract
(2,162)
—
Operating income
$
39,993
$
36,405
Adjusted EBITDAR
$
84,273
$
67,025
Gain (loss) on disposal of assets
(5,315)
1,416
Severance costs for termination of a contract
(2,162)
—
Depreciation and amortization
(21,372)
(22,708)
Rent expense
(16,274)
(8,953)
Interest expense
(8,774)
(8,955)
Provision for income taxes
(6,180)
(6,606)
Net income
$
24,196
$
21,219
Adjusted net income
$
29,618
$
19,878
Gain (loss) on disposal of assets
(i)
(4,234)
1,167
Severance costs for termination of a contract
(i)
(1,722)
—
Net income attributable to Bristow Group
$
23,662
$
21,045
Adjusted diluted earnings per share
$
0.81
$
0.54
Gain (loss) on
disposal of assets
(i)
(0.12)
0.03
Severance costs for termination of a contract
(i)
(0.05)
—
Diluted earnings per share
0.65
0.57 |
 37
Leverage reconciliation
*Adjusted EBITDAR exclude gains and losses on dispositions of assets
Debt
Investment
Capital
Leverage
(a)
(b)
(c) = (a) + (b)
(a) / (c)
(in millions)
As of June 30, 2012
736.3
$
1,540.7
$
2,277.0
$
32.3%
Adjust
for:
Unfunded pension liability
109.8
109.8
NPV of all lease obligations
217.0
217.0
Letters of credit
1.5
1.5
Adjusted
1,064.6
$
(d)
1,540.7
$
2,605.3
$
40.9%
Calculation of debt to adjusted EBITDAR multiple
Adjusted
EBITDAR*:
FY 2012
336.8
$
(e)
Annualized
449.1
$
= (d) / (e)
3.16:1 |
 38
Bristow Group Inc. (NYSE: BRS)
2103 City West Blvd., 4
th
Floor
Houston, Texas 77042
t
713.267.7600
f
713.267.7620
bristowgroup.com
Contact us |