Attached files
| file | filename |
|---|---|
| 8-K - 8-K - TRANS ENERGY INC | d418560d8k.htm |
| EX-99.2 - EX-99.2 - TRANS ENERGY INC | d418560dex992.htm |
 August 2012
Exhibit 99.1
THE OIL & GAS CONFERENCE |
 Disclaimer
2
This presentation contains “forward-looking statements” within the meaning of section
21E of the United States Securities Exchange Act of 1934, as amended (the “Exchange
Act”) which represent our expectations or beliefs about future events. These statements can be
identified generally by forward-looking words such as “expect”, “believe”,
“anticipate”, “plan”, “intend”, “estimate”, “may”, “will” or similar
words. Forward-looking statements are statements about the future and are inherently uncertain,
and our actual achievements or other future events or conditions may differ materially from
those reflected in the forward-looking statements due to a variety of risks, uncertainties
and other factors, including, without limitation, those described in Item 1A of the company’s annual report on form 10-K for the
year ended December 31, 2011 under the heading, “Risk Factors”, and elsewhere in the annual
report and our filings with the Securities and Exchange Commission. These risks and
uncertainties include, but are not limited to:
1. The risks of the oil and gas industry, such as operational risks in exploring for, developing and
producing crude oil and natural gas; 2. market demand; 3. risks and uncertainties involving
geology of oil and gas deposits; 4. the uncertainty of reserves estimates and reserves life; 5.
the uncertainty of estimates and projections relating to production, costs and expenses; potential delays or changes in plans with
respect to exploration or development projects or capital expenditures; 6. fluctuations in oil and gas
prices, foreign currency exchange rates and interest rates; 7. health, safety and environmental
risks; 8. uncertainties as to the availability and cost of financing; 9. the possibility that
government policies or laws may change or governmental approvals may be delayed or withheld; 10. other
sections of this presentation may include additional factors that could adversely affect our
business and financial performance. Moreover, we operate in a very competitive and rapidly
changing environment. New risk factors emerge from time to time and it is not possible for our management to
predict all risk factors, nor can we assess the impact of all factors on our business or the extent to
which any factor, or combination of factors, may cause actual results to differ materially from
those contained in any forward-looking statements.
Our forward-looking statements contained in this presentation are made as of the respective dates
set forth in this presentation. Such forward-looking statements are based on the beliefs,
expectations and opinions of management as of the date the statements are made. We do not
intend to update these forward-looking statements. For the reasons set forth above, investors should not place undue reliance
on forward-looking statements. Readers are
encouraged to read our December 31, 2011 Annual Report on Form 10-K and any and all of our other documents filed with
the SEC regarding information about Trans Energy, Inc. for meaningful cautionary language in respect
of the forward-looking statements herein. Interested persons are able to obtain
copies of filings containing information about Trans Energy, Inc., without charge, at the SEC’s
internet site (http://www.sec.gov).
|
 COMPANY OVERVIEW
 |
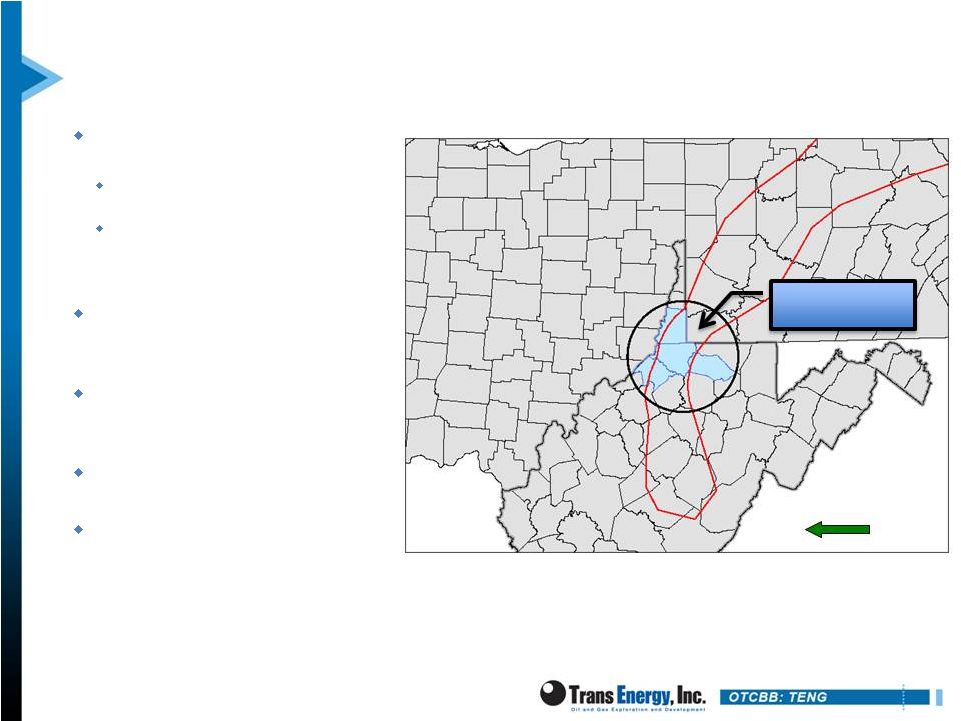
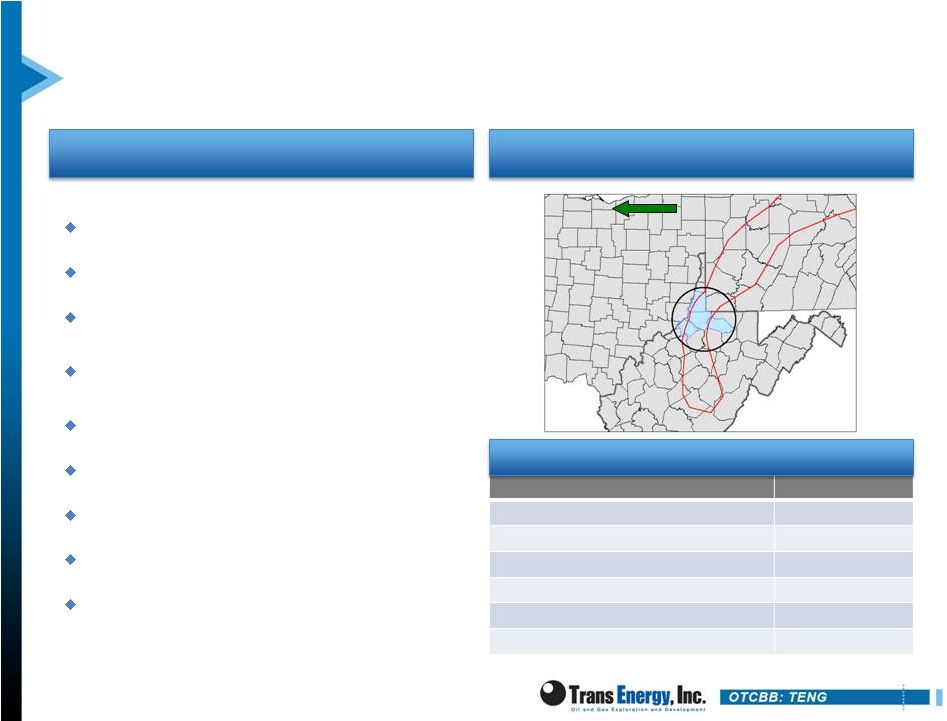 About Trans Energy
Company Overview
Trans Energy: (OTCBB: TENG)
Pure Play Marcellus Shale
Proved Reserves: 49.5 Bcfe
(9/20/2012
Wright
&
Co.
-
Marcellus
only)
Recent Daily Production: 4,565
Mcfe
(does not include wells turned on in September)
52-Week
Range:
$1.26
-
$3.20
3-Month
Avg.
Daily
Volume
–
1,197
Shares
Shares Outstanding: 13.2 Million
Market Capitalization: $22.4 million
Experienced Management Team
Selected Financial Information
4
Area of Operation
Dry Gas
Wet Gas
6/30/2012
LTM Revenue
$ 14.6 million
Net Debt (as of 6/30/2012)
$34.5 million
Recent Stock Price (TENG)
$ 1.70
Shares Outstanding (8/10/2012)
13.2 million
Market Capitalization
$22.4 million
Enterprise Value
$56.9 million |
 Why
Invest in Trans Energy? 5
Marcellus Shale Pure Play
63,500 gross acres in core of the Marcellus Shale
Utica Shale potential
Upper Devonian upside potential
High-BTU, liquid-rich focus
$1.50 per MMBtu breakeven gas price
Extensive Organic Drilling Inventory
400 + potential drilling locations (127 ready to drill today)
3+ Tcfe gross upside potential (including JV & royalty partners)
Significant portion of acreage HBP (approx. 2/3)
Off-take agreements totaling up to 45,000 MMBtu per day
Improved Financials
$50 million credit facility funding near term drilling program
Experienced Management w/ Technical Expertise
More than 200 years combined management experience
Well-funded joint development partner has geologic /
engineering team
Marcellus Shale pure play
Predictable and repeatable inventory
Prominent land position with strong
upside potential
Trades at a significant discount to
NAV
Experienced Management Team
Dry Gas
Wet Gas |
 Corporate Strategy
Consolidate acreage surrounding legacy positions in the core
of the Marcellus
Marshall, Wetzel, Marion and Tyler counties
Building
upon
local
presence
–
West
Virginia
company
Drill to turn highly prospective acreage into 3P reserves
Secure and maintain land position via production rights
Grow production and reserves / monetize assets
6 |
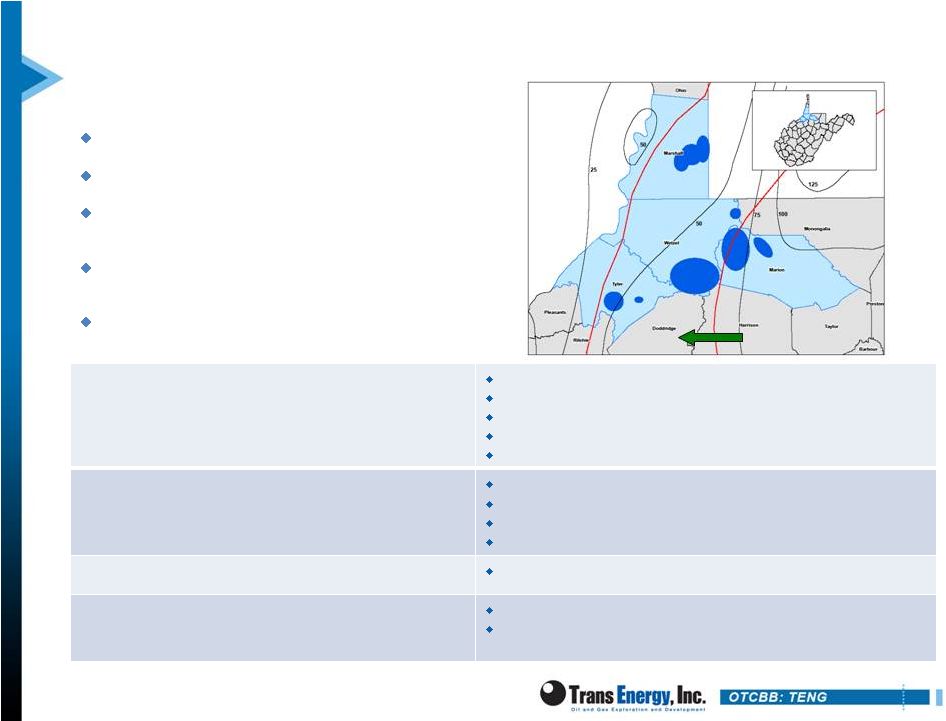
 Marcellus Overview
Majority of Company acreage
located in wet gas window
NGL
yields
in
the
1.4
–
1.9
gallons
per
mcf
range
Ft. Beeler processing plants provide 320
MMcf/day throughput capacity
Condensate and NGLs provide
$1.00
-
$2.00
pricing
uplift
vs. dry gas
$1.50 per MMBtu breakeven
natural gas price (with NGLs @
50% WTI price)
Low-cost, highly predictable and
repeatable play
In Trans Energy’s area of
operation, the Marcellus shale is
approximately
50
–
100
feet
thick
7
Dry Gas
Wet Gas
Trans Energy Area of
Operation |
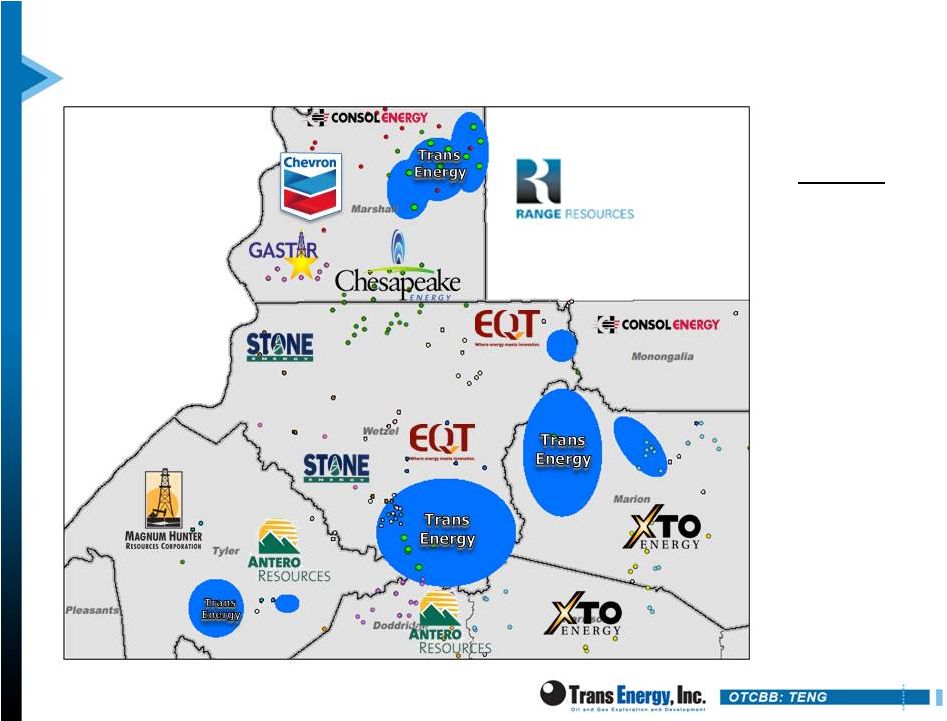 Competitive Market Position
8
Marcellus
Horizontal
Permits
(2008-2012)
Marion:
76
Marshall: 304
Tyler:
30
Wetzel: 253 |
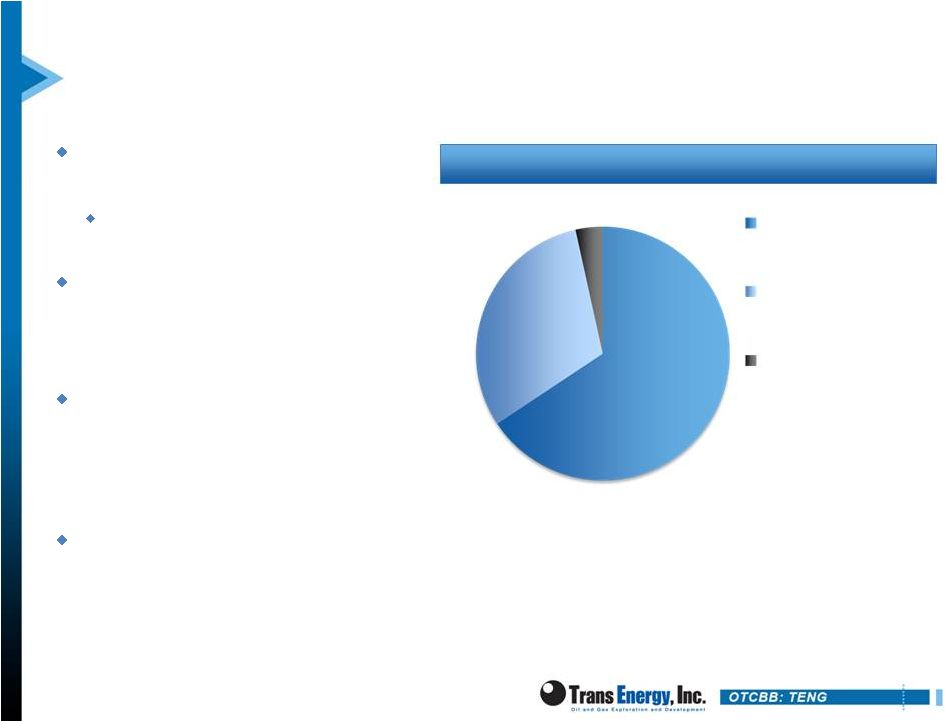 Current Marcellus Acreage
Significant Marcellus acreage that
is held by shallow well production
Approximately 350 horizontal well
locations from HBP acreage alone
Primary term leased acreage can
generally be held by production
from shallow vertical or Marcellus
horizontal wells
Current drilling program
supplemented with selective
shallow drilling will HBP all strategic
acreage with near term lease
expirations over the next two years
Significant amount of acreage is
also prospective for the Utica shale
9
Acreage
Breakdown
–
22,925
Net
acres
7,077 acres
15,056 acres
792 acres
Held by Production
Mineral Right -
Purchased
Leased
-
Term |
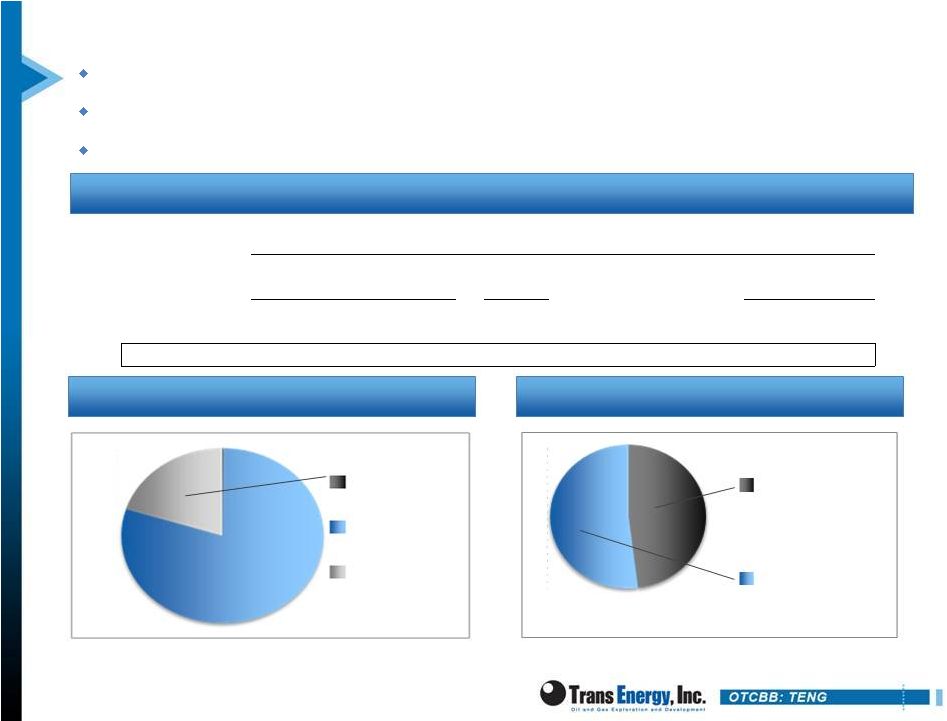 Reserves and Resources
Trans Energy has exposure to more than 3 Tcfe of Marcellus resource potential
More than 400 potential drilling locations (127 ready to drill today)
EUR per well of 1.2 –
2.0 Bcfe /1000’
of lateral
10
9/20/12 SEC Reserve Summary
(1)
(1)
Based on Proved Reserve Bcfe values for ASD from the 09/20/2012 SEC reserve report
prepared by independent reserve engineer Wright & Company, Inc.
Trans Energy has 2.53 Bcfe of PDP reserves associated with shallow assets that are
not included in the above figures.
Proved Reserve Mix
(1)
Proved Reserve Category Mix
(1)
($ in millions)
Oil
(MMbbl)
Gas
(Bcf)
NGL
(MMbbl)
Total
(Bcfe)
% of total
Total
PV10%
PDP/PDNP
0.0079
20.792
0.816
25.733
51.9%
$91.5
$38.6
PUD
0.0091
18.705
0.831
23.747
48.1%
$ 64.5
$14.9
Total Proved
0.0171
39.499
1.657
49.545
$157.7
$54.2
PROBABLE
(2)
0.0648
220.743
7.699
267.329
$672.6
$83.4
-
0.22%
-
79.7%
-
20.1%
-
48.1%
-
51.9%
(2)
Approximately 1/3 of the Non-proved Reserves shown above have been designated
as “Probable” due to funding limitations.
Oil
Gas
NGL
PUD
PDP/PDNP |
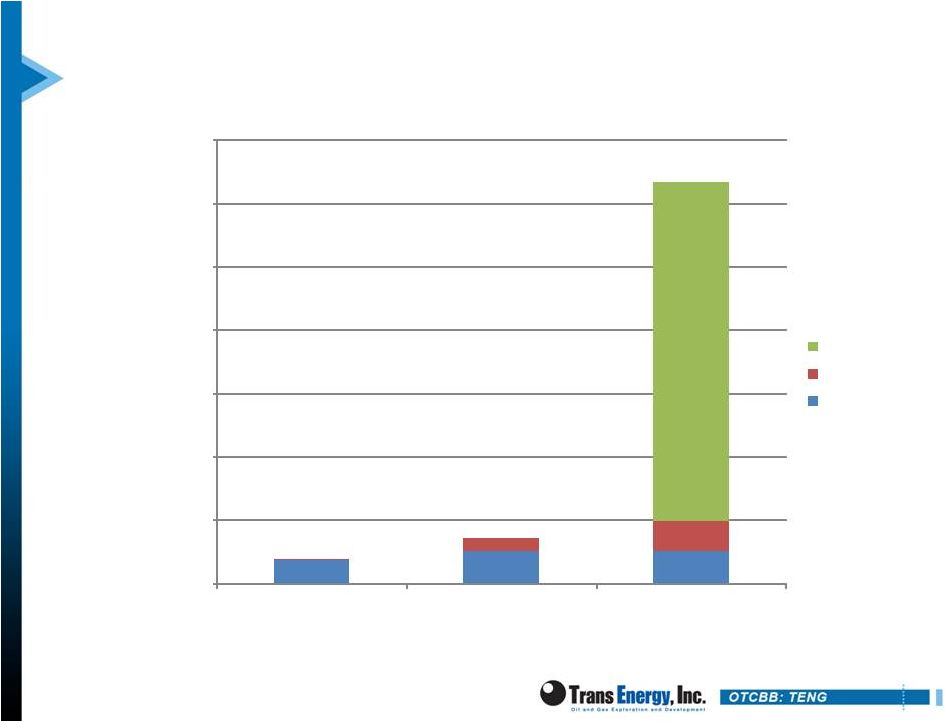 Gross Reserves and Resources
11
BCFE
0.00
50.00
100.00
150.00
200.00
250.00
300.00
350.00
January 1, 2012
July 1, 2012
September 20, 2012
Probable
PUD
PDP/PDNP |
 Wet
Gas Provides Positive Economics $3.00 NYMEX Equals $4.32/MCF Wellhead
Price •
$3.00 / MMBTU NYMEX Henry Hub
•
$85 NYMEX WTI
12
1.
$0.02 premium to NYMEX Henry Hub
2.
1.116 MMBTU/mcf residue BTU factor
3.
40% NYMEX WTI per NGLs
4.
42 gal/bbl conversion factor
5.
90% NGLs
6.
$26.00 less WTI for Appalachian Light Sweet
One mcf Natural Gas via Wellhead Production
Natural Gas
Natural Gas Liquids
Condensate
Production Breakdown
.9 MCF
1.6 Gallons/MCF
.00212 BBLS/MCF
Gross Realized Price by Product
$3.03 net
(1)(2)
$1.16 net
(3)(4)(5)
$0.13 net
(6)
Total Realized Price per 1 MCF
$4.32/MCF
Gathering, Transportation and
Processing
($0.75/MCF)
Net Realized Price per 1 MCF
$3.57/MCF |
 Experienced Management Team
13
Steve Lucado
Chairman of the Board
Director since 2011
More than 18 years professional financial experience, including E&P CFO experience
Bachelor of Arts Degree Harvard University, MBA, University of Chicago
John Corp
President & Director
Director since 2005 and President since June 2010
More than 25 years drilling, production and operations experience
Received a Bachelor of Science Degree in Petroleum Engineering from Marietta
College
John Tumis
Chief Financial Officer
Chief Financial Officer of Trans Energy since April 2011
More than 25 years experience in financial and strategic business planning in the oil
and natural gas industry
Received a Bachelor of Science Degree from Ohio Northern University and is a
certified public accountant
Leslie Gearhart
Vice President of Operations
& General Secretary
Vice President of Operations and General Secretary
Has more than 25 years of experience in the oil and gas industry
in the Appalachian
Basin
Graduated with a Bachelor of Science Degree in Petroleum Engineering from
Marietta College |
 Joint Development Partner: Republic Energy
Republic is a privately held Dallas-based E&P company
Technical team has 200+ years combined industry
experience
Former VP Geology and Head of Completion Operations for North Texas
from Mitchell Energy Corporation
Mitchell
was
the
cutting
edge
Barnett
player
–
wrote
the
book
on
shale
fracing
Focused on assets in the JV with Trans Energy
Equity financing from Energy Trust Partners (an affiliate of
Energy Spectrum) and Wells Fargo
14 |
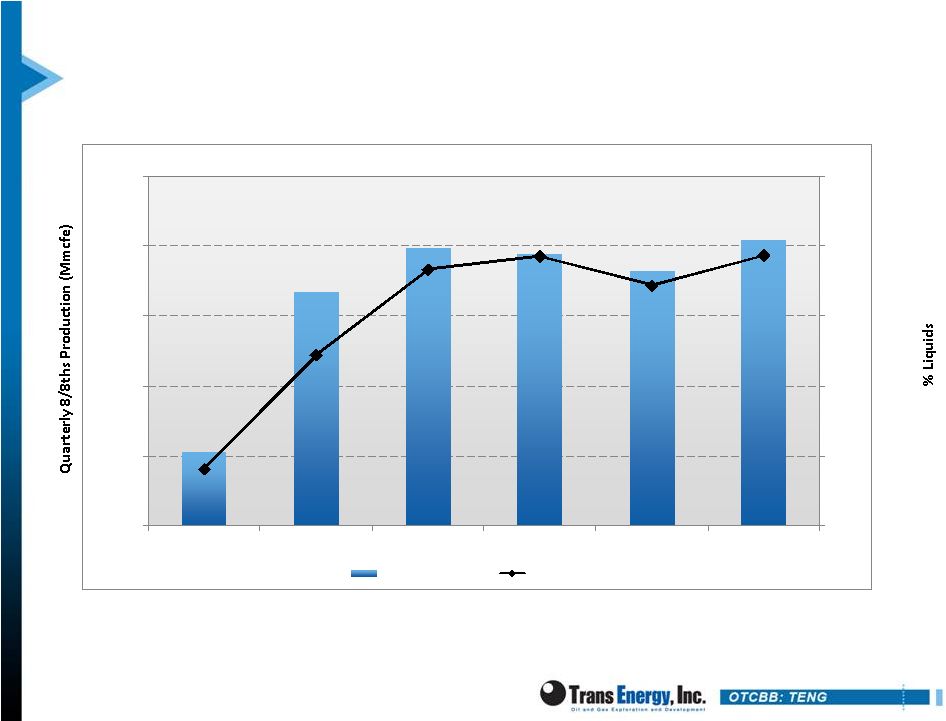 Horizontal Marcellus Production History
15
0%
5%
10%
15%
20%
25%
-
500
1,000
1,500
2,000
2,500
Q1 2011
Q2 2011
Q3 2011
Q4 2011
Q1 2012
Q2 2012
Total MMCFE
% Liquids |
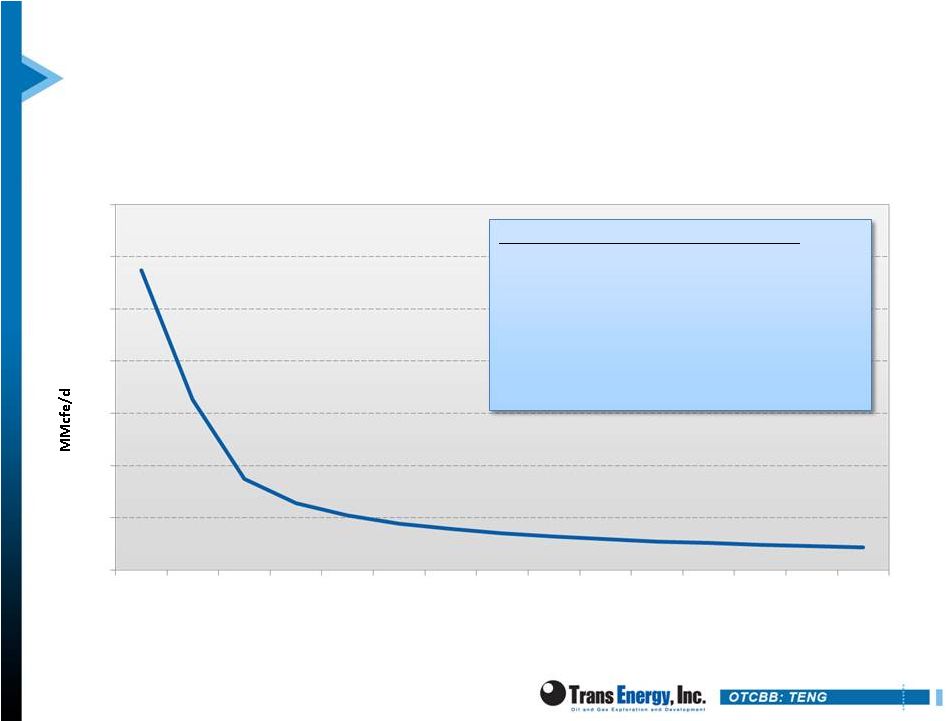 Marshall County Well Performance
(1)
Based on realized prices of $90 per barrel Oil, realized NGL prices of $45 per
barrel and $3.00 natural gas price.
(2)
Realized $90 per barrel oil and realized NGL prices of $45 per barrel held
constant. Projected
Horizontal
Well
Results
Reserves per well: 7.6 Bcfe
IP Rates: 5.7 MMcfe/d
Percent Liquids: 20%
Gross cost per well: $7.0MM
Average Lateral Length: 4000'
IRR
(1)
: 25%
Breakeven
Gas
Price
(2)
:
$1.50
per
MMBtu
Years
Horizontal Decline Curve
0
1
2
3
4
5
6
7
0
1
2
3
4
5
6
7
8
9
10
11
12
13
14 |
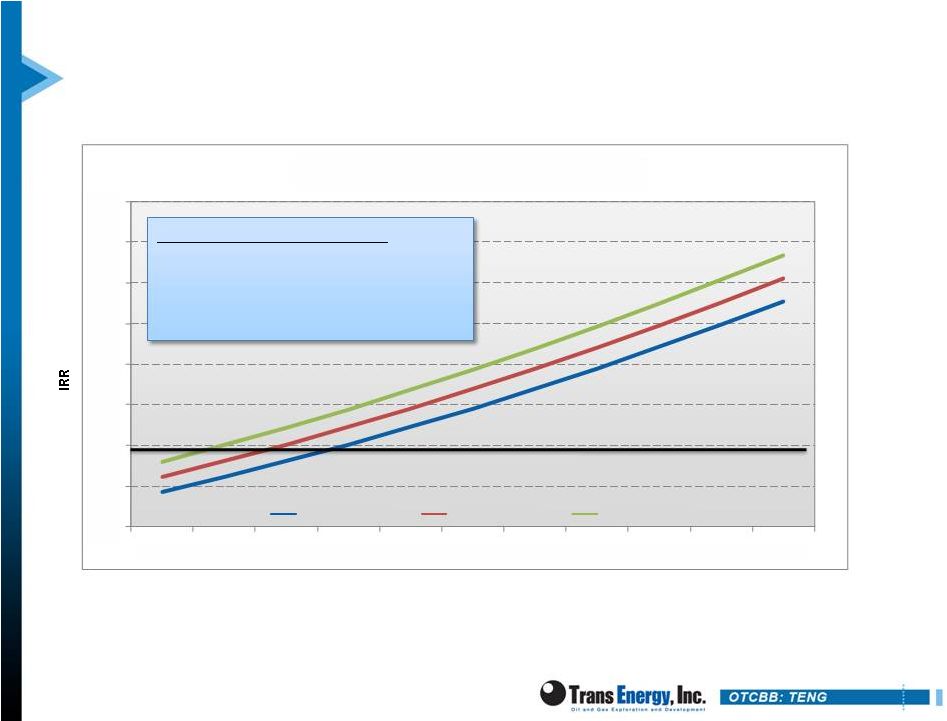 Marshall County Well Performance
Projected
Horizontal
Well
Reserves per well: 7.6 Bcfe
IP Rates: 5.7 MMcfe/d
Percent Liquids: 20%
WTI Price/Bbl: $90
Natural Gas Price ($ per MMBtu)
0%
5%
10%
15%
20%
25%
30%
35%
40%
$1.00
$1.25
$1.50
$1.75
$2.00
$2.25
$2.50
$2.75
$3.00
$3.25
$3.50
Economic Sensitivities
NGL = 40% WTI
NGL = 50% WTI
NGL = 60% WTI |
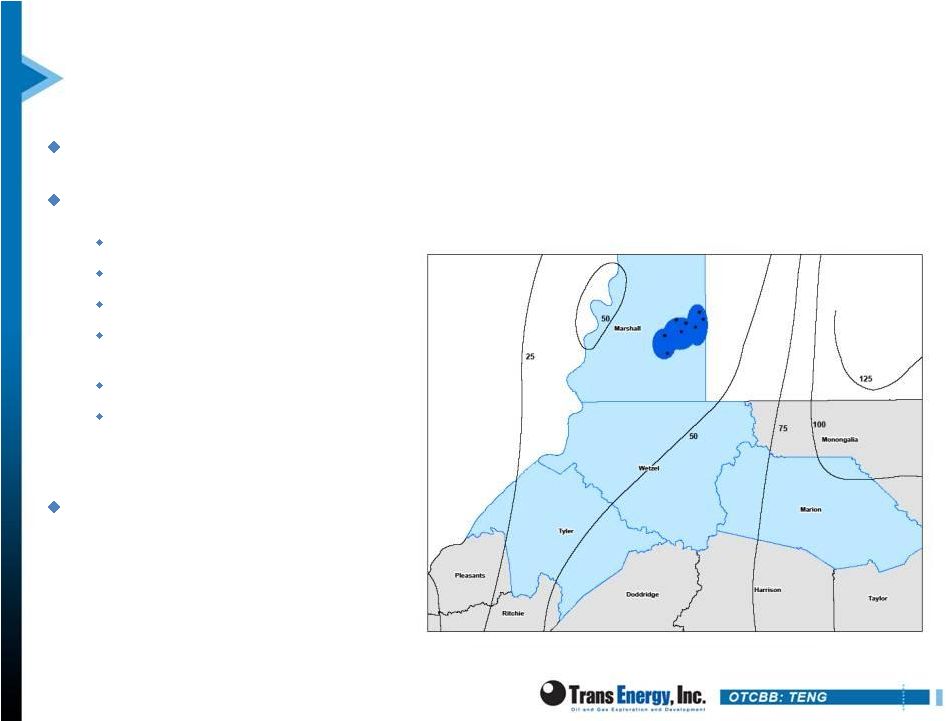 Marshall County: Drilled Marcellus Wells
JV has 12,471 gross acres of leased and owned minerals
10 wells drilled & fraced, 3 wells drilled
Average 30-day IP of 4.1 MMcfe/d
20% Oil/NGLs
4,000’
Average lateral length
Average EUR / 1000’
lateral
of 1.55 Bcfe
4.5 Frac Stages/1000' lateral
Drill time of 35 days spud
to rig release
44 remaining liquids-rich
locations in these units
18 |
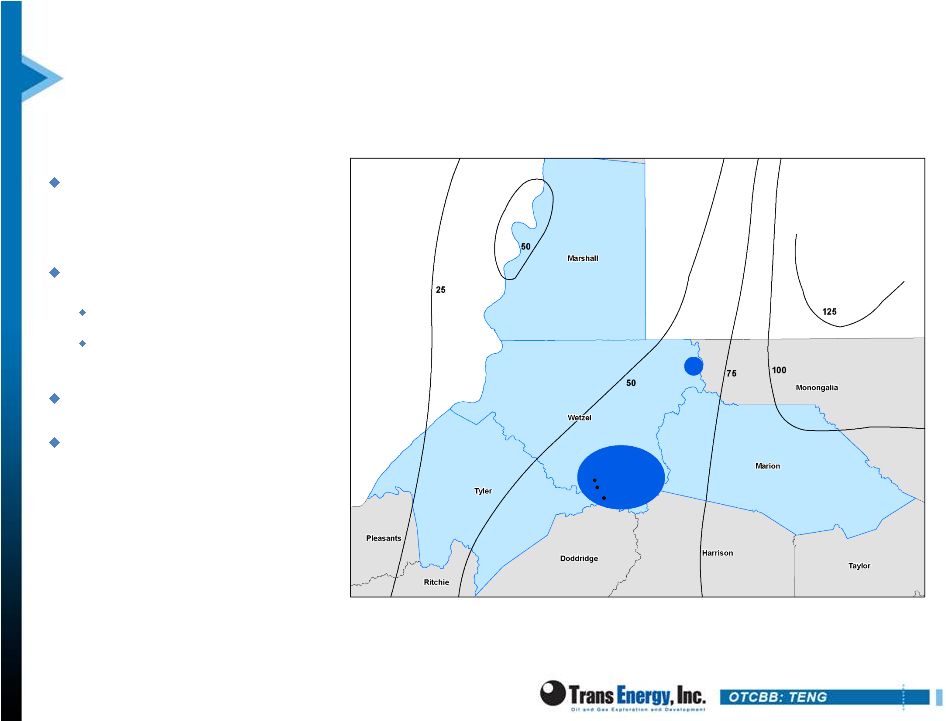 Wetzel County: Drilled Marcellus Wells
JV has 27,853 gross acres
of leased and owned
minerals
5 wells drilled & fraced
4.5 Frac Stages/1000' lateral
Drill time of 35 days spud to rig
release
35 ready to drill locations
61 additional potential
locations
19 |
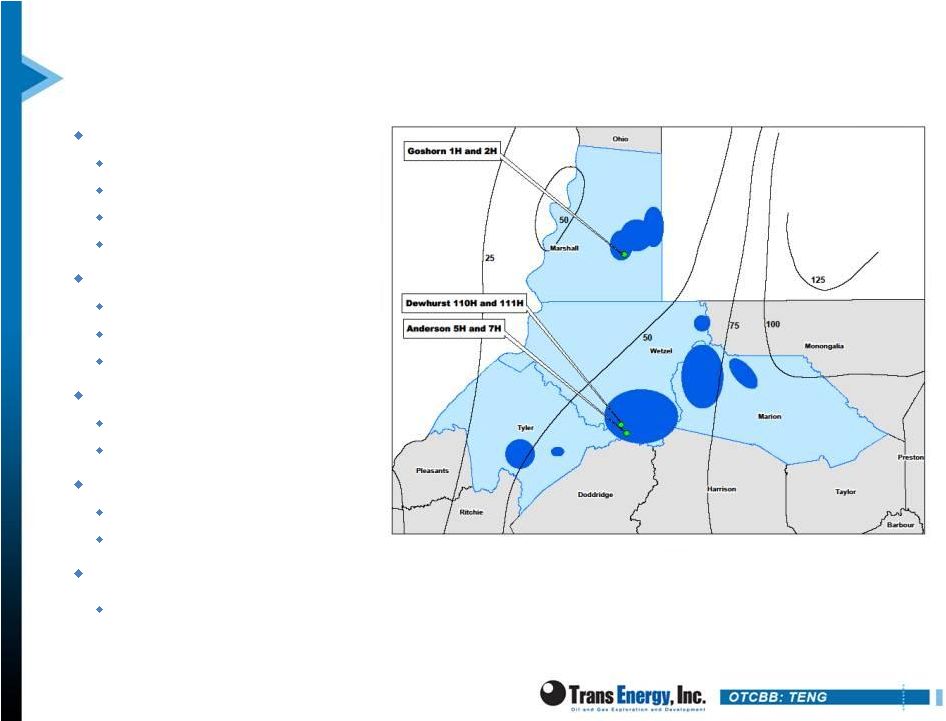 IP
Rates - Recent Marcellus Completions
Goshorn 1H (4,829 ft lateral)
Turned On May 2012
1
30
day
Production
3,942
MCFE/D
1
60
day
Production
3,843
MCFE/D
1
90
day
Production
3,634
MCFE/D
Goshorn 2H (4,763 ft lateral)
Turned On June 2012
1
30
Day
Production
5,151
MCFE/D
1
60
Day
Production
5,055
MCFE/D
Dewhurst 110H (4,284 ft lateral)
Turned on September 2012
Initial rates 8,000+ MCFE/D
Dewhurst 111H (5,188 ft lateral)
Turned on September 2012
Initial rates 8,000+ MCFE/D
Anderson 7H and 5H (4,480 & 4,970 ft laterals)
Both wells scheduled to be on line by the end of September
st
st
st
st
st
20 |
 Marion
&
Tyler
Counties
21
…THE NEXT STEP… |
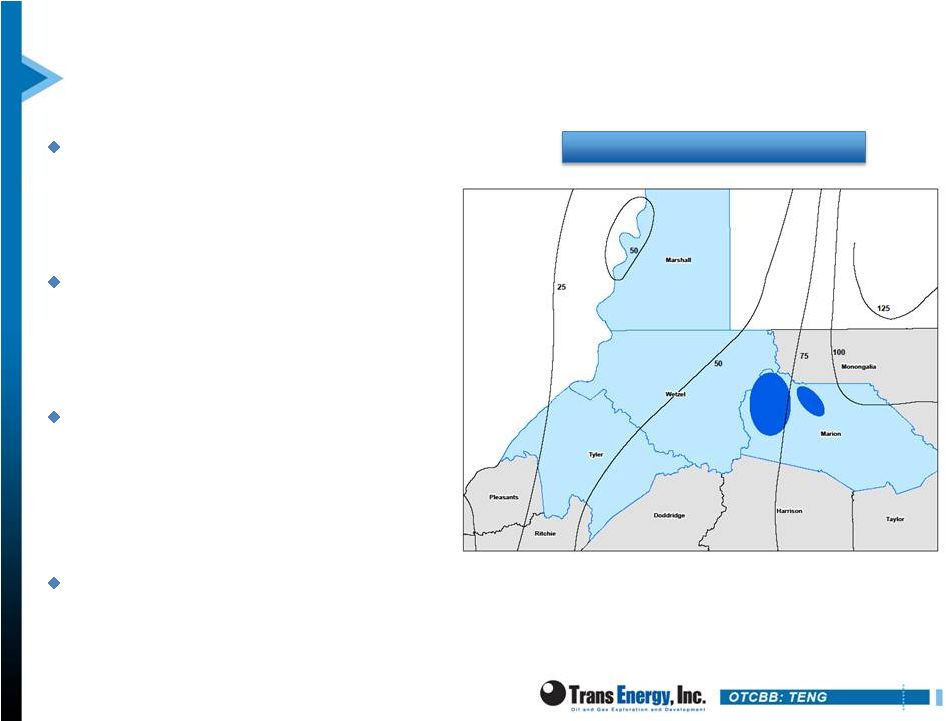 Marion
County
JV has 18,179 gross acres of
leased and owned minerals
Total number of potential wells:
117
Total number of wells that could
be drilled today (pend. permits):
19
2013 Drilling Program: 4 wells
22
Marion
County |
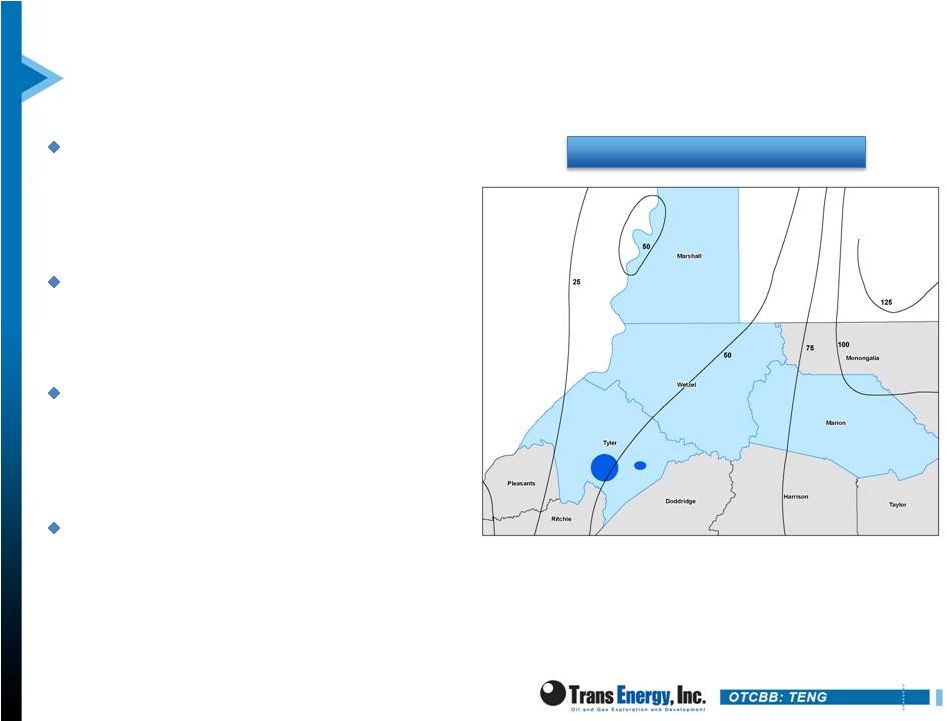 Tyler County
JV has 4,000 gross acres of leased
and owned minerals
Total number of potential wells: 47
Total number of wells that could be
drilled today (pend. permits): 36
2013 Drilling Program: 4 wells
23
Tyler County |
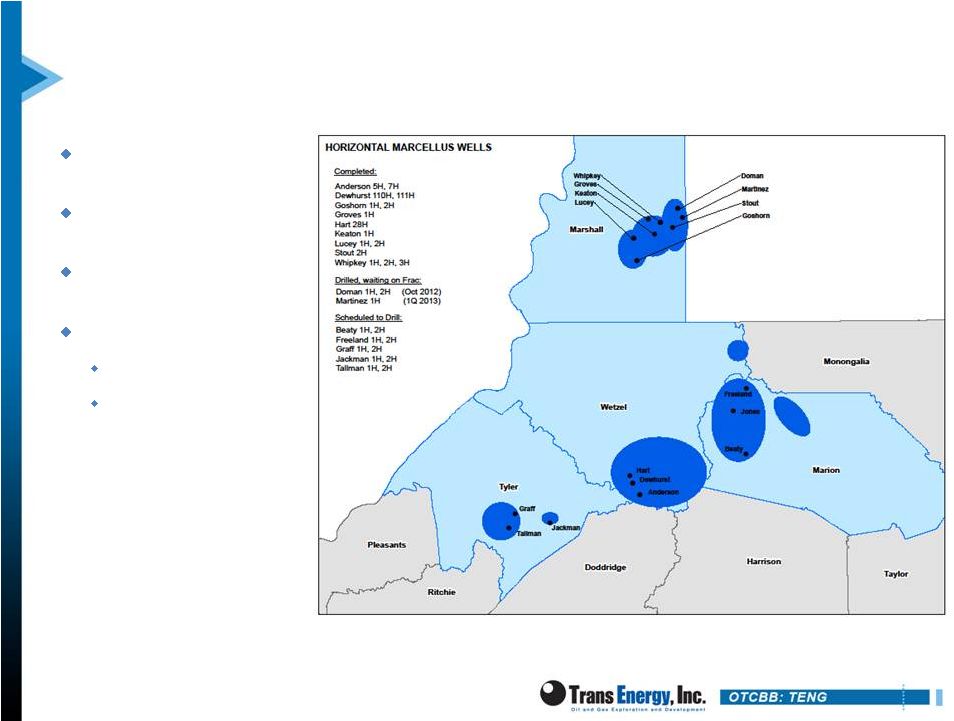 Drilling Program –
Recap
15 wells on line by end
of September
3 wells drilled waiting on
frac
2 wells should go on line
December 2012
2013 Drilling Program
Marion
Tyler
24 |
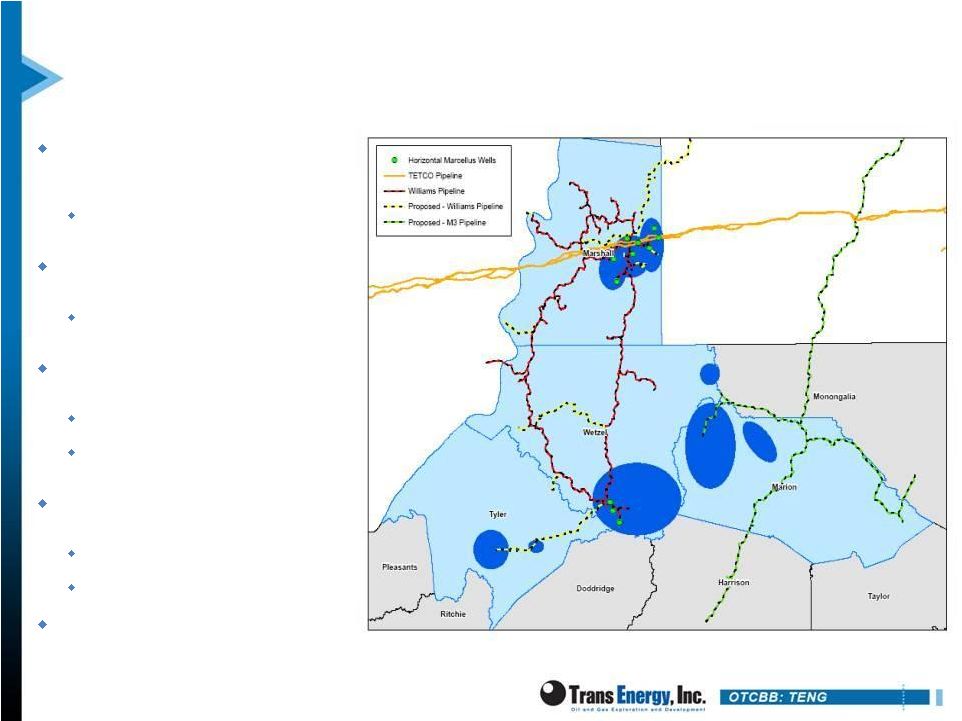 Gas
Off-Take (Williams & Momentum 3) 20-year
gas gathering agreement with Williams for up to 45,000
MMBTU / day
90,000 MMBTU / day including
Republic capacity
Williams committed to provide off-
take for all wells to be drilled
Access to the TETCO, Columbia and
Dominion lines
Williams providing off-take for all
existing horizontal wells
Marshall County wells feed into TETCO
Wetzel County wells are now feeding
into TETCO
Ft. Beeler cryogenic processing
facility started up in 2Q 2011
NGL
yields
up
to
1.4
–
1.9
gal/mcf
Second facility just started
Momentum 3 will provide
transportation in Marion County
25 |
 Net
Asset Value 26
Trading at significant discount to net asset value (NAV)
Trans
Energy
(1)
Sum-of-Parts NAV
Low
High
Low
High
Low
High
10/1/2012 Proved Reserves
49.55
Bcfe
$1.00
$4.00
$49,550,000
$198,200,000
$3.77
$15.06
45
Other
Current
drilling
locations
from
existing
pads
(2, 3)
120
Bcfe
$1.00
$4.00
$120,429,161
$481,716,644
$9.15
$36.61
70
Current
drilling
locations
from
new
pads
(2, 3)
187
Bcfe
$0.25
$0.75
$46,833,563
$140,500,688
$3.56
$10.68
Undeveloped Acreage:
Marcellus
14,000
Net acres
$1,000
$5,000
$14,000,000
$70,000,000
$1.06
$5.32
Utica
20,000
Net acres
$0
$0
$0
$0
$0.00
$0.00
Upper Devonian
20,000
Net acres
$0
$0
$0
$0
$0.00
$0.00
Less:
Net debt as of 6/30/12
($34,451,602)
($34,451,602)
($2.62)
($2.62)
Total (pre ASD warrants)
$196,361,122
$855,965,730
$14.92
$65.05
Total (post ASD warrants)
$163,207,783
$694,189,492
$12.40
$52.76
Shares
outstanding
(4)
13,158,578
13,158,578
Notes
(1)
Figures below include only the assets in Trans Energy's 100% wholly-owned
subsidiary, ASD; Figures do not reflect shallow well assets. (2)
(3)
Current drilling locations defined as wells where:
(b) The average lateral length on each pad site is at least 3,000 feet,
(c) Each well is on a pad site from which ASD can currently drill at least two
such wells, and (d) Each pad site has been fully surveyed in the field, and
a judgment has been made that the topography will support the pad site
(4)
Does not reflect potenital dilution due to outstanding options.
Value Per Share
Total Value
Unit Value
Category
Assumes an average EUR of 7.8 Bcfe per well and an average NRI of 34%. (a) ASD currently controls 100% of the acreage
required to drill each well |
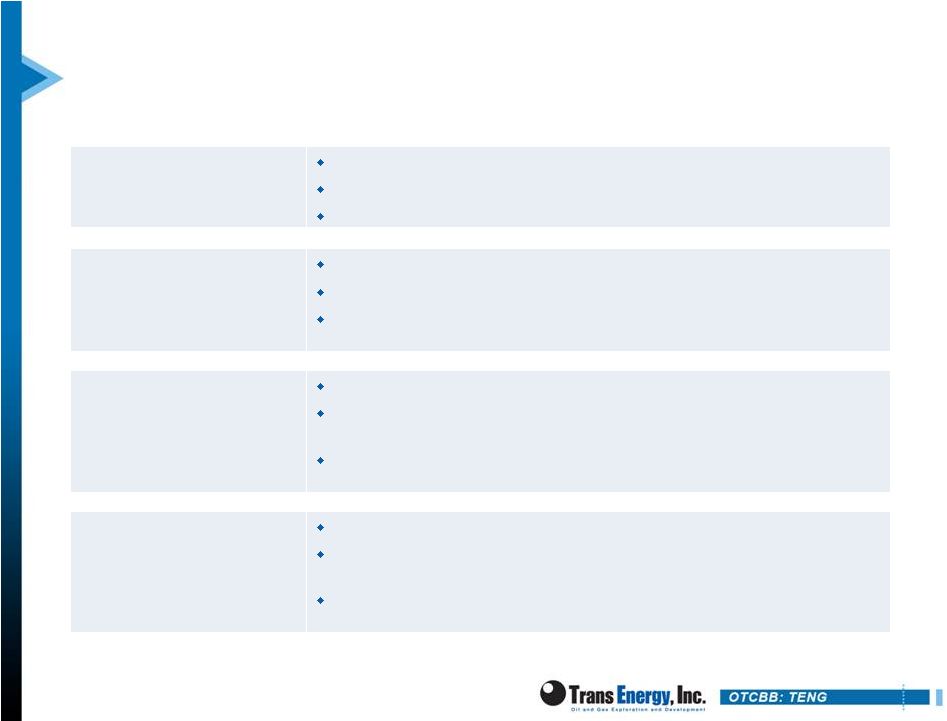
 Why
Invest in Trans Energy? 27
Marcellus Shale Pure Play
63,500 gross acres in core of the Marcellus Shale
Utica Shale potential
Upper Devonian upside potential
High-BTU, liquid-rich focus
$1.50 per MMBtu breakeven natural gas price
Extensive Organic Drilling
Inventory
w/ Large Acreage
Position
400 + potential drilling locations
3+ Tcfe upside potential (including JV and royalty partners)
Significant portion of acreage HBP (approx. 2/3)
Off-take agreements totaling up to 45,000 MMBtu per day
Improved Financials
$50 million credit facility funding near term drilling program
Experienced Management w/
Technical Expertise
More than 200 years combined management experience
Well-funded joint development partner has geologic / engineering team
|
 APPENDIX
 |
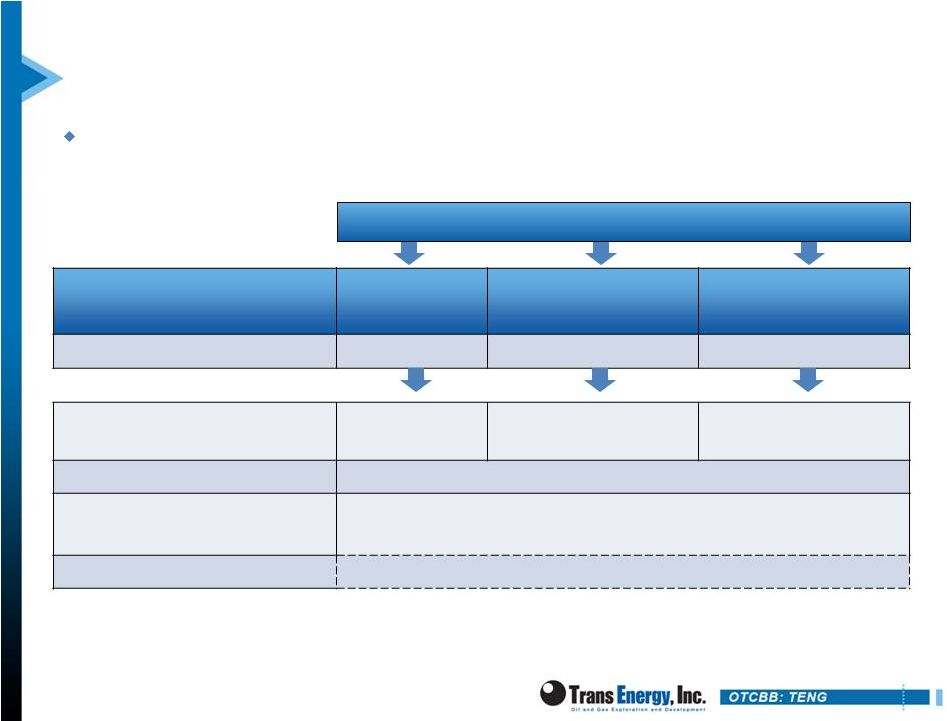
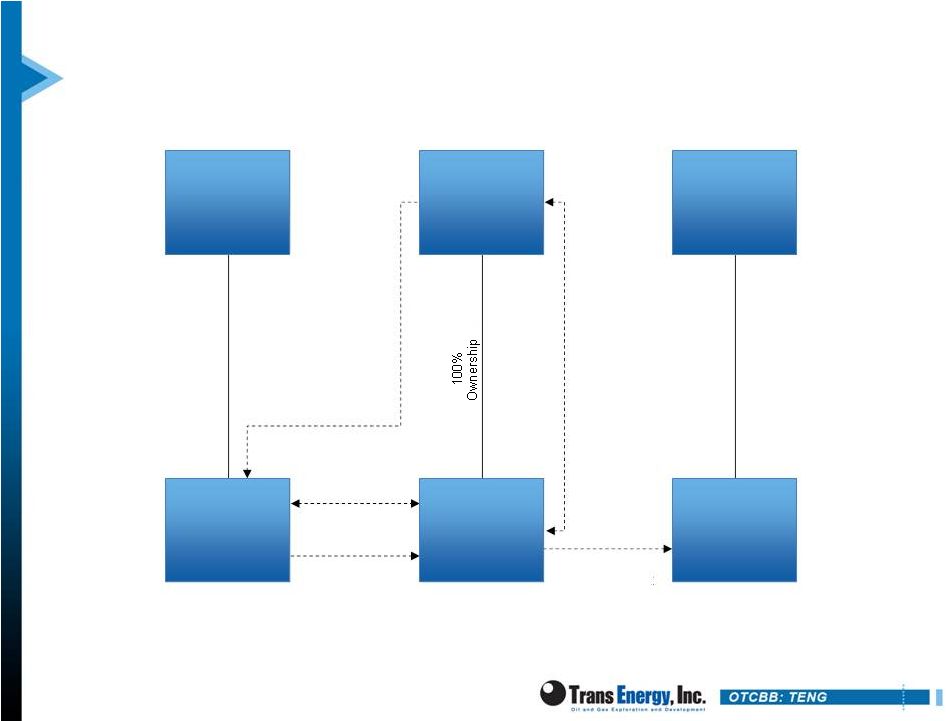
 Overview of Recent Corporate Reorganization
The new credit facility involves a reorganization of the operating
subsidiaries and assets of Trans Energy
Below summarizes the movement of significant assets in the corporate
reorganization:
29
Trans Energy will continue to perform all accounting
and processing of mineral owner royalty payments
for Prima / shallow wells
Notes
Trans Energy, Inc. and Subsidiaries
21,739 net Marcellus acres
112 active shallow wells
Interest in 14 Marcellus wells
Office equipment and Corporate Functions
Trans Energy, Inc. and Wholly Owned Subsidiaries:
Office equipment and Corporate Functions
Wells
112 active shallow wells
Acreage rights to drill shallow (not leases)
25,683 net acres
American Shale Development, Inc. (“ASD”):
Acreage Leases (All zones below the top of the
Rhinestreet Formation)
22,900 net acres
Interest in 14 producing Marcellus wells
Before Reorganization
After Reorganization |
 Marcellus BTU Content By County
Marshall, Wetzel, and Tyler counties have high BTU content with significant
liquids potential
Marion County is dry gas
30
Well
Well Type
BTU/SCF (Dry)
BTU/SCF (Saturated)
Marshall County
Lucey #2H
Horizontal
1,228
1,208
Lucey #1H
Horizontal
1,246
1,225
Keaton #1H
Horizontal
1,238
1,216
Groves #1H
Horizontal
1,218
1,198
Stout #2H
Horizontal
1,186
1,165
Whipkey #2H
Horizontal
1,219
1,198
Whipkey #1H
Horizontal
1,225
1,204
Goshorn #1H
Horizontal
1,211
1,191
Goshorn #2H
Horizontal
1,204
1,184
Whipkey #3H
Horizontal
1,196
1,176
Wetzel County
Hart #28H
Horizontal
1,197
1,177
Dewhurst #50
Vertical
1,119
1,100
Hart #20
Vertical
1,115
1,072
Dewhurst #73
Vertical
1,090
Marion
County Blackshere #101
Vertical
1,073
1,020
@14.73 (PSIA) |
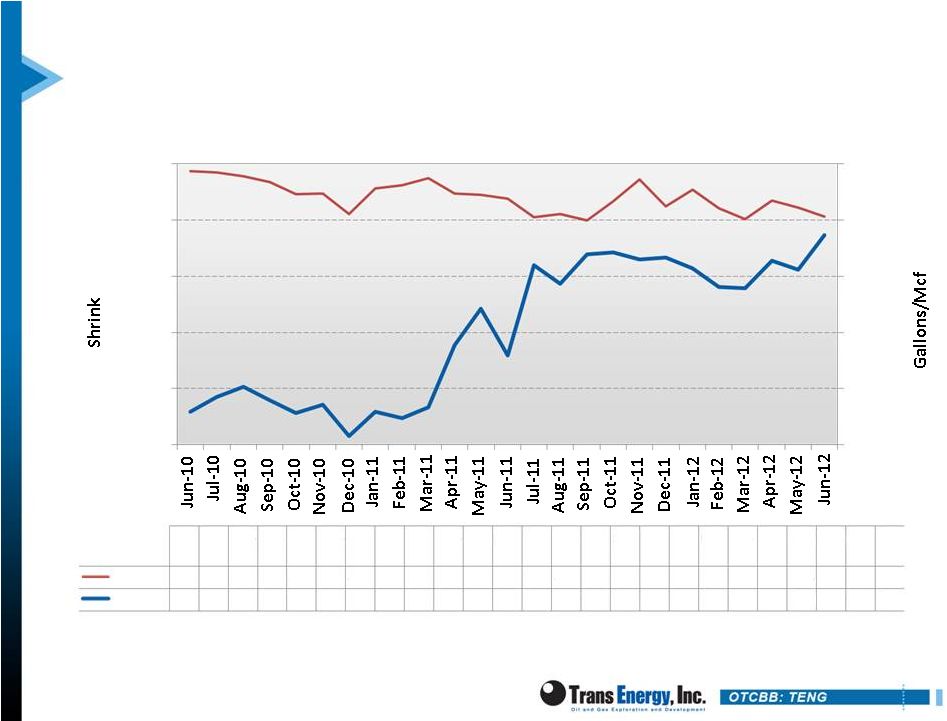 Shrink and Gallons/MCF Correlation
-
0.50
1.00
1.50
2.00
2.50
0%
20%
40%
60%
80%
100%
Jun
-
10
10
Aug-
10
Sep-
10
Oct-
10
Nov-
10
Dec-
10
Jan-
11
Feb-
11
Mar-
11
Apr-
11
May
-
11
Jun-
11
Jul-
11
Aug
-
11
Sep-
11
Oct-
11
Nov-
11
Dec-
11
Jan-
12
Feb-
12
Mar-
12
Apr-
12
May-
12
Jun-
12
Shrink
97%
97%
96%
94%
89%
89%
82%
91%
92%
95%
89%
89%
88%
81%
82%
80%
87%
94%
85%
91%
84%
80%
87%
84%
81%
GAL/MCF
0.2
0.4
0.5
0.4
0.2
0.3
0.0
0.3
0.2
0.3
0.8
1.2
0.8
1.6
1.4
1.7
1.7
1.6
1.6
1.5
1.4
1.3
1.6
1.5
1.8
Jul- |
 Overview of ASD Entity
32
(1) Upon execution of its warrants, Lender will own 19.5% of ASD
3.
AJDA
4.
JOA
5.
Contract
Operator
Agreement
7.
Overhead
Support
1.
Credit
Agreement
2.
Warrant
(1)
American Shale
Development,
Inc. (ASD)
Republic Energy
Operating, LLC
(REO)
Lender
Subsidiary
Trans Energy, Inc.
(OTCBB: TENG)
Lender
Parent
Republic Energy
Ventures, LLC
6.
Administrative
Services |
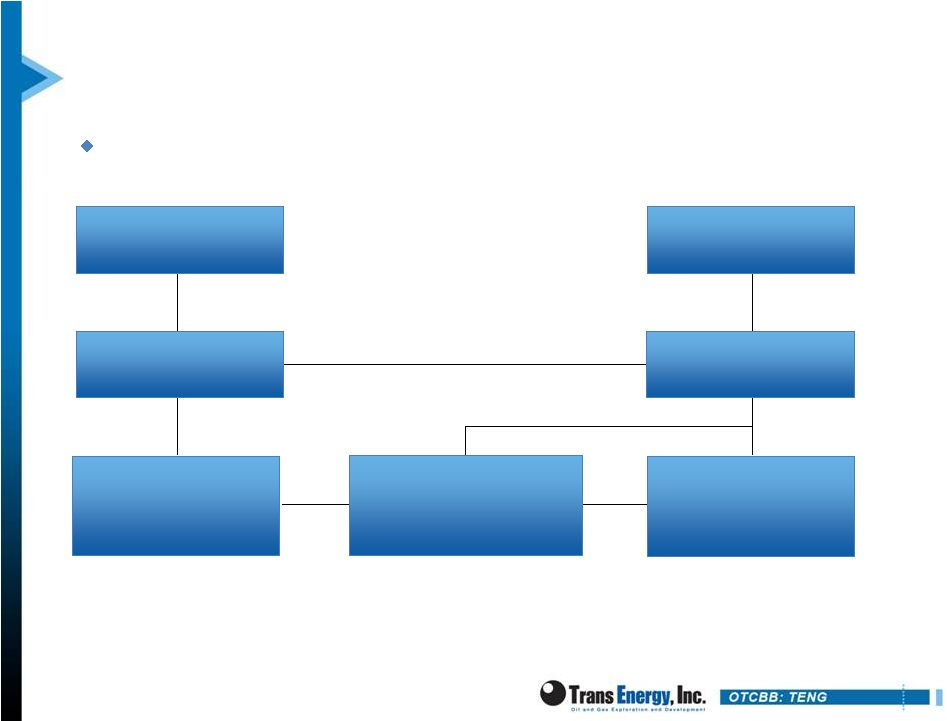 AJDA Summary
Trans Energy entered into an AJDA with Republic Energy during 2007 to
develop its Marcellus acreage
33
36-50%
(3)
Contract Operator to REO
50-64%
100%
(1)
Technical Expertise & Admin
Services
Public & Management
Shareholders
Trans Energy, Inc.
American Shale Development
Utica (~26,000 net acres)
Marcellus
&
Other
Upper
Devonian
(2)
(4,897 acres not in AJDA)
AJDA Marcellus & Other Upper
Devonian Assets
43,342 Gross Acres in AMI
4 Vertical Marcellus Wells
10 Hz Marcellus Wells
4 Hz Marcellus Wells (awaiting completion)
Republic Energy Ventures &
Affiliates
Republic Energy Operating
Republic Management & Energy
Trust Partners
(1)
Reflects Trans Energy’s ownership of American Shale Development (“ASD”) prior
to potential dilution that could occur upon the exercise of the lenders’ option for 19.5% of the stock of
ASD.
(2)
Includes acreage in Doddridge County that is outside of the AMI, plus approximately 4,500
acres in Wetzel County for which Republic has an option to obtain a 50% WI.
(3)
Reflects Trans Energy’s ownership of all assets within the AJDA, except for four
horizontal Marcellus wellbores in which Trans Energy owns 5% WI prior to payout, and 10% WI after payout,
per the terms of a farm out agreement with an unaffiliated third party. Trans Energy owns
between a 36% WI and a 50% WI in AJDA gross acres.
Shallow Conventional Acreage Rights |