Attached files
| file | filename |
|---|---|
| EX-99.2 - EXHIBIT 99.2 - ARC Group Worldwide, Inc. | v324528_ex99-2.htm |
| EX-99.1 - EXHIBIT 99.1 - ARC Group Worldwide, Inc. | v324528_ex99-1.htm |
UNITED STATES
SECURITIES AND EXCHANGE COMMISSION
Washington, D.C. 20549
FORM 8-K/A
Amendment No. 1
CURRENT REPORT
PURSUANT TO SECTION 13 OR 15(d) OF THE
SECURITIES EXCHANGE ACT OF 1934
Date of Report (Date of earliest event reported): August 8, 2012
ARC Group Worldwide, Inc.
(Exact Name of Registrant as Specified in its Charter)
Utah
(State or other jurisdiction of incorporation)
| 000-18122 | 87-0454148 | |
| (Commission File Number) | (IRS Employer Identification No.) | |
| 810 Flightline Blvd. | ||
| Deland, FL | 32724 | |
| (Address of Principal Executive Offices) | (Zip Code) |
Registrant’s telephone number, including area code: 386-736-4890
Former Name or Former Address, if Changed Since Last Report:
7040 County Road 20 Longmont, Colorado 80504
Check the appropriate box below if the Form 8-K filing is intended to simultaneously satisfy the filing obligation of the registrant under any of the following provisions:
¨ Written communications pursuant to Rule 425 under the Securities Act (17 CFR 230.425)
¨ Soliciting material pursuant to Rule 14a-12 under the Exchange Act (17 CFR 240.14a-12)
¨ Pre-commencement communications pursuant to Rule 14d-2(b) under the Exchange Act (17 CFR 240.14d-2(b))
¨ Pre-commencement communications pursuant to Rule 13e-4(c) under the Exchange Act (17 CFR 0240.13e-4(c))
EXPLANATORY NOTE
As previously disclosed in its Current Report on Form 8-K filed on August 8, 2012 (the "Prior 8-K") with the Securities and Exchange Commission (the "SEC"), on August 8, 2012, ARC Group Worldwide, Inc. (referred to herein as the "Company" or "ARC") completed the acquisition of Quadrant Metals Technology, LLC ("QMT") and Advanced Forming Technology, Inc. ("AFT"). The QMT acquisition is being accounted for as a reverse acquisition whereby QMT is deemed to be the accounting acquirer in the acquisition. This Form 8-K/A amends the Prior 8-K for the purpose of furnishing certain historical financial statements and pro forma financials giving effect to the acquisitions.
Audited combined financial statements of AFT as of April 1, 2012 and April 3, 2011 and for the years ended April 1, 2012 and April 3, 2011 were previously reported in the Company’s Definitive Proxy Statement, which was filed with the SEC on July 16, 2012. The audited annual combined financial statements of Advanced Forming Technology are not included here but are incorporated herein by reference to the Company’s Definitive Proxy Statement.
Item 1.01 and Item 3.02 of the Prior 8-K are incorporated herein by reference thereto. Item 2.01 of the Prior 8-K is amended and restated as set forth herein, and Item 9.01 of this Form 8-K is set forth herein.
QMT AND AFT OVERVIEW
QMT was formed in April 2011, to function as a holding company for a group of diversified manufacturing and distribution companies. Upon formation, QMT acquired controlling interests in TeknaSeal LLC ("TeknaSeal") as of May 1, 2011 and in FloMet LLC ("Flomet") as of June 30, 2011. In addition, QMT acquired General Flange & Forge ("GF&F") as of April 14, 2011 and has held controlling interests in GF&F since that date. Furthermore, TubeFit LLC ("TubeFit") was formed on November 1, 2011 and QMT has held controlling interests in TubeFit since that date. While QMT was formed in 2011 as a holding company, affiliated companies have held controlling interests in FloMet and TeknaSeal for over 10 years.
AFT is comprised of two operating units, AFT-US and AFT Hungary. AFT-US was founded in 1987. From 1991 until its acquisition by ARC, AFT was operated as a division of Precision Castparts Corporation, a publicly traded company. In 1998, AFT-US moved its operations to a 113 acre campus in Longmont, Colorado with a 105,000 square foot facility. During 2001, AFT-Hungary was established on 10 acres in Rétság, Hungary as a supplier of MIM products to the European automotive industry. Following AFT’s successful U.S. model, a new state of the art facility was designed and built. The facility has since been expanded and upgraded.
| 2 |
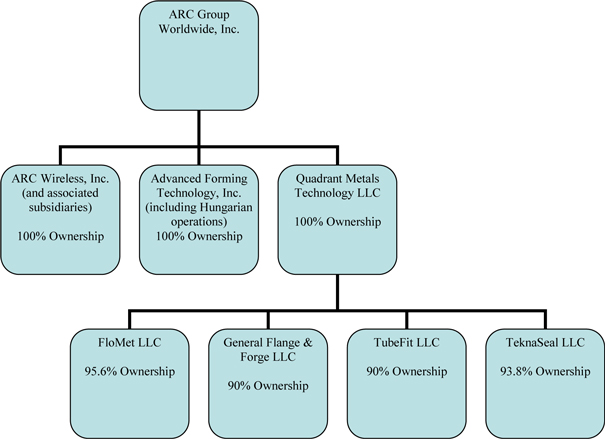
The following chart sets forth the entities comprising ARC Group Worldwide, Inc. and its ownership interests.
| 3 |
Item 2.01. Completion of Acquisition or Disposition of Assets
QMT Acquisition
Effective August 8, 2012, the Company acquired all of the shares of QMT pursuant to a Membership Interest Purchase Agreement, dated as of April 6, 2012 with Quadrant Management, Inc. (“QMI”), QMT, QMP Holding Corp., QTS Holding Corporation, John Schoemer, Arlan Clayton, Robert Marten, QMT and Carret P.T., LP (the “QMT Acquisition Agreement”). The QMT Acquisition Agreement is described in further detail in Item 1.01 of the Prior 8-K and in the Company’s Definitive Proxy Statement, as filed with the U.S. Securities & Exchange Commission on July 16, 2012, each of which is incorporated herein by reference thereto (such acquisition is referred to herein as the “QMT Acquisition”). QMT’s subsidiaries include FloMet LLC, TeknaSeal LLC, General Flange & Forge LLC and TubeFit LLC (the “QMT Group”).
The QMT Acquisition is accounted for as a "reverse acquisition" and QMT is deemed to be the accounting acquirer in the acquisition. The financial statements of QMT included in this document are presented as the continuing accounting entity.
AFT Acquisition
Effective August 8, 2012, the Company has acquired all of the shares of AFT pursuant to a Purchase Agreement dated as of April 6, 2012 (the “AFT Acquisition Agreement”) with Precision Castparts Corp. (“PCC”) and AFT Europa KFT (“AFTE”). The AFT Acquisition Agreement provided for the acquisition of AFT and special purpose acquisition company (the “AFTE SPV”) holding certain Hungarian assets associated with AFT. Pursuant to the terms of the AFT Acquisition Agreement, the Company received 100% of AFT and AFTE SPV, in exchange for the transfer of an aggregate of $43 million to PCC, of which $25,400,000 has been paid in cash and $17,600,000 has been paid in the form of a convertible note (the “AFT Convertible Note”) maturing in five years from the acquisition closing date (the “AFT Acquisition”). The AFT Acquisition is described in further detail in Item 1.01 of the Prior 8-K and in the Company’s Definitive Proxy Statement, as filed with the U.S. Securities & Exchange Commission on July 16, 2012, each of which is incorporated herein by reference thereto.
Corporate Information
ARC was organized under the laws of the State of Utah on September 30, 1987. The Company is and expects to remain a “reporting company”, and will therefore be required to continue to file annual, quarterly and other filings with the U.S. Securities and Exchange Commission (the "SEC"). Members of the public may read and copy any materials which we file with the SEC at the SEC’s Public Reference Room at 100 F Street, N.E., Room 1580, Washington, D.C. 20549. Members of the public may obtain additional information on the operation of the Public Reference Room by calling the SEC at 1-800-SEC-0330. The SEC also maintains an internet site that contains reports, proxy and information statements, as well as other information regarding issuers that file electronically with the SEC. This site is located at http://www.sec.gov.
We make our Annual Report on Form 10-K, Quarterly Reports on Form 10-Q, Current Reports on Form 8-K (including exhibits and supplementary schedules) and amendments to those reports, filed or furnished under Section 13(a) or 15(d) of the Securities Exchange Act of 1934, available free of charge on our website at www.arcgroupworldwide.net, as soon as reasonably practicable after these reports are electronically filed with, or furnished to, the SEC. You may also request a copy of our SEC filings at no cost, by writing or telephoning us at: ARC Group Worldwide, Inc. 810 Flightline Blvd., Deland FL, 32724, phone: 386-736-4890.
| 4 |
Our principal offices were located at 6330 North Washington Street, Suite 13, Denver, Colorado 80216-1146 until the expiration of our lease on July 31, 2012. Our principal offices are now located at the QMT facility at 810 Flightline Blvd. Deland, FL 32724 as described more fully below.
Forward-Looking Statements.
This Report includes "forward-looking statements" within the meaning of Section 27A of the Securities Act of 1933, as amended, and Section 21E of the Securities Exchange Act of 1934, as amended. All statements other than statements of historical fact included in this Report regarding our financial position, business strategy, plans and objectives of our management for future operations and capital expenditures, and other matters, other than historical facts, are forward-looking statements. Although we believe that the expectations reflected in such forward-looking statements and the assumptions upon which the forward-looking statements are based are reasonable, we can give no assurance that such expectations will prove to have been correct.
Additional statements concerning important factors that could cause actual results to differ materially from our expectations are disclosed in this Report. In addition, the words “believe”, “may”, “will”, “when”, “estimate”, “continue”, “anticipate”, “intend”, “expect” and similar expressions, as they relate to us, our business or our management, are intended to identify forward-looking statements. All written and oral forward-looking statements attributable to us or persons acting on our behalf subsequent to the date of this Report are expressly qualified in their entirety by the Risk Factors regarding QMT set forth in the Company’s Definitive Proxy Statement, as filed with the U.S. Securities and Exchange Commission on July 16, 2012, which is incorporated herein by reference thereto.
ARC BUSINESS OVERVIEW
After completion of the mergers mentioned above, ARC operates three groups of companies: the Precision Components Group, consisting of FloMet, AFT-US, AFT-Hungary, and TeknaSeal LLC; the Flanges and Fittings Group, consisting of General Flange & Forge LLC and TubeFit LLC; and the Wireless Group, consisting of ARC Wireless LLC and ARC Wireless Ltd.
PRECISION COMPONENTS GROUP
The precision component industry is comprised of a number of significant industries commonly defined by the process and/or type of metal utilized to manufacture the component. Common processes include casting, forging, machining, stamping, powder metallurgy (conventional P/M metal injection molding ("MIM"), and powder forging) and extrusion. Materials range from basic iron and steel to aluminum, magnesium, zinc, precious metals, copper and brass, tin, tungsten, titanium and others. While there are no compiled figures for the total of these markets, it is believed to be in total of hundreds of billions of dollars annually.
The Precision Components Group companies participate in several significant metal component fabrication market segments providing high quality fabricated metal components and the hermetic sealing of those components to some of the fastest growing industries, among them medical devices, firearms and electronic devices.
| 5 |
FloMet
FloMet is a custom manufacturer of small precision metal components – a market estimated to be in excess of $100B annually. FloMet is recognized as a world-wide leader in the use of metal injection molding technology to manufacture precision miniature components utilizing its proprietary MIM process. FloMet is acknowledged as one of the pioneers and leading innovators in MIM and customized materials technology, backed by more than 25 years of experience in making high precision small metal components. FloMet’s ability to custom blend feedstocks allows it to manufacture components to either industry standards or customized metal alloy formulations. FloMet specializes in highly corrosion resistant stainless steels, but also manufactures components in carbon and alloy steels, nickel, cobalt-chrome, copper, bronze, and other alloys. Part sizes range from less than a gram to approximately one pound.
MIM technology is increasingly used to manufacture high volume miniature metal components that require specialized material properties or complex design. The worldwide MIM market is estimated to be in excess of $1.0B annually with recent annual growth rates of over 20% compounded as the technology receives increasing acceptance as a cost-effective and reliable solution to the challenges of high volume manufacture of tightly-toleranced small metal components. As one of the early movers in MIM technology, FloMet has extensive experience developing diverse customer applications, providing the company with a considerable competitive advantage in miniature component manufacturing. FloMet primarily serves the medical devices / surgical instruments, orthopedics, health / hearing, dental, industrial and firearms markets.
Customers
FloMet’s major market is medical devices, accounting for approximately 60% of total revenues. Orthodontics and Dental Equipment components represent approximately 20% of revenues. A relatively new and growing market for FloMet is the Health and Hearing market, representing approximately 10% of FloMet’s sales. FloMet developed a proprietary RF shielding alloy and thin-wall manufacturing process for this market. FloMet estimates that this business will double in the next few years as new applications are developed utilizing its proprietary capabilities by major hearing aid manufacturers. The remaining 10% of sales are to a variety of customers in Orthopedic, Firearms, Defense, and Industrial market segments.
FloMet is a custom manufacturer of customer-designed components. FloMet assists the customer with design recommendations to improve manufacturability and reduce costs but does not accept product design responsibility. FloMet’s manufacturing processes are carefully controlled utilizing a variety of sophisticated process controls and quality checks to ensure that each part shipped meets exacting customer specifications and quality requirements. Most of FloMet’s business relationships are longstanding, and include the sale of components that FloMet has produced for over 10 years. This is primarily a reflection of FloMet’s performance on an ongoing basis in meeting and exceeding customer expectations in quality, delivery, and total cost.
Growth Strategy
FloMet’s growth strategy is to deepen relationships with its existing customer base, and expand its offerings to new customers and new applications by continuing to provide superior value and position the company as their primary development source for new MIM applications.
| 6 |
Operations and Employees
FloMet is headquartered in DeLand, Florida with a 40,000 square foot facility housing its offices as well as engineering, tooling, mixing, molding, debinding, sintering, secondary operations and quality assurance all under one roof, offering a fully-integrated solution for complex small metal component needs. By controlling each step of the process, from the blending of powder to verifying statistical control of the finished parts, FloMet can assure that complex customer requirements are met for all parts. FloMet is ISO-9001:2000 certified. The ISO 9000 standards relate to quality management systems and are designed to assist organizations ensure they meet the needs of customers and other stakeholders. The standards are published by the International Organization for Standardization (ISO).
As of August 31, 2012, FloMet employed approximately 150 employees and contract workers in DeLand, FL. FloMet requires no special environmental permitting for its manufacturing processes. FloMet has an extremely low voluntary employee turnover rate due to the attractive package of benefits, training opportunities for advancement, excellent working conditions, and very competitive compensation levels.
Competition
FloMet’s competition includes both other MIM manufacturers and competing technologies such as precision machining and investment casting for certain applications. The domestic MIM industry is projected to be approximately $250M in size. There are about 40 identified MIM manufacturers involved in contract manufacturing and perhaps a dozen or so captive operations. The European market is projected to be approximately $350M in size and the Asian market is approximately $550M – primarily in China.
AFT
AFT is a leading provider of small precision metal components to a wide variety of industries. AFT specializes in using the MIM technology to produce complex miniature parts.
The business provides custom material solutions and has the capabilities to develop and test new materials based upon customer requirements. AFT’s current material capabilities include stainless steels, low alloys steels, alloy steels, soft magnetic materials, implant grade materials, high temperature alloys and titanium alloys. AFT has invested in the latest technology to provide cost-effective, efficient, and customized solutions to tooling and quality metal injection component manufacturing needs of clients in the automotive, medical, aerospace, firearms, electronics and consumer industries.
Operations and Employees
AFT’s US-MIM Division has approximately 176 employees and contract workers. The facility comprises a total of 105,000 square feet under roof and is equipped with state of the art machinery for the manufacture of MIM components. Highly sophisticated automation and controls are utilized, enabling high volume product flow with minimal interruption.
AFT-Hungary has approximately 184 employees and contract workers. The facility comprises a total of 70,000 square feet under roof and is similarly equipped to the US-MIM Division.
| 7 |
Competitors
AFT’s competition includes both other MIM manufacturers and competing technologies such as precision machining and investment casting for certain applications. There are about 40 identified MIM manufacturers involved in contract manufacturing and perhaps a dozen or so captive operations. While a lack of public information makes it difficult to provide a specific ranking of competitors, AFT is commonly recognized among the top three MIM competitors in North America and among the top four MIM competitors in Europe. AFT’s and FloMet’s main competitors include Indo-MIM, Parmatech, Kinetics, GKN, Schunk and Parmaco.
Customers
AFT sells to companies in the automotive, firearms, medical, aerospace, electronics and consumer industries.
TeknaSeal
TeknaSeal is a manufacturer of custom designed hermetic assemblies made using either a proprietary glass-to-metal sealing technology or an advanced ceramic-to-metal brazing technology, as appropriate to the customers’ requirements. Hermetic seal assemblies are used in customers’ devices to protect sensitive electronic components from the real world environment, or to protect the environment from the dangerous media in the customers’ devices, or both. Because the need for a hermetically sealed housing is so intertwined with the customers’ designs and production processes, many of the large manufacturers requiring hermetic seals have purchased or developed their own glass sealing operations. At the same time, many of the manufacturers of proprietary and/or generic hermetic housings and connectors have moved production off-shore to low cost countries. This means that high volume consumers of glass seals such as major manufacturers of industrial pressure sensors, automotive airbag initiators, and hermetic packages for discrete electronic components (transistors, crystal oscillators, etc.) are not an available market for TeknaSeal’s capabilities. For these reasons, TeknaSeal’s business plan is to concentrate on the higher technology, higher margin housings for aircraft and military sensors and the hermetic seals required for implantable medical devices.
TeknaSeal’s high technology target markets require the highest levels of performance and reliability that are provided by the company’s proprietary glass and ceramic seal technology, and the complexities of these customers’ designs make the responsive and deep engineering support provided by the TeknaSeal team mandatory.
It is estimated that the size of the market for independent glass seal manufacturers is between $250M and $500M annually. The major areas of growth in this market are in the industrial sensor segment and in the seals required for implantable medical devices and the batteries that power these devices. TeknaSeal anticipates that its growth in revenues for the near future will be driven by sales of seals for newly designed implantable medical devices. In the next two years the growth will come from implantable battery projects already in the development and approval stages, while growth for the out years will also include brazed ceramic feed-thru’s for implantable devices designed to provide new therapies to patients. In particular, the company feels there is an opportunity in manufacturing the high pin count feed-thrus that will be required for neuro-stimulators and has begun developing a novel method to economically manufacture these feed-thrus.
| 8 |
TeknaSeal’s position and experience at the highest performance end of the hermetic seal industry puts it in a good position to capture an increasing share of a potentially flattening market. In particular, the implantable medical device industry is developing ever smaller but more complicated devices that will require advanced seal and materials technology that TeknaSeal will endeavor to develop. TeknaSeal is active in and has deep experience in a wide variety of industries and uses the same personnel and equipment to serve the needs of these industries; this allows the company to be very quick to adapt to rapid changes in the market place and maintain profitability in uncertain times.
Customers
TeknaSeal makes certain components for air data (airspeed and altitude) instruments; virtually every commercial jet aircraft of any size contains components manufactured by TeknaSeal. In the last three years, this business has been growing at rate of about 30% per year as the airlines replace their fleets with more fuel efficient aircraft and put more miles on their existing aircraft. This higher level of production is expected to last for at least five more years and then begin to level off to a good sustained rate driven by the required maintenance schedule of this new fleet of aircraft. These components constitute approximately 40% of TeknaSeal’s revenues.
TeknaSeal is the sole-source provider of certain parts to a manufacturer of components for high technology medical devices. This business is high margin and has been growing nicely since FDA approval of the medical device was achieved in 2009, but there is a natural upper limit on this particular market. This currently makes up about 10% of TeknaSeal’s total annual revenue.
The balance of TeknaSeal’s revenue is made up of at least 25 more companies, none of whom make up more that 5% of the total annual revenues.
Competitors
TeknaSeal has a large number of competitors, most of which are considerably larger and/or are a part of a large diversified manufacturing company.
There are many other suppliers of glass-to-metal and ceramic-to-metal hermetic assemblies, but most of them seem to specialize in a rather narrow market niche and so do not usually directly compete with TeknaSeal.
Workforce and Production Equipment
TeknaSeal has 15 employees, working with three glass sealing furnaces and one vacuum brazing furnace in 8,000 square feet of space and is negotiating a lease for an additional 4,000 square feet to space to house production and offices.
FLANGE AND FITTINGS GROUP
General Flange & Forge
GF&F is one of approximately 10 domestic flange manufacturers in the United States, and the only one on the East Coast. GF&F has been in business since 1972. The majority of flange manufacturers are in the South West. GF&F is a very customer-driven and service-oriented company. GF&F estimates that the domestic market, combining carbon, stainless and alloy flanges, is more than a billion dollars.
| 9 |
GF&F’s business model is focused on converting foreign-purchased alloy steel and stainless steel forgings into domestic flanges via value-added processing to provide a finished component with sufficient domestic content to qualify as domestically produced. The company also sells foreign produced finished flanges for certain applications. Additionally, the company will purchase forgings produced in the US and Europe and machine them into finished flanges for high-integrity applications requiring.
Customers
GF&F’s customer base is diversified, serving the petroleum industry, instrumentation companies, valve manufacturers, fabricators, vessel and heat exchanger manufacturers, pump and compressor manufacturers and the domestic flange distributors. The company sells to US distributors in certain geographic regions and also acts as a distributor in the Northeast US market. Additionally, the company sells directly to customers in several fluid-handling market segments, including the highly demanding instrumentation segment where demanding quality requirements provide the opportunity for GF&F to achieve higher margins.
GF&F’s ability to provide both custom-machined flanges as well as standard (or commodity) flanges has positioned the company as a market leader in the Northeast United States in this Instrumentation market segment. These companies also require flanges machined to metric standards for their markets in Europe and Asia – a competitive advantage for GF&F because of its in-house machining capabilities. GF&F stocks a full range of most commonly purchased flange sizes up to 48” in diameter allowing it to capitalize on short lead-time situations which often provide significantly higher margin opportunities.
GF&F’s largest customer makes up 13% of its total sales for the year and the 5 largest customers total 41% of total sales.
Employees
GF&F has approximately 25 employees, many with significant tenure with the company. GF&F intends to pursue ISO 9000 registration in the next year.
TubeFit
TubeFit is a master distributor of import fittings and both import and domestic flanges. TubeFit estimates the overall PVF (Pipe Valve and Fitting) market domestically to be well over a billion dollars annually. The segment TubeFit serves is a segment of this market called the General Commodity Welds Fitting and Flange market – estimated to be over $400M annually.
Customers
TubeFit’s customers are primarily wholesalers who sell to contractors and end users and occasionally other distributors. More specifically, TubeFit targets the segment of the market that uses ½” through 24” weld fittings and flanges and requires immediate availability. TubeFit focuses on maintaining inventory of the more commonly used configurations of these fittings and flanges.
| 10 |
Employees
At the present time, TubeFit has only three employees, its President and two employees who are currently handling all company functions.
Growth Strategy
The business plan for growth is to focus on current wholesalers in the Southwest US – primarily Houston, TX and surrounding states.
Competitors
TubeFit has many larger competitors in the geographic area. Much of the selling is relationship-based, given the commodity nature of the product.
TubeFit’s suppliers are primarily well-established foreign manufacturers of these components that may also sell to competitors of TubeFit.
WIRELESS GROUP
The Wireless Group focuses on wireless broadband technology related to propagation and optimization. It designs and develops hardware, including antennas, radios, and related accessories, used in broadband and other wireless networks. Products are sold to public and private carriers, wireless infrastructure providers, wireless equipment distributors, value added resellers and other original equipment manufacturers.
Growth in product revenue is dependent on market acceptance of the new ARCFlexTM family of full solution radio products, on gaining further traction with current and new customers for the existing product portfolio, as well on developing new products to support our wireless initiatives. Revenue growth for the products is correlated to the overall global wireless market and to the ability to take market share from our competitors. The Group focuses on keeping our operational and general costs low in order to improve margins.
Specific growth areas are last mile wireless broadband Internet delivered over standards-based solutions such as Worldwide Interoperability for Microwave Access ("WiMAX"), WiFi or vendor specific proprietary solutions; GPS and Mobile SATCOM solutions for network timing, fleet and asset tracking and monitoring; Machine to machine ("M2M") communications for controlling or monitoring data from devices; and base stations to build out or optimize carrier networks.
The Wireless Group employs six people.
Risk Factors
In addition to the other information contained in this Report, those Risk Factors regarding QMT set forth in the Company’s Definitive Proxy Statement, as filed with the U.S. Securities and Exchange Commission on July 16, 2012, which is incorporated herein by reference thereto, should be considered when evaluating the forward-looking statements contained in this Report.
| 11 |
Unresolved Staff Comments
None
Properties
Our principal offices were located at 6330 North Washington Street, Suite 13, Denver, Colorado 80216-1146 until the expiration of our lease on July 31, 2012. Our principal offices are now located at the QMT facility at 810 Flightline Blvd. Deland, FL 32724, where we lease approximately 105,000 square feet under roof and is equipped with state of the art machinery for the manufacture of MIM components.
MANAGEMENT’S DISCUSSION AND ANALYSIS OF FINANCIAL CONDITION AND RESULTS OF OPERATIONS OF QMT
The following discussion is intended to assist in understanding QMT’s business and the results of its operations. It should be read in conjunction with the Consolidated Financial Statements and the related notes that are incorporated by reference in this Report on Form 8-K/A (See Item 9.01). Certain statements made in this discussion may be forward looking. Forward-looking statements involve risks and uncertainties and a number of factors could cause actual results or outcomes to differ materially from QMT’s expectations.
The QMT Acquisition is being accounted for as a “reverse acquisition,” and QMT is deemed to be the accounting acquirer in the acquisition. The financial statements of QMT are presented as the continuing accounting entity.
Fiscal Year-End
The QMT Group companies’ fiscal year end is June 30th.
Business Overview
The worldwide metals component industry is comprised of a number of significant industries commonly defined by the process and/or type of metal utilized to manufacture the component. Common processes include casting, forging, machining, stamping, powder metallurgy (conventional P/M, metal injection molding (“MIM”), and powder forging) and extrusion. Materials range from basic iron and steel to aluminum, magnesium, zinc, precious metals, copper and brass, tin, tungsten, titanium and others. While there are no compiled figures for the total of these markets, it is believed to be in total of hundreds of billions of dollars annually.
The QMT companies participate in several significant metal component fabrication market segments providing high quality fabricated metal components to some of the fastest growing industries, among them medical devices, firearms, electronic devices, and the fluid handling industries – including energy (oil, gas, power plants, etc.).
QMT owns a majority interest in four companies: FloMet LLC, TeknaSeal LLC, General Flange & Forge LLC and TubeFit LLC (collectively referred to as the “QMT Group”), as described in further detail below. The QMT Group’s consolidated financial information is disclosed below, as well as the information for QMT itself.
| 12 |
QMT was formed in April 2011, to function as a holding company for a group of diversified manufacturing and distribution companies. Upon formation, QMT acquired controlling interests in TeknaSeal as of May 1, 2011 and in FloMet as of June 30, 2011. In addition, QMT acquired GF&F as of April 14, 2011 and has held controlling interests in GF&F since that date. Furthermore, TubeFit was formed on November 1, 2011 and QMT has held controlling interests in TubeFit since that date. While QMT was formed in 2011 as a holding company, Quadrant has held controlling interests in FloMet and TeknaSeal for over 20 years.
GF&F has been in business since 1972. GF&F is a domestic manufacturer of flanges in carbon steel, stainless steel and the alloys. GF&F also manufactures metric flanges, orifice unions, galvanized flanges, long weld necks, pad flanges/studding outlets, special facings and custom flanges. Since 1972, GF&F has been manufacturing domestic flanges in carbon steel, stainless steel and alloys. GF&F also maintains a large inventory of galvanized flanges and orifice unions. QMT believes that GF&F can handle any substantially custom machining requirements and special flange facings.
Consolidated Financial Condition of the QMT Group as of June 30, 2012 and 2011
As of June 30, 2012 the QMT Group had total assets of $21.3 million, consisting of total current assets of $9.7 million, plant and equipment, net of accumulated depreciation of $4.5 million, and total long-term assets of $7.1 million. In comparison, as of June 30, 2011 the QMT Group had total assets of $22.1 million, consisting of total current assets of $10.4 million, plant and equipment, net of accumulated depreciation of $4.6 million, and total long-term assets of $7.2 million. The decrease in total assets is mainly attributed to decreases in cash, inventory prepaid expenses and other long term assets, offset by an increase accounts receivable, goodwill and receivables from members and related parties.
At June 30, 2012 and 2011 QMT Group had working capital of $6 million and $6.1 million, respectively. QMT Group’s total current assets of $9.7 million as of June 30, 2012, current assets consisted of cash and cash equivalents of $1.4 million, accounts receivable, net of $3.7 million, a related party receivable of $0.2 million, inventory of $3.9 million and prepaid expenses and other assets of $0.4 million. Current liabilities consisted of current portion of long-term debt in the amount of $1.5 million, accounts payable and accrued expenses of $1.7 million, unearned mold income of $0.1 million and a related party payable of $0.4 million.
At June 30, 2011, QMT Group’s total current assets of $10.4 million consisted of cash and cash equivalents of $1.7 million, accounts receivable, net of allowance for doubtful accounts of $3.5 million, inventory of $4.4 million and prepaid expenses and other assets of $0.7 million. Current liabilities consisted of current portion of long-term debt in the amount of $1.5 million, line of credit of $0.7 million, accounts payable and accrued liabilities $1.7 million, a related party payable of $0.1 million and unearned mold income of $0.2 million.
During the year, the QMT Group companies’ made concerted efforts to better manage and rationalize inventory levels in order to free up cash from working capital. Such lean initiatives helped generate cash and reduced the consolidated inventory balances by $0.5 million from fiscal year 2011 to 2012. In addition, FloMet’s amortization of certain prepaids was accelerated due to an orthodontic component replacement resulting in a decrease in prepaid expenses of $0.3 million.
| 13 |
As of June 30, 2012 QMT Group’s long-term assets consisted of goodwill in the amount of $7.0 million, increased by $0.2 million over $6.8 million at June 30, 2011 attributable to the acquisition of TubeFit in November 2011 and other long term asset of $0.2 million at June 30, 2012. At June 30, 2011 other long terms assets were $0.3 million.
QMT Group’s total liabilities and members’ equity were $9 million and $12.3 million, respectively, as of June 30, 2012. In comparison, as of June 30, 2011 QMT Group’s total liabilities and members’ equity were $10.1 million and $12.0 million, respectively. The decrease in total liabilities is mainly attributed to the debt repayment of $1.2 million during fiscal year 2012. The increase in members’ equity was due to an increase in retained earnings offset by shareholder distributions during the fiscal 2012.
Consolidated Results of Operations for the Year Ended June 30, 2012 compared to June 30, 2011
For the fiscal year ended June 30, 2012, QMT Group’s total revenues were $31.3 million, including sales of $31.1 million, interest income of $0.03 million and other income of $0.16 million. In comparison, QMT Group’s total revenues were $20.4 million for the fiscal year ended June 30, 2011, consisting of sales of $20.4 million, interest income of $0.01 million and other income of $0.01 million.
The increase in sales from $20.4 million in 2011 to $31.1 million in 2012 is mainly attributed to increase in sales at FloMet and GF&F. FloMet witnessed a growth in sales due to an increase in demand from its medical device customers and the successful launch and initial production shipments for several new components. In addition, the QMT Group acquired GF&F in April 2011, which witnessed an increase in sales due to increased demand from its existing customers as well as from securing several new customers during the period. The increase in sales at FloMet and GF&F was partially offset by a slight slowdown in sales at TeknaSeal. This was primarily due to slower demand compared to historical levels from one of its key aircraft sensor housing customers. The leveling off of demand was caused by a small dip in demand for aircrafts combined by an intentional draw down of inventory at the customer.
For the year ended June 30, 2012, QMT Group’s total costs and expenses were $26.5 million, including cost of sales of $19.3 million, selling, general and administrative expenses of $6.6 million, other expense of $ .03 million and interest expense of $0.5 million. For the year ended June 30, 2011, QMT Group’s total costs and expenses were $17.7 million, including cost of sales of $12.8 million, selling, general and administrative expenses of $4.6 million, and interest expense of $0.3 million.
The cost of sales increased over the prior year in line with increase in sales over the same period. In addition, the cost of material of forged flange blanks from suppliers were higher than prior year costs due to more short-lead time or “spot buying” of these forgings at GF&F to respond to the stronger than anticipated demand from customers. The selling, general and administrative expenses increased over prior year due to increase in selling, general and administrative expenses as a result of addition of sales engineers, increase in management incentive pay due to significantly improved financial results in the period, and an increase in expenses associated with our China MIM pilot plant initiative. In addition, the higher selling, general and administrative expenses also included start-up costs associated with setting up new operations at TubeFit, including material costs for new inventory, warehousing costs, and sales & marketing costs for prospective new customers.
| 14 |
QMT Group’s earnings before non-controlling interest for the year ended June 30, 2012 were $4.8 million compared to earnings before non-controlling interest for the year ended June 30, 2011 of $2.7 million. The earnings before non-controlling interest increased significantly over the prior year both due to increase in overall sales as well as productivity improvements. The increase in sales allowed us to leverage the fixed costs structure at the various QMT Group companies. In addition, the companies’ focus on ongoing automation and other continuous improvement activities helped reduce labor costs contributing significantly to improved earnings for the year.
Income allocated to the QMT Group’s non-controlling interest was $0.3 million for the year ended June 30, 2012 compared to $.4 million for the year ended June 30, 2011.
For the year ended June 30, 2012, QMT Group’s net income was $4.5 million compared to $2.3 million in net income for the year ended June 30, 2011. As mentioned above, the significant improvement in net earnings in 2012 over the prior year was due to increased sales volume, continuous productivity improvement initiatives, and acquisition of new subsidiaries.
Results of Operations by Segment: Comparison between Twelve Months Ended June 30, 2012 and 2011
As detailed above, QMT operates as a diversified manufacturing holding company active in metal injection molding, specialty hermetic seals, and flanges & fittings. As of June 30, 2012 the QMT Group operated under two reportable business segments: Precision Components and Flanges & Fittings. The Precision Components segment includes results of its precision miniature components manufacturing subsidiary, FloMet LLC, as well as its hermetic sealing manufacturing subsidiary, TeknaSeal LLC. Whereas, the Flanges & Fittings business segment includes the results of the remaining two subsidiaries specializing in the manufacture and distribution of carbon, stainless and alloy flanges and fittings, namely General Flange & Forge LLC and TubeFit LLC. Subsequent to the acquisition of AFT as of August 8, 2012, the Precision Components segment will include results of AFT going forward.
| 15 |
The following table provides the dollar amount and percentage of net sales and operating profit for each reportable segment for fiscal years ending June 30, 2011 and 2012.
Results of Operations by Segment – Comparison Between Twelve Months Ended June 30, 2012 and 2011 (In Thousands)
| Year over Year Change | ||||||||||||||||||||||||
| 6/30/2012 | % of Sales | 6/30/2011 | % of Sales | $ | % | |||||||||||||||||||
| Net sales: | ||||||||||||||||||||||||
| Precision Components | $ | 22,413 | 72.1 | % | $ | 19,001 | 93.2 | % | 3,412 | 18.0 | % | |||||||||||||
| Flanges and Fittings | 8,682 | 27.9 | % | 1,390 | 6.8 | % | 7,292 | 524.6 | % | |||||||||||||||
| Consolidated net sales | 31,095 | 100 | % | 20,391 | 100 | % | 10,704 | 52.5 | % | |||||||||||||||
| Operating Costs: | ||||||||||||||||||||||||
| Precision Components | 17,453 | 56.1 | % | 16,058 | 78.8 | % | 1,395 | 8.6 | % | |||||||||||||||
| Flanges and Fittings | 7,873 | 25.3 | % | 1,373 | 6.7 | % | 6,500 | 473.4 | % | |||||||||||||||
| Consolidated Operating Costs | 25,326 | 81.4 | % | 17,431 | 85.5 | % | 7,895 | 45.3 | % | |||||||||||||||
| Segment operating income (loss): | ||||||||||||||||||||||||
| Precision Components | 4,960 | 15.9 | % | 2,943 | 14.4 | % | 2,017 | 68.5 | % | |||||||||||||||
| Flanges and Fittings | 809 | 2.6 | % | $ | 17 | 0.1 | % | 792 | 4658.8 | % | ||||||||||||||
| Corporate Expense | (630 | ) | (2.0 | )% | (1 | ) | 0.0 | % | 629 | |||||||||||||||
| Total segment operating income | 5,139 | 16.5 | % | 2,959 | 14.5 | % | 2,180 | 73.6 | % | |||||||||||||||
| Interest expense, net | 453 | 1.4 | % | 261 | 1.3 | % | 192 | 73.6 | % | |||||||||||||||
| Other non-operating(income)expense | (131 | ) | -0.4 | % | (13 | ) | 0.1 | % | (118 | ) | -907.7 | % | ||||||||||||
| Non- Operating Expenses | 322 | 1.0 | % | 248 | 1.3 | % | 74 | 29.8 | % | |||||||||||||||
| Consolidated income before income tax expense and non-controlling interest | $ | 4,817 | 15.5 | % | $ | 2,711 | 13.3 | % | 2,106 | 77.7 | % | |||||||||||||
Precision Components
Precision Components' sales were $22.4 million for the fiscal year ending June 30, 2012, compared to sales of $19.0 million for the fiscal year ending June 30, 2011, an increase of $3.4 million. Operating income was $5.0 million for the fiscal year ending June 30, 2012 compared to $2.9 million for the fiscal year ending June 30, 2011, an increase of $2.0 million. Segment operating income as a percent of segment sales for the fiscal year 2012 increased to 22.1 percent from 15.5 percent of segment sales for the same period last year.
Sales for the segment increased significantly, by $3.4 million or 18.0 percent, over the prior year primarily due to the growth witnessed in the precision components manufacturing business. FloMet’s sales increased due to an increase in demand from our medical device customers and the successful launch and initial production shipments for several new components. The increase in sales at FloMet was partially offset by a slight slowdown in sales at TeknaSeal, the hermetic sealing company. This was primarily due to slower demand compared to historical levels from one of its key aircraft sensor housing customers. The leveling off of demand was caused by a small dip in demand for aircrafts combined by an intentional draw down of inventory at the customer.
| 16 |
The operating costs for the segment increased over prior year due to increase in selling, general and administrative expenses as a result of addition of sales engineers, increase in management incentive pay due to significantly improved financial results in the period, and an increase in expenses associated with our China MIM pilot plant initiative.
Overall, the operating income for the segment increased significantly over the prior year both due to increase in overall sales as well as productivity improvements put in place by management. The segment's operating income as a percent of sales increased 6.7 percentage points over the prior year due to the company’s focus on achieving reductions in its labor costs as a result of ongoing automation and other continuous improvement activities. Such improvement initiatives were significant contributors to the segment’s improved performance in fiscal year 2012.
As we enter fiscal year 2013, the Precision Components segment is experiencing a slight slowdown in demand as is currently reflected in the overall manufacturing statistics for the economy. That said, our customers remain optimistic and we expect sales and operating income to grow during the course of the year. FloMet is off to a good start for the year with several large tooling orders. Furthermore, worldwide demand for commercial aircraft continues to grow and, with our customer dominating the air data market, we expect demand for our sensor housings to resume growing in fiscal year 2013 and beyond.
Flanges & Fittings
The Flanges & Fittings segment is comprised of two QMT subsidiaries, namely GF&F and TubeFit. QMT acquired GF&F as of April 14, 2011 and has held controlling interests in GF&F since that date. TubeFit was formed on November 1, 2011 and QMT has held controlling interests in TubeFit since that date. The financial results for this reporting segment for the fiscal year ending June 30, 2011 represented the period from the date of completion of acquisition of GF&F (i.e. April 14, 2011 through June 30, 2011).
Flanges and Fittings’ sales were $8.7 million for the year ending June 30, 2012, compared to sales of $1.4 million for the year ending June 30, 2011. Segment operating income was $0.81 million for the year ending June 30, 2012, compared to segment operating income of $0.02 million for the prior year. Segment operating income, as a percent of segment sales, for the year ended June 30, 2012 increased to 9.3 percent from 1.2 percent of segment sales for the year ended June 30, 2011.
Sales for the Flanges & Fittings segment increased significantly over the prior year primarily due to increased demand from customers as a result of the overall improvement in general economic conditions and securing several new customers during the period.
Total operating costs, which include cost of material of forged flange blanks from suppliers, were higher than prior year costs due to more short-lead time or “spot buying” of these forgings to respond to the stronger than anticipated demand from customers. In addition, the higher operating costs included start-up costs associated with setting up our new operations at TubeFit, including material costs for new inventory, warehousing costs, and sales & marketing costs for prospective new customers.
| 17 |
Overall, the operating income improved over prior year as increased volume allowed us to leverage fixed costs and offset much of the increase in material costs. The segment's operating income increased $0.8 million over the prior year due to its strong performance for the year.
As with our Precision Components segment, the Flanges & Fittings segment is witnessing a slight slowdown in overall demand from its customers. However, we remain optimistic about the overall prospects of the Flanges & Fittings industry. The increasing attention on energy, chemical manufacturing, food processing, and other industries requiring flow management all appear to position the companies within this industry, including GF&F and TubeFit, for continued growth. Both GF&F and TubeFit are focused on continuing to expand its customer base in 2013, particularly with the instrumentation market segment
Financial Condition
At June 30, 2012 we have a cash balance of $1.4 million, current assets of $9.7 million and current liabilities of $3.66 million. We believe that we have the ability to provide for our fiscal 2013 operational needs through projected operating cash flow and cash on hand.
Operating activities provided a positive cash flow of approximately $6.2 million and a decrease in cash of $0.5 million for the year ended June 30, 2012 and 2011, respectively.
During fiscal year ending June 30, 2012 and 2011 $0.7 million and $1.4 million was invested in manufacturing equipment to drive an increase in production efficiencies through automation and improvements. An investment in the acquisition of TubeFit during the fiscal year ending June 30, 2012 resulted in the addition of $0.1 million of goodwill and during the fiscal year ending June 30, 2011, goodwill increased $3.5 million mainly resulting from the acquisition of General Flange & Forge.
Financing activities for fiscal year end June 30, 2012 amounting to $1.1 million consisted mostly of consolidation and repayment of long term debt and $4.7 million was returned to the shareholders in the form of a distribution. During fiscal year ending June 30, 2011, approximately $5.5 million was financed for the acquisition of General Flange & Forge and $2.0 million was returned to the shareholders in the form of a distribution.
In a noncash transaction member units of TeknaSeal and Flomet amounting to $4.5 million and $5.7 million, respectively, were contributed to QMT during fiscal year ending June 30 2011.
Critical Accounting Policies and Estimates
Our significant accounting policies are summarized in Note A of our consolidated financial statements set forth in this report on Form 8-K/A. The preparation of financial statements requires management to make estimates and assumptions that affect amounts reported therein, including estimates about the effects of matters or future events that are inherently uncertain. Policies determined to be critical are those that have the most significant impact on our financial statements and require management to use a greater degree of judgment and/or estimates. Actual results may differ from these estimates under different assumptions or conditions.
| 18 |
Principles of Consolidation
The consolidated financial statements include the accounts of QMT and its majority owned subsidiaries for the years ending June 30, 2012 and 2011. All intercompany balances and transactions have been eliminated upon consolidation.
Cash and Cash Equivalents
For purposes of reporting cash flows, QMT considers all highly liquid debt instruments with an initial maturity of less than three months to be cash equivalents. QMT places its cash with high credit quality financial institutions and does not believe it is exposed to any significant credit risk on cash and cash equivalents. At times, cash in bank may exceed FDIC insurable limits.
Accounts Receivable
QMT uses the allowance method to account for uncollectible accounts receivable. The allowance is sufficient to cover both current and anticipated future losses. Uncollectible amounts are charged against the allowance account. Management estimates this amount based upon prior experience with customers and an analysis of individual trade accounts. An allowance for doubtful accounts of $124,733 and $69,092 has been reserved as of June 30, 2012 and 2011, respectively.
QMT offers most customers net 30-day terms. In special situations, QMT may offer extended terms or discounts to selected customers. Accounts are considered past due when invoices become thirty days past terms. No interest is charged on past due accounts.
Inventories
QMT values inventories at the lower cost or market using the first-in, first-out (FIFO) method. It is QMT’s practice to provide a valuation allowance for inventories to account for potential market pricing deflation and inventory shrinkage. Management actively reviews this inventory to determine that all materials are for products still in production to determine any potential obsolescence issues. An allowance for inventory obsolescence of $44,860 and $197,280 has been reserved as of June 30, 2012 and 2011, respectively.
Plant and Equipment
Plant and equipment are stated at cost. Depreciation is computed using the straight-line method over the estimated useful lives of the assets as follows:
| Useful Life | ||||
| Building and Improvements | 7 to 40 years | |||
| Machinery and Equipment | 3 to 12 years |
Major additions and improvements are capitalized, while replacements, maintenance and repairs, which do not improve or extend the life of the respective assets, are expensed as incurred.
Depreciation expense totaled $728,903 in 2012 and $629,401 in 2011.
| 19 |
Long-lived Assets
The carrying value of long-lived assets are reviewed annually; if at any time the facts or circumstances at any of our individual subsidiaries indicate impairment of long-lived asset values, as a result of a continual decline in performance or as a result of fundamental changes in a subsidiary's market, a determination is made as to whether the carrying value of the property's long-lived assets exceeds estimated realizable value. Long-lived assets consist primarily of Property and Equipment and Goodwill. No impairment was determined as of June 30, 2012.
Goodwill and Intangibles
Goodwill is recognized as a result of a business combination when the price paid for the acquired business exceeds the fair value of its identified net assets. Identifiable intangible assets are recognized at their fair value when acquired. Goodwill and intangible assets with indefinite useful lives are not amortized, but instead tested for impairment at least annually. Intangible assets with definite useful lives are amortized over their respective estimated useful lives to their estimated residual values, and reviewed for impairment.
QMT identified no material separately identifiable intangible assets in 2011 as a result of its acquisitions.
QMT has evaluated its existing intangible assets and goodwill that was acquired in prior periods for impairment and has determined that goodwill and other intangibles are not impaired.
Acquisitions during fiscal 2012 and 2011 resulted in an increase in goodwill of $0.1 million and $3.5 million, respectively. The carrying amounts were as follows (in thousands):
| June 30, | June 30, | June 30, | ||||||||||||||||||
| 2010 | Additions | 2011 | Additions | 2012 | ||||||||||||||||
| Precision Components | $ | 3,373 | $ | 1,750 | $ | 5,123 | $ | 0 | $ | 5,123 | ||||||||||
| Flanges and Fitting | - | 1,711 | 1,711 | 129 | 1,840 | |||||||||||||||
| Total | $ | 3,373 | $ | 3,461 | 6,834 | $ | 129 | $ | 6,963 | |||||||||||
Unearned Income
Unearned income consists of customer deposits for the development of molds used in the manufacturing process. As of June 30, 2012 and 2011, QMT had $131,786 and $197,114, respectively, of unearned income related to mold development. QMT recognizes revenue and the related expenses when the customer approves the mold for production. Accordingly, as of June 30, 2012 and 2011, QMT has incurred costs of $101,372 and $105,600, respectively, related to molds in the process of being developed which have been deferred and are included in prepaid expenses and other assets on the accompanying balance sheet.
| 20 |
Revenue Recognition
Revenue is measured at the fair value of the consideration received or receivable net of sales tax, trade discounts and customer returns.
Revenue from the sale of goods is recognized when the following conditions are satisfied: (1) QMT has transferred to the buyer the significant risks and rewards of ownership of the goods; (2) QMT retains neither continuing managerial involvement to the degree usually associated with ownership nor effective control over the goods sold; (3) the amount of revenue can be measured reliably; (4) it is probable that the economic benefits associated with the transaction will flow to the entity; and (5) the costs incurred or to be incurred in respect of the transaction can be measured reliably.
Research and Development Costs
Research and development costs are expensed as incurred. The majority of these expenditures consist of salaries for engineering and manufacturing personnel and fees paid to consultants for services rendered. For the years ended June 30, 2012 and 2011, QMT incurred $829,843 and $1,102,000, respectively, for research and development, which is included in selling, general and administrative expenses on the accompanying statement of income.
Financial Instruments
QMT's financial instruments consist of cash and cash equivalents, notes and accounts receivable, accrued liabilities, and notes and accounts payable. It is management's opinion that QMT is not exposed to significant interest rate or credit risks arising from these instruments. The fair values of these financial instruments approximate their carrying values.
Use of Estimates
The preparation of financial statements in conformity with accounting principles generally accepted in the United States of America requires management to make estimates and assumptions that affect the reported amounts of assets and liabilities and disclosure of contingent assets and liabilities at the date of the financial statements and the reported amounts of revenues and expenses during the reporting period. Actual results could differ from those estimates.
Income Taxes
As a limited liability company, QMT’s taxable income or loss is allocated to the members in accordance with their respective percentage ownership. Therefore, no provision or liability for income taxes has been included in the financial statements.
Management evaluated QMT’s tax position and concluded that QMT has taken no uncertain tax positions that require adjustment to the financial statements to comply with provisions of this guidance. With few exceptions, QMT is no longer subject to income tax examinations by the U.S. Federal, State or local tax authorities for years before 2009.
The tax returns for the years ending June 30, 2010 through 2012 are open to examination by federal and state authorities.
| 21 |
Presentation of Certain Taxes
QMT collects various taxes from customers and remits these amounts to applicable taxing authorities. QMT's accounting policy is to exclude these taxes from revenues and cost of sales.
Advertising
Advertising costs are charged to operations when incurred. Total advertising costs for the years ended June 30, 2012 and 2011 was approximately $99,037 and $131,567, respectively.
Recent Accounting Pronouncements
Changes to accounting principles generally accepted in the United States of America (U.S. GAAP) are established by the Financial Accounting Standards Board (FASB) in the form of accounting standards updates (ASU’s) to the FASB’s Accounting Standards Codification.
The Company considers the applicability and impact of all ASU’s. ASU’s not listed below were assessed and determined to be either not applicable or are expected to have minimal impact on our consolidated financial position or results of operations.
In May 2011, the Financial Accounting Standard Board ("FASB") issued an accounting update that amends ASC No. 820, "Fair Value Measurement" regarding fair value measurements and disclosure requirements. The amendments are effective during interim and annual periods beginning after December 15, 2011 and are to be applied prospectively. The accounting update will be applicable to the Company beginning in the third quarter of fiscal year 2012. As applicable to the Company, the adoption of the new guidance did not have a material impact on the consolidated financial statements.
In June 2011, the FASB issued an update to ASC No. 220, “Presentation of Comprehensive Income,” which eliminates the option to present other comprehensive income and its components in the statement of shareholders’ equity. The Company can elect to present the items of net income and other comprehensive income in a single continuous statement of comprehensive income or in two separate, but consecutive, statements. Under either method the statement would need to be presented with equal prominence as the other primary financial statements. The amended guidance, which must be applied retroactively, is effective for fiscal years, and interim periods within those years, beginning after December 15, 2011, with earlier adoption permitted. In December 2011, the FASB issued another update on the topic, which deferred the effective date pertaining only to the presentation of reclassification adjustments on the face of the financial statements. The adoption of the new guidance did not have a material impact on the consolidated financial statements.
In September 2011, the FASB issued amendments to the goodwill impairment guidance which provides an option for companies to use a qualitative approach to test goodwill for impairment if certain conditions are met. The amendments are effective for annual and interim goodwill impairment tests performed for fiscal years beginning after December 15, 2011 (early adoption is permitted). The implementation of the amended accounting guidance has not had a material impact on our consolidated financial position or results of operations.
| 22 |
In December 2011, the FASB issued an amendment to the accounting guidance for disclosure of offsetting assets and liabilities and related arrangements. The amendment expands the disclosure requirements in that entities will be required to disclose both gross information and net information about both instruments and transactions eligible for offset in the statement of financial position and instruments and transactions subject to an agreement similar to a master netting arrangement. The amendment is effective for fiscal years, and interim periods within those years, beginning on or after January 1, 2013, and shall be applied retrospectively. We do not expect the adoption of this accounting pronouncement to have a material impact on our financial statements when implemented.
Changes in and Disagreements with Accountants on Accounting and Financial Disclosure
None.
Controls and Procedures
| a) | Disclosure Controls and Procedures. |
We have established disclosure controls and procedures to ensure that material information relating to the company is made known to the officers who certify our financial reports and to other members of senior management and the Board of Directors. Based on their evaluation, our principal executive officer and principal financial officer have concluded that disclosure controls and procedures (as defined in Rule 13a-15(e) and 15d-15(e) under the Securities Exchange Act of 1934) were effective as of June 30, 2012 to ensure that information required to be disclosed in the reports that it files or submits under the Securities Exchange Act of 1934 is recorded, processed, summarized and reported within the time periods specified in Securities and Exchange Commission rules and forms.
Management’s Annual Report on Internal Control Over Financial Reporting
Our management is responsible for establishing and maintaining adequate control over financial reporting, as such term is defined in Rules 13a-15(f) and 15d-15(f) under the Securities Exchange Act of 1934. Our internal control over financial reporting is designed to provide reasonable assurance regarding the reliability of financial reporting and the preparation of financial statements for external purposes in accordance with generally accepted accounting principles.
Our internal control over financial reporting includes those policies and procedures that:
| · | Pertain to the maintenance of records that, in reasonable detail, accurately and fairly reflect the transactions and dispositions of the assets of the company; |
| · | Provide reasonable assurance that transactions are recorded as necessary to permit preparation of financial statements in accordance with generally accepted accounting principles, and that our receipts and expenditures are being made only in accordance with authorizations of our management and directors; and |
| · | Provide reasonable assurance regarding prevention or timely detection of unauthorized acquisition, use or disposition of our assets that could have a material effect on the financial statements. |
| 23 |
We conducted an evaluation of the effectiveness of our internal control over financial reporting based on the framework in Internal Control – Integrated Framework issued by the Committee of Sponsoring Organizations of the Treadway Commission (the “COSO Framework”). Based on this evaluation under the COSO Framework, our management concluded that our internal control over financial reporting was effective as of June 30, 2012.
This report does not include an attestation report of our registered public accounting firm regarding internal control over financial reporting. Management’s report was not subject to attestation by our registered public accounting firm pursuant to rules of the Securities and Exchange Commission that permit the company to provide only management’s report in this report.
(b) Changes in Internal Control over Financial Reporting.
There have been no significant changes in our internal control over financial reporting that occurred during the quarter ended June 30, 2012 that have materially affected, or are reasonably likely to materially affect, our control over financial reporting.
The evaluation of our disclosure controls included a review of whether there were any significant deficiencies in the design or operation of such controls and procedures, material weaknesses in such controls and procedures, any corrective actions taken with regard to such deficiencies and weaknesses and any fraud involving management or other employees with a significant role in such controls and procedures.
Our management does not expect that our disclosure controls and procedures and our internal control over financial reporting will prevent all error and all fraud. A control system, no matter how well conceived and operated, can provide only reasonable, not absolute, assurance that the objectives of the controls system are met. The design of any system of controls is based in part upon assumptions about the likelihood of future events, and there can be no assurance that any design will succeed in achieving its stated goals under all potential future conditions.
Security Ownership of Certain beneficial Owners and Management
The number of shares beneficially owned includes shares of Common Stock with respect to which the persons named below have either investment or voting power. A person is also deemed to be the beneficial owner of a security if that person has the right to acquire beneficial ownership of that security within 60 days through the exercise of an option or through the conversion of another security. Except as noted, each beneficial owner has sole investment and voting power with respect to the Common Stock.
Common Stock not outstanding that is subject to options or other convertible securities or rights is deemed to be outstanding for the purpose of computing the percentage of Common Stock beneficially owned by the person holding such options or other convertible securities or rights, but is not deemed to be outstanding for the purpose of computing the percentage of Common Stock beneficially owned by any other person.
| 24 |
The following table summarizes certain information as of August 31, 2012, except as noted below, with respect to the beneficial ownership of our common stock by each director, director-nominee, by all executive officers, directors and director-nominees as a group, and by each other person known by us to be the beneficial owner of more than five percent of our common stock after giving effect to the 1:1.95 Reverse Stock Split effective August 7, 2012. As of August 31, 2012, approximately 5,672,700 shares of our Common Stock were issued and outstanding.
| Number of Shares | |||||||
| Beneficially Owned | Percent of | ||||||
| Name and Address of Beneficial Owner | (1) | Class | |||||
|
Theodore Deinard, Interim Chief Executive Officer, Acting Chief Financial Officer and Director ARC Group Worldwide, Inc. 810 Flightline Blvd. Deland, FL 32724 |
3,613,948 | (2)(4) | 63.7 | % | |||
|
Jason Young, Former Chief Executive Officer and Chairman of the Board ARC Group Worldwide, Inc. 810 Flightline Blvd. Deland, FL 32724 |
3,613,948 | (2)(4) | 63.7 | % | |||
|
Brean Murray Carret Group, Inc. 40 West 57th Street, 20th Floor New York, NY 10019 |
3,613,948 | (2)(4) | 63.7 | % | |||
|
Paul J. Rini 7376 Johnnycake Rd Mentor, Ohio 44060 |
289,742 | (3) | 5.11 | % | |||
|
Harold R. Bledsoe, Former Chief Technology Officer and Former President ARC Group Worldwide, Inc. 810 Flightline Blvd. Deland, FL 32724 |
0 | (5) | * | ||||
|
Robert Marten, President ARC Group Worldwide, Inc. 810 Flightline Blvd. Deland, FL 32724 |
83,941 | (5)(6) | 1.48 | % | |||
|
Arlan Clayton ARC Group Worldwide, Inc. 810 Flightline Blvd. Deland, FL 32724 |
806,046 | (7) | 14.21 | % | |||
|
Jerrold H. Abrahams, Director ARC Group Worldwide, Inc. 810 Flightline Blvd. Deland, FL 32724 |
256 | (8) | * | ||||
|
Lynn Wunderman, Director ARC Group Worldwide, Inc. 810 Flightline Blvd. Deland, FL 32724 |
0 | ||||||
|
Jonathan Bernstein, Director ARC Group Worldwide, Inc. 810 Flightline Blvd. Deland, FL 32724 |
0 | ||||||
|
Viktor Nemeth, Director ARC Group Worldwide, Inc. 810 Flightline Blvd. Deland, FL 32724 |
0 | ||||||
|
Keerat Kaur, Corporate Secretary ARC Group Worldwide, Inc. 810 Flightline Blvd. Deland, FL 32724 |
3,613,948 | (2)(4) | 63.7 | % | |||
|
Luke McGee, Assistant Secretary ARC Group Worldwide, Inc. 810 Flightline Blvd. Deland, FL 32724 |
3,613,948 | (2)(4) | 63.7 | % | |||
| All officers and directors as a group (9 persons) | 3,698,146 |
(2)(4)(6)(8) |
65.2 | % | |||
| 25 |
* Less than one percent.
| (1) | “Beneficial ownership” is defined in the regulations promulgated by the U.S. Securities and Exchange Commission as having or sharing, directly or indirectly (1) voting power, which includes the power to vote or to direct the voting, or (2) investment power, which includes the power to dispose or to direct the disposition, of shares of the common stock of an issuer. The definition of beneficial ownership includes shares underlying options or warrants to purchase common stock, or other securities convertible into common stock, that currently are exercisable or convertible or that will become exercisable or convertible within 60 days. Unless otherwise indicated, the beneficial owner has sole voting and investment power. |
| (2) | Consists of 3,613,948 shares beneficially owned by Brean Murray Carret Group, Inc. Mr. Young, the Company's Chairman of the Board, Mr. Theodore Deinard, Interim Chief Executive Officer and Acting Chief Financial Officer and Director, Ms. Keerat Kaur, Corporate Secretary and Mr. Luke McGee, Assistant Secretary, serve as representatives of Brean Murray Carret Group, Inc. and hold voting and investment power over these shares on behalf of the Brean Murray Carret Group, Inc. |
| (3) | Consists of shares owned by Mr. Paul J. Rini as of July 6, 2012 as reported on Form 4 |
| (4) | The shares owned by Brean Murray Carret Group, Inc. and its affiliates are included five times in the table in accordance with the rules governing disclosure of beneficial ownership. In addition to being shown as owned by Brean Murray Carret Group, Inc. and its affiliates, these same shares are included as being within the scope of the definition of beneficial ownership of Mr. Jason Young, Mr. Theodore Deinard, Ms. Keerat Kaur, Mr. Luke McGee and by all officers and directors as a group. |
| (5) | Effective as of September 16, 2012, Mr. Harold Bledsoe has resigned as the President and Chief Technology Officer of ARC Group Worldwide, Inc. (the “Company”). Mr. Bledsoe will remain as the President and Chief Technology Officer of the Company’s subsidiary, ARC Wireless, Inc. and effective as of September 16, 2012, Mr. Robert Marten has been appointed as the President of the Company |
| (6) | Consists of shares owned by Mr. Marten as of August 31, 2012 (see "Recent Sales of Unregistered Securities" below). |
| (7) | Consists of shares owned by Mr. Clayton as of August 31, 2012 (see "Recent Sales of Unregistered Securities" below). |
| (8) | Consists of shares owned by Mr. Abrahams as reported on Form 3 on February 27, 2012 |
| 26 |
Directors and Executive Officers
Our directors and executive officers are as follows:
| Name | Age | PositionwiththeCompany | InitialDateasDirector | |||
| Theodore Deinard | 39 | Interim Chief Executive Officer, Acting Chief Financial Officer and Director | Appointed to the Board August 2011 | |||
| Jason T. Young | 33 | Chairman of the Board | Appointed to the Board October 2008 | |||
| Viktor Nemeth | 36 | DirectorFormer Chairman of the Audit Committee, Chairman of the Compensation Committee | Appointed to the Board: November 2008 | |||
| Lynn Wunderman | 57 | DirectorAudit Committee Member, Compensation Committee Member | Appointed to the Board: April 2010 | |||
| Jonathan Bernstein | 32 | DirectorAudit Committee Member, Compensation Committee Member | Appointed to the Board: June 2010 | |||
| Jerrold H. Abrahams | 46 | DirectorChairman of the Audit Committee | Appointed to the Board: February 2012 | |||
| Harold R. Bledsoe | 30 | Former President and Former Chief Technology Officer | Resigned Effective September 2012 | |||
| Robert Marten | 60 | President | Appointed September 2012 | |||
| Keerat Kaur | 30 | Corporate Secretary | Appointed March 2012 | |||
| Luke McGee | 29 | Assistant Corporate Secretary | Appointed July 2012 |
| 27 |
Theodore Deinard. Mr. Deinard has served as the Company’s Interim Chief Executive Officer, Acting Chief Financial Officer and as a member of the Company’s Board of Directors since August 16, 2011. Mr. Deinard is a Principal of Quadrant Management Inc. where he is responsible for the evaluation and management of private investment transactions. Mr. Deinard was previously a Director with Citigroup Global Markets (“Citi”) working with issuers of tax-exempt bonds in the U.S. At that position he was responsible for the design, marketing, structuring, execution and maintenance of a broad portfolio of risk management, investment, and credit products including interest rate swaps, options, caps, floors, repurchase agreements, guaranteed investment contracts, rolling securities agreements, letters of credit, bridge loans, and structured notes. During his twelve-year tenure at Citi, Mr. Deinard was involved in the execution of over $26 billion in derivative, reinvestment, and lending transactions, serving both clients of Citi's Public Finance Department as well as issuers, advisors, and banks nationwide. Mr. Deinard was a co-chair of the SIFMA (formerly known as BMA) Municipal Financial Products Committee and was also a leading consultant to tax-exempt entities regarding the application of mark-to-market accounting standards for derivative instruments. Mr. Deinard received his Bachelor of Arts from Yale University.
Director Qualifications of Theodore Deinard:
Mr. Deinard’s experience in the investment industry has provided him with extensive knowledge regarding financial matters.
Jason Young. Mr. Young became a Director in October 2008, and he became Chairman of the Board and Chief Executive Officer of the Company in November 2008. On August 16, 2011, Mr. Young resigned as the Company’s Chief Executive Officer. Since 2005, Mr. Young has been a Managing Director at Quadrant Management, Inc., where he is responsible for making investments in US and emerging market companies, where he frequently serves in active Management or Director level roles. He has been an Investment Committee Member of the Carret Global India Fund of Hedge Funds since 2005. In 2008 Mr. Young became a member of the Investment Committee of the Vanterra Advantage Fund. From 2000 to 2005, Mr. Young worked for Merrill Lynch in the Investment Banking Group and later in the Global Principal Investment Group. In 1999, he was an Analyst at Helicon Capital Management, a hedge fund and private equity investment firm. He holds a BA in International Economics from UCLA. Because of his employment with Quadrant Management, Inc., which is under common control with the Brean Murray Carret Group, Inc., Mr. Young is deemed to be under control of the Brean Murray Carret Group, Inc.
Director Qualifications of Jason Young:
Mr. Young’s three years of experience as a director and officer of the Company has given Mr. Young an extensive knowledge of the Company and its operations. In addition, Mr. Young’s service as an officer, director and employee of various entities in the investment industry has provided him with extensive knowledge regarding corporate financial and governance matters.
Viktor Nemeth. Mr. Nemeth became a Director in November 2008, and he currently serves on the Company's Compensation Committee. Between January 2008 and October 2008, Mr. Nemeth served as the Chief Revenue Officer of Bid4Spots.com, Inc., an entity that hosts weekly online auctions of radio airtime to allow advertisers and broadcasters to transact unsold airtime. From March 2000 through December 2007, Mr. Nemeth worked for Yahoo Inc. and predecessor companies Overture Services and GoTo.com in a variety of corporate development, business development, and sales & marketing roles. Mr. Nemeth holds a BA in Business-Economics with a Minor in Accounting from UCLA.
Director Qualifications of Viktor Nemeth:
Mr. Nemeth brings expertise to the Board in the areas of Sales and Marketing, Corporate and Business Development, and Organizational Development. He has advised growing companies on strategic and financial matters in a variety of industries.
| 28 |
Lynn Wunderman. Ms. Wunderman became a Director in April of 2010. Ms. Wunderman is a seasoned marketing professional with over 30 years experience in direct marketing, database marketing, communications, consulting and general management. Over the years, she has launched three successful companies, two continuing non-profit organizations, and counseled some of the largest advertisers in the industry. From 1999 until 2005, she was the President and CEO of I-Behavior. Since 2006 she has served as the Principal of the Wunderman Group. Since 2009, she has also served as the Chairman of TopVoice, a technology start-up. Ms. Wunderman currently serves on the Boards of Chango, Lucid Commerce and YouBeauty- online media and technology companies, and has served on a number of advisory boards, including BuySite, Convergent Mobile, Grandparents.com, uknow, Zadspace and the Hudson Valley Center for Innovation.
Director Qualifications of Lynn Wunderman:
Ms. Wunderman’s extensive leadership experience as a Chief Executive Officer and Principal of two entities, creation of both for-profit and non-profit organizations, and significant experience on advisory boards has given her valuable insight into the management of diverse entities.
Jonathan Bernstein. Mr. Bernstein became a Director in July of 2010. Mr. Bernstein is currently a Founding Partner and the Managing Member of BlackBern Partners LLC, a Private Investment Partnership. He has held this position since January of 2010. Since August 2011, Mr. Bernstein has represented BlackBern Partners LLC as CEO and Chairman of the Board of Cadec Global Inc, a fleet management technology provider. Since November of 2008 Mr. Bernstein has also served as the Vice President for Business Development and Vice Chairman of Corfin Industries LLC, a semiconductor component preparation services company. Prior to these positions, Mr. Bernstein served as a research Associate at Merlin Securities from June to October of 2008, and as an Investment Analyst at Pershing Square Capital Management from June 2004 until June 2006. Mr. Bernstein also serves as the Chairman of Minds Matter, Inc., a not-for-profit organization whose mission is to transform the lives of accomplished high school students from low-income families by broadening their dreams and preparing them for college success. Mr. Bernstein received his MBA from Columbia University and has a degree in electrical engineering from Cornell University.
Director Qualifications of Jonathan Bernstein:
Mr. Bernstein’s experience in the investment industry and in Corporate and Business Development has provided him with extensive knowledge regarding financial and corporate governance matters.
Jerrold H. Abrahams. Mr. Abrahams became a Director of the Company in February of 2012 and he currently serves on the Company's Audit Committee. Mr. Abrahams serves as a consultant to variety of businesses in the energy sector including a renewable energy private equity fund. In 1992, Mr. Abrahams joined Citi (then Smith Barney Harris Upham Inc.) where he was to enjoy a 20 year career. For the first stage of his career, Mr. Abrahams specialized in infrastructure finance and developed a specific expertise in transportation project finance and privatization. In 1998, Mr. Abrahams received the Citibank Global Customers Solution Award for his work related to the privatization of Highway 407 in Ontario, Canada. At the time, it was the largest privatization of a transportation asset in North America. In 2000, Mr. Abrahams was recruited to join a nascent financial products initiative in governmental and tax-exempt finance. Over the next eight years, Mr. Abrahams played a senior role in the creation of a $40 billion municipal interest rate swap portfolio, $15 billion reinvest book and $8.0 billion loan portfolio. Mr. Abrahams was the lead financial products banker for some of the largest and most complex transactions of the firm's practice including the New York Jets (MetLife Stadium), the Chicago Skyway and New York City. During this time, Mr. Abrahams was promoted to Managing Director and appointed to the MSD Diversity Committee. Mr. Abrahams has a Bachelors of Science in Economics from Washington University in St Louis, Missouri and a Masters of Business Administration from Columbia University, New York. Mr. Abrahams is an Adjunct Professor at the NYU Robert F. Wagner Graduate School of Public Policy.
| 29 |
Director Qualifications of Jerrold H. Abrahams:
Mr. Abrahams’ experience in the investment industry and in Corporate and Business Development has provided him with extensive knowledge regarding financial and business matters.
Robert Marten. Mr. Marten was appointed as the Company’s President on September 16, 2012. Mr. Marten has served as the President and Chief Executive Officer of the Company’s subsidiary FloMet LLC since July of 2006. Mr. Marten has served as the President and Chief Executive Officer of the Company’s subsidiary Quadrant Metals Technologies LLC (“QMT”) since its inception in 2011. He has also served as the Chief Executive Officer of the Company’s subsidiaries General Flange & Forge LLC since April, 2011 and Tubefit LLC since November, 2011. He has served as the Chief Executive Officer of the Company’s subsidiaries Advanced Forming Technologies, Inc. and AFT-Hungary Kft. since the Company acquired these entities on August 8, 2012. Mr. Marten previously served in executive leadership positions with several other manufacturing companies. Mr. Marten has both a BBA and an MBA from the University of Wisconsin – Madison.
Keerat Kaur. Ms. Kaur was appointed Corporate Secretary of the Company in March 2012. Ms. Keerat Kaur is a Vice President at Quadrant Management, Inc., where she is responsible for evaluating and executing private equity investments in the US and emerging markets, as well as monitoring and supporting portfolio companies. In addition, Ms. Kaur is a Vice President at Carret Global India Fund of Hedge Funds. Prior to Quadrant, Ms. Kaur was a business strategy analyst at HCL Technologies Ltd., New Delhi, one of India‘s premier IT services provider. She holds an MBA in Finance from the Indian Institute of Foreign Trade, India and a Bachelor’s in Finance from Shri Ram College of Commerce, New Delhi, India.
Luke McGee. Mr. McGee was appointed Assistant Corporate Secretary of the Company in July 2012.Mr. McGee graduated magna cum laude from Duke University in 2005 with a degree in economics. Mr. McGee started his professional career as an investment banker at Merrill Lynch in the Financial Institutions Group. While at Merrill Lynch, Mr. McGee focused on banking, assets management and insurance industries. Notable merger and acquisition transactions included the merger of Merrill Lynch Investment Managers with BlackRock in February 2006, the purchase of Gateway Investment Managers by Natixis Asset Management in February 2008 and the sale of Seligman Investments to Ameriprise Financial. Mr. McGee also participated in the capital fundraising for the formation of Validus Re, A Bermuda cat reinsurer, as well as numerous IPO’s including The Blackstone Group, Ram Re and Och-Ziff. In February 2009 Mr. McGee left Merrill Lynch and joined Deutsche Bank in a similar capacity. In April 2010, Mr. McGee joined the team at Quadrant Management, Inc. At Quadrant, Mr. McGee has focused primarily on healthcare. Mr. McGee has served as acting CFO for Quadrant’s existing investments in the durable medical equipment industry while actively seeking new investment opportunities.
| 30 |
Family Relationships
The following officers and directors of ARC are also affiliated with Quadrant and Brean Murray: Mr. Jason Young, the Company’s Chairman, has been a Managing Director at Quadrant since 2005, where he is responsible for making investments in US and emerging market companies, and where he frequently serves in active management- or director-level roles. Mr. Theodore Deinard, ARC’s Interim CEO and a director of the Company, is a Principal of Quadrant. Ms. Keerat Kaur is a Vice President of Quadrant and the Corporate Secretary of ARC. Mr. Deinard is also related by marriage to an officer of Quadrant. Mr. Jason Young and Mr. Alan Quasha, an officer of Quadrant, each serve on the Board of Directors of QMT and receive fees for such services. Messrs. Young and Deinard have recused themselves from all deliberations and voting of the Board in respect of the QMT Acquisition matters. Mr. Young, Mr. Deinard and Ms. Kaur do not directly own any shares of ARC in their own respective names and are not deemed to beneficially own Company shares through any entities other than Brean Murray or Quadrant. Mr. Young and Mr. Deinard are each deemed to share voting and investment power over the shares beneficially owned by Brean Murray. Mr. Viktor Nemeth, a director of ARC, is the brother-in-law of Mr. Alan Quasha who serves as the Co-Chairman of Brean Murray and the President of Quadrant Management, Inc.
Board Meetings
The Board of Directors met 7 times during the fiscal year ended June 30, 2012, and each director serving as of such date participated in 100% of the meetings except for Mr. Bernstein who was unable to attend two meetings and Mr. Vega who resigned from the Company’s Board of Directors on August 16, 2011 who did not attend that meeting. The Board of Directors does not maintain a formal policy regarding the manner in which shareholders may communicate with the Board. The Board intends to adopt such a formal policy in the near future.
The Company encourages each member of the Board of Directors to attend the Annual Meeting of Shareholders, but does not require any member to do so. Two of the directors attended the Company’s last Annual Meeting of Shareholders, held on August 7, 2012.
Board Independence
We are currently subject to corporate governance standards defining the independence of our directors imposed by the NASDAQ Capital Market's requirements for independent directors (Rule 5605(a)(2) of the Marketplace Rules of The NASDAQ Stock Market LLC). Viktor Nemeth, Lynn Wunderman, Jonathan Bernstein and Jerrold H. Abrahams qualify as independent directors in accordance with the standards imposed by the NASDAQ Capital Market's requirements for independent directors (Rule 5605(a)(2) of the Marketplace Rules of The NASDAQ Stock Market LLC).
Board Risk Oversight
The Board of Directors has broad responsibility to provide oversight of significant risks to the Company primarily through direct engagement with Company management and through delegation of ongoing risk oversight responsibilities to the Board’s committees.
| 31 |
Board Leadership Structure
Since August of 2011, the roles of Chief Executive Officer and Chairman have been segregated, with Mr. Jason Young, who previously also served as both the Company’s Chief Executive Officer and Chairman, now serving solely as Chairman, and Mr. Theodore Deinard serving as both Interim Chief Executive Officer and a director of the Company. The Company believes this segregation of roles is suitable for the Company. Both Mr. Young and Mr. Deinard are highly knowledgeable about the Company’s business and are capable of effectively identifying strategic priorities and leading the Board’s discussion and execution of strategy.
The Company has a board consisting of six members, which includes four Independent Directors. The Company believes Independent Directors and management have different perspectives and roles in strategy development. The Interim Chief Executive Officer brings company-specific experience and expertise, while the Company’s independent Directors bring experience, oversight, and expertise from outside the Company and its industry. The Board believes that the presence of the Interim Chief Executive Officer as a member of the Board promotes the development and execution of the Company’s strategy and facilitates the flow of information between management and the Board, which is essential to effective corporate governance. The Board believes that a Board, a majority of whose directors are independent is in the best interest of shareholders because it provides the appropriate balance between independent oversight of management and the development of strategy.
Audit Committee of the Board of Directors
Jerrold Abrahams, Lynn Wunderman and Jonathan Bernstein are independent directors serving on the Company’s Audit Committee as of the date of this Report. Mr. Abrahams serves as the Chairman of the Audit Committee. The responsibilities of the Audit Committee include overseeing our financial reporting process, reporting the results of the Committee’s activities to the board, retaining and ensuring the independence of our auditors, approving services to be provided by our auditors, reviewing our periodic filings with the independent auditors prior to filing, and reviewing and responding to any matters raised by the independent auditors in their management letter. The Audit Committee met 4 times during the fiscal year ended June 30, 2012, each meeting was attended by all committee members serving as of such date. The respective biographies and qualifications of the Audit Committee members are summarized above.
Audit Committee Financial Expert
Jonathan Bernstein has been designated to be the Company’s Audit Committee financial expert. The biography and qualifications of Mr. Bernstein are summarized above.
Audit Committee Charter
Our Board of Directors has adopted a written charter for the Audit Committee. The Audit Committee will review and assess the adequacy of the Audit Committee charter annually.
Compensation Committee
The Board of Directors currently has a Compensation Committee consisting of Viktor Nemeth, Lynn Wunderman and Jonathan Bernstein. Mr. Nemeth serves as the Chairman of the Compensation Committee. The Compensation Committee held no formal meetings during the fiscal year ended June 30, 2012, because there were no material compensation arrangements to discuss. At the present time, we do not maintain a corporate website; however, we intend to setup a corporate website in the near future and our Compensation Committee Charter will be made available on the new corporate website when it is established.
| 32 |
Nominating Committee: Nominating Policies and Procedures
The Company does not currently have a standing nominating committee of the Board of Directors because it believes that the nominating functions should be conducted by the full Board of Directors.
On June 30, 2008 the Board of Directors amended and restated its Policies and Procedures for Nominations of Director Candidates (the “Nomination Policies”), that have been in effect since January 1, 2009. Director nominations are made to the Board of Directors by independent directors, constituting a majority of the Board of Directors’ independent directors, in a vote in which only independent directors vote. It is the policy of the Board of Directors that each candidate recommended for nomination and election to the Board (each, a “Nominee”), regardless of whether such Nominee is recommended by a shareholder of the Company, the Board or any other person, shall be approved by a majority of the independent directors of the Board.
In general, the Board believes that certain minimum qualifications must be met by each Nominee for the Board, as well as meeting the applicable independence standards required by the Securities Exchange Commission (the “SEC”) and federal securities laws. The Board believes that Nominees must reflect a Board that is comprised of directors (i) a majority of whom are independent (as determined under the aforementioned SEC director qualification standards); (ii) who are of high integrity; (iii) who have qualifications that will increase the overall effectiveness of the Board; and (iv) who meet other requirements as may be required by applicable rules, such as financial literacy or financial expertise with respect to Audit Committee members. In evaluating the qualifications of the Nominees, the Board considers many factors, including issues of leadership ability, career success, character, judgment, independence, background, age, expertise, diversity and breadth of experience, length of service, other commitments and the like. The Board evaluates such factors, among others, and does not assign any particular weight or priority to any of these factors. Also, the Board considers the suitability of each Nominee, including the current members of the Board, in light of the current size and composition of the Board.
Unless and until otherwise subsequently determined by the Board, the number of directors of the Company at any time shall be the number of directors that the Board nominated for election at the most recently-held annual meeting of shareholders, increased by the number of directors, if any, that the Board appointed subsequent to the most recently-held annual meeting of shareholders and also increased by the number of directors, if any, whose term as a director did not expire at the most recently-held annual meeting of shareholders.
The Board shall consider recommendations for Nominees to the Board from shareholders (an “Eligible Shareholder”) holding a minimum of $2,000 in market value, or 1%, of the Company's voting common stock, which stock is held through the date of the meeting electing directors, and which Eligible Shareholder complies with the nomination notice procedures set forth in the Nomination Policies. Nominees recommended by Eligible Shareholders (hereinafter referred to as “Shareholder Candidates”) will be evaluated by the Board on the same basis as Nominees that may be identified by the Board, management or, if the Board permits, a search firm.
| 33 |
For a Shareholder Candidate to be considered by the Board, the Eligible Shareholder and the Shareholder Candidate must comply with the procedures set forth in the Company’s Nomination Policies. Recommendations for Shareholder Candidate(s) to the Board of Directors from an Eligible Shareholder must be directed in writing to ARC Wireless Solutions, Inc., Attn: President, at the Company's principal offices at 6330 North Washington Street, Unit #13, Denver, CO 80216-1146. The specific recommendations should include the information set forth in the Company’s Nomination Policies.
For a recommendation of a Shareholder Candidate to be properly brought before the Board by an Eligible Shareholder, the Eligible Shareholder must have given timely notice thereof in writing to the Secretary of the Corporation. To be timely, an Eligible Shareholder’s notice must be delivered to the Corporate Secretary not less than one hundred and twenty (120) days prior to the first (1st) anniversary of the preceding year’s annual meeting. In the event that the date of the annual meeting is advanced by more than thirty (30) days or delayed by more than sixty (60) days from the anniversary date of the preceding year’s annual meeting, the notice by the Eligible Shareholder must be delivered not later than the close of business on the later of the sixtieth (60th) day prior to such annual meeting or the tenth (10th) day following the day on which public announcement of the date of such annual meeting is first made.
The Secretary of the Corporation will provide a copy of the Nominating Policies and Procedures upon a request in writing from the Eligible Shareholder.
Section 16(a) Beneficial Ownership Reporting Compliance
Section 16(a) of the Securities Act of 1934, as amended (the “Exchange Act”) requires our directors, executive officers and holders of more than 10% of our common stock to file with the Securities and Exchange Commission initial reports of ownership and reports of changes in ownership of common stock and other equity securities of ours. Based solely on our review of the copies of such forms we received, we believe that during the year ended June 30, 2012, all such filing requirements applicable to our officers and directors were complied with, except that reports were filed late by the following persons:
| Name | Number of Late Reports | Transactions Not Timely Reported | Known Failures to File a Required Form | |||||||||
| Theodore Deinard | ||||||||||||
| Interim Chief Executive Officer, Acting Chief Financial Officer and Director | 1 | 1 | ||||||||||
| Jason Young | ||||||||||||
| Former Chief Executive Officer | ||||||||||||
| Chairman of the Board of Directors | 1 | 1 | ||||||||||
| Harold Bledsoe | ||||||||||||
| Former President and Chief Technology Officer | 1 | 1 | ||||||||||
| Marco Vega | ||||||||||||
| Former Director | 1 | 1 | ||||||||||
| Brean Murray Carret Group, Inc.10% shareholder | 1 | 1 | ||||||||||
| 34 |
Code of Ethics
The Company endeavors to adhere to provide assurances to outside investors and interested parties that the Company's officers, directors, and employees adhere to a reasonably responsible code of ethics and as such, we have adopted a Code of Ethics, which was amended on November 7, 2006, that applies to all officers, directors and employees of the Company. The Company will post the Code on the Company’s website when the new corporate website is launched.
Corporate Governance Documents
At the present time, we do not maintain a corporate website; however, we intend to establish a corporate website in the near future. Such website will include copies of our SEC filings, our Amended and Restated Code of Ethics, Compensation Committee Charter and Audit Committee Charter. Copies of these documents are available to shareholders without charge upon request to the Corporate Secretary at the Company’s principal address.
Compensation Discussion and Analysis
This Compensation Discussion and Analysis addresses the aspects of our compensation programs and explains our compensation philosophy, policies, and practices, with respect to our named executive officers, including our chief executive officer, acting chief financial officer, and chief technology officer, which we collectively refer to as our named executive officers, or NEOs.
Oversight of Executive Compensation Program
The Compensation Committee of our Board of Directors oversees our executive compensation programs. Each member of the Compensation Committee is an “independent director” as defined by the federal securities laws and in Rule 5605(a)(2) of the Marketplace Rules of The NASDAQ Stock Market LLC. The Compensation Committee held no formal meetings during fiscal 2011, because there were no material compensation arrangements to discuss. The Compensation Committee is empowered to advise management and make recommendations to the Board of Directors with respect to the compensation and other employment benefits of executive officers and key employees of the Company. The various components of the compensation programs for executive officers are discussed below in Elements of Executive Compensation Program.
Objectives of Executive Compensation and What the Programs are Designed to Reward
The Company’s executive compensation program is designed to integrate compensation with the achievement of our short-term and long-term business objectives and to assist us in attracting, motivating and retaining the highest quality executive officers and rewarding them for superior performance.
We believe that the compensation of our executive officers should reflect their success in attaining key operating objectives, such as growth or maintenance of market position, development of new products, maintenance and development of customer relationships and long-term competitive advantage. We also believe that executive compensation should reflect achievement of individual goals established for specific executive officers, as well as specific achievements by such individuals over the course of the year such as development of specific products or customer relationships or agreements or executing or integrating acquisitions and strategic arrangements.
| 35 |
Compensation Consultants
In determining competitive levels of compensation, the Compensation Committee considers publicly available information regarding the compensation of executive officers of other comparable U.S. investor-owned companies. The Compensation Committee also considers recommendations made by the CEO regarding compensation for other NEOs and key employees. Neither the Company nor the Compensation Committee utilized the services of a compensation consultant in the fiscal year ended June 30, 2012, as both the Company and Compensation Committee believed that there was no need for the services of such consultant.
Elements of Executive Compensation Program
Compensation elements include:
| ¨ | base salary; |
| ¨ | annual cash or equity incentive awards; | |
| ¨ | long-term equity incentive compensation; and | |
| ¨ | other health, welfare and pension benefits. |
Base Salary
Base salary is designed to provide competitive levels of base compensation to our executives based on their experience, duties and scope of responsibilities. We pay base salaries because it provides a base compensation that is required to recruit and retain executives of the quality that we must employ to ensure the success of our Company.
Annual Cash or Equity Incentive Awards
Annual incentive compensation is designed to provide competitive levels of compensation based on experience, duties and scope of responsibilities. Incentive awards are influenced by the Company’s profitability and achievement of planned profitability, as well as other factors.
Long-Term Equity Incentive Compensation
Long-term equity awards were granted to our executives from our 1997 Stock Option and Compensation Plan, (“1997 Plan”) until September 2007, when the shareholders of the Company approved the new 2007 Stock Incentive Plan (the “2007 Plan”). The Compensation Committee does not have a regular schedule for awarding equity-based compensation and the timing of such awards is subject to the discretion of the Compensation Committee. We do not backdate options or grant options retroactively or stock options with a so-called “reload” feature. In addition, we do not plan to coordinate grants of options so that they are made before the announcement of favorable information, or after the announcement of unfavorable information.
In 2007, the Compensation Committee issued a stock option award under the 2007 Plan of 40,000 shares to Steve C. Olson, our former Chief Technology Officer all of which terminated upon his resignation from the Company. No stock options were issued in 2012 or 2011.
| 36 |
Other Health, Welfare and Retirement Benefits
Health and Welfare Benefits
Employees may participate in our health and welfare benefit programs, including medical, dental and vision care coverage, disability insurance, and life insurance. We provide these benefits to meet the health and welfare needs of employees and their families.
Pension Benefits and Nonqualified Deferred Compensation
We do not currently provide pension arrangements or post-retirement health coverage for our executives or employees, although we may consider such benefits in the future. In addition, we do not provide any nonqualified defined contribution or other deferred compensation plans, although we may consider such benefits in the future.
Employment Agreements and Other Post-Employment Payments
Mr. Theodore Deinard, our Interim Chief Executive Officer is not party to an employment agreement and has no current compensation arrangement with the Company.
Mr. Marten’s compensation for his services as the Company’s President shall be pursuant to his current employment agreement with the Company’s subsidiary FloMet LLC (the “Employment Agreement”). Pursuant to the Employment Agreement, Mr. Marten serves as the President and Chief Executive Officer of FloMet LLC. Mr. Marten entered into the Employment Agreement with FloMet LLC as of March 1, 2011. The Employment Agreement has a term of three (3) years. The term of Mr. Marten’s employment shall be automatically renewed for additional one (1) year terms unless either party to the Employment Agreement gives notice at least sixty (60) days prior to the scheduled expiration date of Mr. Marten’s employment. Pursuant to the Employment Agreement, Mr. Marten shall be entitled to receive a salary of $267,300 per annum. In addition, pursuant to the Employment Agreement, Mr. Marten shall be entitled to the standard benefits of other employees of FloMet LLC. The Employment Agreement contains standard covenants regarding intellectual property, as well as covenants not to compete and covenants not to solicit customers and employees. During the most recent fiscal year of the term of the Employment Agreement, in addition to his salary, Mr. Marten received incentive income of $106,479 and 401K matching funds of $13,786.92.
In connection with his services to QMT, the Company’s Board of Directors has agreed to pay Mr. Marten a bonus of $100,000.
Tax Implications of Executive Compensation
We do not currently intend to award compensation that would result in a limitation on the deductibility of a portion of such compensation pursuant to Section 162(m) of the Internal Revenue Code of 1986, as amended, other than awards that may be exercised under the 1997 Plan or be made under the 2007 Plan; however, we may in the future decide to authorize other compensation in excess of the limits of Section 162(m) if it determines that such compensation is in the best interests of the Company.
Although deductibility of compensation is preferred, tax deductibility is not a primary objective of our compensation programs. We believe that achieving our compensation objectives set forth above is more important than the benefit of tax deductibility and we reserve the right to maintain flexibility in how we compensate our executive officers that may result in limiting the deductibility of amounts of compensation from time to time.
| 37 |
Executive Compensation
The following table shows the compensation of the principal executive officer and the executive officers of ARC for the years ended December 31, 2011 and 2010.
Summary Compensation Table for 2011 - ARC
| Name and Principal Position | Year | Salary ($) | Bonus ($) | Stock Awards ($) | Option Awards ($) | Non-Equity Incentive Plan Compensation ($) | Change in Pension Value and Nonqualified Deferred Compensation Earnings ($) | All Other Compensation ($) | Total ($) | |||||||||||||||||||||||||||
| (a) | (b) | (c) | (d) | (e) | (f) | (g) | (h) | (i) | (j) | |||||||||||||||||||||||||||
| Theodore Deinard | 2011 | 10,417 | - | - | - | - | - | - | 10,417 | |||||||||||||||||||||||||||
| Interim Chief Executive Officer (4) | ||||||||||||||||||||||||||||||||||||
| Harold Bledsoe, | 2011 | 77,500 | - | - | - | - | - | - | 77,500 | |||||||||||||||||||||||||||
| Former President and Former Chief Technology Officer (5) | ||||||||||||||||||||||||||||||||||||
| Jason T. Young, | 2011 | 25,000 | - | - | - | - | - | - | 25,000 | |||||||||||||||||||||||||||
| Chairman of the Board, Former Chief Executive Officer (1) | 2010 | 22,900 | - | - | - | - | - | - | 22,900 | |||||||||||||||||||||||||||
| Steven C. Olson, | 2011 | 154,877 | - | - | - | - | - | - | 154,877 | |||||||||||||||||||||||||||
| Former Chief Technology Officer and Former Acting Chief Financial Officer (2)(3) | 2010 | 215,000 | - | - | - | - | - | - | 215,000 | |||||||||||||||||||||||||||
| (1) | Mr. Young was appointed as a director in October 2008 and was appointed as the Company’s Chairman of the Board and Chief Executive Officer in November 2008. Mr. Young resigned as the Company’s Chief Executive Officer and Secretary on August 16, 2011. Mr. Young received no compensation as an employee during 2011 and 2010. Mr. Young received 25,000 and $22,900 in fees for his services as a director during 2011 and 2010, respectively. |
| (2) | Mr. Olson resigned as the Company’s Chief Technology Officer and Acting Chief Financial Officer on August 16, 2011. |
| (3) | Mr. Olson’s salary for the years ended 2011 and 2010 was $215,000. |
| (4) | Mr. Deinard was appointed as a director in August 2011 and was appointed as the Company’s Interim Chief Executive Officer in August 2011. Mr. Deinard received no compensation as an employee during 2011. Mr. Deinard received $10,417 in fees for his services as a director during 2011. |
| (5) | Mr. Bledsoe resigned as the Company’s President and Chief Technology Officer on September 16, 2012. |
| 38 |
The following table shows the compensation of the principal executive officer and the executive officers of QMT for the fiscal years ended June 30, 2012 and 2011.
Summary Compensation Table for 2012 - QMT
| Name and Principal Position | Year | Salary ($) | Bonus ($) | Stock Awards ($) | Option Awards ($) | Non-Equity Incentive Plan Compensation ($) | Change in Pension Value and Nonqualified Deferred Compensation Earnings ($) | All Other Compensation ($) | Total ($) | |||||||||||||||||||||||||||
| (a) | (b) | (c) | (d) | (e) | (f) | (g) | (h) | (i) | (j) | |||||||||||||||||||||||||||
| Robert Marten (1) | 2012 | 270,689 | 30,187 | - | - | - | - | 13,787 | 314,663 | |||||||||||||||||||||||||||
| President | 2011 | 269,396 | 25,124 | 17,776 | 312,396 | |||||||||||||||||||||||||||||||
| Norma Caceres (2) | 2012 | 124,194 | 30,775 | 4,285 | 159,254 | |||||||||||||||||||||||||||||||
| Chief Financial Officer | 2011 | 64,904 | 850 | - | 65,754 | |||||||||||||||||||||||||||||||
| Thomas Houck (3) | 2012 | 126,760 | 33,931 | 9,360 | 170,051 | |||||||||||||||||||||||||||||||
| VP of Manufacturing | 2011 | 113,524 | 16,571 | 6,241 | 136,336 | |||||||||||||||||||||||||||||||
| Ashley Nichols (4) | 2012 | 118,390 | 33,041 | 1 | 8,777 | 160,208 | ||||||||||||||||||||||||||||||
| VP of Technology | 2011 | 110,708 | 16,191 | 8,213 | 135,112 | |||||||||||||||||||||||||||||||
| (1) | Robert Marten earned bonuses of $106,476 and $27,509 in for the years ending June 30, 2012 and 2011, respectively. The amounts in the table are amounts actually paid, and do not include amounts owed but not paid. |
| (2) | Norma Caceres earned bonuses of $64,117 and $8,371 in for the years ending June 30, 2012 and 2011, respectively. The amounts in the table are amounts actually paid, and do not include amounts owed but not paid. |
| (3) | Thomas Houck earned bonuses of $64,117 and $15,463 in for the years ending June 30, 2012 and 2011, respectively The amounts in the table are amounts actually paid, and do not include amounts owed but not paid. |
| (4) | Ashley Nichols earned bonuses of $62,972 and $15,031 in for the years ending June 30, 2012 and 2011, respectively. The amounts in the table are amounts actually paid, and do not include amounts owed but not paid. |
Stock Option Grants – ARC
There were no grants of common stock options to executive officers of ARC during the years ended June 30, 2012 or 2011.
Outstanding Equity Awards – ARC
At June 30, 2012 there were no outstanding equity awards.
| 39 |
Director Compensation for the year ended December 31, 2011
The table below summarizes the compensation paid by the Company to directors for the year ended December 31, 2011:
Director Compensation for the year ended December 31, 2011
| (a) | (b) | (c) | (d) | (e) | (f) | (g) | (h) | |||||||||||||||||||||
| Name(1) | Fees Earned or Paid in Cash ($) | Stock Awards ($) | Option Awards ($) | Non-Equity Incentive Plan Compensation ($) | Change in Pension Value and Nonqualified Deferred Compensation Earnings | All Other Compensation ($) | Total ($) | |||||||||||||||||||||
| Theodore Deinard (1) | $ | 2,083 | - | - | - | - | - | $ | 2,083 | |||||||||||||||||||
| Jason T. Young | $ | 25,000 | - | - | - | - | - | $ | 25,000 | |||||||||||||||||||
| Viktor Nemeth | $ | 43,333 | - | - | - | - | - | $ | 43,333 | |||||||||||||||||||
| Lynn Wunderman | $ | 43,333 | - | - | - | - | - | $ | 43,333 | |||||||||||||||||||
| Jonathan Bernstein | $ | 40,000 | - | - | - | - | - | $ | 40,000 | |||||||||||||||||||
| Marco Vega (2) | $ | 16,667 | - | - | - | - | - | $ | 16,667 | |||||||||||||||||||
| (1) | Effective as of August 16, 2011, Mr. Ted Deinard was appointed as the Company’s Interim Chief Executive Officer, Acting Chief Financial Officer and as a member of the Company’s Board of Directors. |
| (2) | Marco Vega resigned from the Company’s Board of Directors on August 16, 2011. |
Compensation Committee Interlocks and Insider Participation
No member of the Compensation Committee was an officer or former officer of the Company or had any material relationship or transactions with the Company and no officer of the Company sits on the compensation committee or other body that has the power to establish the compensation of any member of the Compensation Committee.
2007 Stock Incentive Plan
In September 2007 the shareholders of the Company approved the 2007 Stock Incentive Plan (the “2007 Plan”). The 2007 Plan provided for grants of up to 300,000 shares of our common stock to be issued as incentive. As of June 30, 2012, all stock incentive grants under the 2007 Plan had terminated and our Board of Directors has determined that no further awards will be made under the 2007 Plan.
Employment Contracts and Termination of Employment and Change-In-Control Arrangements
Mr. Steven C. Olson served as President and Chief Technology Officer of the Company’s Wireless Communications Solutions Division until his resignation on August 16, 2011.
Prior to the resignation of Mr. Olson, the Company had entered into a five year employment agreement with him Effective November 1, 2007. The agreement provided for annual base compensation of $200,000 in 2007, increasing annually to $245,000 in 2011. Mr. Olson was eligible for bonuses ranging from $5,000 to $100,000 annually contingent upon the Wireless Communications Solutions Division achieving certain net income targets. Mr. Olson received options to purchase 40,000 shares of our common stock on August 21, 2007. These options vested at a rate of 20% per year. In connection with Mr. Olson’s resignation on August 16, 2011, all such options have terminated.
| 40 |
We have no compensatory plan or arrangement that results or will result from the resignation, retirement, or any other termination of an executive officer’s employment with us or from a change-in-control or a change in an executive officer’s responsibilities following a change-in-control.
Certain Relationships and Related Transactions
Quadrant Management Inc. ("Quadrant") is under common control with Brean Murray Carret Group, Inc. Quadrant indirectly owns 74% of the membership interests of QMT. Brean Murray is the controlling shareholder of ARC. Brean Murray and Quadrant are under common control and therefore Brean Murray, Quadrant, ARC and QMT are affiliates under common control. Specifically, Brean Murray controls 100% of the ownership interests of Quadrant as well as, via certain wholly-owned intermediaries, 63.7% of the shares of ARC.
In addition, the following officers and directors of ARC are also affiliated with Quadrant and Brean Murray: Mr. Jason Young, the Company’s Chairman, has been a Managing Director at Quadrant since 2005, where he is responsible for making investments in US and emerging market companies, and where he frequently serves in active management- or director-level roles. Mr. Theodore Deinard, ARC’s Interim CEO and a director of the Company, is a Principal of Quadrant. Ms. Keerat Kaur is a Principal of Quadrant and the Corporate Secretary of ARC. Mr. Deinard is also related by marriage to an officer of Quadrant. Mr. Jason Young and Mr. Alan Quasha, an officer of Quadrant, each serve on the Board of Directors of QMT and receive fees for such services. Mr. Young, Mr. Deinard and Ms. Kaur do not directly own any shares of ARC in their own respective names and are not deemed to beneficially own Company shares through any entities other than Brean Murray or Quadrant. Mr. Young and Mr. Deinard are each deemed to share voting and investment power over the shares beneficially owned by Brean Murray. Mr. Viktor Nemeth, a director of ARC, is the brother-in-law of Mr. Alan Quasha who serves as the Co-Chairman of Brean Murray and the President of Quadrant Management, Inc.
Pursuant to the original terms of the ARC Advisory Agreement entered into on January 21, 2009, (the “ARC Advisory Agreement”), Quadrant has provided the Company financial advisory and business consulting services, including restructuring services. In consideration for the restructuring services provided by Quadrant since November 2008 and for ongoing services, the Company originally agreed to pay Quadrant the following compensation: (1) an initial cash fee of $250,000 upon signing the ARC Advisory Agreement; (2) an annual fee of the greater of: (i) $250,000, (ii) 20% of any increase in reported earnings before interest, taxes, depreciation and amortization after adjusting for one-time and non-recurring items (“EBITDA”) for the current financial year over preceding year, or (iii) 20% of reported EBITDA for the current financial year; and (3) all reasonable out-of-pocket expenses incurred Quadrant in performing services under the ARC Advisory Agreement.
Quadrant has been paid $250,000 per year since 2008 and has received $1,000,000 in fees in the aggregate since inception of the Agreement for the period 2008 through 2011.
| 41 |
The ARC Advisory Agreement technically provides Quadrant the right to receive 20% of ARC’s EBITDA, even if such EBITDA is derived from the QMT Acquisition and the AFT Acquisition. However, Quadrant has granted waivers to certain provisions of the ARC Advisory Agreement, (the “Quadrant Waiver”), such that: (I) in calendar year 2012 Quadrant shall only be paid an annual fee equal to the greater of (i) $250,000; (ii) the product of (a) 20% and (b) the EBITDA of ARC for the twelve months ending December 31, 2012 less the combined EBITDA of QMT and AFT for the twelve months ending February 29, 2012 less the EBITDA of ARC for the twelve months ending December 31, 2011; or (iii) the product of (a) 20% and (b) the reported EBITDA for the financial year of the Company minus the reported EBITDA for QMT and AFT for the twelve months ended February 29, 2012; and (II) in calendar year 2013 Quadrant shall only be paid an annual fee equal to the greater of (i) $250,000; (ii) the product of (a) 20% and (b) the EBITDA of ARC for the twelve months ending December 31, 2013 less the EBITDA of ARC for the twelve months ending December 31, 2012; or (iii) the product of (a) 20% and (b) the reported EBITDA for the financial year of the Company minus the reported EBITDA for QMT and AFT for the twelve months ended February 29, 2012. The ARC Advisory Agreement has been further revised such that it shall no longer extend for additional one-year periods after its expiration on December 31, 2013 in the absence of written termination notice by either party.
In consideration for granting the foregoing waiver, and in consideration for substantial merger and acquisition support services rendered to ARC over the past several years, Quadrant and ARC entered into a Letter Agreement pursuant to which ARC agreed to pay Quadrant transaction fees upon the closing of the QMT and AFT acquisitions, calculated by reference to 2% of the total enterprise value for the QMT Acquisition and AFT Acquisition. As a result of the Closing of the QMT and AFT Acquisitions on August 8, 2012, a fee of $1.6 million has been paid to Quadrant.
In addition, Quadrant and QMT have entered into a non-exclusive financial advisory agreement, (the “QMT Financial Advisory Agreement”), whereby Quadrant performs ongoing consulting and advisory services for QMT through Quadrant personnel (acting at all times as independent contractors to QMT). The scope of such services includes business consulting services, financial advisory services, and other services. In consideration for such services, on January 1, 2012 QMT commenced paying an annual cash fee to Quadrant of $250,000 to be paid in quarterly installments. QMT shall reimburse Quadrant for all reasonable out-of-pocket costs and expenses incurred by Quadrant in connection with the performance of its services. The QMT-Quadrant financial advisory agreement continues in effect following the acquisition of QMT by the Company and will remain effective through December 31, 2013 in accordance with the Amendment to the QMT Financial Advisory Agreement.
The Company utilized the manufacturing, product sourcing, and outsourcing services of Rainbow Industrial Limited (“RIL”) which is based in China. RIL is wholly owned by an affiliate of Quadrant Management, Inc., which is affiliated with the Company and its Chief Executive Officer as described above. The Company purchases goods and services from RIL valued at approximately $150,000 per month, however the actual dollar amount can vary significantly with normal fluctuations in business activity. RIL has advised the Company that it is providing these goods and services to the Company at or near cost and that RIL does not expect to make any material profit from such transactions. The Company used RIL because it believed doing so lowered its costs and simplified its internal accounting procedures. As of December, 2011 we have ceased all operations at RIL and now manufacture exclusively through third party contract manufacturers in China.
Brean Murray, ARC’s largest shareholder, and Quadrant, are under common ownership, and are therefore deemed to be affiliates.
| 42 |
Except as set forth herein, during the fiscal year ended December 31, 2011 and during the interim period since the end of fiscal year 2011, there were no transactions between the Company and its directors, executive officers or known holders of greater than five percent of the Company's Common Stock in which the amount involved exceeded $120,000 and in which any of the foregoing persons had or will have a direct or indirect material interest.
Legal Proceedings
No material litigation existed at June 30, 2012 or at the date of this report.
Principal Accounting Fees and Services
Audit Fees
The Audit Committee reviews and determines whether specific projects or expenditures with our independent registered public accounting firm (auditor), Hein & Associates LLP potentially affect their independence. The Audit Committee’s policy requires that all services the Company's independent registered public accounting firm (auditor) may provide to the Company, including audit services and permitted audit-related services, be pre-approved in advance by the Audit Committee. In the event that an audit or non-audit service requires approval prior to the next scheduled meeting of the Audit Committee, the auditor must contact the Chairman of the Audit Committee to obtain such approval. Any approval will be reported to the Audit Committee at its next scheduled meeting.
The following table sets forth the aggregate fees billed to us for the years ended December 31, 2011, 2010 and 2009:
| 2011 | 2010 | 2009 | ||||||||||
| Audit fees | $ | 58,775 | (1) | $ | 53,075 | (1) | $ | 63,850 | (1) | |||
| Audit-related fees | - | (2) | - | (2) | — | (2) | ||||||
| Tax fees | $ | - | (3) | $ | 5,000 | (3) | $ | 5,000 | (3) | |||
| All other fees | - | - | - | |||||||||
| Total audit and non-audit fees | $ | 58,775 | $ | 58,075 | $ | 68,850 | ||||||
| (1) | Includes fees for professional services rendered for the audit of our annual financial statements and review of our Annual Report on Form 10-K for the year 2011, 2010 and 2009 and for reviews of the financial statements included in our quarterly reports on Form 10-Q for the first three quarters of fiscal 2011, 2010 and 2009 and related SEC registration statements. |
| (2) | Includes fees billed for professional services rendered in fiscal 2011, 2010 and 2009, in connection with acquisition planning and due diligence. |
| (3) | Includes fees billed for professional services rendered in fiscal 2011, 2010 and 2009, in connection with tax compliance (including U.S. federal and state returns) and tax consulting. |
| 43 |
Market Price and Dividends on the Registrant’s Common Equity and Related Stockholder Matters
On April 10, 2007, our common stock began trading on the NASDAQ Capital Markets Exchange under the symbol ARCW. Because trading in our shares is limited, prices can be highly volatile.
The table below represents the high and low closing sales prices of our common stock on the NASDAQ-CM during each of the quarters in the past two fiscal years. The common stock prices have been adjusted to give effect to the 1:1.95 Reverse Stock Split on August 7, 2012.
| Common Stock | ||||||||
| High Sales Price | Low Sales Price | |||||||
| September 30, 2010 | $ | 5.44 | $ | 3.94 | ||||
| December 31, 2010 | $ | 6.14 | $ | 5.03 | ||||
| March 31, 2011 | $ | 6.04 | $ | 4.58 | ||||
| June 30, 2011 | $ | 5.85 | $ | 4.04 | ||||
| September 30, 2011 | $ | 6.10 | $ | 5.30 | ||||
| December 31, 2011 | $ | 6.26 | $ | 5.75 | ||||
| March 31, 2012 | $ | 7.11 | $ | 5.46 | ||||
| June 30, 2012 | $ | 7.41 | $ | 4.31 | ||||
On August 31, 2012, the closing sales price for our common stock was $7.35 and the approximate number of our shareholders of record was approximately 2,700. We have not declared or paid any cash dividends on our common stock since our formation and do not presently anticipate paying any cash dividends on our common stock in the foreseeable future.
Equity Compensation Plan Information.
Securities authorized for issuance under our equity compensation plans as of June 30, 2012, after giving effect to the 1:1.95 Reverse Stock Split effective August 7, 2012, are as follows:
Equity Compensation Plan Table
| Number of securities to be issued upon exercise of outstanding options, warrants and rights | Weighted average exercise price of outstanding options, warrants and rights | Number of securities remaining available for future issuance under equity compensation plan | ||||||||||
| Equity compensation plans approved by security holders | - | - | 300,000 | |||||||||
| Equity compensation plans not approved by security holders | - | - | - | |||||||||
| Total | - | - | 300,000 | |||||||||
| 44 |
Recent Sales of Unregistered Securities
Pursuant to the QMT Acquisition and the Securities Sale included in the QMT Acquisition Agreement, the Company has issued the following restricted shares of the Company’s Common Stock (giving effect to the Reverse Stock Split):
| Name | Number of Shares Issued: | |||
| QMP Holdings Corp. | 2,003,169 | |||
| QTS Holdings Corp. | 975,326 | |||
| Arlan Clayton | 806,046 | |||
| John Schoemer | 161,209 | |||
| Robert Marten | 83,941 | |||
| Carret P.T., LP | 57,768 | |||
These shares were issued pursuant to the exemption provided by Regulation D under the Securities Act of 1933, as amended (each individual and entity receiving shares is an “accredited investor” as defined in Section 501 of Regulation D).
Pursuant to the terms of the AFT Acquisition Agreement $17,600,000 of the $43,000,000 purchase price was paid in the form of a convertible note. Under the terms of the AFT Convertible Note, PCC may at any time prior to maturity (subject to certain restrictions) convert the AFT Convertible Note into newly issued shares of the Company’s Common Stock at a conversion price equal to the 30-day average trading value per share of the Company’s Common Stock immediately preceding conversion, provided that the AFT Convertible Note may be converted only if it converts into less than 10% of the common ownership of the Company and the equity value of the Company is not less than $176 million.
Description of Registrant’s Securities
The total number of shares that the Corporation shall have the authority to issue is Two Hundred Fifty Two Million (252,000,000), consisting of Two Hundred Fifty Million (250,000,000) shares of common stock, with each share having a par value of $.0005, and Two Million (2,000,000) shares of preferred stock, with each share having a par value of $.001. As of August 31, 2012 we had approximately 5,672,700 shares of common stock issued and outstanding and no shares of preferred stock issued and outstanding.
| 45 |
Item 9.01. Financial Statements and Exhibits.
| (a) | Financial Statements of Businesses Acquired. |
Audited consolidated financial statements of ARC as of December 31, 2011 and 2010 and for the years ended December 31, 2011 and 2010 were previously reported on Form 10-K, which was filed with the SEC on March 14, 2012. Unaudited interim consolidated financial statements of ARC as of June 30, 2012 and for the six months ended June 30, 2012 and 2011 were previously reported on Form 10-Q for the quarter ended June 30, 2012, which was filed with the SEC on August 8, 2012. The audited annual consolidated financial statements and interim consolidated financial statements of ARC are incorporated herein by reference.
Audited combined financial statements of AFT as of April 1, 2012 and April 3, 2011 and for the years ended April 1, 2012 and April 3, 2011 were previously reported in the Company’s Definitive Proxy Statement, which was filed with the SEC on July 16, 2012. The audited annual combined financial statements of AFT are incorporated herein by reference.
The Financial Statement of QMT are on Exhibit 99.1 and are incorporated by reference herein
(b) Pro Forma Financial Information.
The pro forma financial information is on Exhibit 99.2 and is incorporated by reference herein.
(d) Exhibits.
Exhibit 99.1 Financial Statements of Quadrant Metals Technology, LLC
Exhibit 99.2 Unaudited Pro Forma Financial Statements
SIGNATURES
Pursuant to the requirements of the Securities Exchange Act of 1934, the Registrant has duly caused this report to be signed on its behalf by the undersigned hereunto duly authorized.
| ARC Group Worldwide, Inc. | ||
| (Registrant) | ||
| Date: September 28, 2012 | By: | /s/ Theodore Deinard |
| Name: Theodore Deinard | ||
| Title: Interim Chief Executive Officer |
| 46 |