Attached files
Exhibit 99.1
Summary
This summary highlights selected information contained elsewhere in this offering memorandum or incorporated herein by reference, but may not contain all information that may be important to you. We encourage you to read this entire offering memorandum and the documents to which we refer you carefully, including “Risk factors” and the consolidated financial statements and other information contained elsewhere in this offering memorandum or incorporated by reference herein before making an investment decision.
Unless the context otherwise requires or as otherwise indicated, references in this offering memorandum to “we,” “our,” “us,” “Wolverine” and the “Company” refer to Wolverine World Wide, Inc. and its consolidated subsidiaries; references to the “PLG Business” or “PLG” refer to the Performance + Lifestyle Group business of Collective Brands, Inc. References to “initial purchasers” refer to the firms listed on the cover page of this offering memorandum. Financial and other information identified in this offering memorandum as “pro forma” gives effect to the consummation of the Transactions (as defined below). See “Unaudited pro forma consolidated condensed financial information.”
Our company
We are a leading designer, manufacturer and marketer of a broad range of quality casual footwear and apparel, performance outdoor footwear and apparel, industrial work shoes, boots and apparel, and uniform shoes and boots. During the trailing four quarters ended June 16, 2012, we generated revenue and Adjusted EBITDA of $1,403.6 million and $203.7 million, respectively. During the trailing four quarters ended June 16, 2012, on a pro forma basis after giving effect to the Transactions, we generated revenue and Adjusted EBITDA of $2,465.6 million and $295.5 million, respectively. See “—Summary historical and pro forma consolidated financial information of Wolverine.”
Our current portfolio consists of 12 well-known brands that are marketed in more than 190 countries and territories around the world. During fiscal year 2011, we sold approximately 52 million pairs/units of branded footwear and apparel. Our products generally feature contemporary styling with proprietary technologies designed to provide maximum comfort and performance and are sold at various price points which target a wide range of consumers of casual, work and outdoor footwear and apparel.
We have one reportable segment that is engaged in designing, manufacturing, sourcing, marketing, licensing and distributing branded footwear, apparel and accessories. We identify three operating groups within this one reportable segment:
| • | the Outdoor Group, consisting of Merrell®, Chaco® and Patagonia® footwear, and Merrell® apparel and accessories; |
| • | the Heritage Group, consisting of Wolverine® boots and shoes and Wolverine® apparel, Cat® footwear, Bates® footwear, Harley-Davidson® footwear and HyTest® footwear; and |
| • | the Lifestyle Group, consisting of Hush Puppies® footwear and apparel, Sebago® footwear and apparel, Cushe® footwear and Soft Style® footwear. |
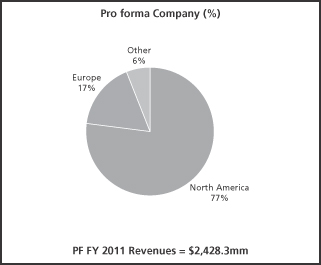
During fiscal year 2011, 59.8%, 23.9%, 8.1% and 8.2% of our revenue was derived from sales in the United States, Europe, Canada and other foreign territories, respectively.
Branded footwear, apparel and licensing
We source and market a broad range of footwear styles, including shoes, boots and sandals, under our many recognizable brand names. We combine quality materials and skilled workmanship to produce footwear according to our specifications at both Company-owned (5% of finished goods for fiscal year 2011) and third-party manufacturing facilities (95% of finished goods for fiscal year 2011). We also market Merrell®, Sebago® and Wolverine® brand apparel and accessories, and license some of our brands for use on non-footwear products, including Hush Puppies® apparel, eyewear, watches, socks, handbags and plush toys and Wolverine® brand eyewear and gloves.
Other businesses
In addition to our branded footwear, apparel and licensing operations, we also operate (i) retail stores in North America and the United Kingdom that feature footwear and apparel and consumer-direct retail websites; and (ii) a performance leathers business through our Wolverine Leathers Division.
| 1. | Wolverine Retail—Our consumer-direct business operated 88 North American and 12 United Kingdom-based retail stores at June 16, 2012. These stores are operated under the Hush Puppies®, Hush Puppies and FamilySM, Track ‘N Trail®, Sebago®, Wolverine Company StoreSM, Rockford Footwear Depot® and Merrell® names. The Rockford Footwear Depot®, Track ‘N Trail®, Hush Puppies® and Hush Puppies and FamilySM retail formats carry a large selection of Company-branded and licensed products, including Wolverine®, Merrell®, Hush Puppies®, Cat® Footwear, Chaco®, Cushe®, Patagonia® Footwear, Sebago® and Harley-Davidson® Footwear. We also operate Merrell® concept stores, Hush Puppies® concept stores and Sebago® concept stores, providing a platform to showcase these brands exclusively. In addition, we operated 38 consumer-direct retail websites at June 16, 2012, including www.merrell.com, www.wolverine.com, www.cushe.com, www.hushpuppies.com, www.chacos.com, www.catfootwear.com, www.sebago.com and www.batesfootwear.com. |
| 2. | The Wolverine Leathers Division—The Wolverine Leathers Division markets pigskin leather for use primarily in the footwear industry. We believe pigskin leather offers superior performance and other advantages over cowhide leather. Our waterproof and stain resistant leathers are featured in some of our footwear lines and many products offered by our international licensees and distributors. |
The Transactions
On May 1, 2012, we entered into several agreements relating to our pending acquisition of the Performance + Lifestyle Group business of Collective Brands, Inc. (“CBI”), including an Agreement and Plan of Merger (the “Merger Agreement”) and a Purchase Agreement (the “Acquisition Agreement”). Under the Merger Agreement, a wholly-owned subsidiary of Parent (as defined below) will merge with and into CBI (the “Merger”), with CBI surviving the Merger as a wholly-owned subsidiary of WBG–PSS Holdings LLC (“Parent”), a Delaware limited liability company owned by us, Blum Strategic Partners IV, L.P. (“Blum”) and Golden Gate Capital Opportunity Fund, L.P. (“Golden Gate”). Each share of CBI common stock will be converted into the right to receive $21.75 per share in cash at the effective time of the Merger.
Under the Acquisition Agreement, at or following the closing of the Merger, Parent will transfer the assets comprising the PLG Business to our wholly-owned subsidiary (the “Acquisition”), in exchange for a cash payment of approximately $1.26 billion and the cancellation of our equity interests in Parent. As a result of the Acquisition, which is expected to close substantially concurrently with the closing of this offering, we will own the wholesale and retail operations of the Sperry Top-Sider®, Saucony®, Stride Rite® and Keds® brands. Investment firms affiliated with Blum and Golden Gate will jointly acquire CBI’s remaining businesses, the operations of Payless ShoeSource and Collective Licensing International, which together will operate as a standalone entity.
In connection with the Merger and Acquisition, we entered into a credit agreement on July 31, 2012 that provides us with a $1.1 billion senior secured credit facility (the “New Credit Facility”) consisting of (i) a term loan A facility of up to $550.0 million (the “Term Loan A Facility”) and a term loan B facility of up to $350.0 million (the “Term Loan B Facility”; and, together with the Term Loan A Facility, the “Term Loan Facilities”), and (ii) a revolving credit facility of up to $200.0 million (the “New Revolving Credit Facility”).
In this offering memorandum, we collectively refer to the Merger, the Acquisition, the closing of the New Credit Facility, the sale of the notes offered hereby and the related transactions, such as the repayment of our existing indebtedness and certain of CBI’s existing indebtedness, as the “Transactions.” See “The Transactions” for more details regarding the Acquisition and the related transactions.
Performance + Lifestyle Group
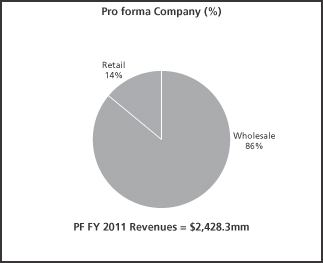
PLG is a leading provider of iconic performance and lifestyle brands, each with unique characteristics and strong market positions focused on distinct and targeted consumer segments. PLG is predominantly a wholesaler of footwear, selling its products mostly in North America through a wide variety of retail formats, including premier department stores, specialty stores and athletic and sporting goods stores. PLG markets its products in countries outside North America through owned operations, independent distributors and licensees. PLG designs and markets categories of footwear and related accessories under various brands and trademarks, including Sperry Top-Sider®, Saucony®, Stride Rite® and Keds®. PLG also markets its products directly to consumers through a variety of owned formats: Stride Rite® children’s stores, Stride Rite® outlet stores, Stride Rite® store-in-stores, Sperry Top-Sider® stores, Saucony® stores and e-commerce sites. As of July 28, 2012, PLG operated 337 owned stores. For the trailing four quarters ended July 28, 2012, PLG generated $1,062.0 million in revenue. See “—Summary historical financial information of the PLG Business.”
PLG Wholesale
PLG Wholesale, which is comprised of PLG’s global wholesale operations, generated sales of $778.7 million (76.4% of PLG’s total sales) in fiscal year 2011. PLG Wholesale currently sells footwear in over 90 countries and territories and outsources all manufacturing of its finished goods. PLG Wholesale uses company-owned sales offices, independent distributors and licensees to market its various product lines outside of the United States. PLG Wholesale also sells its branded products through licensing and development arrangements with third-party distributors. These distributors sell PLG products through wholesale and retail channels, as well as online through brand websites. PLG currently has 10 distributors operating in 16 countries and territories. PLG Wholesale generated international sales of $156.1 million (15.3% of PLG’s total sales) in fiscal year 2011. Europe constituted the largest portion of PLG Wholesale’s international sales, followed by Canada.
PLG Retail
PLG Retail, which is comprised of PLG’s owned Stride Rite® children’s stores, PLG’s outlet stores, store-in-stores at select Macy’s Department Stores, Sperry Top-Sider® retail stores and Saucony® retail stores, generated sales of $240.6 million (23.6% of PLG’s total sales) in fiscal year 2011. Stride Rite® children’s stores are located primarily in larger regional shopping centers, clustered generally in the major metropolitan areas of the United States. The average size of a Stride Rite® children’s store is approximately 1,300 square feet, while outlet stores average approximately 2,800 square feet, and carry a broad range of footwear for adults in addition to children’s footwear. Sperry Top-Sider® stores average approximately 1,600 square feet and tend to be located in affluent areas that embrace the brand’s nautical lifestyle. PLG also operates Stride Rite® shoe departments within select Macy’s stores, which provides PLG with an additive, capital efficient distribution channel for its products. PLG also licenses 20 free-standing stores outside North America, each of which is branded “Stride Rite” and sells all of PLG’s brands in children’s sizes.
Acquisition rationale
Creation of a collection of lifestyle brands
We currently maintain a diverse portfolio of 12 well-known brands that have global distribution. The acquired PLG brands not only address a number of our “white-space” opportunities (Women’s, Athletic, Casual, Kids and Retail), but also fit our established criteria for shareholder value creation: authentic, “heritage” brands that have differentiated market positions and credibility with consumers, resulting in potential for significant global growth. We believe that retailers will look to partner with Wolverine to drive consumer connections and strategic growth, and our international partners will be able to tap local market opportunities.
Significant opportunity for global expansion, specifically with PLG brands
Our strong global business model provides a platform for growth and innovation, and the diversity of our portfolio helps mitigate fluctuations across geographic regions, styles, brands and consumer preferences. We have a rich history of international growth and success dating back to the introduction of Hush Puppies into international markets in 1959. For fiscal year 2011, international revenues accounted for over 40% of our revenue and over 60% of total unit volume.
By comparison, the PLG Business is based largely in the United States and international revenue and unit volume accounted for 15.3% and less than 11% of consolidated revenue and unit volume, respectively, during fiscal year 2011. We believe that our long established distributor relationships and significant international infrastructure will help accelerate the growth of the PLG brands in international markets.
Considerable and immediate increase in scale—both in terms of reported revenue and size of portfolio
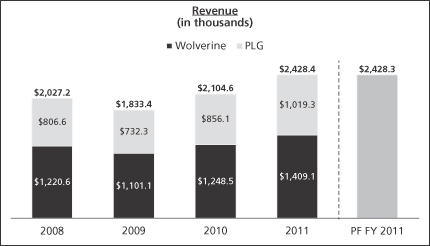
The acquisition of PLG provides Wolverine with an immediate increase in scale, as 42% of the combined entity’s pro forma revenue in fiscal year 2011 would have been contributed by the PLG brands. We expect to also benefit from the addition of four brands to our existing 12-brand portfolio, which will result in added reach, diversity and consumer segment penetration.
Value creation opportunity for Wolverine within each PLG brand
| • | Sperry Top-Sider® represents a significant opportunity for us to leverage our existing international infrastructure to grow the brand, as only approximately 6.5% of the brand’s revenues were derived internationally in fiscal year 2011. Sperry Top-Sider® is a top U.S. casual brand, #1 in men and #2 in women, and the leading boat shoe brand (62% share in men, 80% share in women) for the 52 weeks ended July 2012, according to the NPD Group. |
| • | Saucony® is a top US running brand (#7 market share overall for the 52 weeks ended July 2012, according to the SportsOneSource Group) that allows us to make inroads into the influential run |
| specialty channel. Saucony® occupies the #3 market share position (according to Leisure Trends Group) in run specialty and the #2 market share position in the expanding minimalism/natural movement category for the three-month period ending July 2012 (according to Leisure Trends Group). Saucony® has a more well-established international presence than the other PLG brands, as approximately 32.3% of its sales were outside the United States in fiscal year 2011. |
| • | Stride Rite® is a leading children’s footwear brand, providing a presence that currently does not exist within our brand portfolio. Stride Rite® occupies a top three market share position for children under nine years old, and the brand has the #1 market share position for infant/toddler footwear for the 52 weeks ended July 2012, according to the NPD Group. Stride Rite® has meaningful untapped potential for international growth (only approximately 6.8% of Stride Rite® Children’s Group sales were generated internationally in fiscal year 2011). |
| • | Keds® maintains strong brand recognition and a deep heritage that is not reflected in the current size of the business. Keds® occupies the #7 market share position in the women’s sports leisure category for the 52 weeks ended July 2012, according to the NPD Group. Approximately 23.7% of the brand’s revenues were derived internationally in fiscal year 2011. |
Opportunity to expand multi-brand retail concept
We believe that our expanded portfolio of brands offers a compelling and differentiated multi-brand retail opportunity. With a portfolio of 16 brands after the completion of the Acquisition, we will be able to provide customers with an exciting assortment of products that are fresh and diverse. Given the breadth of the products offered by each brand, we will be able to offer a multi-brand retail concept that can be tailored to meet the regional needs and preferences of our consumers around the world.
Wolverine’s proven ability to integrate acquisitions successfully
We have a proven track record of building brands for the long term that deliver growth in revenue, operating profit and cash flow. Over the last 15 years, we have added eight brands and acquired our distributors’ operations in Canada, the United Kingdom and certain key countries in
continental Europe. Successful brand additions and geographic expansions have helped us achieve accelerated growth over that period of time. We are confident that we can continue our rich tradition of successfully building brands added to our portfolio with the acquisition of PLG.
Our primary competitive advantages
Diverse product offering. Our brand portfolio is comprised of dynamic lifestyle brands that are well-recognized on a global scale. Our portfolio offers a broad spectrum of products including comfort casual, rugged outdoor and work footwear as well as casual, outdoor and work apparel. Our diversity enables us to offer footwear and apparel for a broad array of consumers, which we believe provides a competitive advantage by insulating us against any single fashion, economic or geographic risk.
Well-recognized brand names, proprietary designs and comfort technologies. We hold a significant portfolio of registered and common law trademarks that identify our branded products and technologies. These include Hush Puppies®, Dog Likeness (registered design trademark), Wolverine®, Bates®, Cushe®, Chaco®, Soft Style®, Wolverine Fusion®, DuraShocks®, MultiShox®, Wolverine Compressor®, Wolverine ICS®, Hidden Tracks®, iTechnologyTM, Bounce®, Comfort Curve®, HyTest®, Merrell®, M Circle Design (registered design trademark), Continuum®, Sebago® and Q Form®. Our Wolverine Leathers Division markets its pigskin leathers under the trademarks Wolverine Warrior Leather®, Weather Tight® and All Season Weather Leathers™. We have footwear marketing and distribution rights under the Cat®, Harley-Davidson® and Patagonia® trademarks pursuant to license arrangements with the respective trademark owners. We believe that consumers identify our products by our trademarks and that our trademarks are valuable assets.
Wide range of distribution channels. We sell our products directly to a wide range of retailers in the United States, Canada and certain countries in Europe, including department stores, national chains, catalog retailers, specialty retailers, mass merchants, Internet retailers and governments and municipalities. Many of the retailers purchasing our products operate multiple storefront locations. Our products are marketed worldwide in more than 190 countries and territories through Company-owned wholesale and retail operations and a network of approximately 100 third-party licensees and distributors. A broad distribution base protects us from dependence on any one customer, and no single customer of ours accounted for more than 10% of our revenues in fiscal year 2011.
Diversified manufacturing and sourcing base. We maintain a diverse manufacturing and sourcing base. Our owned manufacturing operations (5% of finished goods for fiscal year 2011) allow us to reduce our product lead-time, respond quickly to market demand, reduce inventory risk and lower freight, shipping and duty costs for sales to certain markets. Our third-party sourcing strategy (95% of finished goods for fiscal year 2011) allows us to benefit from lower manufacturing costs and state-of-the-art manufacturing facilities, source high quality raw materials from around the world and avoid capital expenditures necessary for additional owned factories. We believe our overall manufacturing strategy provides the flexibility to properly balance the need for timely shipments, high quality products and competitive pricing.
Our brands
Merrell® footwear, apparel & accessories. Merrell® footwear is designed to inspire and encourage participation in the outdoors. Known for quality, durability and comfort, the Merrell® footwear line uses a variety of proprietary designs and technologies to create footwear with distinctive styling, performance and comfort features for the trail or the town. Merrell® footwear products offer a wide range of styles, from technical hiking, multi-sport footwear and the minimalist Merrell® Barefoot Collection to versatile, lifestyle products for more casual outdoor adventures for men, women and kids. Merrell® footwear products are sold primarily through outdoor specialty retailers, sporting goods chains, department stores, online retailers and catalogs. Merrell® footwear is currently marketed in approximately 140 countries and territories worldwide.
The Merrell® apparel line extends the Merrell® commitment to an active outdoor lifestyle with a versatile line of apparel built for the summit or the street. The apparel line features stylized lifestyle silhouettes built with the technical, high performance, weather fighting materials that consumers expect from an outdoor brand. In addition to Merrell® apparel, the Outdoor Group markets Merrell® accessories, including packs, bags and luggage for men and women.
Patagonia® footwear. Pursuant to an agreement with Lost Arrow Corporation, we have the exclusive footwear marketing and distribution rights for Patagonia® and other trademarks. The Patagonia® footwear line focuses primarily on casual and outdoor performance footwear. Patagonia® is a registered trademark of Patagonia, Inc.
Chaco® footwear. The Chaco® footwear line focuses primarily on performance sandals and closed-toe products for the outdoor enthusiast.
Wolverine® footwear, apparel & licensing. The Wolverine® brand offers high quality boots and shoes that incorporate innovative technologies to deliver comfort and durability. The Wolverine® brand, which has been in existence for 129 years, markets footwear in three categories: (i) work and industrial; (ii) outdoor sport; and (iii) rugged casual. The development of DuraShocks®, MultiShox®, Wolverine Fusion® and Wolverine Compressor® technologies, as well as the development of the Contour Welt® line, have allowed the Wolverine® brand to offer a broad line of work footwear with a focus on comfort. The Wolverine® work product line, whose target consumers are industrial workers, features work boots and shoes with protective features such as toe caps, metatarsal guards and electrical hazard protection. The Wolverine® rugged casual and outdoor sport product lines incorporate DuraShocks®, Wolverine ICS® and other technologies and comfort features into products designed for casual and outdoor sport use. The target consumers for the rugged casual products have active lifestyles. The outdoor sport line is designed to meet the needs of hunters, fishermen and other active outdoor sports enthusiasts.
We market a line of work and rugged casual Wolverine® brand apparel. In addition, we license our Wolverine® brand for use on eyewear and gloves.
Cat® footwear. Pursuant to a license arrangement with Caterpillar, Inc., we have exclusive footwear marketing and distribution rights under Caterpillar®, Cat®, Cat & Design, Walking Machines® and other trademarks. We believe the association with Cat® equipment encourages customers to view the footwear as high-quality, rugged and durable. Cat® brand footwear products include work boots and shoes, sport boots, rugged casual and lifestyle footwear,
including lines of work and casual footwear featuring iTechnology™ and Hidden Tracks® comfort features. Cat® footwear targets work, industrial and active lifestyle users. Cat® footwear is marketed in approximately 130 countries and territories worldwide. Cat®, Caterpillar®, Cat & Design and Walking Machines® are registered trademarks of Caterpillar, Inc.
Bates® uniform footwear. The Bates® brand is a leader in footwear for military and civilian uniform users. Bates® utilizes DuraShocks®, DuraShocks SR™, CoolTech, Wolverine ICS® and other proprietary comfort technologies in the design of its military-style boots and oxford shoes. Bates® contracts with the United States Department of Defense and the military branches of several foreign countries to supply military footwear. Civilian uniform users include individuals in police, security, postal, restaurant and other industrial occupations. Bates® products are also distributed through specialty retailers and catalogs.
Harley-Davidson® footwear. Pursuant to a license arrangement with the Harley-Davidson Motor Company, we have footwear marketing and distribution rights for Harley-Davidson® branded footwear. Harley-Davidson® branded footwear products include motorcycle, casual, fashion, work and western footwear for men, women and children. Harley-Davidson® footwear is sold globally through a network of independent Harley-Davidson® dealerships and other retail outlets. Harley-Davidson® is a registered trademark of H-D Michigan, Inc.
HyTest® safety footwear. The HyTest® product line consists primarily of high-quality work boots and shoes that incorporate various specialty safety features designed to protect against hazards of the workplace, including steel toe, composite toe, metatarsal guards, and electrical hazard, static dissipating and conductive footwear. HyTest® footwear is distributed primarily through a network of independently-owned Shoemobile® mobile truck retail outlets providing direct sales of our occupational and work footwear brands to workers at industrial facilities and also through direct sales arrangements with large industrial customers.
Hush Puppies®. Since 1958, the Hush Puppies® brand has been a leader in casual footwear. The brand offers shoes, sandals and boots for men, women and children, and is currently marketed in approximately 140 countries and territories. The brand’s modern styling is complemented by a variety of comfort features and proprietary technologies that have earned the brand its reputation for comfort, style and value. In addition, the Hush Puppies® brand is licensed for use on certain items, including apparel, eyewear, handbags, socks, watches and plush toys.
Sebago®. The Sebago® product line has been marketed since 1946 and consists primarily of performance nautical and American-inspired casual footwear for men and women, such as boat shoes and hand sewn loafers. Highly recognized Sebago® line extensions include Sebago Docksides®, Drysides® and Triwater™. The Sebago® product line is currently marketed in approximately 120 countries and territories worldwide. The Sebago® manufacturing and design tradition of quality components, durability, comfort and “Americana” heritage is further supported by targeted distribution to better-grade independent, marine and department store retailers throughout the world. We also market a classic and marine Sebago® apparel line.
Cushe®. The Cushe® business focuses on relaxed, design-led footwear for active men and women. The Cushe® footwear business targets younger adult consumers and better-grade retailers with products ranging from sport casual footwear to sandals. Cushe® is marketed under three primary collections: Universal Traveler, Urban Safari and Coastal Supremacy.
Soft Style®. The Soft Style® product line consists primarily of women’s dress and casual footwear.
Recent Results
In our third fiscal quarter (which ended September 8, 2012), we experienced solid to good performance in the United States, Latin America and Asia regions compared to the third fiscal quarter of last year, but we also experienced an especially challenging macroeconomic environment and retail conditions in Europe, which represents less than 20% of our global unit volume. Due primarily to these challenges in Europe, we expect that earnings per share in the quarter will be approximately $0.10 per share below the prior year’s record $0.82 per share.
Although our expectations for the fourth fiscal quarter have been tempered by the even more challenging trading conditions in Europe, we still expect to report net sales and earnings per share growth in the fourth fiscal quarter.
This information about our third fiscal quarter performance and the forward-looking financial information about financial performance is preliminary and is inherently subject to variability, as our financial statements for the third fiscal quarter are not yet available and our fourth fiscal quarter is not yet complete.
Wolverine World Wide, Inc., publicly traded on the New York Stock Exchange under the ticker symbol “WWW,” is a Delaware corporation and the successor of a Michigan corporation of the same name organized in 1906, which, in turn, was the successor of a footwear business established in Grand Rapids, Michigan in 1883.
Our principal executive offices are located at 9341 Courtland Drive N.E., Rockford, Michigan 49351 and our telephone number at that address is (616) 866-5500. Our website is located at http://www.wolverineworldwide.com. Our website and the information contained on our website is not part of this offering memorandum, and you should rely only on the information contained in this offering memorandum or incorporated herein by reference when making a decision as to whether to invest in the notes.
Summary historical and pro forma consolidated financial information of Wolverine
The following tables present summary historical and pro forma consolidated financial information for the periods and as of the dates indicated. The summary historical consolidated financial information for fiscal years 2011, 2010 and 2009 is derived from, and qualified by reference to, our audited consolidated financial statements incorporated by reference in this offering memorandum. The summary historical consolidated financial information for the 24 weeks ended June 16, 2012 and June 18, 2011 and the trailing four quarters ended June 16, 2012 is derived from, and qualified by reference to, our unaudited consolidated financial statements incorporated by reference in this offering memorandum. Our unaudited consolidated financial statements have been prepared on the same basis as our audited consolidated financial statements and, in our opinion, reflect all adjustments, consisting only of normal and recurring adjustments, necessary for a fair presentation of such financial statements in all material respects. The results for any interim period are not necessarily indicative of the results that may be expected for a full year or any future period.
We have derived the summary historical consolidated financial information for the trailing four quarters ended June 16, 2012 by combining the applicable financial data from our unaudited consolidated financial statements for the 24 weeks ended June 16, 2012 with the applicable financial data from our audited consolidated financial statements for the fiscal year ended December 31, 2011, less the applicable financial data from our unaudited consolidated financial statements for the 24 weeks ended June 18, 2011. The summary unaudited pro forma data as of and for the trailing four quarters ended June 16, 2012 have been derived from the unaudited pro forma financial statements included elsewhere in this offering memorandum. The unaudited pro forma balance sheet information as of June 16, 2012 is presented as if the Transactions had occurred on June 16, 2012. The unaudited pro forma statement of operations information is presented as if the Transactions had occurred on January 2, 2011. We present the unaudited pro forma financial information for informational purposes only. The unaudited pro forma financial information is based on currently available information and assumptions that we believe are reasonable at this time.
The unaudited pro forma consolidated condensed financial statements were prepared using the purchase method of accounting. Wolverine has been treated as the purchaser for accounting purposes. The purchase accounting related to this unaudited pro forma information is dependent upon certain valuations and other studies that have yet to progress to a stage where there is sufficient information for a definitive measurement. The pro forma adjustments included have been made solely for the purposes of providing unaudited pro forma consolidated condensed financial information. Differences between the estimates reflected in this unaudited pro forma information and the final purchase accounting will likely occur, and these differences could have a material impact on the accompanying unaudited pro forma consolidated condensed financial information and the combined company’s future consolidated financial position or results of operations.
Our allocation of the purchase price is pending completion of several elements, as mentioned above, including the finalization of independent valuations to determine the fair values of the assets acquired and liabilities assumed. Given the preliminary state of the independent valuation work, certain estimates and assumptions have been made in the development of fair value information pertaining to certain assets acquired and liabilities assumed as documented in the notes to the unaudited pro forma consolidated condensed financial statements. The final
determination of the purchase price, fair values, goodwill and adjustments affecting pro forma operating results may differ significantly from what is reflected in these unaudited pro forma consolidated condensed financial statements.
The unaudited pro forma financial information is presented for informational purposes only and is not necessarily indicative of what our consolidated financial position or results of operations actually would have been had we completed the Acquisition at the dates indicated above. In addition, the unaudited pro forma financial information does not purport to project our future consolidated financial position or results of operations. We cannot assure you that the assumptions used by our management for the preparation of the unaudited pro forma financial information, which management believes are reasonable, will prove to be accurate.
The summary historical and pro forma financial information set forth in the following tables should be read in conjunction with our historical consolidated financial statements and related notes, incorporated by reference in this offering memorandum, and “Management’s discussion and analysis of financial condition and results of operations,” and “Unaudited pro forma consolidated condensed financial information,” each included elsewhere in this offering memorandum.
| Wolverine World Wide, Inc. | ||||||||||||||||||||||||||||
| Fiscal year | 24 Weeks ended | Trailing four quarters ended June 16, 2012 |
Pro forma trailing four quarters ended June 16, 2012 |
|||||||||||||||||||||||||
| 2011 | 2010 | 2009 | June 16, 2012 |
June 18, 2011 |
||||||||||||||||||||||||
|
|
||||||||||||||||||||||||||||
| (Dollars in thousands) |
(unaudited) | (unaudited) | ||||||||||||||||||||||||||
| Statement of operations data: |
||||||||||||||||||||||||||||
| Revenue |
$ | 1,409,068 | $ | 1,248,517 | $ | 1,101,056 | $ | 635,526 | $ | 641,012 | $ | 1,403,582 | $ | 2,465,570 | ||||||||||||||
| Cost of goods sold |
852,316 | 754,537 | 663,461 | 385,264 | 381,096 | 856,484 | 1,614,895 | |||||||||||||||||||||
| Restructuring and other transition costs(1) |
— | 1,406 | 5,873 | — | — | — | — | |||||||||||||||||||||
|
|
|
|
|
|
|
|
|
|
|
|
|
|
|
|||||||||||||||
| Gross profit |
556,752 | 492,574 | 431,722 | 250,262 | 259,916 | 547,098 | 850,675 | |||||||||||||||||||||
| Selling, general and administrative expenses |
386,534 | 347,499 | 316,378 | 190,451 | 177,080 | 399,905 | 659,286 | |||||||||||||||||||||
| Restructuring and other transition costs(1) |
— | 2,828 | 29,723 | — | — | — | — | |||||||||||||||||||||
|
|
|
|
|
|
|
|
|
|
|
|
|
|
|
|||||||||||||||
| Operating profit |
170,218 | 142,247 | 85,621 | 59,811 | 82,836 | 147,193 | 191,389 | |||||||||||||||||||||
| Other expenses (income): |
||||||||||||||||||||||||||||
| Interest expense |
1,395 | 571 | 494 | 814 | 462 | 1,747 | 60,942 | |||||||||||||||||||||
| Interest income |
(370 | ) | (184 | ) | (383 | ) | (66 | ) | (108 | ) | (328 | ) | (486 | ) | ||||||||||||||
| Other expense |
283 | (1,366 | ) | (182 | ) | 1,614 | 393 | 1,504 | 1,504 | |||||||||||||||||||
|
|
|
|
|
|
|
|
|
|
|
|
|
|
|
|||||||||||||||
| 1,308 | (979 | ) | (71 | ) | 2,362 | 747 | 2,923 | 61,960 | ||||||||||||||||||||
| Earnings before income taxes |
168,910 | 143,226 | 85,692 | 57,449 | 82,089 | 144,270 | 129,429 | |||||||||||||||||||||
| Income taxes |
45,623 | 38,756 | 23,780 | 5,955 | 22,246 | 29,332 | 11,725 | |||||||||||||||||||||
|
|
|
|
|
|
|
|
|
|
|
|
|
|
|
|||||||||||||||
| Wolverine World Wide, Inc. | ||||||||||||||||||||||||||||
| Fiscal year | 24 Weeks ended | Trailing four quarters ended June 16, 2012 |
Pro forma trailing four quarters ended June 16, 2012 |
|||||||||||||||||||||||||
| 2011 | 2010 | 2009 | June 16, 2012 |
June 18, 2011 |
||||||||||||||||||||||||
| (Dollars in thousands) |
(unaudited) | (unaudited) | ||||||||||||||||||||||||||
| Net earnings |
$ | 123,287 | $ | 104,470 | $ | 61,912 | $ | 51,494 | $ | 59,843 | $ | 114,938 | $ | 117,704 | ||||||||||||||
| Net loss attributable to non-controlling interests(3) |
— | — | — | (184 | ) | — | (184 | ) | (184 | ) | ||||||||||||||||||
|
|
|
|
|
|
|
|
|
|
|
|
|
|
|
|||||||||||||||
| Net earnings attributable to Wolverine World Wide, Inc. |
123,287 | $ | 104,470 | $ | 61,912 | $ | 51,678 | $ | 59,843 | $ | 115,122 | $ | 117,888 | |||||||||||||||
|
|
|
|
|
|
|
|
|
|
|
|
|
|
|
|||||||||||||||
| Balance sheet data (at period end): |
||||||||||||||||||||||||||||
| Cash and cash equivalents |
$ | 140,012 | $ | 150,400 | $ | 160,439 | $ | 156,627 | $ | 118,478 | $ | 156,627 | $ | 99,622 | ||||||||||||||
| Total assets |
851,652 | 786,575 | 712,076 | 892,321 | 833,497 | 892,321 | 2,649,397 | |||||||||||||||||||||
| Total debt |
11,515 | 1,034 | 1,615 | 28,000 | 20,539 | 28,000 | 1,275,000 | |||||||||||||||||||||
| Total liabilities |
273,002 | 242,678 | 230,043 | 263,710 | 239,234 | 263,710 | 2,053,894 | |||||||||||||||||||||
| Total stockholders’ equity |
578,650 | 543,897 | 482,033 | 628,611 | 594,263 | 628,611 | 595,503 | |||||||||||||||||||||
| Working capital(4) |
485,818 | 438,979 | 379,083 | 514,848 | 458,602 | 514,848 | 722,549 | |||||||||||||||||||||
| Statement of cash flows data: |
||||||||||||||||||||||||||||
| Net cash provided by (used in) operating activities |
$ | 78,814 | $ | 67,866 | $ | 168,609 | $ | 15,533 | $ | (19,719 | ) | |||||||||||||||||
| Net cash used in investing activities |
(22,583 | ) | (17,038 | ) | (22,303 | ) | (7,600 | ) | (10,592 | ) | ||||||||||||||||||
| Net cash provided by (used in) financing activities |
(62,317 | ) | (59,149 | ) | (79,244 | ) | 9,111 | (5,004 | ) | |||||||||||||||||||
| Other financial data: |
||||||||||||||||||||||||||||
| Depreciation and amortization |
$ | 15,907 | $ | 16,201 | $ | 17,621 | $ | 7,619 | $ | 7,555 | $ | 15,971 | $ | 38,071 | ||||||||||||||
| Capital expenditures |
(19,397 | ) | (16,370 | ) | (11,670 | ) | (4,678 | ) | (9,182 | ) | (14,893 | ) | (37,593 | ) | ||||||||||||||
| EBITDA(5) |
185,842 | 159,814 | 103,424 | 66,000 | 89,998 | 161,844 | 242,567 | |||||||||||||||||||||
| Adjusted EBITDA(5) |
217,418 | 190,777 | 163,854 | 91,725 | 105,453 | 203,690 | 295,487 | |||||||||||||||||||||
| Ratio of total debt to Adjusted EBITDA |
4.3x | |||||||||||||||||||||||||||
| Ratio of Adjusted EBITDA to interest expense |
4.9x | |||||||||||||||||||||||||||
|
|
||||||||||||||||||||||||||||
| (1) | On January 7, 2009, our Board of Directors approved a strategic restructuring plan designed to create significant operating efficiencies, improve our supply chain and create a stronger global platform. On October 7, 2009, we announced that two initiatives in our restructuring plan had been expanded to enable the consolidation of two domestic manufacturing facilities into one and to finalize realignment in certain of our product creation organizations. |
| (2) | Other expense (income) includes foreign exchange gains and losses on foreign exchange contracts used to hedge U.S dollar inventory purchases made by non-U.S wholesale operations and ticking fees associated with the unused portion of the New Credit Facility. |
| (3) | Represents minority interest income (loss) in joint ventures majority owned by Wolverine. |
| (4) | Working capital is defined as total current assets minus total current liabilities. |
| (5) | EBITDA, a measure used by management to evaluate operating performance, is defined as net earnings plus (i) interest expense, (ii) provision for income taxes and (iii) depreciation and amortization less (iv) interest income. Adjusted EBITDA is defined as EBITDA adjusted to exclude noncash items, unusual items and other items. EBITDA and Adjusted EBITDA are not recognized terms under GAAP and do not purport to be alternatives to net earnings as a measure of operating performance or to cash flows from operating activities as a measure of liquidity. We present EBITDA and Adjusted EBITDA because we believe EBITDA and Adjusted EBITDA are useful supplemental measures in evaluating the performance of our operating businesses and provide greater |
| transparency with respect to our results of operations. EBITDA and Adjusted EBITDA are used by our management, including our chief operating decision maker, to perform such evaluations. EBITDA and Adjusted EBITDA items should not be considered in isolation or as a substitute for net earnings or other statement of operations data prepared in accordance with GAAP. |
| We believe EBITDA facilitates company-to-company operating performance comparisons by backing out potential differences caused by variations in capital structures (affecting net interest expense), taxation, the age and book depreciation of facilities (affecting relative depreciation expense) and the amortization of intangibles, which may vary for different companies for reasons unrelated to operating performance. We believe Adjusted EBITDA also facilitates company-to-company operating performance comparisons by backing out those items in EBITDA as well as certain historical cost (benefit) items which may vary for different companies for reasons unrelated to operating performance. We further believe that EBITDA and Adjusted EBITDA are frequently used by securities analysts, investors and other interested parties in their evaluation of companies, many of which present EBITDA and Adjusted EBITDA measures when reporting their results. |
| EBITDA and Adjusted EBITDA have limitations as analytical tools, and you should not consider EBITDA and Adjusted EBITDA either in isolation or as substitutes for analyzing our results as reported under GAAP. Some of these limitations are: |
| • | these measures do not reflect changes in, or cash requirements for, our working capital needs; |
| • | these measures do not reflect our interest expense, or the cash requirements necessary to service interest or principal payments, on our debt; |
| • | these measures do not reflect our income tax expense or the cash requirements to pay our taxes; |
| • | these measures do not reflect historical cash expenditures or future requirements for capital expenditures or contractual commitments; |
| • | although depreciation and amortization are non-cash charges, the assets being depreciated and amortized will often have to be replaced in the future, and these EBITDA measures do not reflect any cash requirements for such replacements; and |
| • | other companies may calculate these EBITDA measures differently so they may not be comparable. |
Set forth below is a reconciliation of net earnings to EBITDA and Adjusted EBITDA.
| Wolverine World Wide, Inc. | ||||||||||||||||||||||||||||
| Fiscal year | 24 Weeks ended | Trailing four quarters ended June 16, 2012 |
Pro forma trailing four quarters ended June 16, 2012 |
|||||||||||||||||||||||||
| 2011 | 2010 | 2009 | June 16, 2012 |
June 18, 2011 |
||||||||||||||||||||||||
|
|
|
|
|
|
||||||||||||||||||||||||
| (Dollars in thousands) | (Unaudited) | (Unaudited) | ||||||||||||||||||||||||||
| Net earnings |
$ | 123,287 | $ | 104,470 | $ | 61,912 | $ | 51,678 | $ | 59,843 | $ | 115,122 | $ | 117,888 | ||||||||||||||
| Interest expense |
1,395 | 571 | 494 | 814 | 462 | 1,747 | 60,942 | |||||||||||||||||||||
| Interest income |
(370 | ) | (184 | ) | (383 | ) | (66 | ) | (108 | ) | (328 | ) | (486 | ) | ||||||||||||||
| Income taxes |
45,623 | 38,756 | 23,780 | 5,955 | 22,246 | 29,332 | 11,725 | |||||||||||||||||||||
| Depreciation and amortization |
15,907 | 16,201 | 17,621 | 7,619 | 7,555 | 15,971 | 52,498 | (a) | ||||||||||||||||||||
|
|
|
|||||||||||||||||||||||||||
| EBITDA |
$ | 185,842 | $ | 159,814 | $ | 103,424 | $ | 66,000 | $ | 89,998 | $ | 161,844 | $ | 242,567 | ||||||||||||||
| Non-cash pension expense |
17,502 | 16,286 | 15,891 | 12,948 | 8,078 | 22,372 | 23,372 | (b) | ||||||||||||||||||||
| Share-based compensation expense |
14,074 | 11,543 | 8,943 | 7,858 | 7,377 | 14,555 | 17,055 | (c) | ||||||||||||||||||||
| Restructuring and other transition costs |
— | 4,234 | 35,596 | — | — | — | — | (d) | ||||||||||||||||||||
| Cost related to the proposed acquisition of PLG |
— | — | — | 4,919 | — | 4,919 | — | (e) | ||||||||||||||||||||
| Gains on sales of assets outside ordinary course of business |
— | (1,100 | ) | — | — | — | — | — | (f) | |||||||||||||||||||
| Strategic review |
— | — | — | — | — | — | 1,408 | (g) | ||||||||||||||||||||
| Lease termination & other |
— | — | — | — | — | — | 926 | (h) | ||||||||||||||||||||
| Severance related to store closure |
— | — | — | — | — | — | 192 | (h) | ||||||||||||||||||||
| Non-recurring product recall expenses |
— | — | — | — | — | — | 3,371 | (i) | ||||||||||||||||||||
|
|
|
|||||||||||||||||||||||||||
| Subtotal |
$ | 217,418 | $ | 190,777 | $ | 163,854 | $ | 91,725 | $ | 105,453 | $ | 203,690 | $ | 288,891 | ||||||||||||||
| CBI corporate cost allocations adjustment |
— | — | — | — | — | — | 6,596 | (j) | ||||||||||||||||||||
| Adjusted EBITDA |
$ | 217,418 | $ | 190,777 | $ | 163,854 | $ | 91,725 | $ | 105,453 | $ | 203,690 | $ | 295,487 | ||||||||||||||
|
|
||||||||||||||||||||||||||||
| (a) | Consists of the combination of our and PLG’s depreciation and amortization expense, including the impact of the preliminary valuation of intangible assets acquired and the purchase price allocated to property, plant and equipment, net. |
| (b) | We have non-contributory, defined benefit pension plans covering a majority of our domestic employees. Our principal defined benefit pension plan provides benefits based on the employee’s years of service and final average earnings (as defined in the plan), while the other plan provides benefits at a fixed rate per year of service. |
| We have a Supplemental Executive Retirement Plan (the “SERP”) for certain current and former employees that entitles a participating employee to receive payments from us following retirement based on the employee’s years of service and final average earnings (as defined in the SERP). Under the SERP, the employees can elect early retirement with a corresponding reduction in benefits. We also have individual deferred compensation agreements with certain former employees that entitle them to receive payments from us for a period of fifteen to eighteen years following retirement. We maintain life insurance policies that are intended to fund deferred compensation benefits under the SERP and deferred compensation agreements. |
| PLG’s pension plan is a noncontributory defined benefit pension plan, which no longer accrues future benefits, that covers certain eligible PLG associates. Prior to the freezing of the plan, eligible PLG associates accrued pension benefits at a fixed unit rate based on the associate’s service and compensation. |
| Additional information pertaining to pension expense can be found in our audited and interim financial statements incorporated by reference in this offering memorandum and PLG’s audited and interim financial statements included elsewhere in this offering memorandum. |
| (c) | Consists of our and PLG’s share-based compensation expense. Additional information pertaining to share-based compensation expense amounts can be found in our audited and interim financial statements incorporated by reference in this offering memorandum, PLG’s audited and interim financial statements included elsewhere in this offering memorandum and in our proxy statements filed with the SEC. |
| (d) | On January 7, 2009, our Board of Directors approved a strategic restructuring plan designed to create significant operating efficiencies, improve our supply chain and create a stronger global platform. On October 7, 2009, we announced that two initiatives in our restructuring plan had been expanded to enable the consolidation of two domestic manufacturing facilities into one and to finalize realignment in certain of our product creation organizations. Additional information pertaining to restructuring related expense can be found in our audited and interim financial statements incorporated by reference in this offering memorandum. |
| (e) | This amount has been excluded from the pro forma combined net earnings amount. |
| (f) | In the fourth quarter of 2010, we sold our Wolverine Procurement assets, which resulted in a $1.1 million gain. |
| (g) | In 2011, CBI announced a review of strategic and financial alternatives to further enhance shareholder value. A portion of these costs were allocated to PLG. |
| (h) | In 2011, CBI announced, as part of its efforts to optimize the performance of its Stride Rite® store fleet, that it would close underperforming and low volume, non-strategic stores over the next three years resulting in lease termination costs, employee termination costs and other exit costs. |
| (i) | This adjustment reflects lost sales, returned goods and related expenses with respect to the voluntary recall of a product from the European marketplace by PLG. |
| (j) | Represents the cost difference between CBI corporate costs allocated to PLG for Finance, Human Resources, Legal, Administration, Information Technology and Consumer Insights and Wolverine’s projected costs for providing these same services. |
Summary historical financial information of the PLG Business
The following tables present summary historical combined financial information for the periods and as of the dates indicated. The summary historical combined financial information for fiscal years 2011, 2010 and 2009 is derived from, and qualified by reference to, the audited combined financial statements of the PLG Business included elsewhere in this offering memorandum. The summary historical combined financial information for the 26 weeks ended July 28, 2012 and July 30, 2011 and the trailing four quarters ended July 28, 2012 is derived from, and qualified by reference to, the unaudited combined financial statements of the PLG Business included elsewhere in this offering memorandum. The unaudited combined financial statements of the PLG Business have been prepared on the same basis as the audited combined financial statements of the PLG Business and, in our opinion, reflect all adjustments, consisting only of normal and recurring adjustments, necessary for a fair presentation of such financial statements in all material respects. The results for any interim period are not necessarily indicative of the results that may be expected for a full year or any future period.
The historical combined financial statements of the PLG Business reflect the amounts that have been “carved-out” from CBI’s consolidated financial statements prepared in accordance with GAAP and reflect assumptions and allocations made by CBI to depict the PLG Business on a stand-alone basis. As a result, the historical combined financial statements of the PLG Business included herein may not necessarily be indicative of the financial position, results of operations or cash flows of the PLG Business had it operated as a stand-alone entity during the periods presented.
We have derived the summary historical combined financial information for the trailing four quarters ended July 28, 2012 by combining the applicable financial data from the unaudited combined financial statements of the PLG Business for the 26 weeks ended July 28, 2012 with the applicable financial data from the audited combined financial statements of the PLG Business for the fiscal year ended January 28, 2012, less the applicable financial data from the unaudited combined financial statements of the PLG Business for the 26 weeks ended July 30, 2011. The summary historical financial information set forth in the following tables should be read in conjunction with the historical combined financial statements and related notes of the PLG Business and “Management’s discussion and analysis of financial condition and results of operations—Results of operations of the PLG Business,” each included elsewhere in this offering memorandum.
| 52 Weeks ended | 26 Weeks ended | Trailing four quarters ended July 28, 2012 |
||||||||||||||||||||||
| January 28, 2012 |
January 29, 2011 |
January 30, 2010 |
July 28, 2012 |
July 30, 2011 |
||||||||||||||||||||
|
|
||||||||||||||||||||||||
| (Dollars in thousands) |
(Unaudited) | (Unaudited) | ||||||||||||||||||||||
| Statement of operations data: |
||||||||||||||||||||||||
| Net sales |
$ | 1,019,254 | $ | 856,092 | $ | 732,291 | $ | 586,569 | $ | 543,836 | $ | 1,061,988 | ||||||||||||
| Cost of sales |
756,736 | 589,096 | 496,717 | 410,209 | 408,535 | 758,411 | ||||||||||||||||||
|
|
|
|||||||||||||||||||||||
| Gross margin |
262,518 | 266,996 | 235,574 | 176,360 | 135,301 | 303,577 | ||||||||||||||||||
| Selling, general and administrative expenses |
239,397 | 224,238 | 219,868 | 133,917 | 123,441 | 249,873 | ||||||||||||||||||
|
|
|
|||||||||||||||||||||||
| Operating profit |
23,121 | 42,758 | 15,706 | 42,443 | 11,860 | 53,704 | ||||||||||||||||||
| Interest expense |
23,073 | 31,654 | 41,088 | 9,299 | 12,375 | 19,997 | ||||||||||||||||||
| Interest income |
(44 | ) | — | (10 | ) | (114 | ) | — | (158 | ) | ||||||||||||||
| Loss on early extinguishment of debt |
— | 1,685 | 194 | — | — | — | ||||||||||||||||||
|
|
|
|||||||||||||||||||||||
| Net earnings (loss) before income taxes |
92 | 9,419 | (25,566 | ) | 33,258 | (515 | ) | 33,865 | ||||||||||||||||
| Expense (benefit) for income taxes |
(7,403 | ) | (2,390 | ) | (6,458 | ) | 2,908 | (4,861 | ) | 366 | ||||||||||||||
|
|
|
|||||||||||||||||||||||
| Net earnings (loss) |
$ | 7,495 | $ | 11,809 | $ | (19,108 | ) | $ | 30,350 | $ | 4,346 | $ | 33,499 | |||||||||||
|
|
|
|||||||||||||||||||||||
| 52 Weeks ended | 26 Weeks ended | Trailing four quarters ended July 28, 2012 |
||||||||||||||||||||||
| January 28, 2012 |
January 29, 2011 |
January 30, 2010 |
July 28, 2012 |
July 30, 2011 |
||||||||||||||||||||
|
|
||||||||||||||||||||||||
| (Dollars in thousands) |
(Unaudited) | (Unaudited) | ||||||||||||||||||||||
| Balance sheet data (at period end): |
||||||||||||||||||||||||
| Cash and cash equivalents |
$ | 7,452 | $ | 10,376 | $ | 8,730 | $ | 8,904 | $ | 11,464 | $ | 8,904 | ||||||||||||
| Total assets |
982,311 | 961,543 | 907,329 | 1,003,808 | 999,266 | 1,003,808 | ||||||||||||||||||
| Total liabilities |
771,900 | 776,822 | 878,646 | 790,416 | 779,714 | 790,416 | ||||||||||||||||||
| Total debt |
484,328 | 489,386 | 673,367 | 481,799 | 486,857 | 481,799 | ||||||||||||||||||
| Total Parent Company Equity (Deficit) |
210,412 | 184,722 | (28,684 | ) | 213,392 | 219,552 | 213,392 | |||||||||||||||||
| Working capital(1) |
235,345 | 181,305 | 139,774 | 240,110 | 236,673 | 240,110 | ||||||||||||||||||
| Statement of cash flows data: |
||||||||||||||||||||||||
| Cash flow provided (used in) by operating activities |
$ | 3,900 | $ | 7,800 | $ | 31,100 | $ | 37,100 | $ | (8,600 | ) | |||||||||||||
| Cash flow used in investing activities |
(23,700 | ) | (14,600 | ) | (12,000 | ) | (9,200 | ) | (9,700 | ) | ||||||||||||||
| Cash flow provided by (used in) financing activities |
20,100 | 9,600 | (12,700 | ) | (32,200 | ) | 21,300 | |||||||||||||||||
| Other financial data: |
||||||||||||||||||||||||
| Depreciation and amortization |
$ | 22,500 | $ | 25,600 | $ | 29,200 | $ | 10,900 | $ | 11,300 | $ | 22,100 | ||||||||||||
| Capital expenditures |
(22,900 | ) | (14,600 | ) | (12,000 | ) | (9,100 | ) | (9,300 | ) | (22,700 | ) | ||||||||||||
| EBITDA(2) |
45,621 | 66,673 | 44,712 | 53,343 | 23,160 | 75,804 | ||||||||||||||||||
| Adjusted EBITDA(2) |
78,369 | 73,958 | 51,806 | 58,819 | 59,650 | 85,201 | ||||||||||||||||||
|
|
||||||||||||||||||||||||
| (1) | Working capital is defined as total current assets minus total current liabilities. |
| (2) | EBITDA, a measure used by management to evaluate operating performance, is defined as net earnings (loss) plus (i) interest expense, (ii) provision for income taxes and (iii) depreciation and amortization less (iv) interest income. Adjusted EBITDA is defined as EBITDA adjusted to exclude noncash items, unusual items and other items. EBITDA and Adjusted EBITDA are not recognized terms under GAAP and do not purport to be alternatives to net earnings as a measure of operating performance or to cash flows from operating activities as a measure of liquidity. We present EBITDA and Adjusted EBITDA because we believe EBITDA and Adjusted EBITDA are useful supplemental measures in evaluating the performance of our operating businesses and provide greater transparency with respect to our results of operations. EBITDA and Adjusted EBITDA are used by our management, including our chief operating decision maker, to perform such evaluations. EBITDA and Adjusted EBITDA items should not be considered in isolation or as a substitute for net earnings or other statement of operations data prepared in accordance with GAAP. |
We believe EBITDA facilitates company-to-company operating performance comparisons by backing out potential differences caused by variations in capital structures (affecting net interest expense), taxation, the age and book depreciation of facilities (affecting relative depreciation expense) and the amortization of intangibles, which may vary for different companies for reasons unrelated to operating performance. We believe Adjusted EBITDA also facilitates company-to-company operating performance comparisons by backing out those items in EBITDA as well as certain historical cost (benefit) items which may vary for different companies for reasons unrelated to operating performance. We further believe that EBITDA and Adjusted EBITDA are frequently used by securities analysts, investors and other interested parties in their evaluation of companies, many of which present EBITDA and Adjusted EBITDA measures when reporting their results.
EBITDA and Adjusted EBITDA have limitations as analytical tools, and you should not consider EBITDA and Adjusted EBITDA either in isolation or as substitutes for analyzing PLG’s results as reported under GAAP. Some of these limitations are:
| • | these measures do not reflect changes in, or cash requirements for, PLG’s working capital needs; |
| • | these measures do not reflect PLG’s interest expense, or the cash requirements necessary to service interest or principal payments, on PLG’s debt; |
| • | these measures do not reflect PLG’s income tax expense or the cash requirements to pay PLG’s taxes; |
| • | these measures do not reflect historical cash expenditures or future requirements for capital expenditures or contractual commitments; |
| • | although depreciation and amortization are non-cash charges, the assets being depreciated and amortized will often have to be replaced in the future, and these EBITDA measures do not reflect any cash requirements for such replacements; and |
| • | other companies may calculate these EBITDA measures differently so they may not be comparable. |
| Set forth below is a reconciliation of net earnings to EBITDA and Adjusted EBITDA. |
| 52 Weeks ended | 26 Weeks ended | Trailing four quarters ended July 28, 2012 |
||||||||||||||||||||||
| January 28, 2012 |
January 29, 2011 |
January 30, 2010 |
July 28, 2012 |
July 30, 2011 |
||||||||||||||||||||
|
|
||||||||||||||||||||||||
| (Dollars in thousands) |
(Unaudited) | (Unaudited) | ||||||||||||||||||||||
| Net earnings |
$ | 7,495 | $ | 11,809 | $ | (19,108 | ) | $ | 30,350 | $ | 4,346 | $ | 33,499 | |||||||||||
| Interest expense |
23,073 | 31,654 | 41,088 | 9,299 | 12,375 | 19,997 | ||||||||||||||||||
| Interest income |
(44 | ) | (10 | ) | (114 | ) | (158 | ) | ||||||||||||||||
| Income taxes |
(7,403 | ) | (2,390 | ) | (6,458 | ) | 2,908 | (4,861 | ) | 366 | ||||||||||||||
| Depreciation and amortization |
22,500 | 25,600 | 29,200 | 10,900 | 11,300 | 22,100 | ||||||||||||||||||
|
|
|
|||||||||||||||||||||||
| EBITDA |
45,621 | 66,673 | 44,712 | 53,343 | 23,160 | 75,804 | ||||||||||||||||||
| Share-based compensation expense |
3,300 | 4,700 | 4,200 | 1,000 | 1,800 | 2,500 | (a) | |||||||||||||||||
| Pension expense |
500 | 900 | 2,700 | 800 | 300 | 1,000 | (b) | |||||||||||||||||
| Loss on early extinguishment of debt |
— | 1,685 | 194 | — | — | — | (c) | |||||||||||||||||
| Impairment of tangible assets |
4,063 | — | — | — | 4,058 | 5 | (d) | |||||||||||||||||
| Impairment of tradenames |
23,500 | — | — | — | 23,500 | — | (e) | |||||||||||||||||
| Lease termination |
807 | — | — | (8 | ) | — | 799 | (d) | ||||||||||||||||
| Severance related to store closures |
156 | — | — | 36 | — | 192 | (d) | |||||||||||||||||
| Strategic review |
420 | — | — | 988 | — | 1,408 | (f) | |||||||||||||||||
| Other |
2 | — | — | 120 | — | 122 | (d) | |||||||||||||||||
| Non-recurring product recall expenses |
— | — | — | 3,371 | — | 3,371 | (g) | |||||||||||||||||
|
|
|
|||||||||||||||||||||||
| Adjusted EBITDA |
$ | 78,369 | $ | 73,958 | $ | 51,806 | $ | 59,650 | $ | 52,818 | $ | 85,201 | ||||||||||||
|
|
||||||||||||||||||||||||
| (a) | Consists of PLG’s share-based compensation expense. Additional information pertaining to share-based compensation expense amounts can be found in PLG’s audited and interim financial statements included elsewhere in this offering memorandum. |
| (b) | PLG’s pension plan is a noncontributory defined benefit pension plan, which no longer accrues future benefits, that covers certain eligible PLG associates. Prior to the freezing of the plan, eligible PLG associates accrued pension benefits at a fixed unit rate based on the associate’s service and compensation. Additional information pertaining to pension expense can be found in PLG’s audited and interim financial statements included elsewhere in this offering memorandum. |
| (c) | The loss on early extinguishment of debt relates to the acceleration of deferred debt costs related to PLG’s term loan facility in proportion to the amounts extinguished. |
| (d) | In 2011, CBI announced, as part of its efforts to optimize the performance of its Stride Rite® store fleet, that it would close underperforming and low volume, non-strategic stores over the next three years resulting in lease termination costs, employee termination costs and other exit costs incurred by PLG. In addition, PLG recorded a non-cash asset impairment charge as a result of a decline in PLG’s retail business. |
| (e) | As a result of the decline in performance of PLG’s domestic retail businesses, PLG revised its financial projections related to certain tradenames and reporting units in the second quarter of 2011. These revisions indicated a potential impairment of intangible assets and, as such, PLG assessed the fair value of these items to determine if their book value exceeded their fair value. As a result of this assessment, PLG determined that the book value of certain indefinite-lived trademarks exceeded their fair value and PLG recognized a pre-tax impairment charge for its indefinite-lived trademarks. |
| (f) | In 2011, CBI announced a review of strategic and financial alternatives to further enhance shareholder value. A portion of these costs were allocated to PLG. |
| (g) | This adjustment reflects lost sales, returned goods and related expenses with respect to the voluntary recall of a product from the European marketplace by PLG. |