Attached files
| file | filename |
|---|---|
| 8-K - 8-K - LRR Energy, L.P. | a12-21860_18k.htm |
| EX-99.1 - EX-99.1 - LRR Energy, L.P. | a12-21860_1ex99d1.htm |
Exhibit 99.2
|
|
LRR Energy, L.P. Commodity Hedge Portfolio September 21, 2012 |
|
|
This presentation includes "forward-looking statements" — that is, statements related to future events. Forward-looking statements are based on the current expectations of LRR Energy and include any statement that does not directly relate to a current or historical fact. In this context, forward-looking statements often address expected future business and financial performance, and often contain words such as "may," "predict," "pursue," "expect," "estimate," "project," "plan," "believe," "intend," "achievable," "anticipate," "target," "continue," "potential," "should," "could" and other similar words. Forward-looking statements in this presentation relate to, among other things, LRR Energy’s expectations regarding future results, production volumes, lease operating expenses and capital expenditures. Actual results and future events could differ materially from those anticipated or implied in such statements. Forward-looking statements involve certain risks and uncertainties, and ultimately may not prove to be accurate. These risks and uncertainties include, among other things, a decline in oil, natural gas or NGL prices, the risk and uncertainties involved in producing oil and natural gas, competition in the oil and natural gas industry, governmental regulations and other factors. Actual results could differ materially from those anticipated or implied in the forward-looking statements due to the factors described under the captions "Risk Factors" in LRR Energy's Annual Report on Form 10-K for the year ended December 31, 2011 and LRR Energy's subsequent filings with the Securities and Exchange Commission. All forward-looking statements speak only as of the date of this presentation. LRR Energy does not intend to update or revise any forward-looking statements as a result of new information, future events or otherwise. All forward-looking statements are qualified in their entirety by this cautionary statement. Forward Looking Statements & Risk Factors |
|
|
Commodity Hedge Portfolio As of September 21, 2012 ~94% of current PDP is hedged through 2016 Assuming flat production1, total production is hedged 90% in 2012, 88% in 2013, 63% in 2014, 56% in 2015 and 51% in 2016 Average prices: $5.11 per MMBtu, $94.21 per oil barrel and $50.82 per NGL barrel Natural Gas Hedges NGL Hedges Crude Oil Hedges Note: Hedge prices based on weighted-average of swap prices, collar floor prices and put strike prices. Assumes production through 2016 remains constant at midpoint of 2012 guidance (6,250 Boe/d) and production mix of gas 60%, oil 30% and NGL 10%. ($/Mcf) 2H 2012 2013 2014 2015 2016 2017 Hedged Price $5.09 $5.10 $5.52 $5.71 $4.28 $4.54 0 2 4 6 8 10 2H 2012 2013 2014 2015 2016 2017 Production (Bcf) Hedged Volumes Production 90% 91% 72% 31% 65% 59% ($/Bbl) 2H 2012 2013 2014 2015 2016 Hedged Price $98.22 $95.19 $96.29 $94.49 $85.94 0 200 400 600 800 2H 2012 2013 2014 2015 2016 Production (MBbl) Hedged Volumes Production 91% 91% 67% 52% 58% Production (M Bbl) 0 50 100 150 200 250 82% 63% 2H2012 2013 2014 2015 2016 Hedged Volumes Production |

|
|
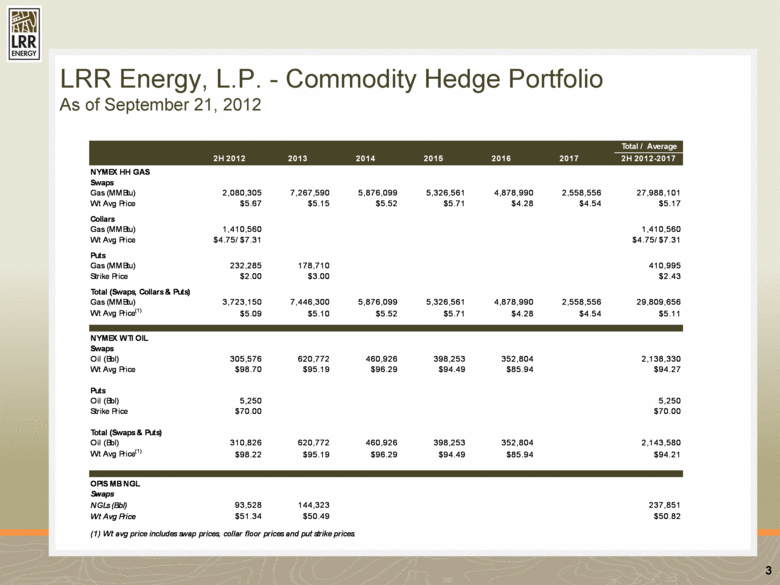
LRR Energy, L.P. - Commodity Hedge Portfolio As of September 21, 2012 2012 2013 2014 2015 2016 2017 Total / Average 2H 2012 2013 2014 2015 2016 2017 2H 2012-2017 NYMEX HH GAS Swaps Gas (MMBtu) 2,080,305 7,267,590 5,876,099 5,326,561 4,878,990 2,558,556 27,988,101 Wt Avg Price $5.67 $5.15 $5.52 $5.71 $4.28 $4.54 $5.17 Collars Gas (MMBtu) 1,410,560 1,410,560 Wt Avg Price $4.75/$7.31 $4.75/$7.31 Puts Gas (MMBtu) 232,285 178,710 410,995 Strike Price $2.00 $3.00 $2.43 Total (Swaps, Collars & Puts) Gas (MMBtu) 3,723,150 7,446,300 5,876,099 5,326,561 4,878,990 2,558,556 29,809,656 Wt Avg Price (1) $5.09 $5.10 $5.52 $5.71 $4.28 $4.54 $5.11 NYMEX WTI OIL Swaps Oil (Bbl) 305,576 620,772 460,926 398,253 352,804 2,138,330 Wt Avg Price $98.70 $95.19 $96.29 $94.49 $85.94 $94.27 Puts Oil (Bbl) 5,250 5,250 Strike Price $70.00 $70.00 Total (Swaps & Puts) Oil (Bbl) 310,826 620,772 460,926 398,253 352,804 2,143,580 Wt Avg Price (1) $98.22 $95.19 $96.29 $94.49 $85.94 $94.21 OPIS MB NGL Swaps NGLs (Bbl) 93,528 144,323 237,851 Wt Avg Price $51.34 $50.49 $50.82 (1) Wt avg price includes swap prices, collar floor prices and put strike prices. |