Attached files
| file | filename |
|---|---|
| EX-23.1 - EX-23.1 - MATTRESS FIRM HOLDING CORP. | a2211050zex-23_1.htm |
| EX-23.2 - EX-23.2 - MATTRESS FIRM HOLDING CORP. | a2211050zex-23_2.htm |
| EX-21.1 - EX-21.1 - MATTRESS FIRM HOLDING CORP. | a2211050zex-21_1.htm |
Use these links to rapidly review the document
TABLE OF CONTENTS
INDEX TO CONSOLIDATED FINANCIAL STATEMENTS
As filed with the Securities and Exchange Commission on September 19, 2012
Registration No. 333-
UNITED STATES
SECURITIES AND EXCHANGE COMMISSION
Washington, D.C. 20549
FORM S-1
REGISTRATION STATEMENT UNDER
THE SECURITIES ACT OF 1933
MATTRESS FIRM HOLDING CORP.
(Exact name of registrant as specified in its charter)
| Delaware | 5712 | 20-8185960 | ||
| (State or other jurisdiction of incorporation or organization) |
(Primary standard industrial classification code number) |
(I.R.S. employer identification number) |
||
5815 Gulf Freeway Houston, Texas 77023 (713) 923-1090 (Address, including zip code, and telephone number, including area code, of registrant's principal executive offices) |
||||
Kindel L. Elam
Vice President and General Counsel
Mattress Firm Holding Corp.
5815 Gulf Freeway
Houston, Texas 77023
(713) 923-1090
(Name, address, including zip code, and telephone number, including area code, of agent for service)
| Copies to: | ||
| Andrew J. Terry Ropes & Gray LLP 111 South Wacker Drive, 46th Floor Chicago, Illinois 60606 Telephone: (312) 845-1200 Facsimile: (312) 845-5500 |
Gene G. Lewis Charles L. Strauss Fulbright & Jaworski L.L.P. Fulbright Tower 1301 McKinney, Suite 5100 Houston, Texas 77010 Telephone: (713) 651-5151 Facsimile: (713) 651-5246 |
|
Approximate date of commencement of proposed sale to the public:
As soon as practicable after this registration statement becomes effective.
If any of the securities being registered on this form are to be offered on a delayed or continuous basis pursuant to Rule 415 under the Securities Act of 1933, check the following box. o
If this form is filed to register additional securities for an offering pursuant to Rule 462(b) under the Securities Act, check the following box and list the Securities Act registration statement number of the earlier effective registration statement for the same offering. o
If this form is a post-effective amendment filed pursuant to Rule 462(c) under the Securities Act, check the following box and list the Securities Act registration statement number of the earlier effective registration statement for the same offering. o
If this form is a post-effective amendment filed pursuant to Rule 462(d) under the Securities Act, check the following box and list the Securities Act registration statement number of the earlier effective registration statement for the same offering. o
Indicate by check mark whether the registrant is a large accelerated filer, an accelerated filer, a non-accelerated filer, or a smaller reporting company. See the definitions of "large accelerated filer," "accelerated filer" and "smaller reporting company" in Rule 12b-2 of the Exchange Act. (Check one).
| Large accelerated filer o | Accelerated filer o | Non-accelerated filer ý (Do not check if a smaller reporting company) |
Smaller reporting company o |
CALCULATION OF REGISTRATION FEE
|
||||||||
| Title of Each Class of Securities to be Registered |
Amount to be Registered(1) |
Proposed Maximum Offering Price Per Share(2) |
Proposed Maximum Aggregate Offering Price(2) |
Amount of Registration Fee |
||||
|---|---|---|---|---|---|---|---|---|
Common Stock, par value $0.01 per share |
5,435,684 | $32.28 | $175,463,880 | $20,109 | ||||
|
||||||||
- (1)
- Includes
shares to be sold upon exercise of the underwriters' over-allotment option to purchase additional shares of common stock. See
"Underwriting."
- (2)
- Estimated solely for purposes of calculating the amount of the registration fee. In accordance with Rule 457(c) of the Securities Act of 1933, as amended, the price shown is the average of the high and low selling prices of the Common Stock on September 13, 2012, as reported on the NASDAQ Global Select Market.
The registrant hereby amends this registration statement on such date or dates as may be necessary to delay its effective date until the registrant shall file a further amendment which specifically states that this registration statement shall thereafter become effective in accordance with Section 8(a) of the Securities Act of 1933 or until the registration statement shall become effective on such date as the Commission acting pursuant to said Section 8(a) may determine.
The information in this preliminary prospectus is not complete and may be changed. We may not sell these securities until the registration statement filed with the Securities and Exchange Commission is effective. This preliminary prospectus is not an offer to sell these securities and it is not soliciting offers to buy these securities in any jurisdiction where the offer or sale is not permitted.
Subject to Completion, dated September 19, 2012
PROSPECTUS
4,726,682 Shares

Common Stock
The selling stockholders named in this prospectus, which collectively hold a majority of our outstanding shares of common stock and certain of whom are management or affiliated with directors of our company, are selling 4,726,682 shares of our common stock. We will not receive any proceeds from the sale of our common stock by the selling stockholders.
Our common stock is listed on the NASDAQ Global Select Market under the symbol "MFRM." On September 18, 2012, the last sale price of our common stock as reported on the NASDAQ Global Select Market was $32.54 per share.
Investing in our common stock involves risks. See "Risk Factors" beginning on page 19 to read about factors you should consider before buying shares of our common stock.
| |
Per share |
Total | |||||
|---|---|---|---|---|---|---|---|
Public offering price |
$ | $ | |||||
Underwriting discounts and commissions |
$ | $ | |||||
Proceeds, before expenses, to the selling stockholders |
$ | $ | |||||
The selling stockholders identified in this prospectus have granted the underwriters a 30-day option to purchase up to an additional 709,002 shares of common stock on the same terms and conditions as set forth above if the underwriters sell more than 4,726,682 shares of common stock in this offering. See the section of this prospectus entitled "Underwriting." We will not receive any of the proceeds from the sale of shares by these selling stockholders if the underwriters exercise their option to purchase additional shares of common stock.
Neither the Securities and Exchange Commission nor any state securities commission has approved or disapproved of these securities or determined if this prospectus is accurate or complete. Any representation to the contrary is a criminal offense.
The underwriters expect to deliver the shares of common stock to investors on or about , 2012.
| Barclays | UBS Investment Bank | Citigroup |
| William Blair |
| KeyBanc Capital Markets | SunTrust Robinson Humphrey |
Prospectus dated , 2012

We have not authorized anyone to provide any information or to make any representations other than those contained in this prospectus or in any free writing prospectuses we have prepared. We take no responsibility for, and can provide no assurance as to the reliability of, any other information that others may give you. This prospectus is an offer to sell only the shares offered hereby, but only under circumstances and in jurisdictions where it is lawful to do so. The information contained in this prospectus is accurate only as of its date.
i
NOTE REGARDING TRADEMARKS AND SERVICE MARKS
We own or have rights to use the trademarks, service marks and trade names that we use in conjunction with the operation of our business. Some of the more important trademarks that we own or have rights to use that appear in this prospectus include "Mattress Firm®," "Comfort By Color®," "Mattress Firm Red Carpet Delivery Service®," "Hampton & Rhodes®," "YuMe™," "Mattress Firm SuperCenter®," "Happiness Guarantee™," "Replace Every 8®," "Save Money. Sleep Happy™," "Sleep Happy™," "Dream It's Possible™ ," "Side by side before you decide™," "Nobody Sells for Less, Nobody!™" and "All the best brands...All the best prices!®." Trademarks, trade names or service marks of other companies appearing in this prospectus are, to our knowledge, the property of their respective owners.
NOTE REGARDING MARKET AND INDUSTRY DATA
Industry and market data included in this prospectus were obtained from our own internal data, data from industry trade publications and groups (primarily Furniture Today and the International Sleep Products Association, or "ISPA"), consumer research and marketing studies and, in some cases, are management estimates based on industry and other knowledge and experience in the markets in which we operate. Our estimates have been based on information obtained from our suppliers, customers, trade and business organizations and other contacts in the markets in which we operate. We believe these estimates and the third party information mentioned above to be accurate as of the date of this prospectus.
In November 2011, we issued and sold 6,388,888 shares of common stock at a price of $19.00 per share in our initial public offering. Upon the completion of the initial public offering, our common stock became listed on the NASDAQ Global Select Market under the symbol "MFRM." In connection with the initial public offering, we effected a 227,058-for-one stock split on November 3, 2011. Unless otherwise indicated, all share data gives effect to the stock split.
ii
This summary highlights information contained elsewhere in this prospectus. This summary does not contain all of the information that you should consider before investing in our common stock. You should read the entire prospectus, including the more detailed information and the financial statements appearing elsewhere in this prospectus. Unless the context otherwise requires, the terms "Mattress Firm," "our company," "the Company," "we," "us," "our" and the like refer to Mattress Firm Holding Corp. and its consolidated subsidiaries. Unless otherwise indicated, (i) the term "our stores" refers to our company-operated stores and our franchised stores; (ii) when used in relation to our company, the terms "market" and "markets" refer to the metropolitan statistical area or an aggregation of the metropolitan statistical areas in which we or our franchisees operate; and (iii) the information provided in this prospectus assumes that the underwriters' over-allotment option is not exercised.
In this prospectus, we refer to earnings before interest, taxes, depreciation and amortization and other adjustments (such as goodwill impairment charges, loss on store closings and acquisition expenses), or "Adjusted EBITDA." Adjusted EBITDA is not a performance measure under accounting principles generally accepted in the United States, or "U.S. GAAP." See "—Summary Historical and Unaudited Pro Forma Consolidated Financial and Operating Data" for a definition of Adjusted EBITDA and a reconciliation of Adjusted EBITDA to net income.
We report on the basis of a 52- or 53-week fiscal year, which ends on the Tuesday closest to January 31. Each fiscal year is described by the period of the calendar year that comprises the majority of the fiscal year period. For example, the fiscal year ended January 31, 2012 is described as "fiscal 2011." Fiscal 2009, fiscal 2010 and fiscal 2011 each contained 52 weeks.
We are a leading specialty retailer of mattresses and related products and accessories in the United States. As of July 31, 2012, we and our franchisees operated 957 and 141 stores, respectively, primarily under the Mattress Firm® name, in 76 markets across 28 states. In 2011, we ranked first among the top 100 U.S. furniture stores for both growth in store count and percentage increase in sales and second in total sales among specialty retailers according to Furniture Today. Based on our analysis of information published to date in Furniture Today and Company data, which gives effect to our recent acquisitions, we believe that, among multi-brand mattress specialty retailers in the United States, we have the largest geographic footprint, the greatest number of stores nationwide and the highest net sales on an aggregate basis. We believe that, in our markets, Mattress Firm® is a highly recognized brand known for its broad selection, superior service and compelling value proposition. Based on our analysis of public store information for our competitors and our Company data, we believe more than 90% of our company-operated stores are located in markets in which we had the number one market share position as of July 31, 2012. Since our founding in 1986 in Houston, Texas, we have expanded our operations across four time zones, with the goal of becoming the premier national mattress specialty retailer.
We believe our destination retail format provides our customers with a convenient, distinctive and enjoyable shopping experience. Key highlights that make us a preferred destination and that differentiate our brand and services include our:
- •
- extensive product selection of the top name brands;
- •
- contemporary, easy-to-navigate store design utilizing our unique Comfort
By Color® merchandising approach that organizes mattresses by comfort style;
- •
- price, comfort and service guarantees;
1
- •
- superior customer service by our educated, extensively-trained and commissioned sales associates of whom over 93% are
full-time employees;
- •
- Mattress Firm Red Carpet Delivery Service®, which includes a
three-hour delivery window; and
- •
- highly visible and convenient store locations in major retail trade areas.
Our stores carry both a broad assortment of leading national mattress brands and our exclusive brands. With a wide range of styles, sizes, price points and unique features, we provide our customers with their choice of traditional mattresses, including Sealy, Stearns & Foster and Simmons, as well as specialty mattresses, such as Tempur-Pedic (for which we are the largest retailer in the United States), Serta's iComfort line and Sealy's Optimum line. We also offer a variety of bedding-related products and accessories.
We drive profitability in the markets in which we operate by penetrating a market with stores and leveraging fixed and discretionary costs, such as occupancy and advertising, as we gain sales volume, grow our brand presence and advance our operational scale. We have a proven track record of growing our store base through organic new store openings and acquisitions that typically include rebranding of the acquired stores to Mattress Firm®. In fiscal 2011, we generated net sales, Adjusted EBITDA and net income of $703.9 million, $87.5 million and $34.4 million, respectively. (Adjusted EBITDA is not a performance measure under U.S. GAAP. See "—Summary Historical and Unaudited Pro Forma Consolidated Financial and Operating Data" for a definition of Adjusted EBITDA and a reconciliation of Adjusted EBITDA to net income.) For the twenty-six weeks ended July 31, 2012, we generated net sales, Adjusted EBITDA and net income of $471.8 million, $55.0 million and $19.8 million, respectively. From February 4, 2009 to July 31, 2012, we added 493 stores, which included 269 stores added through strategic acquisitions. The majority of these additional stores were located in markets where we had existing stores, allowing us to increase our advertising spend per person and grow our net sales as well as Adjusted EBITDA at compound annual rates of 30.7% and 40.2%, respectively, while achieving 11 consecutive fiscal quarters of positive comparable-store sales growth through July 31, 2012.
We believe we have a compelling opportunity to further penetrate the fragmented specialty retail mattress industry through strategic acquisitions and continue profitable growth into the future. One example of this is our recent agreement to acquire substantially all of the operations and assets of Mattress XPress, Inc. and Mattress XPress of Georgia, Inc. (which entities operate Mattress X-Press stores), including 30 mattress specialty stores located primarily in South Florida and five stores in Georgia, states in which we operated 307 stores as of July 31, 2012.
Overall Market
We operate in the U.S. mattress retail market, in which net sales amounted to $11.4 billion in 2011, the most recent year for which industry retail sales data has been published. The market is highly fragmented, with no single retailer holding more than an 8% market share and the top ten participants accounting for less than 30% of the total market. According to Furniture Today, in 2011, mattress specialty retailers had a market share in excess of 43%, which represented the largest share of the market, having more than doubled their share over the past 15 years.
According to the information released in March 2012 by ISPA, the industry is expected to grow wholesale dollar sales by 7.2% in 2012. We believe that several trends support the positive outlook for long-term growth of the U.S. mattress retail market:
- •
- First, with increased advertising that focuses on the benefits of a better night's sleep, consumers have shown an increasing willingness to spend more money on mattresses and related products that are of a higher quality and provide extra comfort. The average price for a mattress at
2
- •
- Second, there have been recent technological improvements made to mattresses that are leading people to replace their old
mattresses. We believe Mattress Firm® is at the forefront of these technological changes, as demonstrated by the variety of specialty
mattresses we offer. Specialty product sales comprised 32.4%, 45.3% and 49.6% of our net sales for fiscal 2010, fiscal 2011 and the first half of fiscal 2012, respectively. Our growth in this area has
outpaced that of the mattress retail industry as a whole. For example, our sales of specialty products nearly doubled in fiscal 2011 over the prior year compared with an increase of only 30% in the
industry during the comparable period.
- •
- Third, as "baby boomers" (which refers in this prospectus to people born between 1946 to 1964) age and begin to spend the income that they have saved during their time in the workforce, it is our belief that they will spend a disproportionate amount compared to the overall population on products that improve their comfort—for example, luxury mattresses and related products.
wholesale has increased from $92 in 1990 to $259 in 2011, representing an average annual growth rate of 5%. This increasing price point trend is primarily the result of: (1) an industry shift towards specialty mattresses, such as foam and air mattresses, which were sold at wholesale for an average of $559 per mattress in 2011 compared to $210 for a traditional innerspring mattress and (2) consumers desiring more expensive innerspring mattresses that have enhanced technology and comfort features.
Distribution Channels
Wholesale. The U.S. wholesale mattress industry, which includes mattresses and their supporting box springs (also referred to as foundations), as tracked by ISPA, was a $6.3 billion market in 2011. The U.S. wholesale mattress segment (which excludes foundations) accounted for $5.0 billion of the total and has grown at an average annual rate of 6.0% since 1990. The mattress segment has historically experienced stable growth, as 2008-2009 was the only period in over 30 years during which the segment experienced a multi-year decline in mattress sales, as wholesale mattress sales dropped from $5.3 billion in 2007 to $5.0 billion in 2011. We believe that the industry has the potential to return to its pre-2008 levels, and that we are poised to take advantage of that future growth.
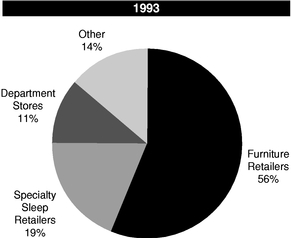
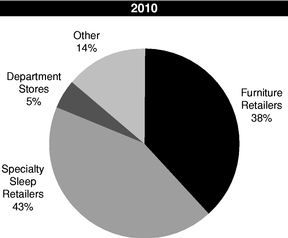
Retail. The U.S. retail mattress market is made up primarily of mattress specialty retailers, traditional furniture retailers and department stores. Retailers compete based on product selection, customer experience and service, price, store location and brand recognition.
- •
- Mattress Specialty Retailers focus primarily on mattresses and related
products and accessories and typically have a broader product selection and quicker availability as compared to other mattress retail channels. Consumers have shown a preference to purchase their
mattresses in this channel due to the broad merchandise assortment and higher quality service they receive. As a result, this channel has gained considerable market share relative to traditional
furniture stores and department stores, having experienced a market share increase from 19% in 1993 to 43% in 2010 (the most recent year for which retail distribution channel data has been published).
- •
- Traditional Furniture Retailers typically dedicate a majority of their
retail floor space to home furnishings other than mattresses. While this channel comprised the majority of the U.S. mattress retail industry prior to 1993, it has lost significant market share since
that time, decreasing from 56% in 1993 to 38% in 2010.
- •
- Department Stores include many of the larger national chains selling a
variety of products from clothing to home furnishings. Like traditional furniture stores, department stores have lost market share in the mattress category, decreasing from 11% in 1993 to 5% in 2010.
- •
- Other distributors of mattress products generally include big box retailers, warehouse clubs, catalogs, telemarketing, direct marketing, the internet, discount department stores, furniture
3
rental stores and factory direct operators. While the constituents within this category have shifted somewhat since 1993, their aggregate market share constituted approximately 14% in both 1993 and 2010.
Bedding Sales by Retail Distribution Channels
|
|
Source: Furniture Today
Brand Overview
There are nearly 500 manufacturers in the bedding industry, with the four largest manufacturers, Serta, Sealy, Simmons and Tempur-Pedic, representing approximately 66% of the dollar value of the mattress market in 2011 and the 15 largest manufacturers accounting for approximately 86% during the same period. In general, the bedding industry has faced little competition from imported products as a result of the short lead times required by mattress retailers, high shipping costs and relatively low direct labor expenses in mattress manufacturing. Manufacturers sell traditional innerspring products and specialty products across a wide range of styles, sizes, price points and technologies. While conventional mattresses still accounted for approximately 70% of total bedding sales by manufacturers in the United States in 2011, in recent years, specialty mattresses, which use foam and air technology, have grown at a much faster rate than the industry as a whole. In 2011, specialty bedding producer Tempur-Pedic accounted for approximately 14% of total bedding sales. As new research emerged showing the link between proper sleep and good health, Mattress Firm® responded to the growing demand for specialty mattresses by expanding its product selection.
Although the retail bedding industry in the United States is highly competitive and we may face intense competition in the future that could impact our planned growth and results of operations, we believe the following competitive strengths differentiate us from our competitors and favorably position us to execute our growth strategy:
Distinctive retail format. We believe our proven and effective operating model combines broad selection, superior customer service by educated, extensively-trained associates, a compelling value proposition and highly visible and convenient store locations, resulting in a unique shopping experience at an attractive store destination. The key attributes of the Mattress Firm® experience include:
- •
- Extensive and differentiated product assortment. We offer an extensive assortment of mattresses and related products and accessories, making us a preferred choice for our customers. The breadth of our merchandise offering includes a wide range of comfort choices, styles, sizes and price points. Furthermore, we focus our offering on the best known national brands, providing
4
- •
- Contemporary, easy-to-navigate store
layout. We implemented our unique Comfort By Color® merchandising approach
that groups all of our mattresses into distinct comfort categories, each represented by its own color, to help simplify the purchasing decision for customers. As stores adopted the Comfort By Color®
approach, we observed favorable customer responses. We have converted substantially all of our company-operated stores,
including those acquired in the Mattress Giant acquisitions, to this merchandising format and expect to convert the Mattress X-Press stores that we plan to acquire to this merchandising
format during the fourth quarter of fiscal 2012.
- •
- Compelling customer value proposition. Our compelling
price and value proposition is a critical element of our merchandising strategy. With our low price guarantee, we promise to beat the lowest advertised price on a comparable product by 10% at any time
up to 100 days after purchase and refund the customer the difference. Our Happiness Guarantee™ policy enables our customers to return
their mattress for a full refund within 100 days of purchase if they are not fully satisfied with their product. Our consumer financing options, which are provided by third party financial
institutions and are non-recourse to us, are also an important element of our service and value proposition. We believe that these services and guarantees build lasting trust and loyalty
with our customers and lead to better ticket average, conversion rates and customer referrals.
- •
- Strong customer service. We believe we enhance our
customers' shopping experience with a superior level of service. Our educated, extensively-trained sales associates are required to participate in a comprehensive, on-going training
program that we believe exceeds industry standards. We have implemented performance-monitoring programs to ensure that our sales associates are customer-focused and are effectively educating our
customers on the various features and benefits of our products. As of September 7, 2012, over 93% of our sales associates were full-time employees, supporting our goal of hiring
highly motivated, career-oriented individuals. Our sales associates receive a significant portion of their compensation in the form of commissions, which aligns their goals with those of our company.
Another key element of our industry-leading customer service is our Mattress Firm Red Carpet Delivery Service®, through which we offer a
three-hour guaranteed delivery window and same-day delivery, which we believe is distinctive in the industry.
- •
- Attractive, highly visible and convenient store locations. We have a dedicated and disciplined real estate team that helps us select store locations that are convenient to our target customers, are generally highly visible from the road and have high impact signage opportunities. A typical Mattress Firm® location is a freestanding or "end-cap" (corner) location in a high-traffic shopping center in a major retail trade area. We believe that our stores have a distinctive and fresh feel that is inviting to our customers.
our customers the choice of conventional mattresses, such as Sealy, Stearns & Foster and Simmons, as well as specialty mattresses, such as Tempur-Pedic (for which we are the largest retailer in the United States), Serta's iComfort line and Sealy's Optimum line. In addition to the best-known national brands, we also offer our Hampton & Rhodes® private label mattresses to provide our customers with a broad range of value choices and YuMe™, our exclusive, proprietary brand with heating and cooling technology. We have a dedicated retail concepts team that focuses on creating new products and accessories that are exclusive to our company. Our strong vendor relationships and product development capabilities enable us to offer our customers many products with exclusive features and allow us to maintain a competitive advantage while offering a compelling value proposition to our customers.
Economies of scale and strong market share positions in key markets. We operate in 76 markets across 28 states through company-operated or franchised stores. In 2011, we ranked second in total
5
sales among mattress specialty retailers, according to Furniture Today. Based on our analysis of information published in Furniture Today and Company data, which gives effect to our recent acquisitions, we believe that, among multi-brand mattress specialty retailers in the United States, we now have the largest geographic footprint, the greatest number of stores nationwide and the highest total sales on an aggregate basis. We believe our strong market share positions and economies of scale provide us with a number of competitive advantages, including:
- •
- Strong supplier relationships. Given our significant
scale and the scope of our retail network, we are a very important customer for many of the leading vendors. This includes both traditional mattress product brands, including Sealy, Stearns &
Foster and Simmons, as well as specialty mattress brands, such as Tempur-Pedic (for which we are the largest retailer in the United States). We believe that the strength of our supplier relationships
enables us to source our merchandise in a more cost-effective manner than our mattress specialty retailer competitors, as well as receive higher vendor incentives and advertising support.
Importantly, we believe that our significant scale gives us priority access to a wide range of styles and sub-brands and enables us to develop and source our private label and proprietary
brands cost-effectively.
- •
- Strong landlord relationships. We have developed strong relationships with real estate developers and landlords across the country due to our extensive store network and strong operating performance. We believe that our history and size position us favorably compared to our mattress specialty retailer competitors, as real estate companies prefer to lease to large, well-capitalized and established retailers.
Highly attractive and scalable economic model. We are able to leverage our strong brand awareness, our local marketing campaigns and our regional administrative and supervisory professionals as we increase the number of stores within our existing and surrounding markets. A new store averages approximately 5,200 square feet in size and typically requires an upfront net capital investment in the average amount of approximately $200,000, consisting of gross capital expenditures of approximately $257,000, less tenant improvement allowances received from our landlords of approximately $80,000, and our investment in inventory floor samples of approximately $23,000. We typically recoup our initial net capital investment from the store's 4-wall profitability in its first year of operations.
We measure store 4-wall profitability based on store revenues, store product costs and all direct costs of operating the store. We expect new stores to generate on average approximately $1.1 million of net sales in the first twelve months of operations and approximately $1.3 million in the second twelve months. We expect 4-wall profitability that averages approximately 30% of sales for each of the first two years, with results in the first year that are inclusive of funds received from vendors upon the opening of a new store.
Market-level profitability represents the aggregation of 4-wall profitability and the addition of costs that are incurred and managed at the market level, consisting primarily of advertising, warehousing and market-level management and overhead. We strive to grow our market-level profitability by gaining market share in a given market primarily through the addition of stores, which provides the scale to support increased advertising investment while also improving leverage over other market-level costs. In markets where we believe we have the highest level of penetration (markets where we have at least one store for every 90,000 people), our weighted average EBITDA margin and weighted average sales per store were approximately 21% and $1.3 million, respectively, for fiscal 2011. During this same period, our weighted average EBITDA margin and weighted average sales per store, with respect to our Mattress Firm® stores located in markets in which we have operated for over a year, were approximately 17% and $1.1 million, respectively. Therefore, as our level of penetration in our other markets increases, we expect to see an increase in EBITDA margin and sales per store in those markets.
6
Additionally, we expect the profitability of new markets to be initially lower than more mature markets, with improvement to a comparable level of a mature market over a two to three year period. A new market typically requires a dedicated distribution center within the first two years of operation, which averages approximately 20,000 to 30,000 square feet in size and requires an upfront net capital investment of approximately $20,000 to $60,000. We believe that our new store economic model and our infrastructure, which give us the ability to add new stores, to enter new markets and to improve market-level results, are distinctive in the industry.
Efficient fulfillment model with lower working capital requirements. We currently operate 45 distribution centers that service all of the markets in which we have company-operated stores. Most of our mattress suppliers deliver to most of our distribution centers within 48 hours following our placement of a purchase order, which enables us to maintain reasonable inventory levels but still offer our customers a three-hour delivery window as a feature of our Mattress Firm Red Carpet Delivery Service®. Furthermore, we typically receive payment from our customers in advance of paying suppliers, which further minimizes our working capital requirements and results in a highly attractive cash flow model.
Experienced management team. Our experienced senior management team has an average of 16 years of experience with Mattress Firm® and an average of 26 years of experience in the retail and mattress industries. Steve Stagner, our President and Chief Executive Officer, has over 20 years of experience in the mattress industry and originally was a top-performing Mattress Firm® franchisee before Mattress Firm® purchased his company in December 2004. Steve Fendrich, our Chief Strategy Officer, was a co-founder of Mattress Firm® and has 26 years of experience in the mattress industry across various retail and wholesale companies (most recently as chief executive officer at Simmons, one of our largest vendors), including 19 years of experience with Mattress Firm®. Jim Black, our Chief Financial Officer, has 12 years of experience with Mattress Firm® and 20 years of public accounting experience at two leading national accounting firms.
We believe our management's breadth of experience in the industry has enabled us to anticipate and respond effectively to industry trends and competitive dynamics while driving superior customer service and cultivating long-standing relationships with our vendors.
Proven track record of strong financial performance. We have a proven track record of success, even in challenging economic environments, as evidenced by 11 consecutive fiscal quarters of positive comparable-store sales growth through July 31, 2012. Over the most recent recessionary period, our management team demonstrated an ability to outperform the industry, with Mattress Firm® being the only leading mattress specialty retail brand to avoid a sales decline in 2009, versus the average leading mattress specialty retailer decline of 9.6%, according to Furniture Today. Our flexible financial model allows us to manage discretionary operating expenses through slower sales periods.
We seek to enhance our position as a leading specialty retailer of mattresses and related products and accessories with the goal of driving profitable sales growth and becoming the premier national specialty retailer. To achieve these objectives, we plan on executing the following key strategies:
Expand our company-operated store base. The highly fragmented U.S. retail mattress market provides us with a significant opportunity to expand our store base. From February 4, 2009 to July 31, 2012, we grew our store base by 106% by adding 493 company-operated stores through a combination of new store openings and acquisitions. More specifically, during this period, we opened 286 new stores, including 106 new stores in fiscal 2011 and 57 new stores in the twenty-six weeks ended July 31, 2012, and acquired 269 stores, including 55 stores acquired in fiscal 2011 and 181 stores acquired in the twenty-six weeks ended July 31, 2012. During this same period, we closed 62 stores in the ordinary
7
course as we took opportunities to reposition underperforming stores. Since February 4, 2009, stores we have acquired include 13 stores that were Mattress Firm® franchised locations. As of July 31, 2012, we operated 957 company-operated stores. We plan to continue to expand our store base through a combination of new stores and acquisition opportunities in both existing and new markets, such as the 35 stores that we expect to acquire through the Mattress X-Press acquisition. We estimate that, based on our historical experience, the competitive landscape and a market penetration rate of one Mattress Firm® store per 80,000 to 100,000 in population, we could operate over 2,500 Mattress Firm® store locations in the United States. We believe that attractive opportunities in the real estate market will help us execute our expansion strategy.
- •
- New and existing markets. We continually research and
survey the geographic landscape and have highlighted several markets with characteristics that we believe are attractive opportunities to gain leading market share and strong profitability over a
reasonable time period. Outside of our existing markets, there are many markets that we believe we can enter. We plan to open at least 100 new company-operated stores in fiscal 2012 and, if we
accomplish this plan and complete the Mattress X-Press acquisition, by the end of fiscal 2012, we will operate at least 1,000 stores nationwide—more than doubling the number of
our company-operated stores existing at the beginning of fiscal 2009. In addition, we will seek to strengthen our relative market share with the goal of achieving the number one position in each of
our markets. Given our highly attractive new store economic model and our improving market level profitability as we continue to open stores, we believe we are well-positioned to expand our presence
and achieve economies of scale across regions.
- •
- Acquisition opportunities. We have a strong track record over the last decade of supplementing our organic growth through acquisitions by acquiring retail mattress chains on an opportunistic basis. Most recently, since 2010, we have acquired an aggregate of 269 store locations, including 13 former franchisee-operated locations, through four separate transactions, including the acquisition of MGHC Holding Corporation (the entity that operated former Mattress Giant stores) in May 2012, and plan to acquire 35 Mattress X-Press stores before the end of the third quarter of fiscal 2012. We acquire mattress specialty retailers that we believe further strengthen our position in an existing market or that accelerate our penetration and achieve a desired market share in a new market. Given our established infrastructure and track record, we believe that we can acquire retailers, integrate them, implement our operating model and generate synergies. Additionally, as we revitalize and rebrand acquired stores as Mattress Firm®, we expect to see an increase in sales growth as these stores benefit from our greater advertising efforts and overall presence in the market. For example, in November 2011, we acquired 55 Mattress Giant stores in three markets: Minneapolis, Atlanta and St. Louis. At the time of the acquisition, we operated 68 stores in these markets. We completed the rebranding of these former Mattress Giant stores during the first quarter of fiscal 2012 and have observed year-over-year sales growth for these stores in excess of 50% for the thirteen weeks ended July 31, 2012 as compared to the thirteen weeks ended August 2, 2011. Over the same period, our company-operated stores in these markets have generated comparable-store sales growth of approximately 16%.
Increase sales and profitability within our existing network of stores. Our strategy is to drive comparable-store sales growth within our existing portfolio of stores by:
- •
- Increasing customer traffic. Consistent with our expectations, as we have increased our presence in a market and deployed additional advertising, we have observed an increase in customer traffic and sales in stores where we track customer traffic levels during fiscal 2011 and the twenty-six weeks ended July 31, 2012. Further, we will continue to undertake advertising and marketing initiatives that are aimed at efficiently and effectively improving our customer traffic. One example of this strategy is our marketing campaign designed to educate consumers on the recommended replacement cycle of a mattress. With an average mattress life across the industry
8
- •
- Improving customer conversion. We will continue to focus
on the training of our sales associates, who are our primary points of contact with our customers. In addition, we continually strive to improve our merchandising approach so that the customer
shopping experience is optimized. An example of our merchandising improvements is our Comfort By Color® initiative that has been introduced
to substantially every company-operated store in our network, including the recently acquired former Mattress Giant stores. We believe our continued improvements in customer service and merchandising
will lead to improved customer conversion in the future.
- •
- Increasing the average sales price of a transaction. Through effective sales techniques and the increasing demand for specialty mattresses, we expect the average price of a customer transaction to increase over time. We have strategically focused and built a strong market position in the specialty mattress category and are well-positioned to capture increasing sales and profitability as this category continues to demonstrate attractive growth rates.
exceeding 10 years, our campaign has focused on the health benefits of replacing a mattress after eight years. This campaign has successfully fostered our brand awareness and driven increased customer traffic into our stores.
As a result of our established infrastructure within our existing markets, improvements in comparable-store sales should drive expansion in our operating profit margins over time. In addition, we will continue to focus on improving the efficiencies of our information systems and distribution infrastructure, which should further benefit our operating margins.
Continue to target additional channels of distribution and expand our proprietary product offering. We seek alternative distribution channels to further leverage our core competencies, enhance the Mattress Firm® brand and increase our market presence. For example, our website, www.mattressfirm.com, features our full line of products and provides useful information to consumers on the features and benefits of our products, store locations and hours of operation. We offer on-line shopping with nationwide delivery. In the first two quarters of fiscal 2012, our total sales that were generated on-line increased 131% over the comparable period in fiscal 2011. We also use the internet as an important customer information resource to drive in-store purchases. In addition, we have created a new temporary "pop-up" store format that we introduced at various special event venues, including state fairs, home and garden shows, conventions and rodeos. We expect to drive additional growth through alternative distribution channels in the future.
We believe another strong growth avenue for Mattress Firm® is to partner with manufacturers to create innovative proprietary products to further differentiate us from our competition. An example is our exclusive brand, YuMe™, our proprietary temperature-controlled mattress, which was introduced in 2010. YuMe™, which was created through a partnership among Mattress Firm®, Amerigon Inc. and Sleep Inc., is a proprietary concept that allows the individual to control the sleep surface temperature on each side of the mattress.
Selectively expand our franchise network. Our franchise program is a low cost, high return model for us to expand our store footprint and leverage the Mattress Firm® brand name. We partner with qualified franchisee operators to open stores in markets where we do not currently plan to operate. After our franchisee partners achieve a sufficient and sustainable market share position in a particular market, we may negotiate with them to repurchase their stores, which we believe is a viable, efficient and productive approach to entering certain markets. We include buyback options in our franchise agreements, where appropriate, and maintain the right of first refusal over any sale of stores by a franchisee. Throughout our history as a company, the acquisition of our franchises from time to time has played a significant role in furthering our strategic growth and we expect that such opportunities will continue to be advantageous in the future.
9
Recent and Pending Acquisitions
On May 2, 2012, we acquired all of the equity interests of MGHC Holding Corporation, which operated Mattress Giant stores, for approximately $44.0 million in cash, subject to customary post-closing adjustments. Prior to this transaction, we acquired 55 Mattress Giant stores in the Minneapolis, Atlanta and St. Louis markets in November 2011, and have completed the integration of those stores. In connection with the closing of the May acquisition, we acquired 181 additional Mattress Giant specialty retail stores in Texas and Florida, which represent the two largest states in which Mattress Firm® currently operates. The stores are located in seven metropolitan markets including Miami, Naples/Ft. Myers, Orlando, Tampa and Jacksonville in Florida and Houston and Dallas in Texas, representing markets where we operated Mattress Firm® stores prior to the acquisition. As of July 31, 2012, we operated a total of 493 company-operated stores in Texas and Florida, including the former Mattress Giant stores. By the end of fiscal 2012, we expect to complete the rebranding of the former Mattress Giant stores that were acquired in May 2012.
On September 4, 2012, we entered into an agreement to acquire substantially all of the operations and assets of Mattress XPress, Inc. and Mattress XPress of Georgia, Inc. (which entities operate Mattress X-Press stores), including 30 mattress specialty stores located primarily in South Florida and five stores in Georgia, for approximately $15.8 million, subject to customary purchase price adjustments. The closing of the transaction is expected to occur in the third fiscal quarter of 2012 and remains subject to the prior satisfaction of customary closing conditions. We currently operate stores in South Florida and Georgia and intend to rebrand the Mattress X-Press stores as Mattress Firm® within one month of closing. As a result, we expect to see the benefits of future advertising on all Mattress Firm® stores in these markets. The average sales per store of the Mattress X-Press stores are comparable to the Company's overall average for Mattress Firm® stores nationwide.
As part of our business strategy, we continue to evaluate potential acquisition opportunities that are or may become available to us and may pursue such opportunities that support our strategic growth plan from time to time.
Risks Associated with Our Business
While we believe our company benefits from the competitive strengths and market opportunities described above, our ability to successfully operate our business and execute our business strategy is subject to numerous risks. You should carefully consider all of the information set forth in this prospectus and, in particular, you should evaluate the risk factors in the "Risk Factors" section of this prospectus before deciding whether to invest in our common stock. Risks relating to our business and our ability to successfully execute our business strategy, include, but are not limited to, the following:
- •
- Our business is directly impacted by general economic conditions and discretionary spending by our customers. If there is
a deterioration of the economy or financial markets and consumer confidence or ability or willingness to spend remains low, our sales and results of operations could be negatively impacted.
- •
- We operate in a highly competitive industry and there is no assurance that we will be able to continue to effectively
compete with our competitors, some of which have substantially greater financial and other resources than us. As the barriers to entry into the retail bedding market are relatively low, new or
existing bedding retailers could enter our markets and increase the competition we face. Any of the developments described above could have a material adverse effect on our planned growth and future
results of operations.
- •
- Our central long-term objective is to increase sales and profitability through market share leadership. Our aggressive expansion plans (including our plan to open at least 100 new
10
- •
- obtain sufficient financing;
- •
- secure favorable store locations;
- •
- advertise in an effective and cost-efficient manner;
- •
- achieve operating results in new stores at the same level as our similarly situated current stores;
- •
- attract a strong customer base in the new markets that we enter as well as additional customers in the current markets in
which we operate;
- •
- successfully compete with established mattress retailers in the markets where our new stores will be located;
- •
- effectively manage our personnel and other resources, which may become overextended during expansion periods; and
- •
- obtain a waiver or amendment to our credit facility to revise the limitation on capital expenditures.
company-operated stores in fiscal 2012 and our currently planned acquisition) will require us to overcome various uncertainties and challenges, including those relating to our ability to:
- •
- We rely on four main suppliers for acquiring the majority of our branded inventory. Because of the large volume of our
business with these manufacturers and our use of their branding and marketing initiatives, our success depends on our continued relationship with, and the reputation and popularity of, these
manufacturers. A deterioration of our relationship with these manufacturers, a reduction in vendor incentives or a dilution of their brands could result in reduced sales and operating results of our
company.
- •
- The successful operation of our business depends on retention of key employees. Therefore, losing one or more of these key
employees could impair our ability to effectively run our business.
- •
- We have a substantial amount of debt, the terms of which limit our ability to obtain additional financing. Our
indebtedness could make us vulnerable to adverse economic and industry conditions and could place us at a competitive disadvantage compared to competitors with less debt.
- •
- If we determine that our goodwill or other acquired intangible assets are impaired, we may have to write off all or a
portion of the impaired assets. As of July 31, 2012, we had goodwill and intangible assets, net of accumulated amortization, of $331.8 million and $90.1 million, respectively. In
fiscal 2007 and fiscal 2008, as a result of the global economic crisis, we incurred goodwill and intangible impairments totaling $43.6 million and $105.0 million, respectively.
Additionally, we recorded an impairment charge of $0.5 million in fiscal 2010 related to two reporting units. We may incur goodwill and intangible asset impairments in the future, which may
have a material adverse effect on our business, results of operations and financial condition.
- •
- Historically, we have experienced significant losses on store closings and impairment of store assets. In fiscal 2009, fiscal 2010 and fiscal 2011, we experienced losses on store closings and impairment of store assets of $5.2 million, $2.5 million and $0.8 million, respectively. There can be no guarantee that we will not experience similar or greater losses of this kind in the future
There can be no assurance that we will be able to successfully overcome the uncertainties and challenges relating to our growth, including those described above. If we fail to successfully manage the challenges that our planned growth poses, our net sales and profitability could be materially adversely impacted.
11
due to general economic conditions, competitive or operating factors or other reasons, which may have a material adverse effect on our results of operations. In addition, if we are unsuccessful in our expansion strategy and close a large number of stores, the risk of incurring losses on store closings may increase.
The risks described above and other risks we face are described in further detail under the "Risk Factors" section of this prospectus, which you should carefully review.
Corporate Information
Mattress Firm Holding Corp. was incorporated in Delaware on January 5, 2007 and commenced operations on January 18, 2007 through the acquisition of Mattress Holding Corp., or "Mattress Holding." Mattress Holding acquired the Mattress Firm® retail operations on October 18, 2002 and, together with its subsidiaries, owns substantially all of the assets and conducts the operations of our retail business. Mattress Firm® commenced operations in 1986 through a predecessor entity.
Our principal executive offices are located at 5815 Gulf Freeway, Houston, TX 77023 and our telephone number at that address is (713) 923-1090. Our internet address is www.mattressfirm.com. Please note that any references to www.mattressfirm.com in this prospectus are inactive references only and that our website, and the information contained on our website, is not part of this prospectus.
Related Transactions
Immediately prior to our initial public offering, Mattress Holdings, LLC, a Delaware limited liability company, held 100% of our issued and outstanding shares of common stock. As of the date of this prospectus, Mattress Holdings, LLC holds 22,399,952 shares, which represents 66.3% of our issued and outstanding shares of common stock. In connection with this offering, Mattress Holdings, LLC will be dissolved and the shares of our common stock held by it will be distributed to its unitholders, which include members of management and investment funds. Certain of the unitholders of Mattress Holdings, LLC are the selling stockholders referenced in this prospectus. For more information, please see "Principal and Selling Stockholders."
12
Common stock offered by the selling stockholders |
4,726,682 shares | |
Selling stockholders |
The selling stockholders in this offering include (i) funds associated with Neuberger Berman Group, LLC, which collectively beneficially owned approximately 8.98% of our outstanding common stock as of September 19, 2012; (ii) funds associated with J.W. Childs Associates, L.P. ("J.W. Childs"), which collectively beneficially owned approximately 59.92% of our outstanding common stock as of September 19, 2012 and are affiliated with directors of our company; and (iii) certain members of management. See "Principal and Selling Stockholders." |
|
Over-allotment shares |
Up to 709,002 shares |
|
Use of proceeds |
We will not receive any of the proceeds from the sale of shares of common stock by the selling stockholders but will be paying certain expenses related to this offering. See "Use of Proceeds." |
|
Risk factors |
You should read carefully the "Risk Factors" section beginning on page 19 of this prospectus for a discussion of factors that you should consider before deciding to invest in shares of our common stock. |
|
NASDAQ Global Select Market symbol |
"MFRM" |
|
Certain U.S. federal income and estate tax considerations for non-U.S. holders of common stock |
For a discussion of certain U.S. federal income and estate tax considerations that may be relevant to certain Non-U.S. Holders (as defined therein), please read "Certain U.S. Federal Income and Estate Tax Considerations for Non-U.S. Holders of Common Stock" beginning on page 129. |
13
Summary Historical and Unaudited Pro Forma Consolidated Financial and Operating Data
The following tables present our summary historical and unaudited pro forma consolidated financial and operating data. You should read these tables along with "Capitalization," "Unaudited Pro Forma Consolidated Financial Statements," "Selected Consolidated Financial and Operating Data," "Management's Discussion and Analysis of Financial Condition and Results of Operations" and our consolidated financial statements and related notes appearing elsewhere in this prospectus. Historical results are not necessarily indicative of the results of operations expected for future periods.
The historical balance sheet data as of January 31, 2012, and the statement of operations data for the fiscal 2009, fiscal 2010 and fiscal 2011, are derived from our audited consolidated financial statements that are included elsewhere in this prospectus. The historical balance sheet data as of July 31, 2012 and the statement of operations data for the twenty-six weeks ended August 2, 2011 and July 31, 2012 are derived from our unaudited consolidated financial statements included elsewhere in this prospectus. The pro forma consolidated statement of operations data for fiscal 2011 and for the twenty-six weeks ended July 31, 2012 give effect to the acquisition of MGHC Holding Corporation (which operated Mattress Giant stores) as if it had occurred on February 2, 2011. The pro forma adjustments are based upon available information and certain assumptions that we believe are reasonable. The summary unaudited pro forma consolidated financial data is for informational purposes only and does not purport to represent what our results of operations actually would be if the foregoing transaction had occurred at any date, nor does such data purport to project the results of operations for any future period.
14
| |
|
|
|
Twenty-Six Weeks Ended | Pro Forma | |||||||||||||||||
|---|---|---|---|---|---|---|---|---|---|---|---|---|---|---|---|---|---|---|---|---|---|---|
| |
Fiscal Year | |||||||||||||||||||||
| |
August 2, 2011 |
July 31, 2012 |
Fiscal Year 2011 |
Twenty-Six Weeks Ended July 31, 2012 |
||||||||||||||||||
| |
2009 | 2010 | 2011 | |||||||||||||||||||
| |
|
|
|
(unaudited) |
(unaudited) |
|||||||||||||||||
| |
(dollar amounts in thousands, except per share data and store units) |
|||||||||||||||||||||
Statement of Operations: |
||||||||||||||||||||||
Net sales |
$ | 432,250 | $ | 494,115 | $ | 703,910 | $ | 331,838 | $ | 471,832 | $ | 855,827 | $ | 503,657 | ||||||||
Cost of sales |
280,506 | 313,962 | 428,018 | 205,227 | 287,126 | 539,668 | 309,962 | |||||||||||||||
Gross profit from retail operations |
151,744 | 180,153 | 275,892 | 126,611 | 184,706 | 316,159 | 193,695 | |||||||||||||||
Franchise fees and royalty income |
2,100 | 3,195 | 4,697 | 2,072 | 2,532 | 4,697 | 2,532 | |||||||||||||||
|
153,844 | 183,348 | 280,589 | 128,683 | 187,238 | 320,856 | 196,227 | |||||||||||||||
Sales and marketing expenses |
95,305 | 113,963 | 167,605 | 80,718 | 115,692 | 200,503 | 122,347 | |||||||||||||||
General and administrative expenses |
32,336 | 34,111 | 51,684 | 24,123 | 35,878 | 65,316 | 37,044 | |||||||||||||||
Goodwill impairment charge |
— | 536 | — | — | — | — | — | |||||||||||||||
Loss on store closings and impairment of store assets(1) |
5,179 | 2,486 | 759 | 39 | 71 | 1,361 | 71 | |||||||||||||||
Total operating expenses |
132,820 | 151,096 | 220,048 | 104,880 | 151,641 | 267,180 | 159,462 | |||||||||||||||
Income from operations |
21,024 | 32,252 | 60,541 | 23,803 | 35,597 | 53,676 | 36,765 | |||||||||||||||
Interest income |
(12 | ) | (6 | ) | (9 | ) | (3 | ) | (1 | ) | (9 | ) | (2 | ) | ||||||||
Interest expense(2) |
27,126 | 31,063 | 29,310 | 16,949 | 4,289 | 29,435 | 4,289 | |||||||||||||||
Loss (gain) from debt extinguishment(3) |
(2,822 | ) | — | 5,704 | 1,873 | — | 5,704 | — | ||||||||||||||
Miscellaneous income, net |
— | — | — | — | — | (200 | ) | (182 | ) | |||||||||||||
|
24,292 | 31,057 | 35,005 | 18,819 | 4,288 | 34,930 | 4,105 | |||||||||||||||
Income (loss) before income taxes |
(3,268 | ) | 1,195 | 25,536 | 4,984 | 31,309 | 18,746 | 32,660 | ||||||||||||||
Income tax expense (benefit) |
1,405 | 846 | (8,815 | ) | 319 | 11,488 | (8,302 | ) | 12,213 | |||||||||||||
Net income (loss) |
$ | (4,673 | ) | $ | 349 | $ | 34,351 | $ | 4,665 | $ | 19,821 | $ | 27,048 | $ | 20,447 | |||||||
Per Share Data: |
||||||||||||||||||||||
Basic net income (loss) per common share(4) |
$ | (0.21 | ) | $ | 0.02 | $ | 1.40 | $ | 0.21 | $ | 0.59 | $ | 1.10 | $ | 0.61 | |||||||
Diluted net income (loss) per common share(4) |
$ | (0.21 | ) | $ | 0.02 | $ | 1.40 | $ | 0.21 | $ | 0.59 | $ | 1.10 | $ | 0.60 | |||||||
As adjusted basic net income (loss) per common share(5) |
$ | (0.21 | ) | $ | 0.02 | $ | 1.40 | $ | 0.21 | $ | 0.73 | |||||||||||
As adjusted diluted net income (loss) per common share(5) |
$ | (0.21 | ) | $ | 0.02 | $ | 1.40 | $ | 0.21 | $ | 0.73 | |||||||||||
Basic weighted average shares outstanding(4) |
22,399,952 | 22,399,952 | 24,586,274 | 22,399,952 | 33,768,828 | 24,586,274 | 33,768,828 | |||||||||||||||
Diluted weighted average shares outstanding(4) |
22,399,952 | 22,399,952 | 24,586,274 | 22,399,952 | 33,867,158 | 24,586,274 | 33,867,158 | |||||||||||||||
Other Financial Data: |
||||||||||||||||||||||
EBITDA(6) |
$ | 41,275 | $ | 49,027 | $ | 74,005 | $ | 31,462 | $ | 46,959 | ||||||||||||
Adjusted EBITDA(7) |
$ | 46,323 | $ | 57,095 | $ | 87,487 | $ | 34,695 | $ | 55,001 | ||||||||||||
Adjusted EBITDA, percentage of net sales |
10.7 | % | 11.6 | % | 12.4 | % | 10.5 | % | 11.7 | % | ||||||||||||
Income from operations, percentage of net sales |
4.9 | % | 6.5 | % | 8.6 | % | 7.2 | % | 7.5 | % | ||||||||||||
As adjusted income from operations(5) |
$ | 21,024 | $ | 32,252 | $ | 60,541 | $ | 23,803 | $ | 42,646 | ||||||||||||
As adjusted income from operations, percentage of net sales(5) |
4.9 | % | 6.5 | % | 8.6 | % | 7.2 | % | 9.0 | % | ||||||||||||
Capital expenditures |
$ | 10,863 | $ | 27,330 | $ | 34,356 | $ | 11,681 | $ | 31,667 | ||||||||||||
Depreciation and amortization |
$ | 16,286 | $ | 15,448 | $ | 17,450 | $ | 8,717 | $ | 10,175 | ||||||||||||
15
| |
|
|
|
Twenty-Six Weeks Ended |
||||||||||||
|---|---|---|---|---|---|---|---|---|---|---|---|---|---|---|---|---|
| |
Fiscal Year | |||||||||||||||
| |
August 2, 2011 |
July 31, 2012 |
||||||||||||||
| |
2009 | 2010 | 2011 | |||||||||||||
| |
|
|
|
(unaudited) |
||||||||||||
| |
(in thousands, except store units, unless otherwise indicated) |
|||||||||||||||
Operational Data(8): |
||||||||||||||||
Comparable-stores sales growth (decline)(9) |
(4.3 | )% | 6.3 | % | 20.5 | % | 19.2 | % | 10.1 | % | ||||||
Stores open at period-end |
487 | 592 | 729 | 620 | 957 | |||||||||||
Average net sales per store unit(10) |
$ | 926 | $ | 962 | $ | 1,107 | $ | 540 | $ | 577 | ||||||
| |
At January 31, 2012 |
At July 31, 2012 |
|||||
|---|---|---|---|---|---|---|---|
| |
|
(unaudited) |
|||||
| |
(in thousands) |
||||||
Balance Sheet Data: |
|||||||
Working capital |
$ | 49,258 | $ | 8,880 | |||
Total assets |
$ | 613,481 | $ | 670,123 | |||
Total debt |
$ | 228,354 | $ | 232,230 | |||
Stockholders' equity |
$ | 224,259 | $ | 245,082 | |||
- (1)
- Includes
a non-cash impairment charge for long-lived assets, consisting primarily of store leasehold costs and
related equipment, to reduce the carrying value to estimated fair value, based on our periodic assessment of whether projected future cash flows of individual stores are sufficient to recover the
carrying value of the related assets, in the amounts of $2.3 million, $1.7 million and $0.1 million during fiscal 2009, fiscal 2010 and fiscal 2011, respectively.
- (2)
- Interest
expense includes interest that was accrued and paid in kind by adding the interest to the outstanding balance of debt related to our
2009 Loan Facility (defined below), Convertible Notes (defined below) and PIK Notes (defined below) in the amounts of $17.7 million, $23.2 million, $20.6 million and
$12.5 million during fiscal 2009, fiscal 2010, fiscal 2011 and the twenty-six weeks ended August 2, 2011, respectively.
- (3)
- During
fiscal 2009, a gain from debt extinguishment was recognized in connection with the amendment and restatement of the 2009 Loan
Facility. The extinguishment resulted in a $5.8 million downward adjustment of the loan carrying value to its fair value, which was partially offset by the write-off of
$3.0 million of unamortized deferred loan fees. During fiscal 2011, a loss from debt extinguishment in the total amount of $5.7 million was recognized, consisting of $1.9 million
in connection with the $40.2 million prepayment of the 2009 Loan Facility in July 2011, and $3.8 million in connection with (i) the repayment in full of the 2009 Loan Facility,
(ii) the repayment of a portion of the outstanding balance of PIK Notes and the conversion of the remaining outstanding balance of PIK Notes not repaid into shares of our common stock and
(iii) the conversion of the outstanding balance of Convertible Notes into shares of our common stock in connection with the initial public offering in November 2011.
- (4)
- Gives
effect to a 227,058-for-one stock split effected on November 3, 2011 resulting in
22,399,952 shares of common stock outstanding immediately prior to the consummation of our initial public offering in November 2011, and the issuance of (i) 6,388,888 shares of
common stock as part of the initial public offering, (ii) 2,205,953 additional shares upon the conversion of the Convertible Notes in connection with the initial public offering and
(iii) 2,774,035 additional shares upon the conversion of the PIK Notes in connection with the initial public offering, in each case at a price or conversion rate equal to the initial public
offering price of $19.00 per share.
- (5)
- In connection with the acquisition of MGHC Holding on May 2, 2012, the Company has incurred acquisition-related costs, which are included in our results of operations, consisting of acquisition-related costs as defined under U.S. GAAP, including advisory, legal, accounting, valuation, and other professional or consulting fees and, in addition, costs of integrating store and warehouse operations and corporate functions that are not expected to recur in future periods, related to the MGHC Holding acquisition. We have provided certain "As Adjusted" financial data to exclude acquisition-related costs as we believe this information facilitates year-over-year comparisons for investors and financial analysts. Our "As
16
Adjusted" data is considered a non-U.S. GAAP financial measure and is not in accordance with, or preferable to, "As Reported" or U.S. GAAP financial data.
| |
Twenty-Six Weeks Ended July 31, 2012 |
|||||||||
|---|---|---|---|---|---|---|---|---|---|---|
| |
(in thousands, except share and per share amounts) |
|||||||||
| |
As Reported | Acquisition- Related Costs |
As Adjusted | |||||||
Income from operations |
$ | 35,597 | $ | 7,049 | $ | 42,646 | ||||
Other expense, net |
4,288 | — | 4,288 | |||||||
Income before income taxes |
31,309 | 7,049 | 38,358 | |||||||
Income tax expense(a) |
11,488 | 2,220 | 13,708 | |||||||
Net income |
$ | 19,821 | $ | 4,829 | $ | 24,650 | ||||
Basic net income per common share |
$ |
0.59 |
$ |
0.14 |
$ |
0.73 |
||||
Diluted net income per common share |
$ | 0.59 | $ | 0.14 | $ | 0.73 | ||||
Basic weighted average shares outstanding |
33,768,828 |
33,768,828 |
33,768,828 |
|||||||
Diluted weighted average shares outstanding |
33,867,158 | 33,867,158 | 33,867,158 | |||||||
- (a)
- Reflects effective income tax rate of 38.5% for fiscal year 2012 and $0.3 million in foregone tax benefits on certain acquisition-related costs considered nondeductible.
- (6)
- EBITDA
represents net income before income tax expense, interest income, interest expense, depreciation and amortization. We have presented
EBITDA because we consider it an important supplemental measure of our performance and believe it is frequently used by analysts, investors and other interested parties in the evaluation of companies
in our industry. Management uses EBITDA as a measurement tool for evaluating our actual operating performance compared to budget and prior periods. Other companies in our industry may calculate EBITDA
differently than we do. EBITDA is not a measure of performance under U.S. GAAP, and should not be considered as a substitute for net income prepared in accordance with U.S. GAAP. EBITDA
has limitations as an analytical tool, and you should not consider it in isolation or as a substitute for analysis of our results as reported under U.S. GAAP. Some of these limitations
are:
- •
- EBITDA does not reflect our cash expenditures, or future requirements, for capital
expenditures or contractual commitments;
- •
- EBITDA does not reflect interest expense or the cash requirements necessary to
service interest or principal payments on our debt;
- •
- EBITDA does not reflect tax expense or the cash requirements necessary to pay for
tax obligations; and
- •
- Although depreciation and amortization are non-cash charges, the asset
being depreciated and amortized will often have to be replaced in the future, and EBITDA does not reflect any cash requirements for such replacements.
- We
compensate for these limitations by relying primarily on our U.S. GAAP results and using EBITDA only as a supplemental measure.
- (7)
- Adjusted EBITDA is defined as EBITDA, without giving effect to non-cash goodwill and intangible asset impairment charges, gains or losses on store closings and impairment of store assets, gains or losses related to the early extinguishment of debt, financial sponsor fees and expenses, non-cash charges related to stock-based awards and other items that are excluded by management in reviewing the results of operations. We have presented Adjusted EBITDA because we believe that the exclusion of these items is appropriate to provide additional information to investors about our ongoing operating performance excluding certain non-cash and other items and to provide additional information with respect to our ability to comply with various covenants in documents governing our indebtedness and as a means to evaluate our period-to-period results. In evaluating Adjusted EBITDA, you should be aware that in the future we may incur expenses that are the same as or similar to some of the adjustments in this presentation. Our presentation of Adjusted EBITDA should not be construed to imply that our future results will be unaffected by any such adjustments. We have provided this information to analysts, investors and other third parties to enable them to perform more meaningful comparisons of past, present and future operating results and as a means to evaluate the results of our ongoing operations. The Compensation Committee uses Adjusted EBITDA as a performance measure under our short-term incentive programs for our executive officers. In addition, our compliance with certain covenants under our 2007 Senior Credit Facility that are calculated based on similar measures, which differ from Adjusted EBITDA primarily by the inclusion of pro forma results for acquired businesses in those similar measures. Other companies in our industry may calculate Adjusted EBITDA differently than we do. Adjusted EBITDA is not a measure of performance under U.S. GAAP and should not be considered as a substitute for net income prepared in accordance with U.S. GAAP. Adjusted EBITDA has similar limitations as an analytical tool to those set forth
17
- •
- Adjusted EBITDA does not reflect the cash requirements of closing underperforming
stores;
- •
- Adjusted EBITDA does not reflect costs related to management services previously
provided by J.W. Childs; and
- •
- Adjusted EBITDA does not reflect certain other costs that may recur in future
periods.
in note (5) related to the use of EBITDA, and you should not consider it in isolation or as a substitute for analysis of our results as reported under U.S. GAAP. Some of the additional limitations to the use of Adjusted EBITDA are:
- We compensate for these limitations by relying primarily on our U.S. GAAP results and using Adjusted EBITDA only as a supplemental measure. The following table contains a reconciliation of our net income (loss) determined in accordance with U.S. GAAP to EBITDA and Adjusted EBITDA for the periods indicated:
| |
|
|
|
Twenty-Six Weeks Ended |
||||||||||||
|---|---|---|---|---|---|---|---|---|---|---|---|---|---|---|---|---|
| |
Fiscal Year | |||||||||||||||
| |
August 2, 2011 |
July 31, 2012 |
||||||||||||||
| |
2009 | 2010 | 2011 | |||||||||||||
| |
|
|
|
(unaudited) |
||||||||||||
| |
(in thousands) |
|||||||||||||||
Net income (loss) |
$ | (4,673 | ) | $ | 349 | $ | 34,351 | $ | 4,665 | $ | 19,821 | |||||
Income tax (benefit) expense |
1,405 | 846 | (8,815 | ) | 319 | 11,488 | ||||||||||
Interest income |
(12 | ) | (6 | ) | (9 | ) | (3 | ) | (1 | ) | ||||||
Interest expense |
27,126 | 31,063 | 29,310 | 16,949 | 4,289 | |||||||||||
Depreciation and amortization |
16,286 | 15,448 | 17,450 | 8,717 | 10,175 | |||||||||||
Intangible assets and other amortization |
1,143 | 1,327 | 1,718 | 815 | 1,187 | |||||||||||
EBITDA |
41,275 | 49,027 | 74,005 | 31,462 | 46,959 | |||||||||||
Goodwill impairment charge |
— | 536 | — | — | — | |||||||||||
Loss on store closings and impairment of store assets |
5,179 | 2,486 | 759 | 39 | 71 | |||||||||||
Loss (gain) from debt extinguishment |
(2,822 | ) | — | 5,704 | 1,873 | — | ||||||||||
Financial sponsor fees and expenses |
395 | 407 | 644 | 192 | 51 | |||||||||||
Stock-based compensation |
84 | (515 | ) | 523 | 39 | 1,002 | ||||||||||
Vendor new store funds(a) |
(87 | ) | 1,540 | 3,169 | 300 | 633 | ||||||||||
Acquisition related expenses(b) |
2 | 453 | 886 | 108 | 7,049 | |||||||||||
Other(c) |
2,297 | 3,161 | 1,797 | 682 | (764 | ) | ||||||||||
Adjusted EBITDA |
$ | 46,323 | $ | 57,095 | $ | 87,487 | $ | 34,695 | $ | 55,001 | ||||||
- (a)
- Adjustment
to recognize vendor funds received upon the opening of a new store in the period opened, rather than over 36-months as
presented in our financial statements, which is consistent with how management has historically reviewed its results of operations.
- (b)
- Non-cash
effect included in net income related to purchase accounting adjustments made to inventories resulting from acquisitions and other
acquisition-related cash costs included in net income, such as direct acquisition costs and costs related to integration of acquired businesses.
- (c)
- Consists of various items that management excludes in reviewing the results of operations, including $1.6 million in fiscal 2010 for the estimated costs of a May 26, 2011 settlement of a lawsuit involving alleged violations of the Fair Labor Standards Act brought in April 2010 by a former employee and a $0.5 million benefit in the twenty-six weeks ended July 31, 2012 for a recovery from the claims-made reversionary fund established to administer the lawsuit settlement.
- (8)
- Operational
data relates to company-operated stores only.
- (9)
- Comparable-store
sales is a measure commonly used in the retail industry, which indicates store performance by measuring the growth in
revenue for certain stores for a particular period over the corresponding period in the prior year. New stores are included in the comparable-store sales calculation beginning in the thirteenth full
month of operation. Acquired stores are included in the comparable-store sales calculation beginning in the first month following the one-year anniversary date of the acquisition. The
comparable-store sales calculation includes sales related to our e-commerce and other comparable sales channels. New stores that are relocated within a two mile radius of a closed store
are included in the comparable-store sales calculation beginning with the first full month of operations by measuring the growth in revenue against the prior year sales of the closed store. Stores
that are closed, other than relocated stores, are removed from the comparable-store sales calculation in the month of closing. Comparable-store sales during fiscal years that are comprised of
53 weeks exclude sales for the fifty-third week of the year. The method of calculating comparable-store sales varies across the retail industry and our method may not be the same as other
retailers' methods.
- (10)
- Calculated using net sales for stores open at both the beginning and the end of the period, excluding temporary "pop-up" stores and sales generated from our website, www.mattressfirm.com.
18
An investment in our common stock involves various risks. You should carefully consider the following risks and all of the other information contained in this prospectus before investing in our common stock. The risks described below are those that we believe are the material risks that we face.
Risks Related to Our Business
Our business is dependent on general economic conditions in our markets.
Our sales depend, in part, on discretionary spending by our customers. Pressure on discretionary income brought on by economic downturns and slow recoveries, including housing market declines, rising energy prices and weak labor markets, may cause consumers to reduce the amount they spend on discretionary items. If recovery from the economic downturn continues to be slow or prolonged, our growth, prospects, results of operations, cash flows and financial condition could be adversely impacted. General economic conditions and discretionary spending are beyond our control and are affected by, among other things:
- •
- consumer confidence in the economy;
- •
- unemployment trends;
- •
- consumer debt levels;
- •
- consumer credit availability;
- •
- the housing market;
- •
- gasoline and fuel prices;
- •
- interest rates and inflation;
- •
- price deflation, including due to low-cost imports;
- •
- slower rates of growth in real disposable personal income;
- •
- natural disasters;
- •
- national security concerns;
- •
- tax rates and tax policy; and
- •
- other matters that influence consumer confidence and spending.
Increasing volatility in financial markets may cause some of the above factors to change with an even greater degree of frequency and magnitude.
Our ability to grow and remain profitable may be limited by direct or indirect competition in the retail bedding industry, which is highly competitive.
The retail bedding industry in the United States is highly competitive. Participants in the bedding industry compete primarily based on store location, service, price, product selection, brand name recognition and advertising. There can be no assurance that we will be able to continue to compete favorably with our competitors in these areas. Our store competitors include regional and local specialty retailers of bedding (such as Sleepy's and Sleep Train, national and regional chains of retail furniture stores carrying bedding (such as Ashley Furniture, Haverty's and Rooms-To-Go), department store chains with bedding departments (such as Macy's, Sears and JC Penney), big box retailers (such as Walmart), warehouse clubs (such as Costco) and factory direct stores (such as Original Mattress). Additionally, retail furniture stores may open retail locations specifically targeted for specialty bedding as a way to directly compete with us and other specialty retailers. In the past, we have faced periods of
19
heightened competition that materially affected our results of operations. Certain of our competitors have substantially greater financial and other resources than us. Accordingly, we may face periods of intense competition in the future that could have a material adverse effect on our planned growth and future results of operations. In addition, the barriers to entry into the retail bedding industry are relatively low. New or existing bedding retailers could enter our markets and increase the competition we face. In addition, manufacturers and vendors of mattresses and related products, including those whose products we currently sell, have entered the U.S. mattress retail market and now directly compete with us. Competition in existing and new markets may also prevent or delay our ability to gain relative market share. Any of the developments described above could have a material adverse effect on our planned growth and future results of operations.
If we fail to successfully manage the challenges our planned growth poses or encounter unexpected difficulties during our expansion, our net sales and profitability could be materially adversely affected.
One of our central long term objectives is to increase sales and profitability through market share leadership. Our ability to achieve market share leadership, however, is contingent upon our ability to (1) open stores in favorable locations, (2) advertise our stores in an effective and cost-efficient manner and (3) achieve operating results in new stores at the same level as our similarly situated current stores. There can be no assurance, however, that we will be able to open stores in new markets required to achieve market leadership in such markets, identify and obtain favorable store sites, arrange favorable leases for stores or obtain governmental and other third-party consents, permits and licenses needed to open or operate stores in a timely manner, train and hire a sufficient number of qualified managers for new stores, attract a strong customer base and brand familiarity in new markets, or successfully compete with established mattress stores in the new markets we enter. Moreover, if we are unable to open an adequate number of stores in a market, or if store-level profitability is lower than expectations, we may be unable to achieve the market presence necessary to justify the considerable expense of radio or television advertising and could be forced to rely upon less effective advertising mediums. Failure to open stores in favorable locations or to advertise in an effective and cost-efficient manner could place us at a competitive disadvantage as compared to retailers who were more adept than we at managing these challenges, which, in turn, could negatively affect our overall operating results.
Our comparable-store sales and results of operations fluctuate due to a variety of economic, operating, industry and environmental factors and may not be fair indicators of our performance.
Our comparable-store sales and operating results have experienced fluctuations, which can be expected to continue. Numerous factors affect our comparable-store sales results, including among others, the timing of new and relocated store openings, the relative proportion of new and relocated stores to mature stores, cannibalization resulting from the opening of new stores in existing markets, the acquisition and rebranding of competitors' stores in existing Mattress Firm® markets (including the timing of such acquisitions), changes in advertising and other operating costs, the timing and level of markdowns, changes in our product mix, weather conditions, retail trends, the retail sales environment, economic conditions, inflation, the impact of competition and our ability to execute our business strategy efficiently. As a result, comparable-store sales or operating results may fluctuate, and may cause the price of our common stock to fluctuate significantly. Therefore, we believe period-to-period comparisons of our results may not be a fair indicator of, and should not be relied upon as a measure of, our operating performance.
20
We intend to aggressively open additional stores in our existing markets, which may diminish sales by existing stores in those markets and strain our ability to find qualified personnel or divert resources from our existing stores, negatively affecting our overall operating results.
Pursuant to our expansion strategy, we intend to aggressively open additional stores in our existing markets, whether through organic growth or acquisitions, including relocations of existing stores. Because our stores typically draw customers from their local areas, additional stores may draw customers away from nearby existing stores and may cause our comparable-store sales performance and customer counts at those existing stores to decline, which may adversely affect our overall operating results. In addition, our ability to open additional stores or convert and maintain acquired stores will be dependent on our ability to promote and/or recruit enough qualified field managers, store managers, assistant store managers and sales associates. The time and effort required to train and supervise a large number of new managers and associates and integrate them into our culture may divert resources from our existing stores. If we are unable to profitably open additional stores or convert and maintain acquired stores in existing markets and limit the adverse impact of those new or acquired stores on existing stores, it may reduce our comparable-store sales and overall operating results during the implementation of our expansion strategy.
Our expansion strategy will be dependent upon, and limited by, the availability of adequate capital.
Our expansion strategy will require additional capital for, among other purposes, opening new stores and entering new markets. Such capital expenditures will include researching real estate and consumer markets, lease, inventory, property and equipment costs, integration of new stores and markets into company-wide systems and programs and other costs associated with new stores and market entry expenses and growth. If cash generated internally is insufficient to fund capital requirements, or if funds are not available under our existing credit facility, we will require additional debt or equity financing. Adequate financing may not be available or, if available, may not be available on terms satisfactory to us. In addition, our debt agreements provide a limit on the amount of capital expenditures we may make annually. If we fail to obtain sufficient additional capital in the future or we are unable to make capital expenditures under our debt agreements, we could be forced to curtail our expansion strategies by reducing or delaying capital expenditures relating to new stores and new market entry. As a result, there can be no assurance that we will be able to fund our current plans for the opening of new stores or entry into new markets.
We may from time to time acquire complementary businesses, including operations of our franchisees, which will subject us to a number of risks.
Any acquisitions we may undertake involve a number of risks, including:
- •
- failure of the acquired businesses to achieve the results we expect;
- •
- potential comparable-store sales declines as a result of sales culture integration challenges and conversion
of acquired stores to the Mattress Firm® brand;
- •
- diversion of capital and management attention from operational matters;
- •
- our inability to retain key personnel of the acquired businesses;
- •
- risks associated with unanticipated events or liabilities;
- •
- the potential disruption and strain on our existing business and resources that could result from our planned growth and
continuing integration of our acquisitions; and
- •
- customer dissatisfaction or performance problems at the acquired businesses.
21
For example, on May 2, 2012, we acquired all of the equity interests of MGHC Holding Corporation (which operated Mattress Giant stores) and we plan to acquire 35 Mattress X-Press stores during fiscal 2012. If we are unable to fully integrate or successfully manage any business that we acquire, such as the operations of MGHC Holding Corporation or the Mattress X-Press stores, we may not realize anticipated cost savings, improved efficiencies or revenue growth, which may result in reduced profitability or operating losses. In addition, we may face competition for acquisition candidates, which may limit the number of acquisition opportunities and may lead to higher acquisition prices. Moreover, acquisitions of businesses may require the issuance of additional equity financing, which would result in dilution of our existing stockholders. The realization of all or any of the risks described above could materially and adversely affect our reputation and our results of operations.
A deterioration in our relationships with, or a dilution of the brand images of, our primary suppliers could adversely affect our brand and customer satisfaction and result in reduced sales and operating results.
We currently rely on Sealy, Simmons, Serta and Tempur-Pedic as our primary suppliers of branded mattresses. Purchases of products from these four manufacturers accounted for 81% of our mattress product costs for fiscal 2011. Because of the large volume of our business with these manufacturers and our use of their branding in our marketing initiatives, our success depends on the continued popularity and reputation of these manufacturers. Any dilution of their brand images, reduction in vendor incentives or adverse change in our relationship with any of them or to their financial condition, production efficiency, product development or marketing capabilities could adversely affect our own brand and the level of our customers' satisfaction, among other things, which could result in reduced sales and operating results.
We use Corsicana as a primary supplier of our private label mattresses, which accounted for 15% of our mattress product costs for fiscal 2011. If our relationships with Sealy, Simmons, Serta, Tempur-Pedic or Corsicana are terminated or otherwise impaired, or if any of them materially increase their prices, it could have a material adverse effect on our business and financial condition.
We depend on a number of suppliers, and any failure by any of them to supply us with products may impair our inventory and adversely affect our ability to meet customer demands, which could result in a decrease in net sales.
Through our operating subsidiaries, we maintain supply agreements with Sealy, Simmons, Serta, Tempur-Pedic and Corsicana, among others. Our current suppliers may not continue to sell products to us on acceptable terms or at all, and we may not be able to establish relationships with new suppliers to ensure delivery of products in a timely manner or on terms acceptable to us. We may not be able to acquire desired merchandise in sufficient quantities on terms acceptable to us in the future. We are also dependent on suppliers for assuring the quality of merchandise supplied to us. Our inability to acquire suitable merchandise in the future or the loss of one or more of our suppliers and our failure to replace them may harm our relationship with our customers and our ability to attract new customers, resulting in a decrease in net sales.
If customers are unable to obtain third-party financing at appropriate rates, sales of our products could be materially adversely affected.
We offer financing to consumers through third party consumer finance companies. In fiscal 2011, approximately 32% of sales were financed through third party consumer finance companies, and we plan to continue to offer such financing services. Our business is affected by the availability and terms of financing to customers. During much of the fourth quarter of fiscal 2008 and continuing into fiscal 2009, we experienced significantly lower credit approval rates for our customers. Sales results were
22
negatively affected as a result. Another reduction of credit availability to our customers could have a material impact on our results of operations.
We may not be able to successfully anticipate consumer trends and our failure to do so may lead to loss of consumer acceptance of the products we sell, resulting in reduced net sales.
Our success depends on our ability to anticipate and respond to changing trends and consumer demands in a timely manner. If we fail to identify and respond to emerging trends, consumer acceptance of the merchandise we sell and our image with current or potential customers may be harmed, which could reduce our net sales. For example, the Company has responded to the trend in favor of specialty bedding products and sleep systems, such as viscoelastic foam mattresses, by entering into new arrangements with suppliers and reallocating store display space without certainty of success or that existing relationships with conventional mattress suppliers will not be jeopardized. Additionally, if we misjudge market trends, we may significantly overstock unpopular products and be forced to take significant inventory markdowns, which would have a negative impact on our gross profit and cash flow. Conversely, shortages of models that prove popular could also reduce our net sales.
We depend on a few key employees, and if we lose the services of certain of our principal executive officers, we may not be able to run our business effectively.
Our future success depends in part on our ability to attract and retain key executive, merchandising, marketing and sales personnel. Our executive officers include Steve Stagner, our President and Chief Executive Officer, Steve Fendrich, our Chief Strategy Officer, and Jim Black, our Executive Vice President and Chief Financial Officer. We have an employment agreement with each of Messrs. Stagner, Fendrich and Black. If any of these executive officers ceases to be employed by us, we would have to hire additional qualified personnel. Our ability to successfully hire other experienced and qualified executive officers cannot be assured and may be difficult because we face competition for these professionals from our competitors, our suppliers and other companies operating in our industry. As a result, the loss or unavailability of any of our executive officers could have a material adverse effect on us.
Our substantial debt could adversely affect us, make us more vulnerable to adverse economic or industry conditions and prevent us from fulfilling our debt obligations or from funding our expansion strategy.
We have a substantial amount of debt outstanding. As of July 31, 2012, we had $232.2 million of total indebtedness, consisting primarily of $227.2 million outstanding under the 2007 Senior Credit Facility. Our substantial indebtedness could have serious consequences, such as:
- •
- limiting our ability to obtain additional financing to fund our working capital, capital expenditures, debt service
requirements, expansion strategy or other purposes;
- •
- placing us at a competitive disadvantage compared to competitors with less debt;
- •
- increasing our vulnerability to, and reducing our flexibility in planning for, adverse changes in economic, industry and
competitive conditions; and
- •
- increasing our vulnerability to increases in interest rates because borrowings under the 2007 Senior Credit Facility are subject to variable interest rates.
The potential consequences of our substantial indebtedness make us more vulnerable to defaults and place us at a competitive disadvantage. A substantial or extended increase in interest rates could significantly affect our cash available to make scheduled payments on the 2007 Senior Credit Facility or to fund our expansion strategy.
23
We may be unable to generate sufficient cash to service all of our indebtedness and other liquidity requirements and may be forced to take other actions to satisfy such requirements, which may not be successful.
We will be required to repay borrowings under the revolving and term loan portions of our 2007 Senior Credit Facility on January 18, 2013 and January 18, 2014, respectively. Our ability to make payments on and to refinance our indebtedness and to fund planned capital expenditures will depend on our ability to generate cash in the future. This, to a certain extent, is subject to general economic, financial, competitive, legislative, regulatory and other factors that are beyond our control.
We expect that we will need to access the capital markets in order to refinance all amounts outstanding under the term loan portion of our 2007 Senior Credit Facility due January 18, 2014, as we do not anticipate generating sufficient cash flow from operations to repay such amount in full. We cannot assure you that funds will be available to us in the capital markets, together with cash generated from operations, in an amount sufficient to enable us to pay our indebtedness or to fund our other liquidity needs. We cannot assure you that we will be able to refinance any of our indebtedness, including the 2007 Senior Credit Facility, on commercially reasonable terms or at all. If we cannot service our indebtedness, we may have to take actions such as selling assets, seeking additional equity or reducing or delaying capital expenditures, strategic acquisitions, investments and alliances. We cannot assure you that any such actions, if necessary, could be effected on commercially reasonable terms or at all.
Additionally, under U.S. GAAP, debt coming due within one year must be classified as a current liability. Therefore, unless we have refinanced our 2007 Senior Credit Facility prior to the end of fiscal 2012, we will be required to reclassify the related outstanding borrowings as a current liability under U.S. GAAP in our end of fiscal 2012 balance sheet. We are currently evaluating a number of alternatives with respect to the upcoming maturity of the 2007 Senior Credit Facility. Our ability to consummate any such alternatives will depend on prevailing market conditions, our liquidity requirements, contractual restrictions and other factors, some of which may be beyond our control. Accordingly, there is no assurance that we will successfully enter into any definitive agreements for such alternatives.
Our debt agreements contain restrictions that limit our flexibility in operating our business.
The 2007 Senior Credit Facility contains negative covenants that limit our ability to engage in specified types of transactions. These covenants limit our ability and the ability of our restricted subsidiaries to, among other things:
- •
- incur indebtedness;
- •
- create liens;
- •
- engage in mergers or consolidations;
- •
- sell assets (including pursuant to sale and leaseback transactions);
- •
- pay dividends and distributions or repurchase our capital stock;
- •
- make investments, acquisitions, loans or advances;
- •
- make capital expenditures;
- •
- repay, prepay or redeem certain indebtedness;
- •
- engage in certain transactions with affiliates;
- •
- enter into agreements limiting subsidiary distributions;
24
- •
- enter into agreements limiting the ability to create liens;
- •
- amend material agreements governing certain indebtedness; and
- •
- change our lines of business.
A breach of any of these covenants could result in an event of default under the 2007 Senior Credit Facility. Upon the occurrence of an event of default under the 2007 Senior Credit Facility, the lenders could elect to declare all amounts outstanding under such facility to be immediately due and payable and terminate all commitments to extend further credit, or seek amendments to our debt agreements that would provide for terms more favorable to such lenders and that we may have to accept under the circumstances. If we were unable to repay those amounts, the lenders under the 2007 Senior Credit Facility could proceed against the collateral granted to them to secure that indebtedness. We have pledged a significant portion of our assets as collateral under the 2007 Senior Credit Facility. If the lenders under the 2007 Senior Credit Facility accelerate the repayment of borrowings, we cannot guarantee that we will have sufficient assets to repay the 2007 Senior Credit Facility. Additionally, we will need to amend the 2007 Senior Credit Facility or obtain a waiver of the restrictive covenant limiting capital expenditures before the end of fiscal 2012 to permit capital expenditures at the expected level of $70 to $75 million in fiscal 2012. We cannot ensure you that we will be able to obtain such a waiver or amend the 2007 Senior Credit Facility on terms that are acceptable to us.
If we fail to hire, train and retain qualified managers, sales associates and other employees our superior customer service could be compromised and we could lose sales to our competitors.
A key element of our competitive strategy is to provide product expertise to our customers through our extensively trained, commissioned sales associates. If we are unable to attract and retain qualified personnel and managers as needed in the future, including qualified sales personnel, our level of customer service may decline, which may decrease our net sales and profitability.
Our future growth and profitability will be dependent in part on the effectiveness and efficiency of our advertising expenditures.
Our advertising expenditures, which are the largest component of our sales and marketing expenses, are expected to continue to increase for the foreseeable future. A significant portion of our advertising expenditures are made in the higher cost radio and television formats. We cannot assure you that our planned increases in advertising expenditures will result in increased customer traffic, sales, levels of brand name awareness or market share or that we will be able to manage such advertising expenditures on a cost-effective basis. Should we fail to realize the anticipated benefits of our advertising program, or should we fail to effectively manage advertising costs, this could have a material adverse effect on our growth prospects and profitability.
Our operating results are seasonal and subject to adverse weather and other circumstances, the occurrence of which during periods of expected higher sales may result in disproportionately reduced sales for the entire year.
We historically have experienced and expect to continue to experience seasonality in our net sales and net income. We generally have experienced more sales and a greater portion of income during the second and third quarters of our fiscal year due to a concentration of holidays such as Memorial Day, the Fourth of July and Labor Day occurring in the summer and a higher number of home sales occurring in autumn. Over the past five fiscal years, (i) the second fiscal quarter generated 25.9% of our net sales, (ii) the third fiscal quarter generated 26.3% of our net sales and (iii) the other fiscal quarters generated 47.8% of our net sales. We expect this seasonality to continue for the foreseeable future. Any decrease in our second or third quarter sales, whether because of adverse economic
25
conditions, a slowdown in home sales, adverse weather conditions, timing of holidays within our quarters or other unfavorable circumstances, could have a disproportionately adverse effect on net sales and operating results for the entire fiscal year.
If we are unable to renew or replace our current store leases or if we are unable to enter into leases for additional stores on favorable terms, or if one or more of our current leases are terminated prior to expiration of their stated term and we cannot find suitable alternate locations, our growth and profitability could be negatively impacted.
We currently lease all but one of our store locations. Many of our current leases provide for our unilateral option to renew for several additional rental periods at specific rental rates. Our ability to re-negotiate favorable terms on an expiring lease or to negotiate favorable terms for a suitable alternate location, and our ability to negotiate favorable lease terms for additional store locations could depend on conditions in the real estate market, competition for desirable properties, our relationships with current and prospective landlords or on other factors that are not within our control. Any or all of these factors and conditions could negatively impact our growth and profitability.
Because our stores are generally concentrated in the Gulf Coast and Southeast regions of the United States, we are subject to regional risks.
We have a high concentration of stores in the Gulf Coast and Southeast regions. We therefore have exposure to these local economies as well as weather conditions and natural disasters occurring in these regions, including hurricanes, tornadoes and other natural disasters. If these markets individually or collectively suffer an economic downturn or other significant adverse event, there could be an adverse impact on our comparable-store sales, net sales and profitability and our ability to implement our planned expansion program. Any natural disaster or other serious disruption in these markets due to fire, tornado, hurricane or any other calamity could damage inventory and could result in decreased sales.
Our results may be adversely affected by fluctuations in raw material and energy costs.
Our results may be affected by the prices of the components and raw materials used in the manufacture of the mattress products and accessories we sell. These prices may fluctuate based on a number of factors beyond our control, including: oil prices, changes in supply and demand, general economic conditions, labor costs, competition, import duties, tariffs, currency exchange rates and government regulation. In addition, energy costs have fluctuated dramatically in the past. These fluctuations may result in an increase in our transportation costs for distribution, utility costs for our retail stores and overall costs to purchase products from our vendors.
We may not be able to adjust the prices of our products, especially in the short-term, to recover these cost increases in raw materials and energy. A continual rise in raw material and energy costs could adversely affect consumer spending and demand for our products and increase our operating costs, both of which could have a material adverse effect on our financial condition and results of operations.
We are subject to government regulation and audits from various taxing authorities, which could impose substantial costs on our operations or reduce our operational flexibility.
Our products and our marketing and advertising programs are and will continue to be subject to regulation in the U.S. by various federal, state and local regulatory authorities, including the Federal Trade Commission. Compliance with these regulations may have an adverse effect on our business. In addition, our operations are subject to federal, state and local consumer protection regulations and other laws relating specifically to the bedding industry. For example, U.S. Consumer Product Safety
26
Commission has adopted rules relating to fire retardancy standards for the mattress and pillow industry. State and local bedding industry regulations vary among the states in which we operate but generally impose requirements as to the proper labeling of bedding merchandise, restrictions regarding the identification of merchandise as "new" or otherwise, controls as to hygiene and other aspects of product handling, sales and resales and penalties for violations. We and/or our suppliers may be required to incur significant expense to the extent that these regulations change and require new and different compliance measures. For example, new legislation aimed at improving the fire retardancy of mattresses or regulating the handling of mattresses in connection with preventing or controlling the spread of bed bugs could be passed, which could result in product recalls or in a significant increase in the cost of operating our business. In addition, failure to comply with these various regulations may result in penalties, the inability to conduct business as previously conducted or at all, and/or adverse publicity, among other things.
We are also subject to Federal Trade Commission and state laws regarding the offering of franchises and their operations and management. State franchise laws may delay or prevent us from terminating a franchise or withholding consent to renew or transfer a franchise. We may, therefore, be required to retain an underperforming franchise and may be unable to replace the franchise, which could have an adverse effect on franchise revenues. Although we believe that we are in substantial compliance with these bedding industry and franchise regulations, we may be required in the future to incur expense and/or modify our operations in order to ensure such compliance.
We are also subject to audits from various taxing authorities. Changes in tax laws in any of the multiple jurisdictions in which we operate, or adverse outcomes from tax audits that we may be subject to in any of the jurisdictions in which we operate, could result in an unfavorable change in our effective tax rate, which could have an adverse effect on our business and results of our operations.
Our success is highly dependent on our ability to provide timely delivery to our customers, and any disruption in our delivery capabilities or our related planning and control processes may adversely affect our operating results.
An important part of our success is due to our ability to deliver mattresses and bedding-related products quickly to our customers. This in turn is due to our successful planning and distribution infrastructure, including merchandise ordering, transportation and receipt processing, and the ability of our suppliers to meet our distribution requirements. Our ability to maintain this success depends on the continued identification and implementation of improvements to our planning processes, distribution infrastructure and supply chain. We also need to ensure that our distribution infrastructure and supply chain keep pace with our anticipated growth and increased number of stores. The cost of these enhanced processes could be significant and any failure to maintain, grow or improve them could adversely affect our operating results. Our business could also be adversely affected if there are delays in product shipments to us due to freight difficulties, difficulties of our suppliers involving strikes or other difficulties at their principal transport providers or otherwise.
Our ability to control labor costs is limited, which may negatively affect our business.
Our ability to control labor costs is subject to numerous external factors, including prevailing wage rates and overtime pay regulations, the impact of legislation or regulations governing healthcare benefits or labor relations, such as the Employee Free Choice Act, and health and other insurance costs. If our labor and/or benefit costs increase, we may not be able to hire or maintain qualified personnel to the extent necessary to execute our competitive strategy, which could adversely affect our results of operations.
27
There can be no assurance that our warranty claims and comfort exchange return rates will remain within acceptable levels.
Under the terms of our supply agreements with some of our major suppliers of conventional mattress products, we currently are financially responsible for returns resulting from product defects. We also provide our customers with a 100-day comfort satisfaction guarantee whereby, within 100 days from the date of original purchase, if the new mattress is uncomfortable, we will exchange it for a mattress of equal or similar quality with no exchange fee, subject to standard transportation charges. Additionally, we provide our customers with a low price guarantee whereby if a customer finds the same or comparable sleep set for less than our displayed or advertised price within 100 days of purchase, we will beat our competitor's price on such comparable sleep set by 10% and refund the customer the difference. While we establish reserves at the time of sale for these exposures, there can be no assurance that our reserves adequately reflect this enhancement and no assurance that warranty claims and comfort exchange return rates will remain within acceptable levels. An increase in warranty claims and comfort exchange return rates could have a material adverse effect on our business, financial condition and operating results.
If we determine that our goodwill or other acquired intangible assets are impaired, we may have to write off all or a portion of the impaired assets.
As of July 31, 2012, we had goodwill and intangible assets, net of accumulated amortization, of $331.8 million and $90.1 million, respectively. In fiscal 2007 and 2008, as a result of the global economic crisis, we incurred goodwill and intangible asset impairments of $43.6 million and $105.0 million, respectively, and we may incur goodwill and intangible asset impairments in the future. Additionally, we recognized a $0.5 million impairment of goodwill related to two markets in fiscal 2010. Management is required to exercise significant judgment in identifying and assessing whether impairment indicators exist, or if events or changes in circumstances have occurred, including market conditions, operating results, competition and general economic conditions. Current accounting guidance requires that we test our goodwill and indefinite-lived intangible assets for impairment on an annual basis, or more frequently if warranted by the circumstances. Any changes in key assumptions about the business units and their prospects or changes in market conditions or other externalities could result in an impairment charge, and such a charge could have a material adverse effect on our business, results of operations and financial condition. In addition, as we test goodwill impairment at the reporting unit level, which is each Company-operated metropolitan market, we may be required to incur goodwill impairment charges based on adverse changes affecting a particular metropolitan market, regardless of our overall performance. Such impairment charges may have a material adverse effect on our results of operations.
Historically, we have experienced significant losses on store closings and impairment of store assets. There can be no guarantee that we will not experience similar or greater losses of this kind in the future due to general economic conditions, competitive or operating factors or other reasons, which may have a material adverse effect on our results of operations.
We experienced losses on store closings and impairment of store assets of $5.2 million, $2.5 million and $0.8 million in fiscal 2009, fiscal 2010 and fiscal 2011, respectively. These amounts include a non-cash impairment charge for long-lived assets to reduce the carrying value to estimated fair value based on our periodic assessment of whether projected future cash flows of individual stores are sufficient to recover the carrying value of the related assets. This non-cash impairment charge for long-lived assets consists primarily of store leasehold costs and related equipment and was in the amounts of $2.3 million, $1.7 million and $0.1 million during fiscal 2009, fiscal 2010 and fiscal 2011, respectively. If we are forced to close stores in the future due to general economic conditions, competitive or operating factors or other reasons, the related losses may have a material adverse effect
28
on our results of operations. In addition, if we are unsuccessful in our expansion strategy and are required to close a large number of stores, the risk of incurring losses on store closings may increase.
We are a holding company with no business operations of our own and depend on cash flow from our subsidiaries to meet our obligations.
We are a holding company with no business operations of our own or material assets other than the stock of our subsidiaries. Accordingly, all of our operations are conducted by our subsidiaries. As a holding company, we require dividends and other payments from our subsidiaries to meet cash requirements. The terms of the 2007 Senior Credit Facility restrict our subsidiaries from paying dividends and otherwise transferring cash or other assets to us. We currently have no obligations that require cash funding from our subsidiaries. If there is an insolvency, liquidation or other reorganization of any of our subsidiaries, our stockholders likely will have no right to proceed against their assets. Creditors of those subsidiaries will be entitled to payment in full from the sale or other disposal of the assets of those subsidiaries before we, as an equityholder, would be entitled to receive any distribution from that sale or disposal. If our subsidiaries are unable to pay us dividends or make other payments to us when needed, we will be unable to pay dividends or satisfy our obligations.
Product safety issues, including product recalls, could harm our reputation, divert resources, reduce sales and increase costs.
The products we sell in our stores are subject to regulation by the Consumer Product Safety Commission and similar state and international regulatory authorities. Such products could be subject to recalls and other actions by these authorities. Product safety concerns may require us to voluntarily remove selected products from our stores. Such recalls and voluntary removal of products can result in, among other things, lost sales, diverted resources, potential harm to our reputation and increased customer service costs, which could have a material adverse effect on our financial condition.
Our business exposes us to personal injury and product liability claims, which could result in adverse publicity and harm to our brands and our results of operations.
We are from time to time subject to claims due to the injury of an individual in our stores or on our property. In addition, we may be subject to product liability claims for the products that we sell. Subject to certain exceptions, our purchase orders generally require the manufacturer to indemnify us against any product liability claims; however, if the manufacturer does not have insurance or becomes insolvent, there is a risk we would not be indemnified. Any personal injury or product liability claim made against us, whether or not it has merit, could be time consuming and costly to defend, resulting in adverse publicity, or damage to our reputation, and have an adverse effect on our results of operations. In addition, any negative publicity involving our vendors, employees and other parties who are not within our control could negatively impact us.
Our business operations could be disrupted if our information technology systems fail to perform adequately or we are unable to protect the integrity and security of our customers' information.
We depend largely upon our information technology systems in the conduct of all aspects of our operations. If our information technology systems fail to perform as anticipated, we could experience difficulties in virtually any area of our operations, including but not limited to replenishing inventories or in delivering our products to store locations in response to consumer demands. In addition, we are in the process of replacing our enterprise resource planning, or "ERP," system and commenced pilot market implementation of the point-of-sale and supply chain functionality in August 2012. As the new system is implemented, we may experience difficulties in transitioning to the new system (or any upgrades to that system), including loss of data and decreases in productivity as our personnel become familiar with new systems. Additionally, until all of our markets are operating on the new system, we
29
will be required to operate and support the old system and the new system concurrently, which may increase costs and otherwise affect our ability to operate our business. If we experience difficulties in implementing new or upgraded information systems or experience significant system failures, or if we are unable to successfully modify our information systems to respond to changes in our business needs, our ability to run our business could be adversely affected. It is also possible that our competitors could develop better platforms than ours, which could negatively impact our internet sales. Any of these or other systems-related problems could, in turn, adversely affect our sales and profitability.
In addition, in the ordinary course of our business, we collect and store certain personal information from individuals, such as our customers and suppliers, and we process customer payment card and check information, including via our internet platform. Computer hackers may attempt to penetrate our computer system and, if successful, misappropriate personal information, payment card or check information or confidential Company business information. In addition, a Company employee, contractor or other third party with whom we do business may attempt to circumvent our security measures in order to obtain such information and may purposefully or inadvertently cause a breach involving such information. Any failure to maintain the security of our customers' confidential information, or data belonging to us or our suppliers, could put us at a competitive disadvantage, result in deterioration in our customers' confidence in us, subject us to potential litigation and liability, and fines and penalties, resulting in a possible material adverse impact on our business, results of operations, cash flows and financial performance.
We may be responsible for theft and other liabilities at leased properties that we have vacated prior to the expiration of the lease term.
From time to time, we may vacate a leased facility prior to the expiration of the lease term. Unless otherwise agreed by the landlord, we will continue to be responsible as the tenant under any such lease, which may include liability for any theft or other damage to the leased property. Our current insurance policy does not cover our liability for theft or certain other damages at vacated properties, and we have not identified additional insurance policies at commercially reasonable rates that would cover this exposure.
Risks Related to Our Franchises
A portion of our income is generated from our franchisees and our income could decrease if our franchisees do not conduct their operations profitably.
As of July 31, 2012, approximately 13% of our stores were operated by franchisees. During fiscal 2009, fiscal 2010, fiscal 2011 and the first twenty-six weeks of fiscal 2012, we derived $2.1 million, $3.2 million, $4.7 million and $2.5 million, respectively, from franchise fees and royalties. Franchisees are independent contractors and are not our employees. We provide training and support to franchisees, but the quality of franchised store operations may be diminished by any number of factors beyond our control. The closing of franchised stores, the failure of franchisees to comply with our standard operating procedures and effectively run their operations or the failure of franchisees to hire and adequately train qualified managers and other personnel could adversely affect our image and reputation, and the image and reputation of other franchisees, and could reduce the amount of our revenues and our franchise revenues, which could result in lower franchise fees and royalties to us. These factors could have a material adverse effect on our financial condition and results of operations. In addition, litigation with franchisees that may arise from time to time could be costly and the outcome thereof would be difficult to predict.
30
We may be unable to audit or otherwise independently monitor the results of our franchisees, which could adversely affect our results of operations.
Franchisees pay us franchise fees and royalties as a percentage of their gross revenues. Although the agreements with our franchisees give us the right to audit their books and records, we may not be able to audit or otherwise readily and independently monitor franchisee performance on a regular basis or at all. As a result, we may experience delays or failures in discovering and/or recouping underpayments. In addition, to the extent that we rely on the integrity of the financial and other information from our franchisees, we may experience difficulties with respect to internal control, measurement and reporting of our franchise fee and royalty receipts and receivables.
The existence of franchisees in some of our markets may restrict our ability to grow in those markets through acquisitions or organically.
We enter into franchise agreements with our franchisees which, among other things, limit our ability to compete with the franchisees in the markets in which they operate. If we determine at some point in the future that we would like to grow in those markets through acquisitions or organically, our ability to do so may be substantially restricted under the franchise agreements.
Risks Related to this Offering and Our Stock
If we fail to maintain proper and effective internal controls, our ability to produce accurate and timely financial statements could be impaired, which could result in a loss of investor confidence in our reported results and a decline in our stock price.
The Sarbanes-Oxley Act of 2002 requires, among other things, that we maintain effective internal control over financial reporting and disclosure controls and procedures. In particular, we must perform system and process evaluation and testing of our internal control over financial reporting to allow management and, to the extent required, our independent registered public accounting firm to report on the effectiveness of our internal control over financial reporting, as required by Section 404 of the Sarbanes-Oxley Act of 2002, with auditor attestation of the effectiveness of our internal controls, beginning with our Annual Report on Form 10-K for the fiscal year ending January 29, 2013. If we are not able to comply with the requirements of Section 404 in a timely manner, or if we or our independent registered public accounting firm identify deficiencies in our internal control over financial reporting that are deemed to be material weaknesses, the market price of shares of our common stock could decline and we could be subject to sanctions or investigations by the NASDAQ Global Select Market, the Securities and Exchange Commission or other regulatory authorities, which would require additional financial and management resources.
Our ability to successfully implement our business plan and comply with Section 404 requires us to be able to prepare timely and accurate financial statements. Any delay in the implementation of, or disruption in the transition to, new or enhanced systems, procedures or controls may cause our operations to suffer. If there is such a delay, we may be unable to conclude that our internal control over financial reporting is effective and to obtain an unqualified report on internal controls from our auditors if required under Section 404 of the Sarbanes-Oxley Act of 2002. Moreover, we cannot be certain that these measures would ensure that we implement and maintain adequate controls over our financial processes and reporting in the future. Even if we were to conclude, and our auditors were to concur, that our internal control over financial reporting provided reasonable assurance regarding the reliability of financial reporting and the preparation of financial statements for external purposes in accordance with U.S. GAAP, because of its inherent limitations, internal control over financial reporting may not prevent or detect fraud or misstatements. This, in turn, could have an adverse impact on the trading price of our shares of common stock and could adversely affect our ability to access the capital markets.
31
Because we have no current plans to pay cash dividends on our common stock for the foreseeable future, you may not receive any return on investment unless you sell your common stock for a price greater than that which you paid for it.
We may retain future earnings, if any, for future operations, expansion and debt repayment and have no current plans to pay any cash dividends for the foreseeable future. Any decision to declare and pay dividends in the future will be made at the discretion of our board of directors and will depend on, among other things, our results of operations, financial condition, cash requirements, contractual restrictions and other factors that our board of directors may deem relevant. In addition, our ability to pay dividends may be limited by covenants of any existing and future outstanding indebtedness we or our subsidiaries incur, including the 2007 Senior Credit Facility (described in "Description of Certain Indebtedness"). As a result, you may not receive any return on an investment in our common stock unless you sell our common stock for a price greater than that which you paid for it.
Our stock price could be extremely volatile and, as a result, you may not be able to resell your shares at or above the price you paid for them.
Since our initial public offering in November 2011 through September 7, 2012, the price of our common stock, as reported by NASDAQ, has ranged from a low of $21.03 on November 21, 2011 to a high of $48.18 on April 17, 2012. In addition, the stock market in general, and the market for stocks of some specialty retailers in particular, has been highly volatile. As a result, the market price of our common stock is likely to be similarly volatile, and investors in our common stock may experience a decrease, which could be substantial, in the value of their stock, including decreases unrelated to our operating performance or prospects, and could lose part or all of their investment. The price of our common stock could be subject to wide fluctuations in response to a number of factors, including those described elsewhere in this prospectus and others such as:
- •
- variations in our operating performance and the performance of our competitors;
- •
- actual or anticipated fluctuations in our quarterly or annual operating results;
- •
- changes in our net sales, comparable-store sales or earnings estimates or recommendations by securities
analysts;
- •
- publication of research reports by securities analysts about us or our competitors or our industry;
- •
- our failure or the failure of our competitors or vendors to meet analysts' projections or guidance that we or our
competitors or vendors may give to the market;
- •
- additions and departures of key personnel;
- •
- strategic decisions by us or our competitors or vendors, such as acquisitions, divestitures, spin-offs, joint
ventures, strategic investments or changes in business strategy;
- •
- the passage of legislation or other regulatory developments affecting us or our industry;
- •
- speculation in the press or investment community;
- •
- changes in accounting principles;
- •
- terrorist acts, acts of war or periods of widespread civil unrest; and
- •
- changes in general market and economic conditions.
As we are a specialty retailer in a single industry, we are especially vulnerable to these factors to the extent that they affect our industry or our products, or to a lesser extent our markets. Other retailers with more diversified product offerings may not be similarly at risk. For example, department stores that experience adverse developments regarding their bedding products may be better able to
32
absorb the adverse effects. In the past, securities class action litigation has often been initiated against companies following periods of volatility in their stock price. This type of litigation could result in substantial costs and divert our management's attention and resources, and could also require us to make substantial payments to satisfy judgments or to settle litigation.
We may fail to meet publicly announced financial guidance or other expectations about our business, which could cause our stock to decline in value.
We typically provide forward looking financial guidance when we announce our financial results from the prior quarter. We undertake no obligation to update such guidance at any time. There are a number of reasons why we might fail to meet financial guidance and other expectations about our business, including, but not limited to, factors described herein in other risk factors. If we fail to meet such financial guidance and other expectations, our stock could decline in value.
There may be sales of a substantial amount of our common stock after this offering by our current stockholders, and these sales could cause the price of our common stock to fall.
As of September 19, 2012, there were 33,768,828 shares of common stock outstanding. Following the completion of this offering, approximately 55.47% and 7.41% of our outstanding common stock (or approximately 53.62% and 7.17% if the underwriters exercise in full their option to purchase additional shares from certain of the selling stockholders) will be held by funds or individuals associated with J.W. Childs and our directors and executive officers, respectively.
We expect that the selling stockholders, our directors and our executive officers will enter into a lock-up agreement with Barclays Capital Inc. and UBS Securities LLC, on behalf of the underwriters, which regulates their sales of our common stock for a period of 90 days after the date of this prospectus, subject to certain exceptions and automatic extensions in certain circumstances.
Sales of substantial amounts of our common stock in the public market after this offering, or the perception that such sales will occur, could adversely affect the market price of our common stock and make it difficult for us to raise funds through securities offerings in the future. The shares offered by this prospectus will be eligible for immediate sale in the public market without restriction by persons other than our affiliates.
In addition, beginning 90 days after the date of this prospectus, subject to certain exceptions and automatic extensions in certain circumstances, holders of 18,732,910 shares of our common stock may require us to register their shares for resale under the federal securities laws, and holders of 2,462,325 additional shares of our common stock would be entitled to have their shares included in any such registration statement, all subject to reduction upon the request of the underwriter of the offering, if any. See "Related Party Transactions—Registration Rights Agreement." Registration of those shares would allow the holders to immediately resell their shares in the public market. Any such sales or anticipation thereof could cause the market price of our common stock to decline.
Provisions in our charter documents and Delaware law may deter takeover efforts that you feel would be beneficial to stockholder value.
Our certificate of incorporation and bylaws and Delaware law contain provisions which could make it harder for a third party to acquire us, even if doing so might be beneficial to our stockholders. These provisions include a classified board of directors and limitations on actions by our stockholders. In addition, our board of directors has the right to issue preferred stock without stockholder approval that could be used to dilute a potential hostile acquirer. Delaware law also imposes some restrictions on mergers and other business combinations between us and any holder of 15% or more of our outstanding common stock. As a result, you may lose your ability to sell your stock for a price in excess
33
of the prevailing market price due to these protective measures and efforts by stockholders to change the direction or management of the company may be unsuccessful. See "Description of Capital Stock."
If you purchase shares in this offering, you will suffer immediate and substantial dilution.
If you purchase shares of our common stock in this offering, you will incur immediate and substantial dilution in the pro forma tangible book value of your stock, which would have been $37.82 per share as of July 31, 2012 based on an assumed offering price of $32.54 per share (the closing price of our common stock on September 18, 2012), because the price that you pay will be substantially greater than the net tangible book value per share of the shares you acquire. In addition, you will experience additional dilution upon (i) the exercise of any outstanding and future grants of options and warrants to purchase our common stock and (ii) future grants of restricted stock or other equity awards under our stock incentive plans, including our Omnibus Plan. To the extent we raise additional capital by issuing equity securities, our stockholders will also experience substantial additional dilution.
34
CAUTIONARY NOTE REGARDING FORWARD-LOOKING STATEMENTS
This prospectus contains forward-looking statements within the meaning of federal securities laws that relate to future events or our future financial performance. In many cases, you can identify forward-looking statements by terminology such as "may," "would," "should," "expect," "plan," "anticipate," "believe," "estimate," "predict," "intend," "potential" or "continue" or the negative of these terms or other comparable terminology. These forward-looking statements are made based on our management's expectations and beliefs concerning future events affecting us and are subject to uncertainties and factors relating to our operations and business environment, all of which are difficult to predict and many of which are beyond our control. These uncertainties and other factors could cause our actual results to differ materially from those matters expressed or implied by these forward-looking statements.
Although we believe that the expectations reflected in the forward-looking statements are reasonable, we cannot guarantee future results, levels of activity, performance or achievements. Important factors that may cause actual results to differ materially from the results expressed or implied by these forward-looking statements are set forth under "Risk Factors." All forward-looking statements in this prospectus are based on information available to us on the date of this prospectus. We undertake no obligation to publicly update or revise any of the forward-looking statements, whether as a result of new information, future events or otherwise.
Some of the important factors that could cause our actual results, performance or financial condition to differ materially from expectations are:
- •
- downturns in the economy and a reduction in discretionary spending by consumers;
- •
- our ability to profitably open and operate new stores;
- •
- our intent to aggressively open additional stores in our existing markets;
- •
- our relationship with certain mattress manufacturers as our primary suppliers;
- •
- our dependence on a few key employees;
- •
- the possible impairment of our goodwill or other acquired intangible assets;
- •
- the effect of our planned growth and the integration of our acquisitions on our business infrastructure;
- •
- the impact of seasonality on our financial results and comparable-store sales;
- •
- fluctuations in our comparable-store sales from quarter to quarter;
- •
- our ability to raise adequate capital to support our expansion strategy;
- •
- our future expansion into new, unfamiliar markets;
- •
- our success in pursuing strategic acquisitions;
- •
- the effectiveness and efficiency of our advertising expenditures;
- •
- our success in keeping warranty claims and comfort exchange return rates within acceptable levels;
- •
- our ability to deliver our products in a timely manner;
- •
- our status as a holding company with no business operations;
- •
- our ability to anticipate consumer trends;
- •
- heightened competition;
35
- •
- changes in applicable regulations;
- •
- risks related to our franchises, including our lack of control over their operations, their ability to finance and open
new stores and our liabilities if they default on note or lease obligations;
- •
- risks related to this offering and our stock; and
- •
- other factors discussed under "Risk Factors" and elsewhere in this prospectus.
We will not receive any proceeds from the sale of shares of our common stock by the selling stockholders. We have agreed to pay certain expenses related to this offering, which we estimate to be approximately $580,000.
The selling stockholders in this offering include (i) funds associated with Neuberger Berman Group, LLC, which collectively beneficially owned approximately 8.98% of our outstanding common stock as of September 19, 2012; (ii) funds associated with J.W. Childs, which collectively beneficially owned approximately 59.92% of our outstanding common stock as of September 19, 2012 and are affiliated with directors of our company; and (iii) certain members of management. See "Principal and Selling Stockholders."
MARKET PRICE OF OUR COMMON STOCK
Our common stock has been listed on the NASDAQ Global Select Market under the symbol "MFRM" since November 18, 2011. Prior to that time, there was no public market for our common stock. The following table sets forth for the periods indicated the high and low sale prices of our common stock on the NASDAQ Global Select Market.
Fiscal Quarter
|
High | Low | |||||
|---|---|---|---|---|---|---|---|
2011 |
|||||||
Fourth quarter (from November 18, 2011 through January 31, 2012) |
$ | 33.60 | $ | 21.03 | |||
2012 |
|||||||
First quarter (from February 1, 2012 through May 1, 2012) |
$ | 48.18 | $ | 30.30 | |||
Second quarter (from May 2, 2012 through July 31, 2012) |
$ | 41.54 | $ | 22.82 | |||
Third quarter (from August 1, 2012 through September 18, 2012) |
$ | 33.76 | $ | 26.42 | |||
We have not paid cash dividends since our acquisition by investment funds associated with J.W. Childs in fiscal 2006. We anticipate that we will retain future earnings, if any, to finance the continued development and expansion of our business. We do not anticipate paying cash dividends in the foreseeable future. Additionally, because we are a holding company, our ability to pay dividends is limited by the ability of our subsidiaries to pay dividends or make distributions to us, including restrictions under the terms of the 2007 Senior Credit Facility and other agreements governing our indebtedness outstanding from time to time. Any future determination with respect to the payment of dividends will be at the discretion of our board of directors and will be dependent upon, among other things, our financial condition, results of operations, capital requirements, the terms of our then existing indebtedness, general economic conditions and other factors considered relevant by our board of directors.
36
The following table sets forth our cash and cash equivalents and capitalization as of July 31, 2012. This table should be read in conjunction with the information provided in "Selected Consolidated Financial and Operating Data," "Management's Discussion and Analysis of Financial Condition and Results of Operations" and our consolidated financial statements and related notes appearing elsewhere in this prospectus.
| |
As of July 31, 2012 | |||
|---|---|---|---|---|
| |
(in thousands, except share and per share amounts) |
|||
Cash and cash equivalents |
$ | 6,188 | ||
2007 Senior Credit Facility, including current portion |
$ | 232,216 | ||
Other long-term debt, including current portion |
14 | |||
Total debt |
232,230 | |||
Stockholders' Equity |
||||
Preferred stock, $0.001 par value; 5,000,000 shares authorized, no shares issued or outstanding |
— | |||
Common stock, $0.01 par value; 120,000,000 shares authorized, 33,768,828 shares issued and outstanding |
338 | |||
Additional paid-in capital |
362,719 | |||
Accumulated deficit |
(117,975 | ) | ||
Total stockholders' equity |
245,082 | |||
Total capitalization |
$ | 477,312 | ||
37
UNAUDITED PRO FORMA CONSOLIDATED FINANCIAL STATEMENTS
The unaudited pro forma consolidated statements of operations for the fiscal year ended January 31, 2012 and for the twenty-six weeks ended July 31, 2012 are unaudited and have been derived from our historical consolidated financial statements included elsewhere in this prospectus as adjusted to give effect to the acquisition of MGHC Holding Corporation (which operated Mattress Giant stores) ("MGHC Holding"), as if the acquisition had occurred on February 2, 2011 with respect to the pro forma consolidated statements of operations.
The unaudited pro forma adjustments are based on available information and certain assumptions that we believe are reasonable and are described in the accompanying notes, which should be read in conjunction with these unaudited pro forma consolidated financial statements. The unaudited pro forma consolidated financial statements should be read in conjunction with the information contained in "Selected Consolidated Financial and Operational Data," "Management's Discussion and Analysis of Financial Condition and Results of Operations" and our consolidated financial statements and the notes thereto included elsewhere in this prospectus.
The unaudited pro forma financial statements are for illustrative and informational purposes only and should not be considered indicative of the results that would have been achieved had the transaction been consummated on the date or for the periods indicated. Also, the unaudited pro forma consolidated financial statements should not be viewed as indicative of statement of operations data for any future period.
38
MATTRESS FIRM HOLDING CORP.
UNAUDITED PRO FORMA CONSOLIDATED STATEMENT OF OPERATIONS
FISCAL YEAR ENDED JANUARY 31, 2012
| |
Fiscal Year Ended January 31, 2012 Mattress Firm Holding Corp. Historical |
Fiscal Year Ended December 31, 2011 MGHC Holding Corporation Historical |
Pro Forma Adjustments |
Pro Forma Combined |
|||||||||
|---|---|---|---|---|---|---|---|---|---|---|---|---|---|
| |
(in thousands, except share and per share amounts) |
||||||||||||
Net sales |
$ | 703,910 | $ | 128,155 | $ | 23,762 | (a) | $ | 855,827 | ||||
Cost of sales |
428,018 | 93,405 | 18,245 | (b) | 539,668 | ||||||||
Gross profit from retail operations |
275,892 | 34,750 | 5,517 | 316,159 | |||||||||
Franchise fees and royalty income |
4,697 | — | — | 4,697 | |||||||||
|
280,589 | 34,750 | 5,517 | 320,856 | |||||||||
Sales and marketing expenses |
167,605 | 27,683 | 5,215 | (a) | 200,503 | ||||||||
General and administrative expenses |
51,684 | 12,627 | 1,005 | (c) | 65,316 | ||||||||
Intangible asset impairment charge |
— | 19,049 | (19,049 | )(d) | — | ||||||||
Loss on store closings and impairment of store assets |
759 | 546 | 56 | (a) | 1,361 | ||||||||
Total operating expenses |
220,048 | 59,905 | (12,773 | ) | 267,180 | ||||||||
Income (loss) from operations |
60,541 | (25,155 | ) | 18,290 | 53,676 | ||||||||
Interest income |
(9 | ) | — | — | (9 | ) | |||||||
Interest expense |
29,310 | 365 | (240 | )(e) | 29,435 | ||||||||
Loss from debt extinguishment |
5,704 | — | — | 5,704 | |||||||||
Miscellaneous income, net |
— | (95 | ) | (105 | )(a) | (200 | ) | ||||||
|
35,005 | 270 | (345 | ) | 34,930 | ||||||||
Income (loss) before income taxes |
25,536 | (25,425 | ) | 18,635 | 18,746 | ||||||||
Income tax benefit |
(8,815 | ) | (6,717 | ) | 7,230 | (f) | (8,302 | ) | |||||
Net income (loss) |
$ | 34,351 | $ | (18,708 | ) | $ | 11,405 | $ | 27,048 | ||||
Basic net income per common share |
$ | 1.40 | $ | 1.10 | |||||||||
Diluted net income per common share |
$ | 1.40 | $ | 1.10 | |||||||||
Basic weighted average shares outstanding |
24,586,274 | 24,586,274 | |||||||||||
Diluted weighted average shares outstanding |
24,586,274 | 24,586,274 | |||||||||||
- (a)
- Represents
activity re-classified from discontinued operations of MGHC Holding to continuing operations for three markets
consisting of 55 Mattress Giant stores of MGHC Holding acquired by the Company in November 2011.
- (b)
- Represents the following adjustments to cost of sales:
Reclassification from discontinued to continuing operations (see note a) |
$ | 18,064 | ||
Depreciation expense due to increase in fair value of property and equipment |
181 | |||
Adjustment to cost of sales |
$ | 18,245 | ||
39
MATTRESS FIRM HOLDING CORP.
UNAUDITED PRO FORMA CONSOLIDATED STATEMENT OF OPERATIONS (Continued)
FISCAL YEAR ENDED JANUARY 31, 2012
- (c)
- Represents the following adjustments to general and administrative expenses:
Reclassification from discontinued to continuing operations (see note a) |
$ | 731 | ||
Depreciation expense due to increase in fair value of property and equipment |
18 | |||
Amortization expense related to Mattress Giant trade name |
256 | |||
Adjustment to general and administrative expenses |
$ | 1,005 | ||
- (d)
- Represents
the elimination of the historical MGHC Holding intangible asset impairment charge.
- (e)
- Represents the following adjustments to interest expense:
Elimination of MGHC Holding interest expense on debt paid at closing |
$ | (365 | ) | |
Interest on purchase consideration funded with revolving borrowings |
125 | |||
Adjustment to interest expense |
$ | (240 | ) | |
- (f)
- Reflects normalized federal and state effective tax rate of 38.8%.
40
MATTRESS FIRM HOLDING CORP.
UNAUDITED PRO FORMA CONSOLIDATED STATEMENT OF OPERATIONS
TWENTY-SIX WEEKS ENDED JULY 31, 2012
| |
Twenty-Six Weeks Ended July 31, 2012 Mattress Firm Holding Corp. (Historical) |
Thirteen Weeks Ended March 31, 2012 MGHC Holding Corporation (Historical) |
Pro Forma Adjustments |
Pro Forma Combined |
|||||||||
|---|---|---|---|---|---|---|---|---|---|---|---|---|---|
| |
(in thousands, except share and per share data) |
||||||||||||
Net sales |
$ | 471,832 | $ | 31,825 | $ | — | $ | 503,657 | |||||
Cost of sales |
287,126 | 22,791 | 45 | (a) | 309,962 | ||||||||
Gross profit from retail operations |
184,706 | 9,034 | (45 | ) | 193,695 | ||||||||
Franchise fees and royalty income |
2,532 | — | — | 2,532 | |||||||||
|
187,238 | 9,034 | (45 | ) | 196,227 | ||||||||
Sales and marketing expenses |
115,692 | 6,655 | — | 122,347 | |||||||||
General and administrative expenses |
35,878 | 2,911 | (1,745 | )(b) | 37,044 | ||||||||
Loss on store closings and impairment of store assets |
71 | — | — | 71 | |||||||||
Total operating expenses |
151,641 | 9,566 | (1,745 | ) | 159,462 | ||||||||
Income (loss) from operations |
35,597 | (532 | ) | 1,700 | 36,765 | ||||||||
Interest income |
(1 | ) | (1 | ) | — | (2 | ) | ||||||
Interest expense |
4,289 | 97 | (97 | )(c) | 4,289 | ||||||||
Miscellaneous income, net |
— | (182 | ) | — | (182 | ) | |||||||
|
4,288 | (86 | ) | (97 | ) | 4,105 | |||||||
Income (loss) before income taxes |
31,309 | (446 | ) | 1,797 | 32,660 | ||||||||
Income tax expense |
11,488 | 33 | 692 | (d) | 12,213 | ||||||||
Net income (loss) |
$ | 19,821 | $ | (479 | ) | $ | 1,105 | $ | 20,447 | ||||
Basic net income per common share |
$ | 0.59 | $ | 0.61 | |||||||||
Diluted net income per common share |
$ | 0.59 | $ | 0.60 | |||||||||
Basic weighted average shares outstanding |
33,768,828 |
33,768,828 |
|||||||||||
Diluted weighted average shares outstanding |
33,867,158 | 33,867,158 | |||||||||||
- (a)
- Represents
depreciation expense due to increase in fair value of property and equipment related to cost of sales.
- (b)
- Represents the following adjustments to general and administrative expenses:
Eliminate direct transaction costs of the acquisition |
$ | (1,814 | ) | |
Depreciation expense due to increase in fair value of property and equipment |
5 | |||
Amortization expense related to Mattress Giant trade name |
64 | |||
Adjustment to general and administrative expenses |
$ | (1,745 | ) | |
- (c)
- Elimination
of MGHC Holding interest expense on debt paid at closing.
- (d)
- Reflects normalized federal and state effective tax rate of 38.5%.
41
SELECTED CONSOLIDATED FINANCIAL AND OPERATING DATA
The following table sets forth a summary of our selected consolidated financial data. We derived the selected balance sheet data as of February 1, 2011 and January 31, 2012, and the statement of operations data and per share data for the fiscal years ended February 2, 2010, February 1, 2011 and January 31, 2012, from our audited consolidated financial statements included elsewhere in this prospectus. The selected balance sheet data as of January 29, 2008, February 3, 2009 and February 2, 2010, and the statement of operations data and per share data for the fiscal years ended January 29, 2008 and February 3, 2009, have been derived from our consolidated financial statements for such years, which are not included in this prospectus. The historical balance sheet data as of August 2, 2011 and July 31, 2012 and the statement of operations data and per share data for the twenty-six weeks ended August 2, 2011 and July 31, 2012 are derived from our unaudited consolidated financial statements included elsewhere in this prospectus.
Our fiscal year consists of 52 or 53 weeks, ending on the Tuesday nearest to January 31. Each fiscal year is described by the period of the year that comprises the majority of the fiscal year period. For example, the fiscal year ended January 31, 2012 is described as "fiscal 2011." All fiscal years presented include 52 weeks of operations, except fiscal 2008, which includes 53 weeks.
The selected consolidated financial data set forth below are not necessarily indicative of future results of future operations and should be read in conjunction with the discussion under "Management's Discussion and Analysis of Financial Condition and Results of Operations" and other financial information included elsewhere in this prospectus.
| |
|
|
|
|
|
Twenty-Six Weeks Ended | ||||||||||||||||
|---|---|---|---|---|---|---|---|---|---|---|---|---|---|---|---|---|---|---|---|---|---|---|
| |
Fiscal Year | |||||||||||||||||||||
| |
August 2, 2011 |
July 31, 2012 |
||||||||||||||||||||
| |
2007 | 2008 | 2009 | 2010 | 2011 | |||||||||||||||||
| |
(unaudited) |
|
|
|
|
(unaudited) |
||||||||||||||||
| |
(dollar amounts in thousands, except per share data and store units) |
|||||||||||||||||||||
Statement of Operations: |
||||||||||||||||||||||
Net sales |
$ | 458,171 | $ | 433,258 | $ | 432,250 | $ | 494,115 | $ | 703,910 | $ | 331,838 | $ | 471,832 | ||||||||
Cost of sales |
270,422 | 287,744 | 280,506 | 313,962 | 428,018 | 205,227 | 287,126 | |||||||||||||||
Gross profit from retail operations |
187,749 | 145,514 | 151,744 | 180,153 | 275,892 | 126,611 | 184,706 | |||||||||||||||
Franchise fees and royalty income |
2,007 | 2,053 | 2,100 | 3,195 | 4,697 | 2,072 | 2,532 | |||||||||||||||
|
189,756 | 147,567 | 153,844 | 183,348 | 280,589 | 128,683 | 187,238 | |||||||||||||||
Sales and marketing expenses |
118,393 | 94,050 | 95,305 | 113,963 | 167,605 | 80,718 | 115,692 | |||||||||||||||
General and administrative expenses |
38,305 | 33,781 | 32,336 | 34,111 | 51,684 | 24,123 | 35,878 | |||||||||||||||
Goodwill impairment charge |
43,611 | 100,332 | — | 536 | — | — | — | |||||||||||||||
Intangible asset impairment charge |
— | 4,700 | — | — | — | — | — | |||||||||||||||
Loss on store closings and impairment of store assets(1) |
1,163 | 7,419 | 5,179 | 2,486 | 759 | 39 | 71 | |||||||||||||||
Total operating expenses |
201,472 | 240,282 | 132,820 | 151,096 | 220,048 | 104,880 | 151,641 | |||||||||||||||
Income (loss) from operations |
(11,716 | ) | (92,715 | ) | 21,024 | 32,252 | 60,541 | 23,803 | 35,597 | |||||||||||||
Interest income |
(7 | ) | (9 | ) | (12 | ) | (6 | ) | (9 | ) | (3 | ) | (1 | ) | ||||||||
Interest expense(2) |
30,565 | 28,342 | 27,126 | 31,063 | 29,310 | 16,949 | 4,289 | |||||||||||||||
Loss (gain) from debt extinguishment(3) |
— | — | (2,822 | ) | — | 5,704 | 1,873 | — | ||||||||||||||
|
30,558 | 28,333 | 24,292 | 31,057 | 35,005 | 18,819 | 4,288 | |||||||||||||||
Income (loss) before income taxes |
(42,274 | ) | (121,048 | ) | (3,268 | ) | 1,195 | 25,536 | 4,984 | 31,309 | ||||||||||||
Income tax expense (benefit) |
(665 | ) | 3,806 | 1,405 | 846 | (8,815 | ) | 319 | 11,488 | |||||||||||||
Net income (loss) |
$ | (41,609 | ) | $ | (124,854 | ) | $ | (4,673 | ) | $ | 349 | $ | 34,351 | $ | 4,665 | $ | 19,821 | |||||
42
| |
|
|
|
|
|
Twenty-Six Weeks Ended | ||||||||||||||||
|---|---|---|---|---|---|---|---|---|---|---|---|---|---|---|---|---|---|---|---|---|---|---|
| |
Fiscal Year | |||||||||||||||||||||
| |
August 2, 2011 |
July 31, 2012 |
||||||||||||||||||||
| |
2007 | 2008 | 2009 | 2010 | 2011 | |||||||||||||||||
| |
(unaudited) |
|
|
|
|
(unaudited) |
||||||||||||||||
| |
(dollar amounts in thousands, except per share data and store units) |
|||||||||||||||||||||
Per Share Data: |
||||||||||||||||||||||
Basic net income (loss) per common share(4) |
$ | (1.86 | ) | $ | (5.57 | ) | $ | (0.21 | ) | $ | 0.02 | $ | 1.40 | $ | 0.21 | $ | 0.59 | |||||
Diluted net income (loss) per common share(4) |
$ | (1.86 | ) | $ | (5.57 | ) | $ | (0.21 | ) | $ | 0.02 | $ | 1.40 | $ | 0.21 | $ | 0.59 | |||||
As adjusted basic net income (loss) per common share(5) |
$ | (1.86 | ) | $ | (5.57 | ) | $ | (0.21 | ) | $ | 0.02 | $ | 1.40 | $ | 0.21 | $ | 0.73 | |||||
As adjusted diluted net income (loss) per common share(5) |
$ | (1.86 | ) | $ | (5.57 | ) | $ | (0.21 | ) | $ | 0.02 | $ | 1.40 | $ | 0.21 | $ | 0.73 | |||||
Basic weighted average shares outstanding(4) |
22,399,952 | 22,399,952 | 22,399,952 | 22,399,952 | 24,586,274 | 22,399,952 | 33,768,828 | |||||||||||||||
Diluted weighted average shares outstanding(4) |
22,399,952 | 22,399,952 | 22,399,952 | 22,399,952 | 24,586,274 | 22,399,952 | 33,867,158 | |||||||||||||||
Other Financial Data: |
||||||||||||||||||||||
EBITDA(6) |
$ | 784 | $ | (75,629 | ) | $ | 41,275 | $ | 49,027 | $ | 74,005 | $ | 31,462 | $ | 46,959 | |||||||
Adjusted EBITDA(7) |
$ | 53,228 | $ | 40,168 | $ | 46,323 | $ | 57,095 | $ | 87,487 | $ | 34,695 | $ | 55,001 | ||||||||
Adjusted EBITDA, percentage of net sales |
11.6 | % | 9.3 | % | 10.7 | % | 11.6 | % | 12.4 | % | 10.5 | % | 11.7 | % | ||||||||
Income from operations, percentage of net sales |
(2.6 | )% | (21.4 | )% | 4.9 | % | 6.5 | % | 8.6 | % | 7.2 | % | 7.5 | % | ||||||||
As adjusted income (loss) from operations(5) |
$ | (11,716 | ) | $ | (92,715 | ) | $ | 21,024 | $ | 32,252 | $ | 60,541 | $ | 23,803 | $ | 42,646 | ||||||
As adjusted income (loss) from operations, percentage of net sales |
(2.6 | )% | (21.4 | )% | 4.9 | % | 6.5 | % | 8.6 | % | 7.2 | % | 9.0 | % | ||||||||
Capital expenditures |
$ | 26,665 | $ | 23,888 | $ | 10,863 | $ | 27,330 | $ | 34,356 | $ | 11,681 | $ | 31,667 | ||||||||
Depreciation and amortization |
$ | 12,126 | $ | 16,209 | $ | 16,286 | $ | 15,448 | $ | 17,450 | $ | 8,717 | $ | 10,175 | ||||||||
Operational Data(8): |
||||||||||||||||||||||
Comparable-stores sales growth (decline)(9) |
0.3 | % | (23.7 | )% | (4.3 | )% | 6.3 | % | 20.5 | % | 19.2 | % | 10.1 | % | ||||||||
Stores open at period-end |
406 | 464 | 487 | 592 | 729 | 620 | 957 | |||||||||||||||
Average net sales per store unit(10) |
$ | 1,385 | $ | 1,018 | $ | 926 | $ | 962 | $ | 1,107 | $ | 540 | $ | 577 | ||||||||
Balance Sheet Data: |
||||||||||||||||||||||
Working capital |
$ | (28,312 | ) | $ | (18,724 | ) | $ | (8,459 | ) | $ | (7,696 | ) | $ | 49,258 | $ | 1,598 | $ | 8,880 | ||||
Total assets |
$ | 593,289 | $ | 478,000 | $ | 465,252 | $ | 513,633 | $ | 613,481 | $ | 549,576 | $ | 670,123 | ||||||||
Total debt |
$ | 350,780 | $ | 367,101 | $ | 369,323 | $ | 398,703 | $ | 228,354 | $ | 403,531 | $ | 232,230 | ||||||||
Stockholders' equity (deficit) |
$ | 112,474 | $ | (11,081 | ) | $ | (15,516 | ) | $ | (15,682 | ) | $ | 224,259 | $ | (10,978 | ) | $ | 245,082 | ||||
- (1)
- Includes
a non-cash impairment charge for long-lived assets, consisting primarily of store leasehold costs and
related equipment, to reduce the carrying value to estimated fair value, based on our periodic assessment of whether projected future cash flows of individual stores are sufficient to recover the
carrying value of the related assets, in the amounts of $0.5 million, $6.3 million, $2.3 million, $1.7 million and $0.1 million during fiscal 2007, fiscal 2008,
fiscal 2009, fiscal 2010 and fiscal 2011, respectively.
- (2)
- Interest
expense includes interest that was accrued and paid in kind by adding the interest to the outstanding balance of debt related to our
2009 Loan Facility (defined below), Convertible Notes (defined below) and PIK Notes (defined below) in the amounts of $0.3 million, $2.5 million, $17.7 million,
$23.2 million, $20.6 million and $12.5 million during fiscal 2007, fiscal 2008, fiscal 2009, fiscal 2010, fiscal 2011 and the twenty-six weeks ended August 2,
2011, respectively.
- (3)
- During
fiscal 2009, a gain from debt extinguishment was recognized in connection with the amendment and restatement of the 2009 Loan
Facility. The extinguishment resulted in a $5.8 million downward adjustment of the loan carrying value to its fair value, which was partially offset by the write-off of
$3.0 million of unamortized deferred loan fees. During fiscal 2011, a loss from debt extinguishment in the total amount of $5.7 million was recognized, consisting of $1.9 million
in connection with the $40.2 million prepayment of the 2009 Loan Facility in July 2011, and $3.8 million in connection with (i) the repayment in full of the 2009 Loan Facility,
(ii) the repayment of a portion of the outstanding balance of PIK Notes and the conversion of the remaining outstanding balance of PIK Notes not repaid into shares of our common stock and
(iii) the conversion of the outstanding balance of Convertible Notes into shares of our common stock in connection with the initial public offering in November 2011.
- (4)
- Gives effect to a 227,058-for-one stock split effected on November 3, 2011 resulting in 22,399,952 shares of common stock outstanding immediately prior to the consummation of our initial public offering in November 2011, and the issuance of (i) 6,388,888 shares of the Company's common stock as part of the initial public offering, (ii) 2,205,953 additional shares upon the conversion of the Convertible Notes in connection with the initial public offering and (iii) 2,774,035 additional shares upon the conversion of the PIK Notes in connection with the initial public offering, in each case at a price or conversion rate equal to the initial public offering price of $19.00 per share.
43
- (5)
- In connection with the acquisition of MGHC Holding on May 2, 2012, the Company has incurred acquisition-related costs, which are included in our results of operations, consisting of acquisition-related costs as defined under U.S. GAAP, including advisory, legal, accounting, valuation, and other professional or consulting fees and, in addition, costs of integrating store and warehouse operations and corporate functions that are not expected to recur in future periods, related to the MGHC Holding acquisition. We have provided certain "As Adjusted" financial data to exclude acquisition-related costs as we believe this information facilitates year-over-year comparisons for investors and financial analysts. Our "As Adjusted" data is considered a non-U.S. GAAP financial measure and is not in accordance with, or preferable to, "As Reported" or U.S. GAAP financial data.
| |
Twenty-Six Weeks Ended July 31, 2012 |
|||||||||
|---|---|---|---|---|---|---|---|---|---|---|
| |
As Reported | Acquisition- Related Costs |
As Adjusted | |||||||
| |
(in thousands, except share and per share amounts) |
|||||||||
Income from operations |
$ | 35,597 | $ | 7,049 | $ | 42,646 | ||||
Other expense, net |
4,288 | — | 4,288 | |||||||
Income before income taxes |
31,309 | 7,049 | 38,358 | |||||||
Income tax expense(a) |
11,488 | 2,220 | 13,708 | |||||||
Net income |
$ | 19,821 | $ | 4,829 | $ | 24,650 | ||||
Basic net income per common share |
$ |
0.59 |
$ |
0.14 |
$ |
0.73 |
||||
Diluted net income per common share |
$ | 0.59 | $ | 0.14 | $ | 0.73 | ||||
Basic weighted average shares outstanding |
33,768,828 |
33,768,828 |
33,768,828 |
|||||||
Diluted weighted average shares outstanding |
33,867,158 | 33,867,158 | 33,867,158 | |||||||
- (a)
- Reflects effective income tax rate of 38.5% for fiscal year 2012 and $0.3 million in foregone tax benefits on certain acquisition-related costs considered nondeductible.
- (6)
- EBITDA
represents net income before income tax expense, interest income, interest expense, depreciation and amortization. We have presented
EBITDA because we consider it an important supplemental measure of our performance and believe it is frequently used by analysts, investors and other interested parties in the evaluation of companies
in our industry. Management uses EBITDA as a measurement tool for evaluating our actual operating performance compared to budget and prior periods. Other companies in our industry may calculate EBITDA
differently than we do. EBITDA is not a measure of performance under U.S. GAAP, and should not be considered as a substitute for net income prepared in accordance with U.S. GAAP. EBITDA
has limitations as an analytical tool, and you should not consider it in isolation or as a substitute for analysis of our results as reported under U.S. GAAP. Some of these limitations
are:
- •
- EBITDA does not reflect our cash expenditures, or future requirements, for capital expenditures or contractual commitments;
- •
- EBITDA does not reflect interest expense or the cash requirements necessary to service interest or principal payments on
our debt;
- •
- EBITDA does not reflect tax expense or the cash requirements necessary to pay for tax obligations; and
- •
- Although depreciation and amortization are non-cash charges, the asset being depreciated and amortized will
often have to be replaced in the future, and EBITDA does not reflect any cash requirements for such replacements.
- We
compensate for these limitations by relying primarily on our U.S. GAAP results and using EBITDA only as a supplemental measure.
- (7)
- Adjusted EBITDA is defined as EBITDA, without giving effect to non-cash goodwill and intangible asset impairment charges, gains or losses on store closings and impairment of store assets, gains or losses related to the early extinguishment of debt, financial sponsor fees and expenses, non-cash charges related to stock-based awards and other items that are excluded by management in reviewing the results of operations. We have presented Adjusted EBITDA because we believe that the exclusion of these items is appropriate to provide additional information to investors about our ongoing operating performance excluding certain non-cash and other items and to provide additional information with respect to our ability to comply with various covenants in documents governing our indebtedness and as a means to evaluate our period-to-period results. In evaluating Adjusted EBITDA, you should be aware that in the future we may incur expenses that are the same as or similar to some of the adjustments in this presentation. Our presentation of Adjusted EBITDA should not be construed to imply that our future results will be unaffected by any such adjustments. We have provided this information to analysts, investors and other third parties to enable them to perform more meaningful comparisons of past, present and future operating results and as a means to evaluate the results of our ongoing operations. The Compensation Committee uses Adjusted EBITDA as a performance measure under our short-term incentive programs for our executive officers. In addition, our compliance with certain covenants under our 2007 Senior Credit Facility that are calculated based on similar measures, which differ from Adjusted EBITDA primarily by the inclusion of pro forma results for acquired businesses in those similar measures. Other companies in our industry may calculate Adjusted EBITDA differently than we do. Adjusted EBITDA is not a measure of performance under U.S. GAAP and should not be considered as a substitute for net income prepared in accordance with U.S. GAAP. Adjusted EBITDA has similar limitations as an analytical tool to those set forth in
44
- •
- Adjusted EBITDA does not reflect the cash requirements of closing underperforming stores;
- •
- Adjusted EBITDA does not reflect costs related to management services previously provided by J.W. Childs; and
- •
- Adjusted EBITDA does not reflect certain other costs that may recur in future periods.
note (5) related to the use of EBITDA, and you should not consider it in isolation or as a substitute for analysis of our results as reported under U.S. GAAP. Some of the additional limitations to the use of Adjusted EBITDA are:
- We compensate for these limitations by relying primarily on our U.S. GAAP results and using Adjusted EBITDA only as a supplemental measure. The following table contains a reconciliation of our net income (loss) determined in accordance with U.S. GAAP to EBITDA and Adjusted EBITDA for the periods indicated:
| |
|
|
|
|
|
Twenty-Six Weeks Ended |
||||||||||||||||
|---|---|---|---|---|---|---|---|---|---|---|---|---|---|---|---|---|---|---|---|---|---|---|
| |
Fiscal Year | |||||||||||||||||||||
| |
August 2, 2011 |
July 31, 2012 |
||||||||||||||||||||
| |
2007 | 2008 | 2009 | 2010 | 2011 | |||||||||||||||||
| |
(unaudited) |
|
|
|
|
(unaudited) |
||||||||||||||||
| |
(in thousands) |
|||||||||||||||||||||
Net income (loss) |
$ | (41,609 | ) | $ | (124,854 | ) | $ | (4,673 | ) | $ | 349 | $ | 34,351 | $ | 4,665 | $ | 19,821 | |||||
Income tax (benefit) expense |
(665 | ) | 3,806 | 1,405 | 846 | (8,815 | ) | 319 | 11,488 | |||||||||||||
Interest income |
(7 | ) | (9 | ) | (12 | ) | (6 | ) | (9 | ) | (3 | ) | (1 | ) | ||||||||
Interest expense |
30,565 | 28,342 | 27,126 | 31,063 | 29,310 | 16,949 | 4,289 | |||||||||||||||
Depreciation and amortization |
12,126 | 16,209 | 16,286 | 15,448 | 17,450 | 8,717 | 10,175 | |||||||||||||||
Intangible assets and other amortization |
374 | 877 | 1,143 | 1,327 | 1,718 | 815 | 1,187 | |||||||||||||||
EBITDA |
784 | (75,629 | ) | 41,275 | 49,027 | 74,005 | 31,462 | 46,959 | ||||||||||||||
Goodwill impairment charge |
43,611 | 100,332 | — | 536 | — | — | — | |||||||||||||||
Intangible asset impairment charge |
— | 4,700 | — | — | — | — | — | |||||||||||||||
Loss on store closings and impairment of store assets |
1,163 | 7,419 | 5,179 | 2,486 | 759 | 39 | 71 | |||||||||||||||
Loss (gain) from debt extinguishment |
— | — | (2,822 | ) | — | 5,704 | 1,873 | — | ||||||||||||||
Financial sponsor fees and expenses |
454 | 490 | 395 | 407 | 644 | 192 | 51 | |||||||||||||||
Stock-based compensation |
1,068 | 1,299 | 84 | (515 | ) | 523 | 39 | 1,002 | ||||||||||||||
Vendor new store funds(a) |
332 | 681 | (87 | ) | 1,540 | 3,169 | 300 | 633 | ||||||||||||||
Acquisition related expenses(b) |
5,222 | 138 | 2 | 453 | 886 | 108 | 7,049 | |||||||||||||||
Other(c) |
594 | 738 | 2,297 | 3,161 | 1,797 | 682 | (764 | ) | ||||||||||||||
Adjusted EBITDA |
$ | 53,228 | $ | 40,168 | $ | 46,323 | $ | 57,095 | $ | 87,487 | $ | 34,695 | $ | 55,001 | ||||||||
- (a)
- Adjustment
to recognize vendor funds received upon the opening of a new store in the period opened, rather than over 36-months as
presented in our financial statements, which is consistent with how management has historically reviewed its results of operations.
- (b)
- Non-cash
effect included in net income related to purchase accounting adjustments made to inventories resulting from acquisitions and other
acquisition-related cash costs included in net income, such as direct acquisition costs and costs related to integration of acquired businesses.
- (c)
- Consists of various items that management excludes in reviewing the results of operations, including $1.6 million in fiscal 2010 for the estimated costs of a May 26, 2011 settlement of a lawsuit involving alleged violations of the Fair Labor Standards Act brought in April 2010 by a former employee and a $0.5 million benefit in the twenty-six weeks ended July 31, 2012 for a recovery from the claims-made reversionary fund established to administer the lawsuit settlement.
- (8)
- Operational
data relates to company-operated stores only.
- (9)
- Comparable-store
sales is a measure commonly used in the retail industry, which indicates store performance by measuring the growth in
revenue for certain stores for a particular period over the corresponding period in the prior year. New stores are included in the comparable-store sales calculation beginning in the thirteenth full
month of operation. Acquired stores are included in the comparable-store sales calculation beginning in the first month following the one-year anniversary date of the acquisition. The
comparable-store sales calculation includes sales related to our e-commerce and other comparable sales channels. New stores that are relocated within a two mile radius of a closed store
are included in the comparable-store sales calculation beginning with the first full month of operations by measuring the growth in revenue against the prior year sales of the closed store. Stores
that are closed, other than relocated stores, are removed from the comparable-store sales calculation in the month of closing. Comparable-store sales during fiscal years that are comprised of
53 weeks exclude sales for the fifty-third week of the year. The method of calculating comparable-store sales varies across the retail industry and our method may not be the same as other
retailers' methods.
- (10)
- Calculated using net sales for stores open at both the beginning and the end of the period, excluding temporary "pop-up" stores and sales generated from our website, www.mattressfirm.com.
45
MANAGEMENT'S DISCUSSION AND ANALYSIS OF FINANCIAL
CONDITION AND RESULTS OF OPERATIONS
The following discussion should be read in conjunction with "Selected Consolidated Financial and Operating Data" and our consolidated financial statements and the notes thereto included in this prospectus. The discussion in this section contains forward-looking statements that involve risks and uncertainties. See "Risk Factors" and "Cautionary Note Regarding Forward-Looking Statements" included elsewhere in this prospectus for a discussion of important factors that could cause actual results to differ materially from those described or implied by the forward-looking statements contained herein.
Executive Summary
We operate in the U.S. mattress retail market, in which net sales amounted to $11.4 billion in calendar year 2011. The market is highly fragmented, with no single retailer holding more than an 8% market share and the top ten participants accounting for less than 30% of the total market. According to the most recent information published by Furniture Today, in 2010, mattress specialty retailers had a market share in excess of 43%, which represents the largest share of the market, having more than doubled their share over the past 15 years.
On November 23, 2011, we completed the initial public offering of shares of our common stock pursuant to a registration statement on Form S-1, as amended (File No. 333-174830), which was declared effective on November 17, 2011. Under the registration statement, we registered the offering and sale of up to an aggregate of 6,388,888 shares of common stock (including shares issued pursuant to the underwriters' option to purchase additional shares) at a public offering price of $19.00 per share.
Net sales in fiscal 2010, fiscal 2011 and the twenty-six weeks ended July 31, 2012 improved $61.9 million, $209.8 million and $140.0 million, respectively, from the comparable prior year levels as a result of comparable-store sales growth and the addition of new and acquired store units. We believe that our net sales growth is outpacing our competitors in most of the markets in which we operate and is resulting in increased market share. Net income and other profitability measures improved during fiscal 2010, fiscal 2011 and the twenty-six weeks ended July 31, 2012. The improvements resulted from the net sales growth and our ability to gain leverage on certain costs through increasing sales per store, which was partially offset by increases in spending in certain expense categories during the period. Such expenses included advertising and general and administrative expenses. Key results for fiscal 2010, fiscal 2011 and the twenty-six weeks ended July 31, 2012 include:
- •
- Net income increased $15.1 million to $19.8 million for the twenty-six weeks ended
July 31, 2012, compared to $4.7 million for the prior year period. Net income increased $34.1 million to $34.4 million for fiscal 2011 compared to $0.3 million for
fiscal 2010. Net income increased $5.0 million to $0.3 million for fiscal 2010 compared to $(4.7) million for fiscal 2009.
- •
- Income from operations increased $11.8 million to $35.6 million for the twenty-six weeks ended July 31, 2012 compared to $23.8 million for the comparable prior year period. Excluding $7.0 million of acquisition-related costs, adjusted income from operations was $42.6 million for the twenty-six weeks ended July 31, 2012 and adjusted operating margin improved 187 basis points to 9.0% from 7.2% in the comparable prior year period. This operating margin growth for the twenty-six weeks ended July 31, 2012 on an adjusted basis (excluding acquisition-related costs) was driven primarily by a 128 basis-point improvement in gross profit margin and a 87 basis-point improvement in general and administrative expenses. Acquisition-related costs for purposes of management's discussion and analysis, which are included in the results of operations, consists of the acquisition-related costs as defined under U.S. GAAP, including advisory, legal, accounting, valuation, and other professional or consulting fees and, in addition, costs of integrating store and warehouse operations and corporate functions that are not expected to recur in future periods, related to the MGHC Holding acquisition. (Adjusted
46
- •
- Income from operations increased $28.3 million to $60.5 million for fiscal 2011 compared to
$32.3 million for fiscal 2010 and operating margin improved 207 basis points to 8.6% from 6.5% for fiscal 2010. This operating margin growth for fiscal 2011 was driven primarily by 273 and 21
basis-point increases in gross profit margin and franchise fees and royalty income, respectively, offset by 75 and 44 basis-point increases in selling and marketing expenses and general and
administrative expenses, respectively, related to investments made to increase sales. In addition, income from operations included a $1.7 million reduction in loss on store closings and
impairment of store assets to $0.8 million for fiscal 2011 compared to $2.5 million for fiscal 2010, which added 40 basis-points to operating margin for fiscal 2011.
- •
- Net sales increased $140.0 million, or 42.2%, to $471.8 million for the twenty-six weeks ended July 31, 2012, compared to $331.8 million for the prior year period. Comparable-store sales increased 10.1% during the twenty-six weeks ended July 31, 2012. Net sales increased $209.8 million, or 42.5%, to $703.9 million for fiscal 2011, compared to $494.1 million for fiscal 2010. Comparable-store sales increased 20.5% during fiscal 2011. Net sales increased $61.9 million, or 14.3%, to $494.1 million for fiscal 2010, compared to $432.2 million for fiscal 2009. Comparable-store sales increased 6.3% during fiscal 2010.
income from operations is not a performance measure under U.S. GAAP. See "Prospectus Summary—Historical and Unaudited Pro Forma Consolidated Financial and Operating Data" for a definition of adjusted income from operations and a reconciliation of adjusted income from operations to income from operations.)
The components of the net sales were as follows (amounts in millions):
| |
Increase (decrease) in net sales | |||||||||||||||
|---|---|---|---|---|---|---|---|---|---|---|---|---|---|---|---|---|
| |
|
|
|
Twenty-Six Weeks Ended |
||||||||||||
| |
Fiscal 2009 |
Fiscal 2010 |
Fiscal 2011 |
August 2, 2011 |
July 31, 2012 |
|||||||||||
Comparable-store sales |
$ | (17.9 | ) | $ | 26.1 | $ | 99.0 | $ | 44.6 | $ | 32.8 | |||||
New stores |
25.7 | 36.3 | 83.4 | 35.5 | 59.9 | |||||||||||
Acquired stores |
3.2 | 5.4 | 33.0 | 18.3 | 51.4 | |||||||||||
Closed stores |
(4.0 | ) | (5.9 | ) | (5.6 | ) | (2.5 | ) | (4.1 | ) | ||||||
Effect of 53 week year in fiscal 2008 |
(8.0 | ) | — | — | — | — | ||||||||||
|
$ | (1.0 | ) | $ | 61.9 | $ | 209.8 | $ | 95.9 | $ | 140.0 | |||||
The components of net sales by major category of product and services were as follows (amounts in millions):
| |
|
|
|
|
|
|
Twenty-Six Weeks Ended | ||||||||||||||||||||||||
|---|---|---|---|---|---|---|---|---|---|---|---|---|---|---|---|---|---|---|---|---|---|---|---|---|---|---|---|---|---|---|---|
| |
Fiscal 2009 |
% of Total |
Fiscal 2010 |
% of Total |
Fiscal 2011 |
% of Total |
August 2, 2011 |
% of Total |
July 31, 2012 |
% of Total |
|||||||||||||||||||||
Conventional mattresses |
$ | 258.1 | 59.7 | % | $ | 288.0 | 58.3 | % | $ | 323.4 | 45.9 | % | $ | 163.2 | 49.2 | % | $ | 197.8 | 41.9 | % | |||||||||||
Speciality mattresses |
134.8 | 31.2 | % | 160.3 | 32.4 | % | 318.9 | 45.3 | % | 139.1 | 41.9 | % | 233.9 | 49.6 | % | ||||||||||||||||
Furniture and accessories |
29.3 | 6.8 | % | 33.9 | 6.9 | % | 46.4 | 6.6 | % | 22.2 | 6.7 | % | 31.3 | 6.6 | % | ||||||||||||||||
Total product sales |
422.2 | 97.7 | % | 482.2 | 97.6 | % | 688.7 | 97.8 | % | 324.5 | 97.8 | % | 463.0 | 98.1 | % | ||||||||||||||||
Delivery service revenues |
10.1 | 2.3 | % | 11.9 | 2.4 | % | 15.2 | 2.2 | % | 7.3 | 2.2 | % | 8.8 | 1.9 | % | ||||||||||||||||
Total net sales |
$ | 432.3 | 100.0 | % | $ | 494.1 | 100.0 | % | $ | 703.9 | 100.0 | % | $ | 331.8 | 100.0 | % | $ | 471.8 | 100.0 | % | |||||||||||
47
Prior-year components of the total net sales have been reclassified between specialty mattresses and conventional mattresses in a manner consistent with the current-year presentation.
- •
- Adjusted EBITDA increased $20.3 million to $55.0 million for the twenty-six weeks ended
July 31, 2012, compared with $34.7 million for the prior year period. Adjusted EBITDA as a percentage of sales increased to 11.7% during the twenty-six weeks ended
July 31, 2012, compared with 10.5% for the prior year period. Adjusted EBITDA increased $30.4 million to $87.5 million for fiscal 2011 compared with $57.1 million for
fiscal 2010. Adjusted EBITDA as a percentage of sales increased to 12.4% during fiscal 2011 compared with 11.6% for fiscal 2010. Adjusted EBITDA increased $10.8 million to $57.1 million
for fiscal 2010 compared with $46.3 million for fiscal 2009. Adjusted EBITDA as a percentage of sales increased to 11.6% during fiscal 2010 compared with 10.7% for fiscal 2009. (Adjusted EBITDA
is not a performance measure under U.S. GAAP. See "Prospectus Summary—Summary Historical and Unaudited Pro Forma Consolidated Financial and Operating Data" for a definition of
Adjusted EBITDA and a reconciliation of Adjusted EBITDA to net income).
- •
- The activity with respect to the number of company-operated store units was as follows:
| |
|
|
|
Twenty-Six Weeks Ended |
||||||||||||
|---|---|---|---|---|---|---|---|---|---|---|---|---|---|---|---|---|
| |
Fiscal 2009 |
Fiscal 2010 |
Fiscal 2011 |
August 2, 2011 |
July 31, 2012 |
|||||||||||
Store units, beginning of period |
464 | 487 | 592 | 592 | 729 | |||||||||||
New stores |
37 | 86 | 106 | 40 | 57 | |||||||||||
Acquired stores |
— | 33 | 55 | — | 181 | |||||||||||
Closed stores |
(14 | ) | (14 | ) | (24 | ) | (12 | ) | (10 | ) | ||||||
Store units, end of period |
487 | 592 | 729 | 620 | 957 | |||||||||||
- •
- Operating cash flows were $20.9 million, $42.4 million, $81.7 million and $30.1 million during
fiscal 2009, fiscal 2010, fiscal 2011 and the twenty-six weeks ended July 31, 2012, respectively, which were the primary funding source for capital expenditures and the cash
requirements for acquisitions, capital expenditures and debt principal payment requirements.
- •
- There were no outstanding borrowings at January 31, 2012 or at any time during fiscal 2011 on the revolver. As of July 31, 2012 we had $5.0 million in outstanding revolver borrowings and total borrowing capacity of $29.0 million on the 2007 Senior Credit Facility. On August 28, 2012, the Company paid off the outstanding revolver borrowings on the 2007 Senior Credit Facility. At September 7, 2012, there were standby letters of credit outstanding in the amount of $1.0 million and additional borrowings available of $34.0 million.
The existing revolving credit facility and the outstanding term borrowings under the Company's 2007 Senior Credit Facility mature on January 18, 2013 and January 18, 2014, respectively. Furthermore, the 2007 Senior Credit Facility limits the permitted capital expenditures of Mattress Holding and its subsidiaries to $40.0 million for each of fiscal 2012 and fiscal 2013 unless additional equity capital is contributed to Mattress Holding during the year and designated for that purpose. As a result of the pending maturities and permitted level of capital expenditures, which is below the estimated amount of capital expenditures we expect to incur in fiscal 2012, we intend to amend or refinance the 2007 Senior Credit Facility prior to January 29, 2013 to extend the debt maturities into future years and raise the permitted level of capital expenditures. We expect that either an amendment or a refinancing will result in an increase in the interest rate of our outstanding borrowings of 150 to 250 basis points.
In connection with our long-term growth plans, we are in the process of implementing an ERP system to replace our current systems and commenced pilot market testing of point-of-sale and supply
48
chain functionality during fiscal 2012. Our current ERP systems have sufficient capacity and functionality to allow us to achieve our growth plan objectives in the near-term. See "Risk Factors—Our business operations could be disrupted if our information technology systems fail to perform adequately or we are unable to protect the integrity and security of our customers' information" for additional information relating to some important risks relating to our information technology.
Going forward, we believe that the U.S. mattress retail market will benefit from the pent-up demand for mattresses and related products that has developed in recent years as consumers delayed purchases of big-ticket home furnishings, including mattresses, in response to the downturn in the national economy. We believe that this pent-up demand will result in sales growth for the Company as the national economy and consumer confidence continue to improve. We expect to continue the expansion of our company-operated store base through new store openings in existing markets to increase our market share and new store openings in new markets to provide a platform for future growth. We plan to open at least 100 new company-operated stores in fiscal 2012. In addition, we intend to evaluate strategically valuable acquisition opportunities in existing and new markets that may arise from time to time.
We also strive to increase sales and profitability within our existing network of stores through a combination of (1) advertising and marketing initiatives that are aimed at increasing customer traffic, (2) improved customer conversion through our merchandising approach that improves the customer's shopping experience and the efforts of our highly trained sales associates and (3) increasing the average price of a transaction through effective sales techniques and the increasing demand for specialty mattresses.
On May 2, 2012, we completed the acquisition of the equity interests in MGHC Holding (which operated Mattress Giant stores) for approximately $44 million subject to customary post-closing purchase price adjustments. The closing was funded with existing cash reserves and $10 million of temporary borrowings under the revolving portion of the 2007 Senior Credit Facility (as defined below). With this acquisition, we added 181 Mattress Giant specialty retail stores in Texas and Florida, which represent the two largest states in which Mattress Firm® currently operates. The acquisition, and subsequent rebranding of the acquired stores as Mattress Firm®, is expected to advance our market-level profitability model that is centered on the benefits of increasing our level of store penetration in several major Texas and Florida markets. We believe that the incremental sales and store-level contribution attributable to the acquired stores will support our ability to increase the advertising spend in each of the markets, which is expected to drive sales increases in both the acquired and existing stores. This strategy is expected to provide sales increases, greater leverage over market-level costs and improved market-level profitability.
General Definitions for Operating Results
Net sales includes fees collected for delivery services and is recognized upon delivery and acceptance of mattresses and bedding products by our customers and is recorded net of estimated returns. Customer deposits collected prior to the delivery of merchandise are recorded as a liability. Net sales are recognized net of sales tax collected from customers and remitted to various taxing jurisdictions.
Cost of sales consist of the following:
- •
- Costs associated with purchasing and delivering our products to our stores and customers, net of vendor incentives earned
on the purchase of products;
- •
- Physical inventory losses;
- •
- Store and warehouse occupancy and depreciation expense of related facilities and equipment;
49
- •
- Store and warehouse operating costs, including warehouse labor costs and utilities, repairs and maintenance and supplies
costs of warehouse and store facilities; and
- •
- Estimated costs to provide for customer returns and exchanges and to service customer warranty claims.
Gross profit from retail operations is net sales minus cost of sales.
Franchise fees and royalty income represents initial franchise fees earned upon the opening of new franchisee stores and ongoing royalties based on a percentage of gross franchisee sales.
Sales and marketing expenses consist of the following:
- •
- Advertising and media production;
- •
- Payroll and benefits for sales associates; and
- •
- Merchant service fees for customer credit and debit card payments, check guarantee fees and promotional financing expense.
General and administrative expenses consists of the following:
- •
- Payroll and benefit costs for corporate office and regional management employees;
- •
- Stock-based compensation costs;
- •
- Occupancy costs of corporate facility;
- •
- Information systems hardware, software and maintenance;
- •
- Depreciation related to corporate assets;
- •
- Management fees;
- •
- Insurance; and
- •
- Other overhead costs.
Goodwill impairment charge consists of a non-cash impairment charge of $0.5 million attributable to the impairment of our goodwill in fiscal 2010.
Loss (gain) on store closings and impairment of store assets consists of the following:
- •
- Estimated future costs to close locations at the time of closing including, as applicable, the difference between future
lease obligations and anticipated sublease rentals;
- •
- The write off of unamortized fixed assets related to store leasehold costs on closed stores; and
- •
- Non-cash charges recognized for long-lived assets, consistently primarily of store leasehold costs and related equipment, to reduce the carrying value to estimated fair value, based on our periodic assessment of whether projected future cash flows of individual stores are sufficient to recover the carrying value of the related assets.
Income (loss) from operations consists of gross profit from retail operations plus franchise fees and royalty income, minus the sum of sales and marketing expenses, general and administrative expenses, goodwill and intangible asset impairment charges, and loss (gain) on store closings and impairment of store assets.
Total other expense includes interest income, interest expense and gain (loss) on early debt extinguishments. Interest expense includes interest on outstanding debt, amortization of debt discounts and amortization of financing costs.
50
Results of Operations
The following table presents the consolidated historical financial operating data for our business expressed as a percentage of net revenues for each period indicated. Our fiscal year consists of 52 or 53 weeks, ending on the Tuesday nearest to January 31, divided into twelve fiscal periods of four or five weeks each. Each fiscal year is described by the period of the calendar year that comprises the majority of the fiscal year period. The fiscal year ending January 29, 2013 is described as "fiscal 2012," the fiscal year ended January 31, 2012 is described as "fiscal 2011," the fiscal year ended February 1, 2011 is described as "fiscal 2010" and the fiscal year ended February 2, 2010 is described as "fiscal 2009." All fiscal years presented include 52 weeks of operations. For purposes of annual comparisons, unless otherwise noted, we have not adjusted for this difference. The historical results are not necessarily indicative of results to be expected for any future period.
| |
|
|
|
Twenty-Six Weeks Ended |
||||||||||||
|---|---|---|---|---|---|---|---|---|---|---|---|---|---|---|---|---|
| |
Fiscal 2009 |
Fiscal 2010 |
Fiscal 2011 |
August 2, 2011 |
July 31, 2012 |
|||||||||||
Net sales |
100.0 | % | 100.0 | % | 100.0 | % | 100.0 | % | 100.0 | % | ||||||
Costs of sales |
64.9 | % | 63.5 | % | 60.8 | % | 61.8 | % | 60.9 | % | ||||||
Gross profit from retail operations |
35.1 | % | 36.5 | % | 39.2 | % | 38.2 | % | 39.1 | % | ||||||
Franchise fees and royalty income |
0.5 | % | 0.6 | % | 0.7 | % | 0.6 | % | 0.5 | % | ||||||
Sales and marketing expenses |
22.0 | % | 23.1 | % | 23.8 | % | 24.3 | % | 24.5 | % | ||||||
General and administrative expenses |
7.5 | % | 6.9 | % | 7.3 | % | 7.3 | % | 7.6 | % | ||||||
Goodwill impairment charge |
0.0 | % | 0.1 | % | 0.0 | % | 0.0 | % | 0.0 | % | ||||||
Loss on store closings and impairment of store assets |
1.2 | % | 0.5 | % | 0.1 | % | 0.0 | % | 0.0 | % | ||||||
Income from operations |
4.9 | % | 6.5 | % | 8.6 | % | 7.2 | % | 7.5 | % | ||||||
Other expense, net |
5.6 | % | 6.3 | % | 5.0 | % | 5.7 | % | 0.9 | % | ||||||
Income before income taxes |
(0.8 | )% | 0.2 | % | 3.6 | % | 1.5 | % | 6.6 | % | ||||||
Income tax expense |
0.3 | % | 0.2 | % | (1.3 | )% | 0.1 | % | 2.4 | % | ||||||
Net income |
(1.1 | )% | 0.1 | % | 4.9 | % | 1.4 | % | 4.2 | % | ||||||
Twenty-Six Weeks Ended July 31, 2012 Compared to Twenty-Six Weeks Ended August 2, 2011
Net sales. Net sales increased $140.0 million, or 42.2%, to $471.8 million for the twenty-six weeks ended July 31, 2012, compared to $331.8 million for the twenty-six weeks ended August 2, 2011. The components of the net sales increase were as follows (amounts in millions):
| |
Increase (decrease) in net sales |
|||
|---|---|---|---|---|
| |
Twenty-Six Weeks Ended July 31, 2012 |
|||
Comparable-store sales |
$ | 32.8 | ||
New stores |
59.9 | |||
Acquired stores |
51.4 | |||
Closed stores |
(4.1 | ) | ||
|
$ | 140.0 | ||
The increase in comparable-store net sales represents a 10.1% comparable-store sales increase, which was primarily the result of an increase in the number of customer transactions and in the
51
average net sales per transaction. The increase in our net sales from new stores was the result of 123 new stores opened at various times during the twelve fiscal periods ended July 31, 2012, including 57 stores opened during the twenty-six week period ended July 31, 2012, prior to their inclusion in the comparable-store sales calculation beginning with the thirteenth full fiscal period of operations. The expected increase in net sales for acquired stores was the result of the acquisition of 55 stores in November 2011 and 181 stores in May 2012. We closed 22 stores during the twelve fiscal periods ended July 31, 2012, including ten stores during the twenty-six week period ended July 31, 2012, and the reduction in sales during the twenty-six week period ended July 31, 2012 from these closings totaled $4.1 million. We operated 957 stores at July 31, 2012, compared with 620 stores at August 2, 2011.
Cost of sales. Cost of sales increased $81.9 million, or 39.9%, to $287.1 million during the twenty-six weeks ended July 31, 2012, compared to $205.2 million for the twenty-six weeks ended August 2, 2011. The major components of the increase in cost of sales are discussed below. Cost of sales as a percentage of net sales decreased to 60.9% for the twenty-six weeks ended July 31, 2012, as compared to 61.9% for the twenty-six weeks ended August 2, 2011.
Product costs increased by $49.6 million, or 38.2%, to $179.4 million for the twenty-six weeks ended July 31, 2012, compared with $129.8 million for the twenty-six weeks ended August 2, 2011. Product costs as a percentage of sales decreased to 38.0% for the twenty-six weeks ended July 31, 2012 from 39.1% for the twenty-six weeks ended August 2, 2011. The increase in the amount of product costs is the result of the corresponding increase in net sales. The decrease of this expense as a percentage of net sales for the twenty-six weeks ended July 31, 2012 is primarily the result of an increase in the mix of products with lower product costs and improvement in vendor incentive terms with certain vendors.
Store and warehouse occupancy costs, consisting primarily of lease-related costs of rented facilities, increased $17.6 million, or 39.3%, to $62.4 million during the twenty-six weeks ended July 31, 2012, compared to $44.8 million for the twenty-six weeks ended August 2, 2011. Store and warehouse occupancy costs as a percentage of net sales decreased to 13.2% during the twenty-six weeks ended July 31, 2012, compared to 13.5% in the twenty-six weeks ended August 2, 2011. The increase in the amount of expense during the twenty-six weeks ended July 31, 2012 was mainly attributable to the increase in the number of stores we operated. The decrease of expenses as a percentage of net sales during the twenty-six weeks ended July 31, 2012 was attributable to expense leverage resulting from comparable store sales growth, partially offset by the acquisition of Mattress Giant stores in November 2011 and May 2012 with lower store occupancy expense leverage as a result of average sales per store that were lower than our average, and the commencement of warehouse operations in a number of new markets.
Depreciation expense of leasehold improvement and other fixed assets used in stores and warehouse operations increased $1.4 million, or 18.2%, to $9.3 million, for the twenty-six weeks ended July 31, 2012, compared to $7.9 million for the twenty-six weeks ended August 2, 2011. The increase in expense was primarily attributable to the increase in the number of stores we operated during the twenty-six weeks ended July 31, 2012, as compared with the twenty-six weeks ended August 2, 2011.
Other cost of sales, consisting of store and warehouse operating and delivery costs, increased $13.2 million, or 58.2%, to $36.0 million, for the twenty-six weeks ended July 31, 2012, compared to $22.8 million for the twenty-six weeks ended August 2, 2011, primarily as a result of the increase in net sales and in the number of stores we operated during the twenty-six weeks ended July 31, 2012, as compared with the prior year period. Other cost of sales includes $1.3 million of acquisition-related costs related to the acquisition of Mattress Giant stores.
Gross profit from retail operations. As a result of the foregoing, gross profit from retail operations increased $58.1 million, or 45.9%, to $184.7 million, for the twenty-six weeks ended July 31, 2012, compared with $126.6 million during the twenty-six weeks ended August 2, 2011. Gross profit from
52
retail operations as a percentage of net sales increased to 39.1% for the twenty-six weeks ended July 31, 2012, compared to 38.2% for the twenty-six weeks ended August 2, 2011.
Franchise fees and royalty income. Franchise fees and royalty income increased $0.4 million, or 22.2%, to $2.5 million for the twenty-six weeks ended July 31, 2012, compared to $2.1 million during the twenty-six weeks ended August 2, 2011. The increase in income was attributable to a $0.5 million increase in royalty income, which was mainly due to increases in sales for franchise stores as compared with the prior year period mainly due to new stores and comparable-store sales increases, which was offset by a $0.1 million decrease in initial fees, resulting from a decrease in the number of new franchisee stores opened during the twenty-six weeks ended July 31, 2012 as compared with the twenty-six weeks ended August 2, 2011. Our franchisees operated 141 stores at July 31, 2012.
Sales and marketing expenses. Sales and marketing expenses increased $35.0 million, or 43.3%, to $115.7 million for the twenty-six weeks ended July 31, 2012, compared to $80.7 million for the twenty-six weeks ended August 2, 2011. Sales and marketing expenses as a percentage of net sales increased to 24.5% for the twenty-six weeks ended July 31, 2012, compared to 24.3% for the twenty-six weeks ended August 2, 2011. The components of sales and marketing expenses are explained below.
Advertising expense increased $12.3 million, or 40.0%, to $43.0 million for the twenty-six weeks ended July 31, 2012, from $30.7 million for the twenty-six weeks ended August 2, 2011. Advertising expense as a percentage of net sales decreased to 9.1% for the twenty-six weeks ended July 31, 2012, compared to 9.3% for the twenty-six weeks ended August 2, 2011. The increase in the amount of advertising spending was mainly attributable to our efforts to increase the number of customers shopping in our stores and, to a lesser extent, to the increase in the number of markets in which we operate as a result of new store growth and acquisitions. We expect to maintain or increase advertising expense as a percentage of sales if we continue to experience sales per store and comparable-store sales growth and gain expense leverage in other operating expense areas. We receive funds from time to time from certain vendors to advertise their products that are recognized as a direct reduction of advertising expense. The amount of vendor advertising funds that were recognized as a reduction of advertising expense totaled $2.4 million for the twenty-six weeks ended July 31, 2012, compared with $1.5 million for the twenty-six weeks ended August 2, 2011.
Other sales and marketing expenses, consisting mainly of salesman compensation costs and, to a lesser extent, costs incurred to accept payments from our customers, including credit card and third party finance fees, increased $22.7 million, or 45.4%, to $72.7 million for the twenty-six weeks ended July 31, 2012, compared to $50.0 million for the twenty-six weeks ended August 2, 2011, primarily as a result of the increase in net sales during the period due to an increase in the number of operating stores. Other sales and marketing expenses as a percentage of net sales increased to 15.4% for the twenty-six weeks ended July 31, 2012, compared to 15.1% for the twenty-six weeks ended August 2, 2011. The increase reflects higher staffing levels in stores over the summer selling period and the modifications to the compensation system.
General and administrative expenses. General and administrative expenses increased $11.7 million, or 48.7%, to $35.9 million for the twenty-six weeks ended July 31, 2012, compared to $24.1 million for the twenty-six weeks ended August 2, 2011. General and administrative expenses as a percentage of net sales, increased to 7.6% for the twenty-six weeks ended July 31, 2012, compared to 7.3% for the twenty-six weeks ended August 2, 2011. General and administrative expenses increased primarily as a result of our growth, including a $4.7 million increase in wages and benefits resulting from employee additions to our corporate office, $5.7 million of acquisition-related costs related to the acquisition and integration of MGHC Holding and an aggregate increase of $1.3 million in various other general and administrative expense categories. We expect to continue making investments in our corporate infrastructure commensurate with our growth strategy.
53
Other expense, net. Other expense, net, for both periods consists primarily of interest expense. Interest expense decreased $12.7 million, or 74.7%, to $4.3 million for the twenty-six weeks ended July 31, 2012, compared to $17.0 million during the twenty-six weeks ended August 2, 2011, primarily as a result of the repayment of related-party debt in conjunction with the initial public offering in November 2011. The twenty-six weeks ended August 2, 2011 also includes a $1.9 million loss from debt extinguishment related to the repayment of related-party debt.
Income tax (benefit) expense. We recognized $11.5 million of income tax expense for the twenty-six weeks ended July 31, 2012, compared to $0.3 million of income tax expense for the twenty-six weeks ended August 2, 2011. The effective tax rate was 36.7% for the twenty-six weeks ended July 31, 2012, compared to 6.4% for the twenty-six weeks ended August 2, 2011, and differs primarily due to the full valuation allowance recorded against our deferred tax assets during the twenty-six weeks ended August 2, 2011.
Our estimated full year effective tax rate for fiscal 2012, before discrete period adjustments, is approximately 38.5%, which is above the federal statutory rate of 35.0% primarily due to state income taxes.
Net income (loss). As a result of the foregoing, our net income was $19.8 million for the twenty-six weeks ended July 31, 2012 compared to $4.7 million for the twenty-six weeks ended August 2, 2011.
Fiscal 2011 Compared to Fiscal 2010
Net sales. Net sales increased $209.8 million, or 42.5%, to $703.9 million for fiscal 2011, compared to $494.1 million for 2010. The components of the net sales increase in fiscal 2011 were as follows (in millions):
| |
Increase (decrease) in net sales |
|||
|---|---|---|---|---|
| |
Fiscal 2011 |
|||
Comparable-store sales |
$ | 99.0 | ||
New stores |
83.4 | |||
Acquired stores |
33.0 | |||
Closed stores |
(5.6 | ) | ||
|
$ | 209.8 | ||
The increase in comparable-store net sales represents a 20.5% comparable-store sales growth, which was primarily the result of an increase in the number of customer transactions. The increase in our net sales from new stores was the result of 106 new stores opened at various times throughout fiscal 2011 compared to 86 stores opened in fiscal 2010, prior to their inclusion in comparable-store sales results in fiscal 2011 beginning with the thirteenth full month of operations. The increase in net sales for acquired stores was the result of the acquisition of 55 stores in November 2011 compared to 33 stores acquired in fiscal 2010 from two separate acquisitions in October 2010 and December 2010, prior to their inclusion in comparable-store sales results in fiscal 2011 beginning with the first full month after the one-year anniversaries of the acquisitions. We closed 24 stores in fiscal 2011 and 14 stores in fiscal 2010 and the reduction in sales during fiscal 2011 from these closings totaled $5.6 million. We operated 729 stores at the end of fiscal 2011, compared with 592 stores at the end of fiscal 2010.
Cost of sales. Cost of sales increased $114.0 million, or 36.3%, to $428.0 million for fiscal 2011, compared to $314.0 million for fiscal 2010. The major components of the increase in cost of sales are
54
explained below. Cost of sales as a percentage of net sales decreased to 60.8% for fiscal 2011, compared to 63.5% for fiscal 2010.
Product costs increased $87.5 million, or 47.6%, to $271.4 million for fiscal 2011, compared with $183.9 million for fiscal 2010. Product costs as a percentage of net sales increased to 38.6% for fiscal 2011, as compared to 37.2% for fiscal 2010. The increase in the amount of product costs for fiscal 2011 is the result of the corresponding increase in net sales. The increase of this expense as a percentage of net sales for fiscal 2011 is primarily the result of an increase in the mix of products with higher product costs. Product costs as a percentage of net sales are affected by several factors, including the mix of the products we sell, the terms of our vendor agreements and the competitive environment in which we operate. The combination of these effects may result in product costs as a percentage of net sales in future periods that are higher or lower than our recent results.
Store and warehouse occupancy costs, consisting primarily of lease-related costs of rented facilities, increased $13.7 million, or 17.4%, to $92.6 million for fiscal 2011, compared to $78.9 million for fiscal 2010. Store and warehouse occupancy costs as a percentage of net sales decreased to 13.2% for fiscal 2011, as compared to 16.0% for fiscal 2010. The increase in the amount of expense during fiscal 2011 is mainly attributable to the increase in the number of stores we operated. The reduction of expense as a percentage of net sales was primarily attributable to comparable-store sales growth in fiscal 2011 as compared with the prior year.
Depreciation expense of leasehold improvements and other fixed assets used in store and warehouse operations increased $2.6 million, or 20.1%, to $15.7 million for fiscal 2011, compared with $13.1 million for fiscal 2010. The increase in depreciation expense was primarily attributable to the increase in the number of stores we operated during fiscal 2011 as compared with the prior year.
Other cost of sales increased $10.2 million during fiscal 2011 compared with the prior year primarily as a result of the increase in net sales and in the number of stores we operated during fiscal 2011.
Gross profit from retail operations. As a result of the foregoing, gross profit from retail operations increased $95.7 million, or 53.1%, to $275.9 million for fiscal 2011, as compared with $180.2 million for fiscal 2010. Gross profit from retail operations as a percentage of net sales increased to 39.2% for fiscal 2011, as compared to 36.5% for fiscal 2010.
Franchise fees and royalty income. Franchise fees and royalty income is comprised of initial fees earned upon the opening of each new franchisee store and ongoing royalty income that is earned on a percentage of franchisee net sales. Franchise fees and royalty income increased $1.5 million, or 47.0%, to $4.7 million for fiscal 2011, compared with $3.2 million for fiscal 2010. The increase in income was comprised of a $0.2 million increase in initial fees, which was attributable to an increase in the number of new franchisee stores opened during fiscal 2011 as compared with fiscal 2010, and a $1.3 million increase in royalty income, which was mainly attributable to an increase in net sales per store and total sales results for franchisee stores as compared with fiscal 2010.
Sales and marketing expenses. Sales and marketing expenses increased $53.6 million, or 47.1%, to $167.6 million for fiscal 2011, compared to $114.0 million for fiscal 2010. The components of sales and marketing expenses are explained below. Sales and marketing expenses as a percentage of net sales increased to 23.8% for fiscal 2011, compared to 23.1% for fiscal 2010.
Advertising expense increased $21.1 million, or 53.8%, to $60.2 million for fiscal 2011, compared with $39.1 million for fiscal 2010. Advertising expense as a percentage of net sales increased to 8.5% for fiscal 2011, as compared to 7.9% for fiscal 2010. The increase in the amount of advertising spending was mainly attributable to our efforts to increase the number of customers shopping in our stores and, to a lesser extent, to an increase in the number of markets in which we operate as a result of new store growth and acquisitions. We expect to maintain or increase advertising expense as a percentage of sales
55
if we continue to experience sales per store and comparable-store sales growth and gain expense leverage in other operating expense areas. We receive funds from time to time from certain vendors to advertise their products that are recognized as a direct reduction of advertising expense. The amount of vendor advertising funds that were recognized as a reduction of advertising expense totaled $3.9 million for fiscal 2011, compared with $3.7 million for fiscal 2010. There can be no assurance that we will obtain similar amounts of advertising funds in future periods. If we are unable to continue receiving advertising funds, we may not be able to advertise at the same rates or our advertising costs as a percentage of sales may increase.
Other sales and marketing expenses, consisting mainly of salesman compensation costs, increased $32.5 million, or 43.5%, to $107.4 million during fiscal 2011 compared with $74.9 million for fiscal 2010 primarily as a result of the increase in net sales during fiscal 2011.
General and administrative expenses. General and administrative expenses increased $17.6 million, or 51.5%, to $51.7 million for fiscal 2011, compared to $34.1 million for fiscal 2010. General and administrative expenses as a percentage of net sales increased to 7.3% for fiscal 2011 as compared to 6.9% for fiscal 2010. General and administrative expenses increased during fiscal 2011 primarily as a result of our growth, including a $7.7 million increase in wages and benefits resulting from employee additions in our corporate office, a $3.6 million increase in performance-based compensation costs, a $1.0 million increase in stock-based compensation costs and an aggregate increase of $5.3 million in various general and administrative expense categories. We expect to continue making investments in our corporate infrastructure commensurate with our growth strategy.
Goodwill and intangible asset impairment charges. During fiscal 2010, we recognized pre-tax impairment charges totaling $0.5 million to reduce the carrying amount of our goodwill to estimated fair value for two reporting units. No impairment charges related to our goodwill or intangible assets were recognized in fiscal 2011.
Loss on store closings and impairment of store assets. Loss on store closings and impairment of store assets decreased $1.7 million to $0.8 million during fiscal 2011 compared with $2.5 million during fiscal 2010. The decrease in the loss during fiscal 2011 was mainly attributable to a reduction in the amount of remaining lease commitments on stores that we closed during the fiscal year.
Other expense, net. Other expense, net for fiscal 2011 consists primarily of interest expense and loss on debt extinguishment. Interest expense decreased $1.8 million, or 5.6%, to $29.3 million for fiscal 2011, as compared to $31.1 million for fiscal 2010. During fiscal 2011 a loss on debt extinguishment of $5.7 million was recognized compared to no loss during fiscal 2010. The decrease in interest expense and the loss on debt extinguishment were due to reductions in debt related to prepayments and conversions of debt into shares of our common stock in advance of, and in connection with, the initial public offering completed in November 2011, which resulted in the retirement of the full outstanding balances of the 2009 Loan Facility, the PIK Notes and the Convertible Notes.
Income tax expense. We recognized $(8.8) million of income tax benefit for fiscal 2011, compared to $0.8 million of income tax expense for fiscal 2010. The effective tax rate was (34.5)% for fiscal 2011, compared to 70.7% for fiscal 2010, and differs primarily as a result of the change in the valuation allowance for deferred tax assets recognized during fiscal 2011 as compared with the prior year.
The effective tax rate for fiscal 2011 differs from the federal statutory rate primarily as a result of the change in valuation allowance for deferred tax assets in an amount that coincides with a reduction in deferred tax assets associated with current year operations as well as the release of the remaining valuation allowance during the fourth quarter ended January 31, 2012.
Prior to January 31, 2012, we provided a valuation allowance for deferred tax assets based on our evaluation that realizability of such assets was not "more likely than not" as required by generally accepted accounting principles. ASC 740 (Accounting for Income Taxes) requires that all available
56
evidence, both positive and negative be identified and considered in making a determination as to whether it is "more likely than not" that all of the deferred tax assets related to tax attributes and other deductible temporary differences will be realized. During fiscal 2011, we continuously evaluated additional facts representing positive and negative evidence in the determination of the realizability of our deferred tax assets. Such deferred tax assets consist primarily of net operating loss carryforwards and temporary differences on goodwill and noncurrent liabilities. The Company's results of operations for fiscal 2011 resulted in the utilization of a portion of net operating loss carryforwards. Furthermore, during the fourth quarter of fiscal 2011, based on additional evidence regarding our past earnings, scheduling of deferred tax liabilities and projected future taxable income from operating activities, including the cessation of interest deductions due to current year debt retirements resulting from the completion of the initial public offering on November 23, 2011, we determined that it was more likely than not that the deferred tax assets as of January 31, 2012 would be realized. Accordingly, the results of operations for fiscal 2011 include a deferred tax benefit in the amount of $20.1 million related to the change in valuation allowance for deferred tax assets that occurred through the combination of current operations and the release of the remaining valuation allowance as of January 31, 2012.
Net income (loss). As a result of the foregoing, our net income was $34.4 million for fiscal 2011 compared to $0.3 million for fiscal 2010.
Fiscal 2010 Compared to Fiscal 2009
Net sales. Net sales increased $61.9 million, or 14.3%, to $494.1 million for fiscal 2010, compared to $432.3 million for 2009. The components of the net sales increase in fiscal 2010 were as follows (in millions):
| |
Increase (decrease) in net sales |
|||
|---|---|---|---|---|
| |
Fiscal 2010 |
|||
Comparable-store sales |
$ | 26.1 | ||
New stores |
36.3 | |||
Acquired stores |
5.4 | |||
Closed stores |
(5.9 | ) | ||
|
$ | 61.9 | ||
The increase in comparable-store net sales represents a 6.3% comparable-store sales growth, which was primarily the result of an increase in the average sales price of mattress products that we sold. The increase in our net sales from new stores was the result of 85 new stores opened at various times throughout fiscal 2010 compared to 37 stores opened in fiscal 2009, prior to their inclusion in comparable-store sales results in fiscal 2010 beginning with the thirteenth full month of operations. The increase in net sales for acquired stores was the result of the acquisition of 33 stores during fiscal 2010 from two separate acquisitions in October 2010 and December 2010. We acquired no stores during fiscal 2009. We closed 14 stores in fiscal 2010 and 14 stores in fiscal 2009 and the reduction in sales during fiscal 2010 from these closings totaled $5.9 million. We operated 592 stores at the end of fiscal 2010, compared with 487 stores at the end of fiscal 2009.
Cost of sales. Cost of sales increased $33.5 million, or 11.9%, to $314.0 million for fiscal 2010, compared to $280.5 million for fiscal 2009. The major components of the increase in cost of sales are explained below. Cost of sales as a percentage of net sales decreased to 63.5% for fiscal 2010, compared to 64.9% for fiscal 2009.
Product costs increased $21.6 million, or 13.3%, to $183.9 million for fiscal 2010, compared with $162.2 million for fiscal 2009. Product costs as a percentage of net sales decreased to 37.2% for fiscal
57
2010, as compared to 37.5% for fiscal 2009. The increase in the amount of product costs for fiscal 2010 is the result of the corresponding increase in net sales. The reduction of this expense as a percentage of net sales for fiscal 2010 is primarily a result of improved product gross margins on certain products and a higher amount of volume-based vendor incentives earned on certain products. Product costs as a percentage of net sales is affected by several factors, including the mix of the products we sell, the terms of our vendor agreements and the competitive environment in which we operate. The combination of these effects may result in product costs as a percentage of net sales in future periods that are higher or lower than our recent results.
Store and warehouse occupancy costs, consisting primarily of lease-related costs of rented facilities, increased $5.7 million, or 7.8%, to $78.9 million for fiscal 2010, compared to $73.2 million for fiscal 2009. Store and warehouse occupancy costs as a percentage of net sales decreased to 16.0% for fiscal 2010, as compared to 16.9% for fiscal 2009. The increase in the amount of expense during fiscal 2010 is mainly attributable to the increase in the number of stores we operated. The reduction of expense as a percentage of net sales was primarily attributable to improving sales per store in fiscal 2010 as compared with the prior year.
Depreciation expense of leasehold improvements and other fixed assets used in store and warehouse operations decreased $0.5 million, or 3.7%, to $13.1 million for fiscal 2010, compared with $13.6 million for fiscal 2009. Depreciation expense in fiscal 2010 was reduced compared to fiscal 2009 as a result of a decrease in the depreciable amount of fixed assets, which was partially offset by an increase in depreciation expense attributable to capital expenditures in fiscal 2010. The decrease in the amount of depreciable fixed assets in fiscal 2010 was attributable to (a) an impairment charge of $2.3 million recognized at the end of fiscal 2009 to reduce the carrying value of certain long-lived assets, consisting primarily of store leasehold costs and related equipment, to fair value, and (b) an increase in fully depreciated fixed assets.
Other cost of sales increased $6.5 million during fiscal 2010 compared with the prior year primarily as a result of the increase in net sales and in the number of stores we operated during fiscal 2010.
Gross profit from retail operations. As a result of the foregoing, gross profit from retail operations increased $28.5 million, or 18.8%, to $180.2 million for fiscal 2010, as compared with $151.7 million for fiscal 2009. Gross profit from retail operations as a percentage of net sales increased to 36.5% for fiscal 2010, as compared to 35.1% for fiscal 2009.
Franchise fees and royalty income. Franchise fees and royalty income is comprised of initial fees earned upon the opening of each new franchisee store and ongoing royalty income that is earned on a percentage of franchisee net sales. Franchise fees and royalty income increased $1.1 million, or 52.1%, to $3.2 million for fiscal 2010, compared with $2.1 million for fiscal 2009. The increase in income was comprised of a $0.6 million increase in initial fees, which was attributable to an increase in the number of new franchisee stores opened during fiscal 2010 as compared with fiscal 2009, and a $0.5 million increase in royalty income, which was mainly attributable to an increase in gross sales per store results for franchisee stores as compared with fiscal 2009. The Company's growth plans include expansion of our franchise network and, if successful, revenues from franchise fees and royalty income are expected to continue at or above current levels.
Sales and marketing expenses. Sales and marketing expenses increased $18.7 million, or 19.6%, to $114.0 million for fiscal 2010, compared to $95.3 million for fiscal 2009. The components of sales and marketing expenses are explained below. Sales and marketing expenses as a percentage of net sales increased to 23.1% for fiscal 2010, compared to 22.0% for fiscal 2009.
Advertising expense increased $9.7 million, or 33.0%, to $39.1 million for fiscal 2010, compared with $29.4 million for fiscal 2009. Advertising expense as a percentage of net sales increased to 7.9% for fiscal 2010, as compared to 6.8% for fiscal 2009. The increase in the amount of advertising spending was mainly attributable to our efforts to increase the number of customers shopping in our stores and,
58
to a lesser extent, to an increase in the number of markets in which we operate as a result of new store growth and acquisitions. We receive funds from time to time from certain vendors to advertise their products that are recognized as a direct reduction of advertising expense. The amount of vendor advertising funds that were recognized as a reduction of advertising expense totaled $3.7 million for fiscal 2010, compared with $0.9 million for fiscal 2009. The increase in the amount of advertising funds during fiscal 2010 resulted from negotiations with our vendors to increase their participation in the costs of our advertising programs in light of the improvement in our sales during fiscal 2010.
Other sales and marketing expenses increased $8.9 million during fiscal 2010 compared with the prior year primarily as a result of the increase in net sales during fiscal 2010. Such increase also includes a one-time charge of $1.6 million resulting from the settlement on May 26, 2011 of a lawsuit involving alleged violations of the Fair Labor Standards Act brought in April 2010 by a former employee. We paid the settlement amount of $1.6 million to a claims-made reversionary fund on August 9, 2011, and such amount is included in accrued liabilities as of February 1, 2011.
General and administrative expenses. General and administrative expenses increased $1.8 million, or 5.5%, to $34.1 million for fiscal 2010, compared to $32.3 million for fiscal 2009. General and administrative expenses as a percentage of net sales decreased to 6.9% for fiscal 2010 as compared to 7.5% for fiscal 2009. General and administrative expenses increased during fiscal 2010 primarily as a result of our growth, including a $2.6 million increase in wages and benefits resulting from employee additions in our corporate office and an aggregate increase of $1.0 million in various general and administrative expense categories. The aforementioned increases during fiscal 2010 were partially offset by a $1.8 million reduction in performance-based compensation costs and a one-time benefit in stock-based compensation costs of $0.5 million resulting from a revision of the estimate of forfeited equity awards to employees.
Goodwill and intangible asset impairment charges. During fiscal 2010, we recognized pre-tax impairment charges totaling $0.5 million to reduce the carrying amount of our goodwill to estimated fair value for two reporting units. No impairment charges related to our goodwill or intangible assets were recognized in fiscal 2009.
Loss on store closings and impairment of store assets. Loss on store closings and impairment of store assets decreased $2.7 million to $2.5 million during fiscal 2010 compared with $5.2 million during fiscal 2009. The decrease in the loss during fiscal 2010 was mainly attributable to a reduction in the amount of remaining lease commitments on stores that we closed during the fiscal year.
Other expense, net. Other expense, net for fiscal 2010 consists primarily of interest expense. Interest expense increased $3.9 million, or 14.5%, to $31.1 million for fiscal 2010, as compared to $27.1 million for fiscal 2009. The increase in interest expense for fiscal 2010 was attributable to (1) the compounding effects of our 2009 Loan Facility and PIK Notes, which provide for the payment of interest through the addition of accrued interest to the outstanding loan balances and (2) the full year effect of the amendment of the 2009 Loan Facility on March 20, 2009, which increased the loan agreement interest rate from 12.5% to 16.0% and the effective interest rate for financial reporting purposes to 17.2%.
Income tax expense. We recognized $0.8 million of income tax expense for fiscal 2010 compared to $1.4 million in fiscal 2009. The effective tax rate for fiscal 2010 was 70.7% compared to a negative effective tax rate of 43.0% for fiscal 2009, and differs primarily as a result of changes in the valuation allowance for deferred tax assets. The effective tax rate for fiscal 2010 differs from the federal statutory rate primarily due to the effect of state income taxes, change in valuation allowance and stock-based compensation. The change in the valuation allowance for deferred tax assets during 2010 was mainly attributable to a decrease in the amount of net operating losses. State income taxes were 52.4% of income before income taxes during fiscal 2010 as a result of current state income taxes associated with states that impose taxes on revenue and net margin, as well as states that impose income taxes at the separate legal entity level.
59
Net income (loss). As a result of the foregoing, our net income was $0.3 million for fiscal 2010 compared to a loss of $4.7 million for fiscal 2009.
Liquidity and Capital Resources
Initial Public Offering
On November 23, 2011, we completed the initial public offering of 6,388,888 shares of our common stock, par value $0.01 per share, at $19.00 per share, before underwriting discounts and commissions. The initial public offering generated net proceeds to us of approximately $110.4 million, after deducting the underwriting discount and offering-related costs. The Company used a portion of the proceeds to repay the 2007 Subordinated Loan Facility (as defined in the notes to consolidated financial statements located elsewhere in this prospectus), as amended and restated in March 2009 (the "2009 Loan Facility") in full. In connection with the offering, the principal and accrued interest of the 12% payment-in-kind investor notes maturing at various times from October 24, 2012 through March 19, 2015 (the "PIK Notes") were either repaid or converted into shares of our common stock and the 12% convertible notes due July 18, 2016 (the "Convertible Notes") were converted into shares of our common stock.
As a result, we reduced our outstanding debt, with a weighted average interest rate of 14.5%, in the aggregate amount of $188.0 million in principal and accrued interest thereon. We recognized a loss on debt extinguishment in the amount of $5.7 million during the fiscal 2011, related to the reduction of debt in advance of and in connection with the initial public offering. We anticipate incurring significantly lower amounts of interest expense in future periods from the reduction of debt resulting from the initial public offering.
We anticipate incurring incremental general and administrative expenses of approximately $3.0 million annually that are attributable to operating as a publicly traded company. These expenses will include annual and quarterly reporting; Sarbanes-Oxley compliance expenses; expenses associated with listing on the NASDAQ; independent auditor fees; legal fees; investor relations expenses; registrar and transfer agent fees; director and officer liability insurance costs; and director compensation. The full year effect of these incremental general and administrative expenses are not reflected in the Company's historical consolidated financial statements located elsewhere in this prospectus.
Sources of Liquidity and Capital Requirements
Our primary uses of cash are to fund growth capital and maintenance expenditures for our stores and distribution centers, purchase and replace floor sample inventories maintained in our stores, scheduled debt service payments and strategic acquisitions of mattress specialty retailers. Historically, we have satisfied these cash requirements from cash flows provided by our operations, availability under the revolving portion of the 2007 Senior Credit Facility (as defined hereafter) and proceeds from the issuance of PIK Notes.
Historically, we have collected payment from our customers at or near the time of sale, and, as such, we do not carry significant accounts receivable balances from our customers. Most of our suppliers deliver product to our distribution centers within 48 hours following our placement of a purchase order, which allows us to carry lower inventory levels. We pay our vendors for our purchases on terms that, on average, allow us to collect payments on the sale of our products before we must pay our vendors. The attributes of our operating cycle lower our working capital requirements and have historically allowed us to operate for extended periods while maintaining a negative working capital position.
Our future capital requirements will vary based on the number of additional stores, including relocated stores, we open and the number of stores we choose to renovate, and the number and size of
60
any acquisitions we choose to make, including franchisee acquisitions. Our decisions regarding opening, relocating or renovating stores, and whether to engage in strategic acquisitions, are based in part on macroeconomic factors and the general state of the U.S. economy, as well as the local economies in the markets in which our stores are located.
We plan to spend approximately $70.0 to $75.0 million in capital expenditures during fiscal 2012, including estimated costs to renovate stores from the acquisition of former Mattress Giant stores and the pending acquisition of the Mattress X-Press locations. While we have not yet reached this limit in fiscal 2012, the terms of the 2007 Senior Credit Facility, as amended, limit the permitted capital expenditures of Mattress Holding, our indirect subsidiary, to $40.0 million for each of fiscal 2012 and 2013. We will need to amend the 2007 Senior Credit Facility or obtain a waiver of this restrictive covenant before the end of fiscal 2012 to permit capital expenditures at the expected level. On June 28, 2011, Mattress Holding entered into an amendment to the 2007 Senior Credit Facility to, among other things, provide greater flexibility to make capital expenditures by raising the permitted capital expenditure amount effective for fiscal 2011 and future years from the $20.0 million annual permitted amount that was in effect for prior years. The permitted amount may be increased for any year by the amount of equity capital that is contributed to Mattress Holding during the year for that purpose. In addition, to the extent capital expenditures made in any year are less than the permitted amount, the amount of the shortfall in that year may increase the permitted amount of capital expenditures for the immediately succeeding (but not any subsequent) year. The permitted capital expenditure amount has been raised in recent years by making capital contributions to Mattress Holding for that purpose. Each such capital contribution was funded through the issuance of PIK Notes. Our ability to complete our capital expenditure plan for fiscal 2012 will be dependent upon our ability to raise the permitted capital expenditure amount through capital contributions to Mattress Holding for that purpose or through an amendment or refinancing of the 2007 Senior Credit Facility.
We believe that we will be able to satisfy our capital requirements for the next 12 months, including supporting our existing operations, continuing our growth strategy, and satisfying our scheduled debt service payments, through a combination of our existing reserves of cash and cash equivalents, internally generated cash flows from operations, and, as required, borrowings under the revolving portion of the 2007 Senior Credit Facility. The revolving portion of the 2007 Senior Credit Facility allows us to borrow up to $35.0 million, of which up to $15.0 million is available for issuance as letters of credit. There were $5.0 million in outstanding borrowings on the revolving facility as of July 31, 2012, which amount was repaid in August 2012. On July 31, 2012, outstanding letters of credit under the revolving facility were $1.0 million, resulting in $29.0 million of available borrowings as of such date. The $35.0 million revolving credit facility portion of the 2007 Senior Credit Facility matures January 18, 2013. We intend to pursue an extension or refinancing of the revolving credit facility prior to the maturity date. In addition, we had $6.2 million of cash and cash equivalents as of July 31, 2012, compared to cash and cash equivalents of $47.9 million as of January 31, 2012. Our working capital surplus was $8.9 million and $49.3 million as of July 31, 2012 and January 31, 2012, respectively.
We generated tax operating losses in recent years that have significantly reduced the cash requirements for federal and state income taxes. At January 31, 2012, we had approximately $38.0 million of net operating loss carryforwards expiring in various years through fiscal year 2019, if not utilized to offset future taxable income. The acquisition of MGHC Holding added $13.2 million in usable net operating loss carryforwards that begin expiring in fiscal 2029 after application of Section 382 of the Internal Revenue Code of 1986, as amended (the "Code"). Such MGHC Holding net operating loss carryforwards are limited to an average use of $2.6 million per year over the next five years. We expect to utilize the full amount of available net operating loss carryforwards to offset taxable income during fiscal year 2012, other than net operating loss carryforwards that are limited to an annual amount of usage under Section 382 of the Code. We expect that our cash requirements for income taxes will increase significantly beginning in fiscal 2012 with the utilization of net operating loss
61
carryforwards. Further, if we undergo a more than 50% "ownership change" within the meaning of Section 382 of the Internal Revenue Code, our ability to utilize pre-change losses may be limited.
Cash Flows
The following table summarizes the principal elements of our cash flows:
| |
|
|
|
Twenty-Six Weeks Ended | ||||||||||||
|---|---|---|---|---|---|---|---|---|---|---|---|---|---|---|---|---|
| |
Fiscal 2009 |
Fiscal 2010 |
Fiscal 2011 |
August 2, 2011 |
July 31, 2012 |
|||||||||||
Total cash provided by (used in): |
||||||||||||||||
Operating activities. |
$ | 20,857 | $ | 42,429 | $ | 81,675 | $ | 48,755 | $ | 30,096 | ||||||
Investing activities |
(10,863 | ) | (38,092 | ) | (42,314 | ) | (11,781 | ) | (75,651 | ) | ||||||
Financing activities |
(10,347 | ) | (286 | ) | 4,140 | (11,761 | ) | 3,797 | ||||||||
Net increase (decrease) in cash and cash equivalents |
(353 | ) | 4,051 | 43,501 | 25,213 | (41,758 | ) | |||||||||
Cash and cash equivalents, beginning of period |
747 | 394 | 4,445 | 4,445 | 47,946 | |||||||||||
Cash and cash equivalents, end of period |
$ | 394 | $ | 4,445 | $ | 47,946 | $ | 29,658 | $ | 6,188 | ||||||
Operating cash flows. Net cash provided by operating activities was $30.1 million for the twenty-six weeks ended July 31, 2012, compared to cash provided of $48.8 million for the twenty-six weeks ended August 2, 2011. The $18.7 million decrease in cash flows from operating activities was primarily due to the following differences as compared to the prior year:
- •
- $15.2 million improvement in our net income for the twenty-six weeks ended July 31, 2012, offset
by elements of the increase that are related to non-cash expense included in net income of the prior year, including: $12.5 million of non-cash
paid-in-kind interest related to debt repaid and debt converted into shares of our common stock in connection with the initial public offering in November 2011, and
$1.9 million on non-cash loss from debt extinguishment;
- •
- Decrease to fund $9.8 million increase in inventory related to new and acquired stores and warehouses in new
markets;
- •
- Decrease of $11.3 million related to the timing of cash requirements for accounts payable payments in the prior
year;
- •
- Increase of $4.3 million in non-cash deferred tax expense; and
- •
- Decrease of $2.7 million due to other changes in operating assets and liabilities.
Net cash provided by operating activities was $81.7 million for fiscal 2011, compared to $42.4 million for fiscal 2010. The $39.2 million increase in cash flows from operating activities was comprised of the $34.0 million improvement in our net income during fiscal 2011 as compared to the prior year and an $11.2 million increase in cash from changes in operating assets and liabilities as compared to the prior year due to an increase in accounts payable and accrued liabilities due to increased sales levels, offset by a $6.0 million decrease in adjustments to reconcile net income to net cash provided by operating activities primarily due to a deferred income tax benefit upon release of our valuation allowance, net of a non-cash loss from debt extinguishment.
Net cash provided by operating activities was $42.4 million for fiscal 2010, compared to $20.9 million for fiscal 2009. The $21.5 million increase in cash flows from operating activities was primarily attributable to an increase in our net income during fiscal 2010, which was partially offset by an increase in accounts receivable for vendor incentives, cash used for payments to our vendors and
62
increased floor sample inventory purchases for the new stores we opened during fiscal 2010. The increase in the accounts receivable for vendor incentives was mainly attributable to increases in (1) purchases of merchandise on which volume-based incentives are earned in response to higher sales during fiscal 2010, (2) earned incentives that settle annually and (3) the number of new stores opened during fiscal 2010 for which incentives become receivable from certain vendors upon store opening.
Investing cash flows. Net cash used in investing activities was $75.7 million for the twenty-six weeks ended July 31, 2012, compared to net cash used of $11.8 million for the twenty-six weeks ended August 2, 2011. The $63.9 million increase in cash flows from investing activities was primarily due to the May 2012 Mattress Giant acquisition for approximately $44.0 million. Capital expenditures increased $19.9 million. The increase in capital expenditures reflected new store openings, renovations of the stores acquired in November 2011 and May 2012 from Mattress Giant, and the ongoing design and implementation of our new enterprise resource planning system. The renovations of Mattress Giant stores acquired in November 2011 were substantially completed during the twenty-six weeks ended July 31, 2012 and resulted in $3.1 million in capital expenditures. The renovations of Mattress Giant stores acquired in May 2012, expected to be substantially complete by the end of Fiscal 2012, resulted in $4.7 million in capital expenditures in the thirteen weeks ended July 31, 2012. We expect to incur additional capital expenditures of approximately $10.1 million in completing the renovation of the acquired Mattress Giant stores.
Net cash used in investing activities was $42.3 million during fiscal 2011, compared to $38.1 million in fiscal 2010. Capital expenditures increased $7.0 million. Excluding stores added through acquisitions, we opened 106 new stores during 2011, compared to 85 new stores in fiscal 2010. Partially offsetting the increase in cash used for investing activities during fiscal 2011 was a decrease of $2.8 million in cash used to complete our acquisition in fiscal 2011 as compared to two acquisitions that occurred in fiscal 2010. The fiscal 2011 acquisition added 55 new stores.
Net cash used in investing activities was $38.1 million during fiscal 2010, compared to $10.9 million in fiscal 2009. Capital expenditures increased $16.4 million. Excluding stores added through acquisitions, we opened 85 new stores during 2010, compared to 37 new stores in fiscal 2009. Also contributing to the increase in cash used for investing activities during fiscal 2010 was $10.8 million of cash used to complete two separate acquisitions, net of $1.9 million of cash acquired. These acquisitions added 33 new stores during fiscal 2010.
Financing cash flows. Our financing cash flows consist of proceeds from the issuance of debt, borrowings, and repayments for scheduled debt service payments, and prepayments of other debt. Net cash provided by financing activities was $3.8 million for the twenty-six weeks ended July 31, 2012, compared to cash used of $11.8 million for the twenty-six weeks ended August 2, 2011. The $15.6 million decrease was the result of a reduction in debt repayments primarily as a result of the repayment of related-party debt in conjunction with the initial public offering in November 2011.
During fiscal 2011, net cash provided by financing activities was $4.1 million, compared to net cash used of $0.3 million in fiscal 2010. The $4.4 million increase in net cash provided by financing activities during fiscal 2011 was attributable to $110.4 million in proceeds from issuance of common stock, net of costs, in connection with the initial public offering partially offset by net debt repayments, utilizing proceeds from the initial public offering, and debt issuance costs in the aggregate amount of $106.3 million during fiscal 2011.
During fiscal 2010, net cash used in financing activities was $0.3 million, compared to $10.3 million in fiscal 2009. The decrease in net cash used in financing activities during fiscal 2010 was attributable to lower net borrowings and repayments on the revolving portion of the 2007 Senior Credit Facility.
63
Debt Service
As of July 31, 2012, we had total indebtedness of $232.2 million. The components of our debt as of July 31, 2012 were as follows (amounts in thousands):
2007 Senior Credit Facility |
$ | 232,216 | ||
Other |
14 | |||
Total long-term debt |
$ | 232,230 | ||
2007 Senior Credit Facility. On January 18, 2007, Mattress Holding, our indirect subsidiary, entered into a credit agreement with UBS Securities LLC and certain of its affiliates and other lenders for a term loan and revolving credit facility, which was amended and restated on February 16, 2007 (as amended and restated, the "2007 Senior Credit Facility"). As of July 31, 2012, the 2007 Senior Credit Facility consisted of (i) a $240.0 million term loan facility maturing January 2014 and (ii) a $35.0 million revolving credit facility maturing on January 18, 2013, which includes a $15.0 million letter of credit subfacility and a $5.0 million swingline loan subfacility. As of July 31, 2012, there was an aggregate of $227.2 million of term loan borrowings outstanding under the 2007 Senior Credit Facility, which is net of an unamortized debt discount of $0.3 million. As of July 31, 2012, there were $5.0 million in borrowings under the revolving portion of the 2007 Senior Credit Facility and there was approximately $1.0 million in outstanding letters of credit. On August 28, 2012, we paid off the outstanding revolver borrowings on the 2007 Senior Credit Facility of $5.0 million. At September 7, 2012, there were standby letters of credit outstanding in the amount of $1.0 million and additional borrowings available of $34.0 million.
Borrowings under the 2007 Senior Credit Facility bear interest at a rate equal to an applicable margin plus, at our option, either (a) a base rate determined by reference to the highest of (i) the corporate base rate of interest established by the administrative agent and (ii) the federal funds effective rate from time to time plus 0.50%, or (b) the London Interbank Offered Rate, or "LIBOR," determined by reference to the costs of funds for deposits for the interest period relevant to such borrowing adjusted for certain additional costs.
The applicable margin percentages for term loans are 1.25% for base rate loans and 2.25% for LIBOR loans. The applicable margin percentages for revolving loans are based upon our total leverage ratio and vary from 1.25% to 1.75% for base rate loans and from 2.25% to 2.75% for LIBOR loans. As of July 31, 2012, the applicable margin percentage for revolving loans was 1.25% for base rate loans and 2.25% for LIBOR loans, and as of that date, $5.0 million in loans were outstanding. Swingline loans bear interest at an interest rate equal to the interest rate for base rate loans, and as of July 31, 2012, no such borrowings were outstanding. On the last day of each quarter, we also pay a commitment fee (payable in arrears) in respect of any unused commitments under the revolving credit facility, subject to adjustment based upon the level of the total leverage ratio which varies from 0.375% to 0.50%. As of July 31, 2012, the commitment fee was 0.375%. We also pay fees for the issuance and maintenance of letters of credit.
Outstanding borrowings under the 2007 Senior Credit Facility are payable in quarterly principal installments of $0.6 million, with the outstanding balance due at maturity on January 18, 2014. Furthermore, we are subject to an annual mandatory principal prepayment in an amount equal to a portion of "excess cash flow," as defined in the 2007 Senior Credit Facility, payable no later than 120 days after the end of each fiscal year. Such prepayments are first applied to reduce scheduled quarterly principal repayments for the next four quarters in order of maturity and then to reduce future quarterly payments through maturity on a pro-rata basis. We made excess cash flow payments in the amounts of $0.8 million and $2.1 million on June 1, 2011 and May 21, 2010, respectively, with respect to excess cash flows related to fiscal 2010 and 2009, respectively. There are other mandatory
64
prepayment requirements, subject to certain exceptions, from the net cash proceeds of certain asset sale and casualty and condemnation events, subject to reinvestment rights, from the net cash proceeds of any incurrence of certain debt, other than debt permitted under the 2007 Senior Credit Facility, and from the net cash proceeds of specified issuances of preferred equity securities. No such prepayments were required in fiscal 2009, fiscal 2010, and fiscal 2011. We may voluntarily repay outstanding loans under the 2007 Senior Credit Facility at any time without premium or penalty, other than customary "breakage" costs with respect to LIBOR loans.
Other Indebtedness. Our subsidiaries have various notes payable related to the purchase of equipment totaling $14,000 that bear interest at 6.8%, with monthly principal and interest payments of various amounts through 2013. Notes payable for financing of equipment purchases are collateralized by certain equipment with carrying amounts that approximate the outstanding principal balances of the related notes payable as of July 31, 2012.
Covenant Compliance
We were in compliance with all of the covenants required under the 2007 Senior Credit Facility and our other indebtedness as of July 31, 2012. We believe that we will be able to maintain compliance with the various covenants required under our debt agreements for the next twelve months without amending any of the debt agreements or requesting waivers from the lenders that are party to the debt agreements. However, to permit the level of capital expenditures we plan to incur in fiscal 2012, we would need to seek either an amendment or waiver from the lenders of the restrictive covenant relating to limits on capital expenditures.
Critical Accounting Policies and Use of Estimates
Our consolidated financial statements are prepared in accordance with U.S. GAAP. In connection with the preparation of our financial statements, we are required to make assumptions and estimates about future events, and apply judgments that affect the reported amounts of assets, liabilities, revenues, expenses and the related disclosures. We base our assumptions, estimates and judgments on historical experience, current trends and other factors that management believes to be relevant at the time our consolidated financial statements are prepared. On a regular basis, we review the accounting policies, assumptions, estimates and judgments to ensure that our financial statements are presented fairly and in accordance with U.S. GAAP. However, because future events and their effects cannot be determined with certainty, actual results could differ from our assumptions and estimates, and such differences could be material.
65
Our significant accounting policies are discussed in Note 1, Business and Summary of Significant Accounting Policies, of the Notes to Consolidated Financial Statements, included elsewhere in this prospectus. We believe that the following accounting estimates are the most critical to aid in fully understanding and evaluating our reported financial results, and they require our most difficult subjective or complex judgments, resulting from the need to make estimates about the effect of matters that are inherently uncertain. We have reviewed these critical accounting estimates and related disclosures with the audit committee of our board of directors.
| Description | Judgments and Uncertainties | Effect if Actual Results Differ From Assumptions |
||
|---|---|---|---|---|
Revenue Recognition |
||||
The Company accrues a liability for estimated sales returns and exchanges in the period that the related sales are recognized. The Company provides its customers with a comfort satisfaction guarantee whereby the customer may return or exchange the original mattress anytime during 100 days from the date of original purchase. Mattresses received back are reconditioned pursuant to state law and resold through the Company's clearance center stores as used merchandise. The Company accrues a liability for the estimated costs, net of estimated restocking fees, related to the diminishment in value of the returned merchandise at the time the sale is recognized based upon historical experience. The liability for sales returns and sales exchanges is included in other accrued liabilities. |
Effective August 2010, we revised our return and exchange policy to enable our customers to return products for any reason up to 100 days after the purchase date for either a full refund or exchange credit without the incurrence of exchange or other fees. The new policy is referred to as the Happiness Guarantee™. Prior to this new policy, a customer could exchange a mattress for a similar mattress from 30 days to 90 days from the original purchase date, subject to a restocking fee, although the restocking fee could be waived at the discretion of the sales associate. We expect that the Happiness Guarantee™ will result in an increased amount of returns and exchanges. The increased activity and the elimination of exchange fee collections are expected to increase the estimated cost of sales returns and exchanges. |
|
||
66
| Description | Judgments and Uncertainties | Effect if Actual Results Differ From Assumptions |
||
|---|---|---|---|---|
Vendor Incentives |
||||
Vendor incentives that are based on a percentage of the cost of purchased merchandise, such as cooperative advertising funds, are accounted for as a reduction of the price of the vendor's products and result in a reduction of cost of sales when the merchandise is sold. Vendor incentives that are direct reimbursements of costs incurred by the Company to sell the vendor's products are accounted for as a reduction of the related costs when recognized in the Company's results of operations. |
|
If actual results are not consistent with the assumptions and estimates used, we may be exposed to additional adjustments that could materially, either positively or negatively, impact our gross profit and inventory valuation. However, substantially all receivables associated with these activities are collected within the following fiscal year and all amounts deferred against inventory turnover within the following fiscal year and, therefore, do not require subjective long-term estimates. Adjustments to our gross profit and inventory in the following fiscal year have historically not been material. |
||
Self-Insured Liabilities |
||||
When estimating our self-insured liabilities, we consider a number of factors, including historical claims |
|
We do not believe there is a reasonable likelihood there will be a material change in the estimates or assumptions we use to calculate our self-insured liabilities. However, if actual |
||
67
| Description | Judgments and Uncertainties | Effect if Actual Results Differ From Assumptions |
||
|---|---|---|---|---|
| experience, demographic factors, severity factors and valuations provided by independent third-party actuaries. Periodically, we review our assumptions and the valuation provided by independent third-party actuaries to determine the adequacy of our self-insured liabilities. |
results are not consistent with our estimates or assumptions, we may be exposed to losses or gains that could be material. | |||
Goodwill and Indefinite-Lived Intangible Assets |
||||
We assign the carrying value of these intangible assets to their "reporting units" and apply the impairment test at the reporting unit level. We complete our impairment evaluation by performing internal valuation analyses, considering other publicly available market information and using an independent valuation firm, as appropriate. The test for goodwill impairment involves a qualitative evaluation as to whether or not it is more likely than not that the fair value of a reporting unit is less than its carrying value using an assessment of relevant events and circumstances. If any reporting unit is concluded to be more likely impaired than not the following steps are performed for such reporting unit: (1) comparing the fair |
The impairment test for goodwill is applied to the "reporting unit." A reporting unit is defined as an operating segment or one level below a |
The fair values of the majority of our reporting units, as determined by an allocation of total enterprise value to the reporting units based on a systematic rationale and consistent methodology, were substantially in excess of the related carrying values in the most recent impairment test performed as of the end of the fourth quarter of fiscal 2011. We do not believe there is a reasonable likelihood that there will be a material change in the future estimates or assumptions we use to test for impairment of goodwill and other indefinite-lived intangible assets. However, if actual results are not consistent with our estimate or |
||
68
| Description | Judgments and Uncertainties | Effect if Actual Results Differ From Assumptions |
||
|---|---|---|---|---|
| value of a reporting unit with the carrying value of its net assets and (2) if the carrying value exceeds fair value, the fair value of goodwill is compared with the respective carrying value and an impairment loss
is recognized in the amount of the excess. The impairment test for indefinite-lived assets consists of a comparison of the fair value of the asset with its carrying amount. If the carrying amount of an intangible asset exceeds its fair value, an
impairment loss is recognized in an amount equal to that excess. After an impairment loss is recognized, the adjusted carrying amount of the asset establishes the new accounting basis. The carrying value of goodwill at July 31, 2012, was $331.8 million. The carrying value of indefinite-lived intangible assets, consisting of trade names and trademarks at July 31, 2012 was $90.1 million. |
segment, a component. Each metropolitan market is a separate operating segment. The store unit components that comprise each operating segment are aggregated within each operating segment as all of the stores have similar economic characteristics. All of our goodwill has been allocated to our market-level reporting units for impairment testing. | assumptions, we may be exposed to an impairment charge that could be material. | ||
Long-Lived Assets |
||||
When evaluating long-lived assets for potential impairment, we first compare the carrying value of the asset to the asset's undiscounted estimated future cash flows. If the estimated future cash flows are less than the carrying value of the asset, we calculate an impairment loss. |
Our impairment loss calculations contain uncertainties because they require management to make assumptions and to apply judgment to estimated future cash flows and asset fair values, including forecasting useful lives |
We do not believe there is a reasonable likelihood that there will be a material charge in the estimates or assumptions we use to calculate long-lived asset impairment losses. However, if actual results are not consistent with our estimates and assumptions used in estimating future cash flows and asset fair values, we may be exposed to losses that could be material. |
||
69
| Description | Judgments and Uncertainties | Effect if Actual Results Differ From Assumptions |
||
|---|---|---|---|---|
| The impairment loss calculation compares the carrying value of the asset to the asset's estimated fair value, which is based on estimated future discounted cash flows. We recognize impairment if the amount of the asset's
carrying value exceeds the asset's estimated fair value. Based upon the impairment review, and a decline in performance of certain stores, impairment losses of approximately $2.3 million, $1.7 million and $0.1 million were recognized during fiscal 2009, fiscal 2010 and fiscal 2011, respectively. |
of the assets and selecting the discount rate that reflects the risk inherent in future cash flows. | |||
Costs Associated With Location Closings |
||||
Our estimate of future cash flows is based on historical experience; our analysis of the specific real estate market, including input from independent real estate firms; and economic conditions that can be difficult to predict. We do not discount cash flows in estimating the liability recorded for location closures. |
|
We believe there is a reasonably possible likelihood that there will be a material change in the estimates or assumptions we use to calculate our location closing liability that are outside of our control and we may be exposed to losses or gains that could be material. A 10% change in our location closing liability at January 31, 2012, would have affected net earnings by less than $0.1 million in fiscal 2011. |
||
70
| Description | Judgments and Uncertainties | Effect if Actual Results Differ From Assumptions |
||
|---|---|---|---|---|
The estimated liability for location closings was $0.6 million at January 31, 2012. The effect of changes in previous estimated liabilities resulted in charges to earnings of approximately $0.6 million, $(0.1) million and less than $0.1 million during fiscal 2009, fiscal 2010 and fiscal 2011, respectively. |
||||
Acquisitions—Purchase Price Allocation |
||||
|
Management estimates the fair value of assets and liabilities based upon quoted market prices, the carrying value of the acquired assets and widely accepted valuation techniques, including discounted cash flows and market multiple analyses. Unanticipated events or circumstances may occur which could affect the accuracy of our fair value estimates, including assumptions regarding industry economic factors and business strategies. We typically engage an independent valuation firm to assist in estimating the fair value of significant assets and liabilities of acquired businesses. The total amount of goodwill arising from an acquisition may be assigned to one or more reporting units in situations where the acquired business |
The amounts of goodwill assigned to reporting units may give rise to goodwill impairment charges in future periods based upon the operating results of the reporting units relative to other reporting units and the resulting effect on the allocation of enterprise value to reporting units for goodwill impairment testing. |
||
71
| Description | Judgments and Uncertainties | Effect if Actual Results Differ From Assumptions |
||
|---|---|---|---|---|
| consists of specialty mattress retail operations in multiple metropolitan markets or when other reporting units are expected to benefit from synergies of the combination. The method of assigning goodwill to reporting units is reasonable and supportable and applied in a consistent manner and may involve estimates and assumptions. | ||||
Product Warranties |
||||
We accrue for the estimated cost of warranty coverage at the time the sale is recognized. |
|
During the past three fiscal years we have not made any material changes to the methodology we use to establish our reserves for warranty claims. A 10% change in our provision for warranty claims at January 31, 2012, would have reduced our net earnings by approximately $0.2 million for fiscal 2011. We do not believe that there is a reasonable likelihood that there will be a material change in the future estimates or assumptions we use to establish our provision for warranty claims. However, if actual warranty claims are not consistent with our estimates or assumptions, we may be exposed to losses or gains that could be material. |
||
Income Taxes |
||||
|
|
|
||
72
| Description | Judgments and Uncertainties | Effect if Actual Results Differ From Assumptions |
||
|---|---|---|---|---|
| differences between the amount of assets and liabilities for financial and tax reporting purposes that will reverse in subsequent years. Deferred tax assets and liabilities are measured using the tax rates expected to apply to taxable income in the years in which those temporary differences are estimated to be recovered or settled. The effect on deferred tax assets and liabilities of a change in the tax rate is recognized in income or expense in the period that the change is effective. Valuation allowances are established when necessary to reduce deferred tax assets to the amounts that are more likely than not to be realized. | make judgments about the tax rates expected to be in effect in the years in which those temporary differences are estimated to be realized or settled. In addition, we are also required to make estimates about the valuation allowances that we carry against our deferred tax assets in order to bring them to their net realizable value. Finally, our estimates of reserves related to potential tax exposures when it is more likely than not that a taxing authority will take a sustainable position that is contrary to ours requires significant judgment. | deferred tax benefit related to our net operating losses ("NOLs") would not be realized in future periods; as such, we recognized a valuation allowance to reduce the deferred tax asset to its net realizable value. As of
January 31, 2012, we determined that it was more likely than not that the deferred tax assets would be realized. Accordingly, the change in valuation allowance of $20.1 million, through the combination of current year operations and the
valuation allowance release due to our determination that the realization of deferred tax assets is more likely than not, resulted in a benefit to deferred tax expense in our statement of operations. We do not believe that there is a reasonable likelihood that there will be a material change in the future estimates or assumptions we use to establish our deferred tax assets and liabilities. |
||
Stock-Based Compensation |
||||
Stock-based awards granted primarily to Company employees prior to the initial public offering consisted of equity ownership units of Mattress Holdings, LLC ("Class B Units") that were issued to employees of the Company for future services and will remain outstanding until the |
All Class B Unit grants occurred while the Company was a private company. The method used by the Company to estimate the fair value of Class B Unit grants was based upon a two-step process as of the date of each award. The first step involved valuation of the Company and the related |
The amount of compensation expense that is recognized over the service period involves estimates of the number of employees who will forfeit their stock-based awards before vesting occurs. Cumulative effect adjustments to compensation expense are recognized at the time that the estimates of employee forfeitures are revised. |
||
73
| Description | Judgments and Uncertainties | Effect if Actual Results Differ From Assumptions |
||
|---|---|---|---|---|
| date that Mattress Holdings, LLC is ultimately dissolved, except for Class B Units that are forfeited. There was no stated limit on the number of Class B Units that may be issued. Each holder of vested
Class B Units is entitled to its pro rata share of future distributions to the equity owners of Mattress Holdings, LLC after certain other equity holders have received aggregate preferred distributions equal to the greater of
(i) $154.3 million or (ii) the fair value of Mattress Holdings, LLC's equity on the relevant grant date of the Class B Units. Each Class B Unit grant is comprised of four tranches with separate vesting criteria. The B-1 tranche comprises 40% of the total units granted and vests over five years in 20% increments on each grant's anniversary date. Any unvested portion of the B-1 tranche fully vests immediately prior to the earlier of a change of control or the completion of an initial public offering (such change or initial public offering, a "Liquidity Event"). The unvested portion of the outstanding Class B-1 Units vested immediately prior to the consummation of the initial public offering on November 23, 2011. The B-2 tranche, which comprises 40% of the total units granted, and the B-3 and B-4 tranches, each of which comprises 10% of the total units granted, vest in their entirety upon the earlier of a change of control or the expiration of |
after-debt value attributable to the equity owners. The Company's fair value for grants of Class B Unit awards was based upon a composite of values determined by a market approach, using both market multiple and
comparable transaction methodologies, and a discounted cash flow methodology. The second step to valuing Class B Units involved the allocation of the total equity value determined on each grant date among the Class B Units and other equity
holders using a probability weighted expected return methodology. Under this method, the allocation of equity value to Class B Units was determined for a number of possible outcomes, with each outcome weighted based upon management's estimate of
the likelihood of such outcome. The outcomes considered were: (1) ongoing operations without a Liquidity Event, (2) Liquidity Event resulting from a merger or sale to another party, (3) Liquidity Event resulting from an initial public
offering of the Company's common stock and (4) a distressed sale. The fair value of the Class B Unit awards, net of estimated forfeitures, is recognized as expense over a term that was based upon the timing and weighting of the expected outcomes derived from the fair value calculation. The Company estimates the fair value of stock awards granted pursuant to the 2011 Omnibus Incentive Plan based upon the nature of the awards. Stock |
Compensation expense recorded during fiscal 2010 included the effect of forfeitures that occurred during fiscal 2010 that were in excess of previous estimates and which resulted in the reversal of previously recognized expense in the amount of approximately $575,000. | ||
74
| Description | Judgments and Uncertainties | Effect if Actual Results Differ From Assumptions |
||
|---|---|---|---|---|
| lock-up agreements entered into by J.W. Childs and its affiliates ("Lock-up Agreements") in connection with a Liquidity Event if the return on investment to JWC Mattress Holdings, LLC meets or exceeds established
thresholds. The applicable thresholds were met and the Class B-2, B-3 and B-4 Units vested on the Lock-up Agreement expiration date on May 15, 2012. Holders of Class B Units who are employees of the Company are subject to forfeiture of
all or a portion of Class B Units upon termination of employment. In connection with the initial public offering and the adoption of the 2011 Omnibus Incentive Plan, eligible employees were granted stock options at an exercise price equal to the initial public offering price of our common stock. One-half of the stock options granted to the Company's employees in the initial grant are subject to a five-year time-based vesting schedule, while the remaining one-half of the stock options are subject to a four-year market-based vesting schedule, with such vesting based on specified stock price increase targets, as set forth in the option award agreement evidencing the grant of such stock options. |
options that vest based upon the passage of time are valued using a Black-Scholes option pricing model, which utilizes assumptions for risk-free interest rate, dividend yield, stock price volatility and weighted average expected term. Stock options that include additional market vesting conditions are valued using a Monte Carlo Simulation approach, which utilizes similar input assumptions as the Black-Scholes option pricing model, plus a suboptimal exercise factor. The assumptions involving stock price volatility and stock option term are subject to a higher degree of uncertainty due to the limited period of time that the Company's equity shares have been publicly traded and limited experience with stock option awards. The Company has utilized data of publicly-traded peer companies to provide a reasonable basis for such assumptions and has applied the simplified method as permitted by SAB 107 and SAB 110 in determining the stock option term. | |||
Our business is subject to seasonal fluctuations and we generally have experienced more sales and a greater portion of income during the second and third quarters of our fiscal year due to a concentration of summer season holidays, including Memorial Day, the Fourth of July and Labor Day, and other seasonal factors. While we expect this trend to continue for the foreseeable future, we also expect that the acquisitions we make and the timing of those acquisitions may have some effect on the impact of these seasonal fluctuations.
75
Summary Disclosures about Contractual Obligations and Commercial Commitments
The following summarizes certain of our contractual obligations at January 31, 2012 and the effect such obligations are expected to have on our liquidity and cash flows in future periods:
| |
Payments Due by Period | |||||||||||||||||||||
|---|---|---|---|---|---|---|---|---|---|---|---|---|---|---|---|---|---|---|---|---|---|---|
| |
Fiscal 2012 |
Fiscal 2013 |
Fiscal 2014 |
Fiscal 2015 |
Fiscal 2016 |
Thereafter | Total | |||||||||||||||
Long-term debt, including principal and interest(1) |
$ | 8,917 | $ | 233,074 | $ | — | $ | — | $ | — | $ | — | $ | 241,991 | ||||||||
Operating leases(2) |
81,852 | 70,412 | 57,785 | 44,587 | 29,660 | 53,272 | 337,568 | |||||||||||||||
Operating contracts(3) |
2,109 | 2,114 | — | — | — | — | 4,223 | |||||||||||||||
Reserves for uncertain tax positions(4) |
— | — | — | — | — | — | 373 | |||||||||||||||
Letters of credit(5) |
25 | — | 25 | 25 | — | 150 | 225 | |||||||||||||||
Total |
$ | 92,903 | $ | 305,600 | $ | 57,810 | $ | 44,612 | $ | 29,660 | $ | 53,422 | $ | 584,380 | ||||||||
- (1)
- Future
contractual obligations on the 2007 Senior Credit Facility reflect the Company's current interest rate, which is based on LIBOR plus
2.25%.
- (2)
- Does
not include certain other expenses required to be paid by the Company under such operating leases, comprised primarily of the Company's
proportionate share of common area maintenance, property taxes and insurance. Such other expenses have typically amounted to approximately 25% of the base rent expense during recent fiscal years.
- (3)
- We
have certain operating contracts related to sponsorships and space rentals at special event venues.
- (4)
- Because
our reserves for uncertain tax positions are based on potential exposures when it is considered more likely than not that a taxing
authority may take a sustainable position on a matter contrary to our position, we cannot determine what date, if at all, the reserve will result in an obligation that must be settled.
- (5)
- We have outstanding letters of credit at January 31, 2012, which expire at varying times through 2017, including $0.8 million that are subject to automatic renewal for an additional one-year period on the anniversary date of the agreement, unless we receive notice from the counterparty that the letter of credit agreement has been terminated at least 30 days prior to the automatic renewal date.
Off-Balance Sheet Arrangements
Except for a guarantee of approximately $1.1 million that we have provided with respect to one real estate lease of a franchisee, we do not have any "off-balance sheet arrangements" (as such term is defined in Item 303 of Regulation S-K) that are reasonably likely to have a current or future effect on our financial condition, changes in financial condition, revenues or expenses, results of operations, liquidity, capital expenditures or capital resources.
Recent Accounting Pronouncements
In May 2011, the FASB issued new guidance regarding fair value measurements to ensure consistency between U.S. GAAP and International Financial Reporting Standards. The new guidance applies to all reporting entities that are required or permitted to measure or disclose the fair value of an asset, a liability, or an instrument classified in a reporting entity's stockholders' equity in the financial statements. The new guidance applies prospectively to periods beginning after December 15, 2011. The Company adopted the provisions of the new guidance effective February 1, 2012 and the
76
adoption of this standard did not have a material impact on the Company's financial position, results of operation, or cash flows.
In June 2011, the FASB issued new guidance to increase the prominence of other comprehensive income in financial statements. This guidance provides the option to present the components of net income and comprehensive income in either one single statement or in two consecutive statements reporting net income and other comprehensive income. This guidance is effective for fiscal years and interim periods beginning after December 15, 2011. The Company adopted the provisions of the new guidance effective February 1, 2012 and the adoption of this standard did not have a material impact on the Company's consolidated financial statements.
In December 2011, the FASB issued Accounting Standards Update No. 2011-11 "Balance Sheet (Topic 210): Disclosures about Offsetting Assets and Liabilities" ("ASU 2011-11"), which requires disclosures of gross and net information about financial and derivative instruments eligible for offset in the statement of financial position or subject to a master netting agreement. ASU 2011-11 will be effective for the Company in the first fiscal quarter of 2013 and is not expected to have a material impact on the Company's consolidated financial position, results of operations or cash flows.
In July 2012, the FASB issued new guidance which gives companies the option to perform a qualitative assessment to determine whether it is more likely than not that an indefinite-lived intangible asset is impaired, and in some cases, bypass the two-step impairment test. This guidance is effective for annual and interim indefinite-lived intangible asset impairment tests performed for fiscal years beginning after September 15, 2012. Early adoption of the new guidance is permitted. The Company is currently assessing when it will adopt this guidance.
Quantitative and Qualitative Disclosures About Market Risk
Interest Rate Risk. Our earnings are affected by changes in interest rates due to the impact those changes have on our interest expense on borrowings under the 2007 Senior Credit Facility with interest rates that vary in direct relationship to changes in the prime interest rate or LIBOR. Our floating rate indebtedness was approximately $228.7 million at January 31, 2012. If short-term floating interest rates increased by 100 basis points during the prior twelve months, our interest expense would have increased by approximately $2.3 million during that year. This amount is determined by considering the impact of the hypothetical change in interest rates on our average amount of floating rate indebtedness outstanding and cash equivalent balances for fiscal 2011.
Impact of Inflation. We believe that inflation has not had a material impact on our results of operations for any year during the three-year period ended January 31, 2012. We cannot be sure that inflation will not have an adverse impact on our operating results or financial condition in future periods.
77
Our Company
We are a leading specialty retailer of mattresses and related products and accessories in the United States. As of July 31, 2012, we and our franchisees operated 957 and 141 stores, respectively, primarily under the Mattress Firm® name, in 76 markets across 28 states. In 2011, we ranked first among the top 100 U.S. furniture stores for both growth in store count and percentage increase in sales and second in total sales among specialty retailers according to Furniture Today. Based on our analysis of information published to date in Furniture Today and Company data, which gives effect to our recent acquisitions, we believe that, among multi-brand mattress specialty retailers in the United States, we have the largest geographic footprint, the greatest number of stores nationwide and the highest net sales on an aggregate basis. We believe that, in our markets, Mattress Firm® is a highly recognized brand known for its broad selection, superior service and compelling value proposition. Based on our analysis of public store information for our competitors and our Company data, we believe more than 90% of our company-operated stores are located in markets in which we had the number one market share position as of July 31, 2012. Since our founding in 1986 in Houston, Texas, we have expanded our operations across four time zones, with the goal of becoming the premier national mattress specialty retailer.
We believe our destination retail format provides our customers with a convenient, distinctive and enjoyable shopping experience. Key highlights that make us a preferred destination and that differentiate our brand and services include our:
- •
- extensive product selection of the top name brands;
- •
- contemporary, easy-to-navigate store design utilizing our unique Comfort
By Color® merchandising approach that organizes mattresses by comfort style;
- •
- price, comfort and service guarantees;
- •
- superior customer service by our educated, extensively-trained and commissioned sales associates of whom over 93% are
full-time employees;
- •
- Mattress Firm Red Carpet Delivery Service®, which includes a
three-hour delivery window; and
- •
- highly visible and convenient store locations in major retail trade areas.
Our stores carry both a broad assortment of leading national mattress brands and our exclusive brands. With a wide range of styles, sizes, price points and unique features, we provide our customers with their choice of traditional mattresses, including Sealy, Stearns & Foster and Simmons, as well as specialty mattresses, such as Tempur-Pedic (for which we are the largest retailer in the United States) plus viscoelastic foam products infused with a gel material manufactured by Serta and marketed under the name iComfort, and similar products manufactured by Sealy and marketed under the name Optimum. We also offer a variety of bedding-related products and accessories.
We drive profitability in the markets in which we operate by penetrating a market with stores and leveraging fixed and discretionary costs, such as occupancy and advertising, as we gain sales volume, grow our brand presence and advance our operational scale. We have a proven track record of growing our store base through organic new store openings and acquisitions that typically include rebranding of the acquired stores to Mattress Firm®. In fiscal 2011, we generated net sales, Adjusted EBITDA and net income of $703.9 million, $87.5 million and $34.4 million, respectively. (Adjusted EBITDA is not a performance measure under U.S. GAAP. See "Prospectus Summary—Summary Historical and Unaudited Pro Forma Consolidated Financial and Operating Data" for a definition of Adjusted EBITDA and a reconciliation of Adjusted EBITDA to net income.) For the twenty-six weeks ended July 31, 2012, we generated net sales, Adjusted EBITDA and net income of $471.8 million,
78
$55.0 million and $19.8 million, respectively. From February 4, 2009 to July 31, 2012, we added 493 stores, which included 269 stores added through strategic acquisitions. The majority of these additional stores were located in markets where we had an existing presence, allowing us to increase our advertising spend per person and grow our net sales as well as Adjusted EBITDA at compound annual rates of 30.7% and 40.2%, respectively, while achieving 11 consecutive fiscal quarters of positive comparable-store sales growth through July 31, 2012.
We believe we have a compelling opportunity to further penetrate the fragmented specialty retail mattress industry through strategic acquisitions and continue profitable growth into the future. One example of this is our recent agreement to acquire substantially all of the operations and assets of Mattress XPress, Inc. and Mattress XPress of Georgia, Inc. (which entities operate Mattress X-Press stores), including 30 mattress specialty stores located primarily in South Florida and five stores in Georgia, states in which we operated 307 stores as of July 31, 2012.
Our Industry
Overall Market
We operate in the U.S. mattress retail market, in which net sales amounted to $11.4 billion in 2011, the most recent year for which industry retail sales data has been published. The market is highly fragmented, with no single retailer holding more than an 8% market share and the top ten participants accounting for less than 30% of the total market. According to Furniture Today, in 2011, mattress specialty retailers had a market share in excess of 43%, which represented the largest share of the market, having more than doubled their share over the past 15 years.
According to the information released in March 2012 by ISPA, the industry is expected to grow wholesale dollar sales by 7.2% in 2012. We believe that several trends support the positive outlook for long-term growth of the U.S. mattress retail market:
- •
- First, with increased advertising that focuses on the benefits of a better night's sleep, consumers have shown an
increasing willingness to spend more money on mattresses and related products that are of a higher quality and provide extra comfort. The average price for a mattress at wholesale has increased from
$92 in 1990 to $259 in 2011, representing an average annual growth rate of 5%. This increasing price point trend is primarily the result of: (1) an industry shift towards specialty mattresses,
such as foam and air mattresses, which were sold at wholesale for an average of $559 per mattress in 2011 compared to $210 for a traditional innerspring mattress and (2) consumers desiring more
expensive innerspring mattresses that have enhanced technology and comfort features.
- •
- Second, there have been recent technological improvements made to mattresses that are leading people to replace their old
mattresses. We believe Mattress Firm® is at the forefront of these technological changes, as demonstrated by the variety of specialty
mattresses we offer. Specialty product sales comprised 32.4%, 45.3% and 49.6% of our net sales for fiscal 2010, fiscal 2011 and the first half of fiscal 2012, respectively. Our growth in this area has
outpaced that of the mattress retail industry as a whole. For example, our sales of specialty products nearly doubled in fiscal 2011 over the prior year compared with an increase of only 30% in the
industry during the comparable period.
- •
- Third, as "baby boomers" (which refers in this prospectus to people born between 1946 to 1964) age and begin to spend the income that they have saved during their time in the workforce, it is our belief that they will spend a disproportionate amount compared to the overall population on products that improve their comfort—for example, luxury mattresses and related products.
79
Distribution Channels
Wholesale. The U.S. wholesale mattress industry, which includes mattresses and their supporting box springs (also referred to as foundations), as tracked by ISPA, was a $6.3 billion market in 2011. The U.S. wholesale mattress segment (which excludes foundations) accounted for $5.0 billion of the total and has grown at an average annual rate of 6.0% since 1990. The mattress segment has historically experienced stable growth, as 2008-2009 was the only period in over 30 years during which the segment experienced a multi-year decline in mattress sales, as wholesale mattress sales dropped from $5.3 billion in 2007 to $5.0 billion in 2011. We believe that the industry has the potential to return to its pre-2008 levels, and that we are poised to take advantage of that future growth.
Retail. The U.S. retail mattress market is made up primarily of mattress specialty retailers, furniture retailers and department stores. Retailers compete based on product selection, customer experience and service, price, store location and brand recognition.
- •
- Mattress Specialty Retailers focus primarily on mattresses and related
products and accessories and typically have a broader product selection and quicker availability as compared to other mattress retail channels. Consumers have shown a preference to purchase their
mattresses in this channel due to the broad merchandise assortment and higher quality service they receive. As a result, this channel has gained considerable market share relative to traditional
furniture stores and department stores, having experienced a market share increase from 19% in 1993 to 43% in 2010 (the most recent year for which retail distribution channel data has been published).
- •
- Traditional Furniture Stores typically dedicate a majority of their retail
floor space to home furnishings other than mattresses. While this channel comprised the majority of the U.S. mattress retail industry prior to 1993, it has lost significant market share since that
time, decreasing from 56% in 1993 to 38% in 2010.
- •
- Department Stores include many of the larger national chains selling a
variety of products from clothing to home furnishings. Like traditional furniture stores, department stores have lost market share in the mattress category, decreasing from 11% in 1993 to 5% in 2010.
- •
- Other distributors of mattress products generally include big box retailers, warehouse clubs, catalogs, telemarketing, direct marketing, the internet, discount department stores, furniture rental stores and factory direct operators. While the constituents within this category have shifted somewhat since 1993, their aggregate market share constituted approximately 14% in both 1993 and 2010.
Brand Overview
There are nearly 500 manufacturers in the bedding industry, with the four largest manufacturers, Serta, Sealy, Simmons and Tempur-Pedic, representing approximately 66% of the dollar value of the mattress market in 2011 and the 15 largest manufacturers accounting for approximately 86% during the same period. In general, the bedding industry has faced little competition from imported products as a result of the short lead times required by mattress retailers, high shipping costs and relatively low direct labor expenses in mattress manufacturing. Manufacturers sell traditional innerspring products and specialty products across a wide range of styles, sizes, price points and technologies. While conventional mattresses still accounted for approximately 70% of total bedding sales by manufacturers in the United States in 2011, in recent years, specialty mattresses, which use foam and air technology, have grown at a much faster rate than the industry as a whole. In 2011, specialty bedding producer Tempur-Pedic accounted for approximately 14% of total bedding sales. As new research emerged showing the link between proper sleep and good health, Mattress Firm® responded to the growing demand for specialty mattresses by expanding its product selection.
80
Merchandising
We believe our destination store retail concept provides our customers with a distinctive shopping experience, by offering an extensive assortment of mattresses and bedding-related products, featuring the best known national brands, a strong value proposition and superior service in a conveniently located, comfortable store environment.
Products
We carry over 75 different models and styles of conventional and specialty mattresses across a wide range of price points. We focus on the best-known national brands but also offer our customers our Hampton & Rhodes® private label mattresses and introduced YuMe™, our exclusive, proprietary brand, into select markets. Because of our strong relationships with our key suppliers, we are able to offer our customers many exclusive products, which are available only to us in our markets which also adds to our competitive differentiation. Periodically, we also carry limited quantities of special/opportunistic buys and our SuperCenter stores carry additional special buys as well as clearance and marked-down merchandise. All of the mattresses we purchase are assembled in the United States, and certain bedding-related furniture products are sourced from Asia.
Conventional Mattresses. Conventional mattresses, such as those of Sealy (including Sealy Posturepedic and Stearns & Foster) and Simmons (including Simmons Beautyrest), utilize steel-coil innersprings to provide comfort and support. These conventional mattresses represented approximately 70% of bedding industry sales in the United States in 2011 and approximately 46% of our total sales in fiscal 2011. In addition to these national brands, we also offer our Hampton & Rhodes® private label mattresses to provide our customers a greater choice of values among conventional mattresses.
Specialty Mattresses. In recent years, specialty mattresses, such as those manufactured by Tempur-Pedic, which utilize materials other than steel-coil innersprings to provide comfort and support, have grown at a much faster rate than the industry as a whole. Specialty mattresses represented approximately 45.3% of our total net sales in fiscal 2011. In response to this industry trend, we have expanded our assortment of mattresses that utilize viscoelastic foam, also referred to as memory foam, which features a high-density, temperature sensitive foam core that reduces pressure points and tossing and turning by contouring to one's body. Tempur-Pedic introduced viscoelastic beds in the United States in 1992 and is the leader in the United States market for viscoelastic foam mattresses. We carry a wide range of products from Tempur-Pedic (for which we are the largest retailer in the United States), viscoelastic foam products infused with a gel material manufactured by Serta and marketed under the name iComfort, and similar products manufactured by Sealy and marketed under the name Optimum.
Furniture and Accessories. All of our stores carry an assortment of bedding-related accessories, including bed frames, mattress pads and pillows. Bedding-related products and accessories represented approximately 7% of our total sales from company-operated stores in fiscal 2011.
Pricing Strategy
Our strong price and value proposition is a critical element of our merchandise strategy. We strive to provide customers the best possible value in our markets, supported by event driven print, radio and television advertising and promotions, and offer our customers a low price guarantee whereby we will beat our competitor's price on a comparable sleep set by 10% and refund the customer the difference at any time within 100 days after purchase. In addition, we supplement our regular merchandise line-up with special buys and clearance products at our Mattress Firm SuperCenter® stores to reinforce our value proposition and strong price image by offering a wide range of price points from promotional products (such as a $49 twin-size mattress) to luxury products (such as an $8,499 king-size set). As we
81
continue to increase our national presence, we believe that our ability to negotiate better terms with our vendors will continue to improve.
Customer Service
We enhance our customers' shopping experience with a superior level of service. Our sales associates are well trained in our products and unique comfort testing process, and empowered to satisfy our customers' comfort, value and service requirements consistent with established company guidelines. Their goal is to simplify the buying process and narrow customer choices to the one that meets his or her comfort and price needs. They are also trained to explain our comfort satisfaction and price guarantees as well as our third party deferred financing programs and product warranties. We clearly price all of our merchandise and provide our customers with a clear and concise process to select products and pricing.
After-sale service represents an important part of our overall customer service offering. We believe our Mattress Firm Red Carpet Delivery Service®, under which we provide same day delivery service within a three-hour delivery window, is distinctive in the industry. We also provide our customers with comfort satisfaction and price guarantees, and a manufacturer's warranty for product defects.
Store Design and Layout
We utilize two store formats: our traditional store format, which averages approximately 4,400 square feet, and our larger SuperCenter store format which averages approximately 6,500 square feet. As of July 31, 2012, we had 765 stores in our traditional store format and 192 stores in our SuperCenter store format. Our traditional stores are bright and open and have a warm, contemporary feel. We use wood, ceramic tile and carpet flooring and natural wood fixtures and shutters to create a comfortable, home-like look and feel. They feature a Value Zone display area that efficiently conveys a broad assortment of value priced/promotional conventional bedding. In total, we offer over 75 different models and styles of conventional and specialty mattresses across a wide range of price points in our stores conveying category dominance to our customers.
Our SuperCenter stores incorporate all of the design elements of our traditional stores and also have a specially merchandised warehouse rack area to display our clearance, overstock and returned products. The warehouse rack merchandise display and signage reinforce our value proposition for customers.
To enhance the customer in-store experience, our stores are designed to be comfortable and easy-to-shop with our unique Comfort By Color® shopping program. With Comfort By Color®, customers have the opportunity to determine the physical comfort that is best for them by comparing the feel of samples for all four different surface comfort options (Firm, Plush, Pillow-top and Specialty) in our Comfort Comparison Center. Each comfort style is assigned a particular color in our stores (Yellow, Orange, Red or Blue/Green), as denoted through bright and colorful pillows and foot protectors on all mattresses. Once customers have "found their comfort," they simply then "follow their color," by focusing the balance of their selection time on mattresses that fall into one of the particular color-coded comfort options. Comfort By Color® simplifies shopping for customers and makes it easier to train new associates on the store layout.
Our interior and exterior signage is an important element of our store design and selling strategy. We utilize bright banners, signs and lifestyle photographs to highlight the important features of each of our products as well as promotional pricing information. We display light boxes, neon signs, and professionally designed promotional posters in our windows to convey our national brand focus and value proposition. Through signage and other promotional materials, we can emphasize our strong relationship with the key mattress manufacturers with whom we do business.
82
Marketing and Advertising
The primary objective of our marketing program is to drive traffic into Mattress Firm® stores, with our brand promise of Save Money. Sleep Happy™. With what we believe to be a strong market penetration model, we leverage our advertising spending on a cost effective basis to build our market leadership position and brand awareness.
Message. Our marketing campaign has a three-prong approach to inform and educate customers as to why they should buy, why they should choose Mattress Firm® and why they should "buy now". Replace Every 8® is a proprietary campaign message to capture consumer interest and educate them on the recommended mattress replacement frequency for optimal health and comfort. Sleep Happy™ is Mattress Firm's unique selling proposition to ensure customers are happy with their price, comfort and service. Promotional events to motivate customers to "buy now" include long term financing, All the best brands...All the best prices!® and Side by side before you decide™. These elements combined with our memorable spokespeople and proprietary song offer compelling reasons for consumers to buy from Mattress Firm®.
Media. Our media strategy focuses on building awareness with our target customer to drive market share. Historically, our advertising program consisted primarily of radio and television, with the balance being print. In early fiscal 2008, due to the economic recession, we altered our marketing in light of decreased consumer confidence and traffic trends. For cost effectiveness, we increased our print program and focused primarily on price with limited-time offers. In fiscal 2010, fiscal 2011 and fiscal 2012, advertising spend increased allowing a shift in our media mix to approximately two-thirds broadcast, designed to build greater recognition of the Mattress Firm® brand, and emphasize what we believe to be our key competitive strengths. In addition, our online search engine marketing and alternative media presence has increased. We monitor traffic patterns and sales daily and can impact media changes through our comprehensive model by market to maximize return on investment.
Alternative Media. The primary objective of our social media strategy is to build awareness and engage interaction as the relevant source of information in our industry. We follow online conversations daily and develop engaging content to distribute via our Facebook, Twitter, Blog or YouTube sites. In addition, to expose Mattress Firm® to additional potential consumers across existing markets and drive qualified, invested traffic, we have partnered with Groupon for their "deal of the day" specials. We have successfully targeted new consumers with no advertising costs to drive incremental sales.
Analysis. To ensure focused marketing, we have implemented a targeted market-level media and message program. To maximize the efficiencies and effectiveness of these efforts, we use ShopperTrak, a nationally recognized company that monitors store traffic patterns and sales, which we consider key performance indicators. As of July 31, 2012, we utilized ShopperTrak in approximately 58% of our company-operated stores. We believe that this is a critical component to understanding our advertising program, spotting trends, supporting market-level tests and increasing local market share.
Purchasing and Distribution
Our merchandising team is responsible for all product selection, supplier negotiations, procurement, initial pricing determinations, product marketing plans and promotions, and coordination with local store and distribution center managers to implement our merchandise programs. Our merchandising team also regularly communicates with our field management and franchisees to monitor shifts in consumer preferences and market trends.
We operate 45 distribution centers, supporting all of our company-operated stores. In substantially all of our markets, a single distribution center serves all of the stores in that market. Our four primary suppliers deliver mattresses to most of our distribution centers within 48 hours of order, up to five days per week. We replenish our distribution centers based on the rate of sales, promotions and
83
predetermined stocking levels. Our merchandise is received, inspected and processed at our distribution centers and then delivered to our customers' homes or, to a lesser extent, to our stores. The majority of our sales result in the delivery of product from our distribution centers to our customers' homes. In all but two of our markets, we contract for the delivery of merchandise to our customers; and in one market, we utilize our own fleet and delivery services.
Supply Agreements
Sealy. We are party to a 2009 product supply agreement with Sealy for the purchase of mattress and foundation products under the Sealy and Sealy Posturepedic brand names. The agreement, as amended, will terminate upon the later of December 2015 and the time when the specified purchase target is met. The agreement sets forth various annual and quarterly volume-based rebates, advertising rebates and subsidies, discounts on the purchase of floor samples and new store opening funds and support, as well as various pricing, return and payment terms.
Serta. We are party to a 2011 product supply agreement with Serta for the purchase of mattress and related bedding products under the Serta brand names. The agreement will terminate when the specified purchase target is met. The agreement sets forth various monthly volume-based rebates, advertising rebates and subsidies, discounts on the purchase of floor samples and new store opening funds and support, as well as various pricing, return and payment terms.
Simmons. We are party to a 2010 dealer incentive agreement with Simmons that expires in June 2013. This agreement provides us with volume-based purchase incentives and rebates, point of purchase materials, discounts on the purchase of floor samples, direct reimbursement of sales and marketing expenses and new store opening funds. The agreement also covers certain pricing and payment terms as well as return and delivery policies.
Tempur-Pedic. We are party to a 2012 retailer agreement with Tempur-Pedic, which sets forth the general terms of purchase and sale transactions we may enter into with Tempu-Pedic relating to, among other things, indemnification, representation of Tempur-Pedic products in our stores and product warranties. The agreement may be supplemented from time to time by the terms of any Business Development Program offered by Tempur-Pedic in which we participate. The current Business Development Program, which provides a framework for volume rebates, floor samples and marketing assistance, will expire on December 31, 2012. We have agreed to comply with Tempur-Pedic Brandmark Manual, including provisions that restrict our use of Tempur-Pedic intellectual property in our advertising, promotions, website and digital marketing efforts.
Retail Store Operations
The principal objective of our store operations program is to provide our guests with what we believe is a superior level of customer service by staffing our stores with knowledgeable and enthusiastic sales associates, and expertly training those associates to satisfy customers' needs while achieving store performance objectives.
Field Management Organization and Store Staffing. Our store operations are centralized, with corporate-level guidelines providing for chain-wide consistency, while still allowing store level flexibility to meet our customers' value and service requirements. As of July 31, 2012, we employed 19 regional sales managers, 89 district managers, 24 market managers and 213 area managers, who, in conjunction with our corporate recruiting and training department, are responsible for the hiring and training of store associates, assistant managers and store managers. Our training and communications programs are designed to ensure chain-wide consistency of merchandise presentation, communicate corporate information to stores and monitor sales and profit performance. In addition, our district and area managers are primarily responsible for developing store managers, assistant managers and sales associates for succession and career development purposes.
84
Each store is staffed with one store manager and the appropriate number of associates, depending on the sales volume of the store. Store managers are responsible for maintaining visual merchandise presentations, ensuring the cleanliness and orderliness of the store and achieving store performance targets.
Recruiting and Training. We attempt to recruit sales associates and store managers who are highly motivated, goal oriented and who are seeking to take advantage of the career development opportunities we offer. Our recruitment portfolio includes an employee referral program, campus recruitment at select colleges and universities, and targeted recruiting in local markets of candidates who have relevant retail or consumer product experience. All of our sales associates attend our extensive internal training program, participate in product training sessions provided by vendors, and are enrolled in our online corporate university for extended learning and development opportunities. This training emphasizes product knowledge, selling skills, and store operations fundamentals. Our sales associates are trained to explain our comfort satisfaction and price guarantees as well as our third-party deferred financing programs and product warranties; they are also empowered to satisfy our customers' comfort, value and service requirements consistent with established company guidelines. Our corporate and field training function is responsible for developing and providing new-hire training, advanced training and in-store new product training, and ensuring the implementation of our store assessment program, which is conducted by an independent third party to measure and ensure the effectiveness and consistency of our selling process, in-store promotions, cleanliness and overall customer experience. The store assessment program also serves as an additional educational tool for our sales associates.
We have developed a proprietary internal best-practice sharing video network for all associates called Project 180. Project 180 complements our training efforts by allowing associates to view and contribute to "how-to" videos posted by peer associates offering practical tips and best-practice considerations for particular product-related or general selling concepts. With an active library of approximately 500 videos, this informal social learning tool has quickly become a high-impact staple in our training portfolio.
Compensation. We believe that our store associate compensation system is competitive and designed to create an incentive to sell. The compensation structure for our store associates is commission-based. In addition to a base draw against commissions, our sales associates can earn incentive bonuses based on store performance. All of our field management (regional managers, district managers and distribution center managers) earn a base salary and are eligible for incentive bonuses based on certain individual performance criteria.
Franchise Operations
As of July 31, 2012, our 12 franchisees operated 141 stores in 28 markets. In fiscal 2011, we received $4.7 million in franchise fees and royalty income from our franchisees. We grant franchises by territory, and have granted more than one franchise territory to some of our franchisees. Although we have franchises in the Denver, Colorado and Milwaukee, Wisconsin markets, most of our current franchises are located in markets with a population of less than 1.5 million people. We believe we are diligent in our selection of our franchisees, putting them through multiple vetting processes to ensure they are capable of operating the business at a high level.
Our franchise agreements typically give franchisees the exclusive right to operate Mattress Firm® stores in a specified territory for a 20 or 30 year term and are renewable at the option of the franchisee for an additional 5- to 10-year period, subject to certain conditions. The franchisees are required to pay an initial fee each time they open a store. In addition, the franchisees also pay us royalties based on gross sales. The agreements require franchisees to operate their businesses in accordance with our standard operating procedures, including specifications for the appearance, floor plans, signage, fixtures, displays, staffing and operations of stores. The agreements also require
85
franchisees to provide us with quarterly profit and loss statements, so we can monitor their ongoing performance and proactively identify any trouble areas, and give us the right to inspect and audit their books and records at any time during business hours. During the term of the franchise agreement and, subject to certain geographic limitations, for three years thereafter, franchisees may not operate, directly or indirectly, any other business selling bedding products or furniture. In exchange, we provide franchisees with our standard operations manual, sales training, print advertising materials, and assistance in selecting store sites. We also have a right of first refusal on the sale of each franchise and/or its equipment and inventory and, in certain instances, options to purchase the franchisees business at a predetermined time and purchase price.
Retail Stores and Markets
Site Selection
Our site selection strategy is to select or develop premium locations, which maximize our sales per store. We select geographic markets and store sites on the basis of demographics, quality of neighboring tenants, store visibility and signage opportunities, accessibility and lease economics. Key demographics include population density, household income and growth rates. We also utilize relative market share analyses to determine the likelihood of becoming the market leader in each market we serve within a certain period of time.
Our internal real estate group identifies opportunities for new and relocated stores with the involvement of our senior executives. We also contract with third party real estate brokers in each of our markets to identify sites and negotiate lease details. We prefer to develop freestanding units located in high traffic power centers with major retailers, such as Target, or other specialty and home furnishings retailers, such as Bed Bath & Beyond, Best Buy, Costco, Dick's Sporting Goods, The Home Depot and Whole Foods. If a free-standing unit or site is unavailable, we prefer to locate our in-line stores on the end of the shopping center for greater visibility.
Hours
Our stores are open 362 days a year, seven days a week, generally from 10:00 a.m. to 8:00 p.m. Monday through Saturday and 12:00 p.m. to 6:00 p.m. on Sunday.
Seasonality
Our business is subject to seasonal fluctuation, with the highest sales activity normally occurring during the second and third quarters of our fiscal year due to a concentration of summer season holidays, including Memorial Day, the Fourth of July and Labor Day, and other seasonal factors. While we expect this trend to continue for the foreseeable future, we also expect that the acquisitions we make and the timing of those acquisitions may have some effect on the impact of these seasonal fluctuations.
Properties
Our corporate headquarters are located in Houston, Texas and adjoin one of our Mattress Firm SuperCenter® stores. We lease all but one of our company-operated stores, which are located in 23 states, including Texas, Florida, Georgia, North Carolina and Virginia. Initial lease terms are generally for five to ten years, and most leases contain multiple five-year renewal options and rent escalation provisions. We have historically been able to renew or extend leases for our company-operated stores. Our franchisees also lease their own space.
We also lease all of the distribution centers that serve our company-operated stores, generally subject to five-year leases, most of which contain renewal options ranging from two to ten years. As we
86
expand our operations, we may need to find additional distribution center locations or replace existing distribution centers with larger locations to accommodate the increased level of operations. Additionally, from time to time, we may assume lease obligations for distribution centers in connection with our acquisitions, including in markets where we already operate a distribution center. In such an event, we expect to operate many of those acquired distribution centers for a limited time until our distribution operations can be consolidated. We believe that we would not have any difficulty replacing these facilities if we were required to do so. Our largest distribution centers are located in Texas, Florida and Georgia.
Trademarks and Service Marks
We own or have rights to use the trademarks, service marks and trade names that we use in conjunction with the operation of our business. The most important trademarks we own or have rights to use include "Mattress Firm®," "Comfort By Color®," "Mattress Firm Red Carpet Delivery Service®," "Hampton & Rhodes®," "YuMe™," "Mattress Firm SuperCenter®," "Happiness Guarantee™," "Replace Every 8®," "Save Money. Sleep Happy™," "Sleep Happy™," "Dream It's Possible™," "Side by side before you decide™," "Nobody Sells for Less, Nobody!™" and "All the best brands...All the best prices!®." We believe that our trademarks, service marks and trade names have significant value and that some of our trademarks are instrumental to our ability to drive traffic into Mattress Firm® stores.
Information Systems
We have been using GERS Retail Systems since May 2004 ("GERS"). This system provides sales, inventory, financial information and warehouse management. Due to current and planned store growth, the version of GERS that we currently utilize is approaching its maximum capacity. We are in the process of implementing Microsoft Dynamics AX for Retail ("Microsoft Dynamics") as a replacement to GERS. We believe Microsoft Dynamics will provide the similar core functionality of GERS with the added ability to support our growth strategy. In addition, we believe that Microsoft Dynamics will allow us to support multiple brands, multiple legal entities, shared warehouses, various pricing structures, improved inventory management, multiple franchises and store growth on a single platform. We also believe that Microsoft Dynamics, point-of-sale functionality will allow us to enhance the overall customer experience and capture critical customer information. We completed the implementation of the general ledger and related financial modules of Microsoft Dynamics in April 2012, and completed the pilot market implementation of the point-of-sale and supply chain functionality in August 2012.
We use components of the Microsoft Business Intelligence suite for data warehousing. This provides access to information from various data sources across the organization through interactive, content-driven dashboards and scorecards that combine data from multiple systems into a single browser-based experience. We also have the capability to produce sales, financial and analytical reports.
We have an e-commerce solution which integrates with the GERS Retail Systems. This allows our customers to shop on the web, purchase products and schedule in-home delivery nationwide. The website also utilizes social media to build a community of customers and interactive chat to improve the customer's web experience.
Our stores, distribution centers and corporate office are all connected by a secure Virtual Private Network, or "VPN," which enables us to take advantage of the cost efficiencies of the internet without compromising data security. The infrastructure that facilitates our VPN is housed in both secure off-site and on-site locations. We leverage our VPN to route our sales transactions, third party financing and funding through this communications network.
87
Employees
As of September 7, 2012, we had approximately 3,132 employees, substantially all of whom were employed by us on a full-time basis. None of our employees are covered by a collective bargaining agreement. We have not experienced any work stoppages and we consider our relations with our employees to be good.
Government Regulation
We believe that we are in compliance in all material respects with the laws to which we are subject. In particular, our business subjects us to regulation in the following areas:
Regulations relating to consumer protection and the bedding industry. Our operations are subject to state and local consumer protection regulations and other regulations relating specifically to the bedding industry. These regulations vary among the states where we operate, but generally impose requirements as to the proper labeling of bedding merchandise, restrictions regarding the identification of merchandise as "new" or otherwise, controls as to hygiene and other aspects of product handling and sale and penalties for violations. We also are subject to a standard established by the U.S. Consumer Product Safety Commission, which sets mandatory national fire performance criteria for all mattresses sold in the United States on or after July 1, 2007.
Franchise laws and regulations. We are also subject to Federal Trade Commission (FTC) regulations and various state laws regulating the offer and sale of franchises. The FTC and various state laws require us to furnish to prospective franchisees a franchise disclosure document containing prescribed information. Unless an exemption applies, certain states require registration of a franchise offering circular or a filing with state authorities. Substantive state laws that regulate the franchisor-franchisee relationship presently exist in a substantial number of states, and bills have been introduced in the U.S. Congress from time to time which provide for federal regulation of the franchisor-franchisee relationship in certain respects. The state laws often limit, among other things, the duration and scope of non-competition provisions and the ability of a franchisor to terminate or refuse to renew a franchise. The failure to comply with these laws and regulations in any jurisdiction or to obtain required government approvals could result in a ban or temporary suspension on future franchise sales, fines or other penalties or require us to make offers of rescission or restitution, any of which could adversely affect our business and operating results.
Litigation
From time to time, we may be involved in litigation relating to claims arising out of our operations in the normal course of business. We believe that we are not a party to any legal proceedings which, if determined adversely to us, individually or in the aggregate, would have a material adverse effect on our financial position, results of operations or cash flows.
In April 2010, a former employee of the Company filed a claim on behalf of himself and others similarly situated alleging that the Company failed to pay him overtime compensation in violation of the Fair Labor Standards Act. The case was filed as Civil Action No. 3:10-CV-294-J-32JRK in the United States District Court, Middle District of Florida, Jacksonville Division. On May 26, 2011, following a court-ordered mediation, the parties reached final settlement whereby the Company agreed, without admitting any of the allegations, to make a payment of $1.6 million into a claims-made reversionary fund covering claims by employees that had been identified as potentially entitled to receive damages. Pursuant to the settlement, the Company made the $1.6 million payment on August 9, 2011 into a claims-made reversionary fund and accrued a liability for this matter as of February 1, 2011, with a corresponding charge to sales and marketing expense. The Company recovered $0.5 million from the claims-made reversionary fund upon completion of the settlement distribution process, which was
88
recognized as a reduction of sales and marketing expenses during the thirteen weeks ended July 31, 2012.
Recent and Pending Acquisitions
On May 2, 2012, we acquired all of the equity interests of MGHC Holding Corporation, which operated Mattress Giant stores, for approximately $44.0 million in cash, subject to customary post-closing adjustments. Prior to this transaction, we acquired 55 Mattress Giant stores in the Minneapolis, Atlanta and St. Louis markets in November 2011, and have completed the integration of those stores. In connection with the closing of the May acquisition, we acquired 181 additional Mattress Giant specialty retail stores in Texas and Florida, which represent the two largest states in which Mattress Firm® currently operates. The stores are located in seven metropolitan markets including Miami, Naples/Ft. Myers, Orlando, Tampa and Jacksonville in Florida and Houston and Dallas in Texas, representing markets where we operated Mattress Firm® stores prior to the acquisition. As of July 31, 2012, we operated a total of 493 company-operated stores in Texas and Florida, including the former Mattress Giant stores. By the end of fiscal 2012, we expect to complete the rebranding of the former Mattress Giant stores that were acquired in May 2012.
On September 4, 2012, we entered into an agreement to acquire substantially all of the operations and assets of Mattress XPress, Inc. and Mattress XPress of Georgia, Inc. (which entities operate Mattress X-Press stores), including 30 mattress specialty stores located primarily in South Florida and five stores in Georgia, for approximately $15.8 million, subject to customary purchase price adjustments. The closing of the transaction is expected to occur in the third fiscal quarter of 2012 and remains subject to the prior satisfaction of customary closing conditions. We currently operate stores in South Florida and Georgia and intend to rebrand the Mattress X-Press stores as Mattress Firm® within one month of closing. As a result, we expect to see the benefits of future advertising on all Mattress Firm® stores in these markets. The average sales per store of the Mattress X-Press stores are comparable to the Company's overall average for Mattress Firm® stores nationwide.
As part of our business strategy, we continue to evaluate potential acquisition opportunities that are or may become available to us and may pursue such opportunities that support our strategic growth plan from time to time.
89
Executive Officers and Directors
The following table sets forth our executive officers, key employees and directors and their ages as of September 7, 2012:
Name
|
Age | Position | |||
|---|---|---|---|---|---|
R. Stephen Stagner |
43 | President, Chief Executive Officer and Director | |||
Stephen G. Fendrich |
51 | Chief Strategy Officer | |||
James R. Black |
54 | Executive Vice President and Chief Financial Officer | |||
Kenneth E. Murphy III |
36 | Executive Vice President, Sales and Operations | |||
Bruce Levy |
54 | Executive Vice President, Real Estate and Construction | |||
Karrie Forbes |
37 | Executive Vice President, Marketing and Merchandising | |||
George W. McGill |
53 | Vice President, Field Operations | |||
Craig McAndrews |
44 | Executive Vice President, Retail Concept Development | |||
Kindel Elam |
32 | Vice President and General Counsel | |||
John W. Childs |
71 | Director | |||
Adam L. Suttin |
44 | Director | |||
David A. Fiorentino |
36 | Director | |||
William E. Watts |
59 | Director, Chairman of the Board | |||
Frederick C. Tinsey III |
60 | Director | |||
Charles R. Eitel |
62 | Director | |||
The present principal occupations and recent employment history of each of our executive officers and key employees listed above are as follows:
R. Stephen Stagner became our Chief Operating Officer in January 2005 as a result of the merger between Mattress Firm® and his former Mattress Firm® franchise, Elite Management Team, or Elite. From February 2006 until his promotion in February 2010, Mr. Stagner served as the Company's Executive Vice President and Chief Operating Officer. He was promoted to President and Chief Executive Officer in February 2010 and has served as a Director of the Company since February 2010. From 1996 to 2004, Mr. Stagner was the Chief Executive Officer of Elite. Mr. Stagner has over 20 years of experience in the bedding industry, including employment with mattress manufacturers Sealy Corporation and Simmons Bedding Company, and owning and operating the largest franchise in the Mattress Firm® network while with Elite. Mr. Stagner has also served in various capacities with the Mattress Firm Foundation, including as its President since January 2011 and director from January 2007 until December 2010. Since October 2009, Mr. Stagner has served as director of Rousche College of Business Advisory Council at Stephen F. Austin State University. Mr. Stagner's experience as the Company's President and Chief Executive Officer, and formerly his experience as Chief Operating Officer, coupled with his in-depth knowledge of the Company's industry, led to the conclusion that he should serve as a director of the Company.
Stephen G. Fendrich became our Chief Strategy Officer upon his return to Mattress Firm® in September 2010. He co-founded Mattress Firm® in 1986 with two other partners. He was involved with all aspects of the business but was directly responsible for the financial, real estate, information technology and franchise areas of Mattress Firm® until 2002. From 2002 to 2010 he held several management positions within the bedding industry, including President and Chief Executive Officer of The Sleep Country, Inc., and Executive Vice President of Sales and President and Chief Operating Officer of Simmons Bedding Company. While with Simmons, the company filed for Chapter 11 bankruptcy and, during 2009, Mr. Fendrich led Simmons through its balance sheet restructuring that culminated with its sale in January 2010.
90
James R. Black became our Executive Vice President and Chief Financial Officer in September 2000, and currently serves as our Executive Vice President, Chief Financial Officer and Treasurer. Prior to joining Mattress Firm®, Mr. Black spent 20 years with public accounting firms, the majority with the international firms of Ernst & Young, LLP and PricewaterhouseCoopers, LLP. He is a certified public accountant and member of the American Institute of Certified Public Accountants.
Kenneth E. Murphy III became our Executive Vice President, Sales and Operations effective January 15, 2012 after holding various positions within Mattress Firm® since 2005, including National Vice President of Sales, Director of Training and Recruiting, Vice President of Field and Talent Management and Regional Vice President of Sales. From 2003 to 2005, Mr. Murphy was as an account manager at Sealy. Mr. Murphy is also currently serving on the board of the David F. Miller Center for Retailing Education and Research at the University of Florida and the Stephen F. Austin University General Business Advisory Board.
Bruce Levy became our Executive Vice President, Real Estate and Construction in January 2009 to focus on continuing our nationwide expansion, and was named our Executive Vice President of Real Estate and Construction in September 2012. From 2005 until the time he joined Mattress Firm®, Mr. Levy was a Limited Partner at Interface Properties, Inc., having been involved with locating land and developing multi-tenant retail buildings. Mr. Levy has over 25 years of experience as a senior officer of several Fortune 500 companies in the real estate and construction sector, including Office Depot, Inc., Blockbuster L.L.C., Gateway, Inc., Tweeter Home Entertainment Group, Inc. and PETCO Animal Supplies, Inc. Mr. Levy's experience includes opening retail stores throughout the United States, Europe and Asia.
Karrie Forbes became our Executive Vice President, Marketing and Merchandising effective January 15, 2012. Prior to this new appointment, she served as our Vice President of Marketing for four years. Ms. Forbes is responsible for the strategic direction of the marketing, advertising and communication. Ms. Forbes joined a Mattress Firm® franchise in 1997 and held positions of increasing responsibility in sales, customer service, recruiting, training and advertising through 2005, when she joined Mattress Firm® as Director of Merchandising. Ms. Forbes also serves on the advisory board with the Better Sleep Council and Clear Channel Radio Houston. Ms. Forbes is married to Matthew Forbes, our Director of Sales and Field Operations.
George W. McGill was promoted to Vice President, Field Operations in July 2009 from his previous position as our Vice President of Operations, which he held from January 2007, until his promotion. Prior to joining us in 2007, he was Vice President of Operations for Ultimate Acquisition Partners, LP (f/k/a Ultimate Electronics) from 2002 to 2006. Mr. McGill worked for 12 years at Circuit City Stores, Inc. in supply chain management.
Craig McAndrews was promoted to Executive Vice President, Retail Concept Development in February 2012, responsible for the development and testing of alternate retail operating formats and continued franchise development. Previous to this position, Mr. McAndrews served as Vice President of Merchandising from February 2010 until his promotion and Regional Sales Manager from February 2010 to February 2010. Prior to joining Mattress Firm, Mr. McAndrews was the owner and director of Innovative Retail Group from 2003 to 2009. From 1999 until 2003, he was President of a Mattress Firm franchise, which he had co-founded. Previously, he was Vice President of Sales at Simmons Bedding Company.
Kindel Elam joined Mattress Firm in July 2012 as Vice President and General Counsel, responsible for providing guidance on legal compliance and responsibility. From 2004-2012, Ms. Elam worked at Fulbright & Jaworski L.L.P. where she served as Senior Associate for the last two years. Ms. Elam has experience in a wide range of legal activities, including mergers and acquisitions, public and private offerings and finance.
91
John W. Childs joined the Company as a Director in August 2007. Mr. Childs has been Chairman and Chief Executive Officer of J.W. Childs, one of the Company's affiliates, since 1995. From 1991 to 1995, Mr. Childs was Senior Managing Director of the Thomas H. Lee Partner and from 1987 to 1990 was a Managing Director of Thomas H. Lee Company. Prior to 1987, Mr. Childs was associated with the Prudential Insurance Company of America for 17 years where he held various executive positions in the investment area, ultimately serving as Senior Managing Director in charge of the Capital Markets Group where he was responsible for Prudential's approximately $77 billion fixed income portfolio, including all the Capital Markets Group's investments in leveraged acquisitions. He is currently Chairman of the Board of CHG Healthcare Services, Inc. and a Director of Sunny Delight Beverages Co., Esselte Ltd. and Simcon, Inc. and was a Director at Advantage Sales and Marketing, Inc. from 2006 until 2010. Mr. Childs's experience serving as a director of various companies, including his experience with Mattress Firm®, and his expertise in private equity led to the conclusion that he should serve as a director of the Company.
Adam L. Suttin joined the Company as a Director in August 2007 and was a member of the Company's audit committee until his resignation from the committee in February 2012. Mr. Suttin is also a Partner of one of the Company's affiliates, J.W. Childs, which he co-founded in July 1995. Previously, Mr. Suttin was an Associate at Thomas H. Lee Partners, where he was employed from 1989 until 1995. Mr. Suttin is currently a Director of Brookstone, Inc., The Nutrasweet Company, Sunny Delight Beverages Co., JA Apparel Corp., Esselte Ltd. and Tile Shop Holdings, Inc., and was a Director at Advantage Sales and Marketing, Inc. from March 2006 until December 2010. Mr. Suttin's experience as a co-founder of J.W. Childs, coupled with his experience as a director of various companies, including Mattress Firm®, led to the conclusion that Mr. Suttin should serve as a director of the Company.
David A. Fiorentino joined the Company as a Director in August 2007 and is currently a member of the Company's audit committee. Mr. Fiorentino is also a Partner at J.W. Childs, which is one of the Company's affiliates. Prior to arriving at J.W. Childs in July 2000, Mr. Fiorentino worked in the investment banking division of Morgan Stanley. He is currently a Director of CHG Healthcare Services, Inc., WS Packaging Group, Inc., Fitness Quest, Inc. and JA Apparel Corp. Mr. Fiorentino's financial industry background as well as his experience as a Partner at J.W. Childs and as a director of various companies, including Mattress Firm®, led to the conclusion that Mr. Fiorentino should serve as a director of the Company.
William E. Watts joined the Company as a Director in January 2007. Mr. Watts is also an Operating Partner of J.W. Childs, which is one of the Company's affiliates. Prior to joining J.W. Childs in 2001, Mr. Watts was President and Chief Executive Officer of General Nutrition Companies from 1991 until 2001. Prior to being named President and Chief Executive Officer in 1991, Mr. Watts held the positions of President and Chief Operating Officer of General Nutrition, President and Chief Operating Officer of General Nutrition Center, Senior Vice President of Retailing and Vice President of Retail Operations. Mr. Watts currently serves as Chairman of the board of JA Apparel Corp. and Tile Shop Holdings, Inc. and is a Director of Brookstone, Inc. and Fitness Quest, Inc. and was a Director at EmployBridge, Inc. from September 2006 until May 2011. Mr. Watts's experience as a director of various companies, including Mattress Firm®, as well as his experience as Chief Executive Officer of a company with a well-known brand, led to the conclusion that he should serve as a director of the Company.
Frederick C. Tinsey III joined the Company as a Director in August 2007, currently serving as chairman of the Company's audit committee, and is a certified public accountant with a degree in Accounting and Finance. Mr. Tinsey is the owner of Tinsey Financial Consulting, at which he has served since 2003, and he has served on the board and audit committees of various privately held companies, including Murray's Discount Auto Stores, Fitness Quest Inc., WS Packaging Group, Inc. and IDQ Holdings. Mr. Tinsey was at PricewaterhouseCoopers LLP from 1973 until 1993 and served as
92
the co-head of its national retail practice from 1991 to 1993, having engaged with various private and public retail clients. From 1994 through 2003, Mr. Tinsey served as the President and Chief Financial Officer of Murray's Discount Auto Stores. His experience as a certified public accountant, coupled with his experience as an officer or director of various companies, including Mattress Firm®, led to the conclusion that he should serve as a director of the Company.
Charles R. Eitel joined the Company as a Director in January 2012 and is currently a member of the Company's audit committee. He co-founded Eitel & Armstrong in December 2009, a consulting practice that provides hands-on operating and financial guidance to middle market companies. Mr. Eitel is also a partner at E&A Advisors, which provides financial advice to middle market companies on capital formation, acquisitions, divestures, restructurings and private placements. Prior to forming Eitel & Armstrong, Mr. Eitel served as Vice Chairman of the Board of Simmons Bedding Company, a manufacturer of mattresses, from October 2008 to December 2009. Mr. Eitel served as Chairman and Chief Executive Officer of Simmons Bedding Company from January 2000 until his appointment to Vice Chairman in 2008. Mr. Eitel currently serves on the board of directors of Duke Realty Corporation, American Fidelity Assurance Corporation, and Criterion Brock, owned by Wedbush Capital Partners. Mr. Eitel also serves on the Advisory Board of Advanced Sleep Concepts, a bedding manufacturer. Mr. Eitel's extensive experience in the Company's industry as well as his experience as a director of various companies led to the conclusion that he should serve as a director of the Company.
Our board of directors is elected annually. Our board of directors is divided into three classes, with one class being elected at each year's annual meeting of stockholders. Class I directors will serve for a term ending upon the annual meeting of stockholders held in 2015, Class II directors will serve for a term ending upon the annual meeting of stockholders held in 2013 and Class III directors will serve for a term ending upon the annual meeting of stockholders held in 2014. At each annual meeting of stockholders, successors to the class of directors whose term expires at such annual meeting shall be elected for a three-year term. No director serves as such pursuant to any arrangement or understanding between him and any other person. Our board of directors currently consists of seven members, at least one of whom satisfies the independence requirements of the NASDAQ and SEC rules. Our executive officers are elected by the board of directors and serve until their successors have been duly elected and qualified or until their earlier resignation or removal. Except as described above, there are no family relationships among any of our directors or officers.
Code of Business Conduct and Ethics
We have adopted a written code of business conduct and ethics that applies to our directors, officers, employees and certain other persons, including ours principal executive officer, principal financial officer, principal accounting officer or controller, or persons performing similar functions. The current version of the code is posted on the Corporate Governance section of the Investor Relations section of our website, www.mattressfirm.com. Our website is included in this prospectus as a textual reference only and the information in the website is not incorporated by reference into this prospectus.
Board Structure and Committee Composition
Our board of directors has established three committees: the Audit Committee; the Compensation Committee; and the Nominating and Corporate Governance Committee. Each committee operates under a charter approved by the board of directors. Copies of each committee's charter are posted on the Corporate Governance section of the Investor Relations section of our website, www.mattressfirm.com. Our website is included in this prospectus as a textual reference only and the information in the website is not incorporated by reference into this prospectus. The membership, principal duties, and responsibilities of each committee are set forth below.
93
In connection with the our initial public offering that was completed in November 2011, we availed ourselves of the "controlled company" exception under the NASDAQ Rules, and did not have a majority of independent directors and our Nominating and Corporate Governance Committee and our Compensation Committees were not composed entirely of independent directors as defined under the NASDAQ Rules. The "controlled company" exception did not modify the independence requirements for the audit committee, and we remain in compliance with the applicable requirements of the Sarbanes-Oxley Act and the NASDAQ Rules relating to its audit committee. These rules require that our audit committee be composed of at least three members, one of whom was to be independent upon the listing of our common stock on NASDAQ, a majority of whom were to be independent within 90 days of the our initial public offering and all of whom are independent within one year of our initial public offering.
Upon completion of this offering, funds associated with J.W. Childs will no longer own a majority of our outstanding common stock. As a result, we will no longer be a "controlled company" within the meaning of the corporate governance standards. Our board of directors has determined that all of our directors, other than Mr. Stagner, meet the independence standards of the NASDAQ Rules. As a result, we are in compliance with the NASDAQ Rules that require our Compensation Committee and Nominating and Corporate Governance Committee be composed entirely of independent directors. Additionally, the board of directors has determined that all members of our Audit Committee, other than Mr. Fiorentino, meet the heightened independence standards applicable to audit committee members under the NASDAQ Rules. Pursuant to the transitional rules applicable to new public companies, we are currently required to have a majority of the Audit Committee comprised of members who meet such heightened independence standards and will be required to have the Audit Committee fully independent under such heightened independence standards starting on November 17, 2012.
Audit Committee
The committee's charter provides that the principal duties and responsibilities of the Audit Committee include:
- •
- appointing, compensating, retaining and overseeing the work of any registered public accounting firm engaged for the
purpose of preparing or issuing an audit report or performing other audit, review or attest services and reviewing and appraising the audit efforts of the Company's independent registered public
accounting firm;
- •
- establishing procedures for the receipt, retention and treatment of complaints regarding accounting, internal accounting
controls or auditing matters;
- •
- engaging independent counsel and other advisers, as necessary;
- •
- reviewing and pre-approving various services provided by accountants retained by the committee;
- •
- serving as an independent and objective party to oversee the Company's internal controls and procedures system;
- •
- providing an open avenue of communication among the independent registered public accounting firm, financial and senior
management and the board of directors; and
- •
- overseeing any other such matters as the board of directors shall deem appropriate from time to time.
In addition, all audit and non-audit services, other than de minimis non-audit services, provided by the Company's independent registered public accounting firm must be approved in advance by the Audit Committee.
94
Compensation Committee
The committee's charter provides that the principal duties and responsibilities of the Compensation Committee include:
- •
- reviewing and approving corporate and individual goals and objectives relevant to executive officer compensation and
evaluating the performance of executive officers in light of the goals and objectives;
- •
- reviewing and approving executive officer compensation;
- •
- reviewing and approving the chief executive officer's compensation based upon the compensation committee's evaluation of
the chief executive officer's performance;
- •
- making recommendations to the board of directors regarding the adoption of new incentive compensation and equity-based
plans, and administering the Company's existing incentive compensation and equity-based plans;
- •
- making recommendations to the board of directors regarding compensation of the board members and its committee members;
- •
- reviewing and discussing with management the compensation discussion and analysis to be included in the Company's filings
with the SEC and preparing an annual compensation committee report for inclusion in the Company's annual proxy statement;
- •
- reviewing and approving generally any significant non-executive compensation and benefits plans;
- •
- reviewing the Company's significant policies, practices and procedures concerning human resource-related matters; and
- •
- overseeing any other such matters as the board of directors shall deem appropriate from time to time.
Nominating and Corporate Governance Committee
The committee's charter provides that the principal duties and responsibilities of the Nominating and Corporate Governance Committee include:
- •
- recruiting and retention of qualified persons to serve on the board of directors;
- •
- proposing such individuals to the board of directors for nomination for election as directors;
- •
- evaluating the performance, size and composition of the board of directors;
- •
- compliance activities; and
- •
- overseeing any other such matters as the board of directors shall deem appropriate from time to time.
Compensation Committee Interlocks and Insider Participation
None of our executive officers serves as a member of the compensation committee of our board of directors or the compensation committee or other committee serving an equivalent function of any other entity that has one or more of its executive officers serving as a member of our board of directors or compensation committee.
95
Compensation Discussion and Analysis
This section discusses the principles underlying our policies and decisions with respect to the compensation of our executive officers who are named in the "Summary Compensation Table" and the most important factors relevant to an analysis of these policies and decisions. Our "named executive officers" for the fiscal year ending February 2, 2011 ("fiscal 2011") were:
- •
- R. Stephen Stagner, President and Chief Executive Officer ("CEO");
- •
- James R. Black, Executive Vice President, Chief Financial Officer ("CFO") and Treasurer;
- •
- Stephen G. Fendrich, Chief Strategy Officer ("CSO");
- •
- Kenneth E. Murphy III, Executive Vice President, Sales and Operations; and
- •
- Karrie Forbes, Executive Vice President, Marketing and Merchandising.
Overview of Fiscal 2011 Performance and Compensation
We believe our success depends on the continued contributions of our named executive officers. Our executive compensation programs are designed to attract and retain experienced and qualified executive officers and to incentivize them to achieve overall business results and individual performance goals. Our executive compensation programs also support our strategic objectives by aligning the interests of our executive officers with those of our stockholders through the use of operational and financial performance goals and equity-based compensation.
Our compensation policies and compensation-related decisions center on the following objectives:
- •
- attracting and retaining talented and experienced executive officers;
- •
- motivating and rewarding executive officers whose knowledge, skills and performance are critical to our success;
- •
- aligning the interests of our executive officers and stockholders by incentivizing executive officers to increase
stockholder value and rewarding executive officers when stockholder value increases and performance goals are met;
- •
- providing a competitive compensation package in which total compensation is largely performance-based;
- •
- ensuring fairness among the executive management team by recognizing the contributions each executive officer makes to our
success; and
- •
- fostering a shared commitment among our executive officers by coordinating Company and individual goals.
Each of the key elements of our executive compensation programs is discussed in more detail below. Our executive compensation programs are designed to complement and to collectively serve the compensation objectives described above. We have not adopted formal policies for allocating compensation between short-term and long-term compensation, between cash and non-cash compensation or among different forms of cash and non-cash compensation; we have, however, created base salary, annual bonus and equity award guidelines to enable us to set compensation amounts and opportunities in a manner internally consistent across job positions for all employees, including our named executive officers. An executive officer's annual base salary and annual cash incentive amounts do not fluctuate as a result of increasing gains from equity awards. However, the Compensation Committee will consider such gains in awarding additional equity compensation. The Company views
96
the compensation elements as different means of encouraging and promoting performance that are meant to function together.
Highlights of Fiscal 2011 Performance
During fiscal 2011, we achieved strong financial performance, and we believe our named executive officers were instrumental in helping us achieve these results. Highlights of our fiscal year 2011 performance include the following:
- •
- Net income increased $34.1 million to $34.4 million for fiscal 2011 compared with $0.3 million for
fiscal 2010.
- •
- Adjusted EBITDA increased $30.4 million to $87.5 million for fiscal 2011 compared with $57.1 million
for fiscal year 2010. Adjusted EBITDA as a percentage of sales increased to 12.4% during fiscal year 2011 compared with 11.6% for fiscal year 2010. We define "Adjusted EBITDA" as earnings before
interest, taxes, depreciation and amortization and other adjustments (such as goodwill impairment charges, loss on store closings and acquisition expenses). Adjusted EBITDA is not a performance
measure under accounting principles generally accepted in the United States. See "Prospectus Summary—Summary Historical and Unaudited Pro Forma Consolidated Financial and Operating Data"
for a definition of Adjusted EBITDA and a reconciliation of Adjusted EBITDA to net income.
- •
- Net sales increased $209.8 million, or 42.5%, to $703.9 million for fiscal year 2011, compared to
$494.1 million for fiscal 2010. Comparable-store sales increased 20.5% during fiscal year 2011.
- •
- We opened 106 new stores and acquired 55 stores. New and acquired stores, net of stores closed, added
$110.8 million in net sales during fiscal 2011.
- •
- We ended fiscal 2011 with no outstanding borrowings and total borrowing capacity of $24.0 million on the revolving
credit line portion of our 2007 Senior Credit Facility.
- •
- In November 2011, we successfully completed our initial public offering and our common stock became listed on the NASDAQ Global Select Market under the symbol "MFRM." The closing price of our common stock on January 31, 2012 (the last day of fiscal 2011) was $33.03, up from the initial public offering price of $19.00 per share.
Compensation Framework: Policies and Processes
Roles of the Compensation Committee and Executive Officers in Setting Compensation
During fiscal 2011, the board of directors established the Compensation Committee. Following our initial public offering, our Compensation Committee generally has been responsible for developing and administering our executive compensation programs and determining the nature and amount of compensation paid to our named executive officers, and, for all of our employees other than our named executive officers, administering our equity compensation plans and awards. The board of directors approves all equity grants for our named executive officers. The Compensation Committee has adopted a written charter under which it operates. This charter is available on our website, www.mattressfirm.com.
Prior to the initial public offering, we had a Company-level compensation committee, which was comprised of three voting members (our CEO, CFO and CSO) and four non-voting members (all of whom were members of either our human resources or finance departments). The Company-level compensation committee had been responsible for recommending and determining base salary amounts and increases for our executive officers (other than themselves), and for recommending the annual bonus goals under our annual incentive program to the board of managers of our then-sole shareholder, Mattress Holdings, LLC (the "Board of Managers"), for its approval. Prior to the initial
97
public offering, the Board of Managers was responsible for determining the elements that comprise our executive compensation programs in general, as well as approving the performance objectives associated with our annual bonus programs and approving the equity grants made to employees, both as described below.
The compensation for our CEO, CFO and CSO is governed by their respective employment agreements, which are described below. These agreements were amended and restated in September 2011 and approved by our board of directors. Prior to the initial public offering, the Board of Managers provided oversight of the Company's compensation practices with respect to these three named executive officers. Our Company-level compensation committee, which is described above, did not make any compensation determinations for these three individuals.
Use of Comparative Market Data
As part of our preparation in 2011 to become a public company, our board of directors engaged Pearl Meyer & Partners, or "Pearl Meyer," an independent compensation consulting firm, to advise on certain aspects of compensation for our executives, including assisting us in determining the size and terms of the grants of equity awards to be made under our newly-established equity plan in connection with the initial public offering. Grants made to our named executive officers at the time of the initial public offering reflected the recommendations that Pearl Meyer provided to the board of directors related to such awards. In addition, Pearl Meyer developed, and our board of directors approved, a peer group of companies against which to assess the following key components of our named executive officers' compensation following the initial public offering: base salary, annual cash bonus and long-term incentives. Since the initial public offering, our Compensation Committee has not benchmarked total executive compensation or individual compensation elements against this or any other peer group.
As a public company, we expect to use market data, and may decide to continue to use the services of a compensation consultant, to provide input in establishing the level and types of certain elements of our executive compensation program. While we anticipate that we will take a more systematic approach to reviewing competitive data on executive compensation levels and practices, we expect to continue to apply the compensation philosophies and strategies that we believe are appropriate for our business, and that focus more on long-term and performance-based incentive compensation than on fixed compensation.
Prior to the initial public offering, certain members of our human resources department conducted, on an annual basis, an analysis of our executive compensation programs relative to those of other comparable companies to gain a general understanding of whether our executive compensation programs were competitive. During fiscal 2011, prior to the initial public offering, Triad Consultants, Inc., an independent consultant, performed a compensation review under which it used a number of sources to provide us with relevant market data. While we had historically reviewed the data provided by our human resources department and Triad Consultants, Inc., and from time to time adjusted our compensation practices in light of such data, prior to the initial public offering we did not formally benchmark our executive compensation levels against the gathered survey data or against any specific group of companies.
Elements of Named Executive Officer Compensation
The following is a discussion of the primary elements of compensation for each of our named executive officers for fiscal 2011. Compensation for our named executive officers consisted of the following elements for fiscal 2011:
- •
- Base Salary. A fixed cash payment intended to attract and retain talented individuals, recognize career experience and individual performance, and provide competitive compensation.
98
- •
- Bonus and Short-Term Incentive
Arrangements. An annual cash incentive based on Company performance intended to promote and reward achievement of the Company's annual
financial and strategic objectives.
- •
- Long-Term Stock-Based Incentive
Arrangements. Historically, grants of time-based and performance-based units of our then-sole shareholder,
Mattress Holdings, LLC and, in connection with the initial public offering, grants of time-based and performance-based stock options under our equity plan, both of which are
intended to align the executive officer's interests with those of our stockholders by tying value to long-term Company performance.
- •
- Retirement and Welfare Benefits. Retirement benefits
(including a 401(k) plan and non-qualified deferred compensation plan) intended to provide tax-efficient retirement savings and health and welfare benefits (including medical,
dental, vision, life and AD&D insurance and short-term and long-term disability insurance) intended to provide comprehensive benefits.
- •
- Executive Perquisites. Additional benefits offered to certain of our named executive officers to provide competitive supplemental benefits, such as Company payment of the premiums associated with health and welfare benefits (including medical, dental and vision coverage), and separate Company-paid life and disability insurance policies for Messrs. Stagner, Black and Fendrich.
Base Salary
We believe that a competitive base salary is required in order to provide our named executive officers with a stable income stream that is commensurate with their responsibilities and competitive market conditions. The base salaries of Messrs. Stagner, Black and Fendrich are set forth in their respective employment agreements, which were amended and restated effective September 14, 2011 and approved by our board of directors. The employment agreements also provide, in very limited circumstances, for an automatic annual cost of living adjustment to base salaries.
At the beginning of our 2011 fiscal year, Mr. Stagner's base salary was increased from $400,000 to $406,100 due to a cost of living adjustment. Mr. Stagner's employment agreement was amended and restated, effective September 14, 2011, to provide for an increase in his annual base salary to $500,000, effective upon the consummation of the initial public offering. In addition, at the beginning of fiscal 2011, due to a cost of living adjustment, Mr. Black's base salary was increased from $285,500 to $289,900. Mr. Fendrich's base salary, which was set at $325,000 in accordance with the terms of his employment agreement, effective September 24, 2010, remained the same at the beginning of fiscal 2011. Messrs. Black's and Fendrich's employment agreements were amended and restated, effective September 14, 2011, to each provide for an increase in such executive officers' annual base salary to $350,000, effective upon the consummation of the initial public offering. When determining the initial public offering based increase to the base salaries of these named executive officers, our board of directors took into account the Company's performance during fiscal 2011 and expansion over the prior two fiscal years, as well as the increased roles and responsibilities the executive officers would have as executive officers of a publicly traded company.
Prior to the initial public offering, recommendations for the base salaries of Mr. Murphy and Ms. Forbes were made by our human resources department, in accordance with our salary administration policy. Our salary administration policy is an internal tool that establishes a salary range for each job position covered by the policy. We generally do not deviate from these guidelines when setting base compensation or increasing base salary, although from time to time we have done so in circumstances warranting special considerations. Our human resources department, when recommending an executive officer's initial base salary, reviews the salary guidelines, the individual's role, expected responsibilities, skills, experience and prior compensation levels and general market data. When recommending subsequent increases to base salary, our human resources department reviews the
99
salary guidelines, the executive officer's contributions to the Company, individual performance and general market trends.
Each year prior to the initial public offering, our human resources department presented, for review and approval by our CEO, CFO and CSO, initial salary recommendations and recommendations for base salary increases for all other employees, including Mr. Murphy and Ms. Forbes. Our CEO, CFO and CSO then recommended to the chairman of the Board of Managers an aggregate amount for base salary increases for all employees. The chairman of the Board of Managers approved the aggregate amount, but not any individual base salary increases. Our CEO, CFO and CSO then reviewed and approved the individual base salary increases for our other executive officers.
At the beginning of fiscal 2011, Ms. Forbes's base salary was increased from $200,000 to $206,500 based on the factors described above. Mr. Murphy's base salary was not increased at the beginning of fiscal 2011 because he had received a base salary increase in connection with his promotion to National Vice President of Sales in September 2010. Following the initial public offering, in connection with their promotions to Executive Vice President, Sales and Operations and Executive Vice President, Marketing and Merchandising, respectively, Mr. Murphy and Ms. Forbes entered into amended and restated offer letters, effective January 15, 2012, to provide for an increase in each such executive officer's annual base salary to $230,000. Our board of directors reviewed the base salaries increases for these named executive officers proposed by the CEO, CFO and CSO, after consultation with our human resources department, and approved such increases based on both the changes in and enhancement of the roles and responsibilities of these executive officers following the initial public offering.
Bonus and Short-Term Incentive Arrangements
In addition to receiving base salaries, our named executive officers are eligible to earn annual cash bonuses under our Executive Annual Incentive Plan based upon the attainment of specific performance objectives. During fiscal 2011, our named executive officers were each eligible for a bonus based solely on achievement of the Company's Adjusted EBITDA goals as the only performance objective.
The cash bonuses (as a percentage of base salary) payable to each named executive officer if the relevant performance goals associated with his or her bonus were achieved for fiscal 2011 were as follows:
| |
Target Cash Bonus as a % of Base Salary(1) |
||||||
|---|---|---|---|---|---|---|---|
Name
|
Target | Maximum | |||||
R. Stephen Stagner |
50 | % | 100 | % | |||
Stephen G. Fendrich |
50 | % | 100 | % | |||
James R. Black |
50 | % | 100 | % | |||
Kenneth E. Murphy III |
35 | % | 70 | % | |||
Karrie Forbes(2) |
25 | % | 50 | % | |||
- (1)
- Each
of Messrs. Stagner, Fendrich and Black's target and maximum percentages are established by the terms of his respective employment
agreement, and each of Mr. Murphy's and Ms. Forbes' target percentage is established by the terms of his or her respective letter agreement, in each case as described below.
- (2)
- Under Ms. Forbes's amended and restated offer letter, effective January 15, 2012, her target percentage was increased from 25% to 35% of base salary. The target percentage increase was effective beginning in fiscal 2013.
100
The Board of Managers was responsible for establishing bonus targets and opportunities granted prior to the initial public offering. For fiscal years beginning with fiscal 2012, our Compensation Committee will determine the performance criteria applicable to our annual bonuses. The Board of Managers, after consultation with the CEO, CFO and CSO, set the fiscal 2011 Adjusted EBITDA target at a level it believed was both challenging and achievable. By establishing a target that was challenging, the Board of Managers believed that the performance of our employees, and therefore our performance, would be maximized. By setting a target that was also achievable, the Board of Managers believed that employees would remain motivated to perform at the high level required to achieve the target. Adjusted EBITDA goals for fiscal 2011 and their commensurate payouts are detailed in the chart below. Bonus payouts are interpolated when performance falls between the discrete points shown. The Board of Managers had the authority to adjust the final bonus payouts in their discretion, but did not exercise such authority during fiscal 2011.
| |
Below Threshold |
Threshold | Target | Maximum | FY2011 Actual | |||||
|---|---|---|---|---|---|---|---|---|---|---|
Adjusted EBITDA |
<$66.5 million |
$66.5 million (92% of target; +16% vs. fiscal year 2010) |
$72.6 million (+27% vs. fiscal year 2010) |
>$78.5 million (108% of target; +37% vs. fiscal year 2010) |
$87.5 million (121% of target; +53% vs. fiscal year 2010) |
|||||
Bonus Payout as a % of Target Cash Bonus |
No bonus | 0% | 100% of target | 200% of target | 200% of target |
At the conclusion of the fiscal year, Adjusted EBITDA results were calculated by our finance department and were presented to our Compensation Committee for review and approval. Actual Adjusted EBITDA for fiscal 2011 was $87.5 million, which is in excess of the maximum Adjusted EBITDA level of $78.5 million. This resulted in a payout to Messrs. Stagner, Black, Fendrich and Murphy and Ms. Forbes of 200% of their target cash bonus.
In addition to the bonuses described above, the employment agreements for Messrs. Stagner, Black, and Fendrich establish a supplemental bonus pool, whereby such executive officers are eligible to share with other members of the senior management of the Company in an incremental bonus pool of 10% of the actual amount of annual Adjusted EBITDA in excess of the annual Adjusted EBITDA maximum level target for each fiscal year that the executive officer is employed by us. For fiscal 2011, the actual amount of annual Adjusted EBITDA of $87.5 million exceeded the fiscal 2011 maximum level Adjusted EBITDA target of $78.5 million by a total of $8.99 million, which resulted in an incremental bonus pool of $899,000 for fiscal 2011. After the size of the pool was determined, Messrs. Stagner, Black and Fendrich recommended to our Compensation Committee the employees eligible to share in the incremental bonus pool and, for all such employees (other than themselves), the allocation of such bonus amounts. Our Compensation Committee reviewed the bonus recommendations for employees proposed by Messrs. Stagner, Black and Fendrich and approved such bonuses, as well as the bonuses to Messrs. Stagner, Black and Fendrich, based on these employees' contributions to the Company throughout and following the initial public offering process. For fiscal year 2011, all of our named executive officers were eligible to share in this incremental bonus pool. Messrs. Stagner, Black and Fendrich received additional bonuses equivalent to 22.2%, 19.5% and 12.2% of the incremental bonus pool, respectively, and Mr. Murphy and Ms. Forbes each received additional bonuses of 6.1% of the incremental bonus pool.
The actual bonuses paid to our named executive officers with respect to fiscal 2011 are set forth in the "Summary Compensation Table" below.
101
Long-Term Stock-Based Incentive Arrangements
In connection with the initial public offering, the Company established the Mattress Firm Holding Corp. 2011 Omnibus Incentive Plan, or the "Omnibus Plan," for grants of all equity-based awards in connection with or after the initial public offering. The primary goals of the Omnibus Plan are to align the interests of our named executive officers with the interests of our shareholders and to encourage executive retention through the use of both service-based and performance-based vesting requirements.
In connection with the initial public offering, our Compensation Committee recommended and our board of directors approved the Company employees to whom stock options would be granted and the amount and terms and conditions of such grants, in each case based on the contributions of these employees to the Company throughout the initial public offering process and the level of equity previously granted to these employees by the Board of Managers prior to the initial public offering. In connection with the initial public offering, our board of directors granted the following awards of stock options under the Omnibus Plan to our named executive officers: Mr. Stagner received a stock option to acquire 173,940 shares of common stock; Messrs. Black and Fendrich each received a stock option to acquire 86,970 shares of common stock; and Mr. Murphy and Ms. Forbes each received a stock option to acquire 50,596 shares of common stock. One-half of each stock option grant to our named executive officers is subject to a five-year pro-rata time-based vesting schedule, while the remaining one-half of the stock option is subject to a four-year performance-based vesting schedule, with such performance vesting based on specified stock price increase targets. Our Compensation Committee determined to grant time-based awards to encourage employee retention and performance-based awards to reward the achievement of specified performance goals related to our stock price and thereby provide value to our executive officers only when our shareholders also benefited.
Prior to the initial public offering, Mattress Holdings, LLC, the sole stockholder of the Company, established a class of equity ownership units, or "Class B Units," that were issued to employees of the Company providing services to or for the benefit of Mattress Holdings, LLC at the discretion of the Board of Managers. The Class B Units are administered by the Board of Managers.
Each holder of vested Class B Units is entitled to its pro rata share of future distributions to the equity owners of Mattress Holdings, LLC after certain other equity holders have received aggregate preferred distributions equal to the greater of (i) $154.3 million or (ii) the fair value of Mattress Holdings, LLC's equity on the relevant grant date of the Class B Units. Each Class B Unit grant is comprised of four tranches with separate vesting criteria. The Class B-1 Unit tranche comprises 40% of the total units granted and vested over five years in 20% increments on January 18 of each year, subject to continued employment. These units vested in full immediately prior to the initial public offering. The Class B-2, B-3 and B-4 Unit tranches comprise the remaining portion of each Class B Unit grant and were scheduled to vest in their entirety immediately prior to a change of control or, if earlier, the date of expiration of the lock-up agreements entered into by JWC Mattress Holdings, LLC, JWC Equity Funding III, Inc. and their respective affiliates that are unit holders of Mattress Holdings, LLC (collectively, the "JWC Investors") in connection with the initial public offering (the "Lock-up Expiration Date"), in each case if the return on investment to entities affiliated with the JWC Investors meets or exceeds established performance thresholds. The thresholds were met and the Class B-2, B-3 and B-4 Units vested on May 15, 2012.
In addition, Messrs. Stagner, Black and Murphy and Ms. Forbes hold Class C-2 Units. Each holder of the Class C-2 Units is entitled to his or her pro rata share of future distributions to the equity holders of Mattress Holdings, LLC after certain other equity holders have received aggregate preferred distributions equal to the aggregate amount of the 2009 equity investment in Mattress Holdings, LLC, until the cumulative distributions to all of the Class C Unit holders (including the Class C-2 Unit holders) equals $154,109,670. The Class C-2 Unit holders also share in any additional distributions
102
beyond this threshold. The Class C-2 Units were fully vested on the date of grant. No Class C-2 Units were granted in fiscal 2011.
Employment and Severance Arrangements
We have entered into employment agreements with Messrs. Stagner, Black and Fendrich and letter agreements with Mr. Murphy and Ms. Forbes. The employment agreements with Messrs. Stagner, Black and Fendrich were amended and restated, effective September 14, 2011, to extend the terms of such agreements through the end of fiscal 2014, and, effective upon the consummation of the initial public offering, to increase the annual base salaries of Messrs. Stagner, Black and Fendrich to the amounts set forth below. The letter agreements with Mr. Murphy and Ms. Forbes were amended and restated, effective January 15, 2012, to increase their annual base salaries to the amounts set forth below. As discussed above, when determining the increase to the base salaries of these named executive officers, our board of directors took into account the Company's performance during fiscal 2011 and its expansion over the prior two fiscal years, as well as the increased roles and responsibilities the executive officers would have as executives of a publicly traded company. None of the agreements provide for any tax-gross-ups on severance payments made in relation to a change-in-control. The material terms of these arrangements are summarized below.
- •
- Employment Agreement with
Mr. Stagner. Mr. Stagner is a party to an amended and restated employment agreement, effective September 14, 2011,
under which he is entitled to receive an annual base salary of $500,000 (effective upon the consummation of the initial public offering) and is eligible for an annual target cash bonus. The agreement
also provides for certain payments and benefits to be provided upon a qualifying termination of Mr. Stagner's employment, as described below under "Potential Payments Upon Termination or Change
of Control." In addition, the agreement provides that the term of his employment will be automatically extended for subsequent one-year terms, unless three (3) months notice of
non-renewal is provided by either the Company or Mr. Stagner.
- •
- Employment Agreements with Messrs. Fendrich and
Black. Messrs. Fendrich and Black are each a party to an employment agreement, effective September 14, 2011, under which
each is entitled to receive an annual base salary of $350,000 (effective upon the consummation of the initial public offering) and is eligible for an annual target cash bonus. Each agreement also
provides for certain payments and benefits to be provided upon a qualifying termination of Messrs. Fendrich's or Black's employment, as described below under "Potential Payments Upon
Termination or Change of Control." In addition, each agreement provides that the term of Messrs. Fendrich's or Black's employment will be automatically extended for subsequent
one-year terms, unless three (3) months notice of non-renewal is provided by either the Company or Messrs. Fendrich or Black, as applicable.
- •
- Letter Agreements with Mr. Murphy and Ms. Forbes. Mr. Murphy and Ms. Forbes are each a party to an offer letter agreement with the Company, effective January 15, 2012, under which they each are entitled to receive an annual base salary of $230,000. The agreements also provide that Mr. Murphy and Ms. Forbes are each eligible for an annual target cash bonus. Mr. Murphy is not entitled to payments upon a termination of employment, while Ms. Forbes is entitled to certain payment upon a qualifying termination of her employment, as described below under "Potential Payments Upon Termination or Change of Control." Under both of these agreements, Mr. Murphy and Ms. Forbes are at-will employees.
Retirement and Welfare Benefits
We maintain a retirement savings plan, which is a 401(k) defined contribution plan (the "401(k) Plan"), for the benefit of all eligible employees, including our named executive officers (on the same
103
basis as all eligible employees). The 401(k) Plan provides for an annual match of 331/3% of contribution amounts up to the IRS-imposed plan maximums.
In addition to the 401(k) Plan, we sponsor the Executive Nonqualified Excess Plan, an unfunded, unsecured nonqualified deferred compensation plan under which certain management employees may elect to defer a percentage or specific dollar amount of their compensation until a later date. We offer this plan because it facilitates retirement savings and provides financial flexibility for our key employees. While the Company may, at its discretion, provide matching and profit-sharing contributions under the Executive Nonqualified Excess Plan, we have not, as of this time, elected to make any such contributions.
We also provide our eligible employees, including our named executive officers, with medical, dental and vision coverage, life and accidental death and dismemberment insurance, short-term and long-term disability insurance and the opportunity to enroll in our flexible spending account program.
Executive Perquisites
We provide limited executive perquisites, including Company payment of medical, dental and vision premiums for certain named executive officers, as well as provision and payment of separate life and disability insurance policies for Messrs. Stagner, Black and Fendrich. The costs associated with all perquisites are included in the "Summary Compensation Table" below.
Risk Assessment of Compensation Policies and Practices
Our board of directors and our Compensation Committee have considered whether the risks arising from our compensation practices or policies are reasonably likely to have a materially adverse effect on the Company. We believe that the structure of our compensation programs does not incentivize unnecessary or excessive risk-taking. Our policies and practices include the following risk-mitigating characteristics: our compensation programs are generally administered by our Compensation Committee; there is an annual cap on the amount of bonuses that may be paid to our named executive officers and other employees; the performance goals upon which annual bonuses are paid are approved by our Compensation Committee and our board of directors; bonus amounts are only paid after the performance is certified by this committee after receiving input from our finance department following a review of our audited financials; and our equity awards are subject to multi-year vesting and the ultimate value of such awards is tied to the Company's long-term stock price performance. As a result of this review, the Company does not believe that our compensation policies and practices create or encourage the taking of risks that are reasonably likely to have a material adverse effect on the Company. In addition, we have adopted an insider trading policy that generally prohibits insiders from pledging shares of our common stock and requires prior approval for any hedging of their ownership of our common stock.
Tax and Accounting Considerations
Section 162(m) of the Internal Revenue Code, or "Section 162(m)," disallows a tax deduction for any publicly held corporation for individual compensation exceeding $1 million in any taxable year for certain of its executive officers, other than its chief financial officer, unless such compensation qualifies as performance-based under such section. As we were not publicly traded prior to the initial public offering, neither our Compensation Committee nor the Board of Managers had previously taken the deductibility limit imposed by Section 162(m) into consideration in setting compensation. At such time as we are subject to the deduction limitations of Section 162(m), we expect that our Compensation Committee will consider the deductibility of compensation, but may, in its judgment, authorize compensation payments that do not comply with the exemptions, in whole or in part, under Section 162(m) or that may otherwise be limited as to tax deductibility.
104
Our Compensation Committee, in connection with decisions that relate to our equity incentive award plans and programs, consider the accounting implications of significant compensation decisions. As accounting standards change, we may revise certain programs to appropriately align the accounting expenses of our equity awards with our overall executive compensation philosophy and objectives.
Compensation of Named Executive Officers
The tables in the following sections provide information required by the SEC regarding compensation paid to or earned by our named executive officers.
Summary Compensation Table
The following table sets forth the total compensation awarded to, earned by, or paid to our named executive officers for all services rendered in all capacities to us or Mattress Holdings, LLC in fiscal 2010 and fiscal 2011.
Name and Principal Position
|
Year | Salary ($)(a) |
Stock Awards ($)(b) |
Option Awards ($)(c) |
Non-Equity Incentive Plan Compensation ($)(d) |
All Other Compensation ($)(f) |
Total ($) |
|||||||||||||||
|---|---|---|---|---|---|---|---|---|---|---|---|---|---|---|---|---|---|---|---|---|---|---|
R. Stephen Stagner |
2011 | $ | 424,940 | — | $ | 1,477,620 | $ | 606,100 | $ | 19,989 | $ | 2,528,649 | ||||||||||
President and Chief Executive Officer |
2010 | $ | 395,000 | — | — | $ | 102,168 | $ | 14,249 | $ | 511,417 | |||||||||||
Stephen G. Fendrich |
2011 |
$ |
330,016 |
— |
$ |
738,810 |
$ |
435,000 |
$ |
58,235 |
$ |
1,562,061 |
||||||||||
Chief Strategy Officer |
2010 | (e) | $ | 125,625 | $ | 57,500 | — | $ | 48,424 | $ | 19,447 | $ | 250,996 | |||||||||
James R. Black |
2011 |
$ |
301,958 |
— |
$ |
738,810 |
$ |
464,900 |
$ |
15,845 |
$ |
1,521,513 |
||||||||||
Executive Vice President, Chief |
2010 | $ | 285,500 | — | — | $ | 72,923 | $ | 12,626 | $ | 371,049 | |||||||||||
Kenneth E. Murphy III |
2011 |
$ |
201,365 |
— |
$ |
429,813 |
$ |
195,956 |
— |
$ |
827,134 |
|||||||||||
Executive Vice President, |
||||||||||||||||||||||
Karrie Forbes |
2011 |
$ |
207,569 |
— |
$ |
429,813 |
$ |
158,785 |
$ |
4,805 |
$ |
800,972 |
||||||||||
Executive Vice President, |
||||||||||||||||||||||
- (a)
- Amounts
shown in this column are not reduced to reflect any deferrals under the Executive Nonqualified Excess Plan (our nonqualified deferred
compensation plan) or the 401(k) Plan.
- (b)
- Amounts
shown in the column reflect the fair value of Class B Unit awards on their grant date. The underlying valuation assumptions
for Class B Unit awards are further discussed in Note 14 to the consolidated financial statements for fiscal 2011 (the "2011 Financials"), which are included elsewhere in this
prospectus.
- (c)
- Amounts
shown in this column represent the dollar amounts of the aggregate grant date fair value of stock option awards determined in
accordance with ASC Topic 718. The underlying valuation assumptions for stock option awards are further discussed in Note 14 to the 2011 Financials, which are included elsewhere in this
prospectus.
- (d)
- Amounts
shown in this column represent the named executive officer's annual bonus payment. For each named executive officer, the annual bonus
is based solely on achievement of the Company's Adjusted EBITDA target. Bonus amounts also include a portion of the incremental bonus pool of 10% of the Company's actual Adjusted EBITDA over the
Company's Adjusted EBITDA maximum level target. Bonus amounts are not reduced to reflect any deferrals under the Executive Nonqualified Excess Plan or the 401(k) Plan. See "—Compensation
Discussion and Analysis—Elements of Named Executive Officer Compensation—Bonus and Short-Term Incentive Arrangements".
- (e)
- Mr. Fendrich
joined the Company as Chief Strategy Officer on September 24, 2010. The amounts shown for Mr. Fendrich
during fiscal 2010 reflect his compensation for the portion of fiscal 2010 during which he was employed by the Company.
- (f)
- Amounts shown in the "All Other Compensation" column include the following items, as applicable to each named executive officer, for fiscal 2010 and 2011: Company-paid premiums for life and disability insurance and health coverage, Company contributions to the 401(k) Plan, relocation and temporary housing expenses.
105
All Other Compensation Table
Name
|
Year | Company-Paid Premiums for Life and Disability Insurance ($)(a) |
Company-Paid Premiums for Health Coverage ($)(b) |
Company Contributions to 401(k) Plan ($)(c) |
Relocation Expenses ($) |
Total ($) |
|||||||||||||
|---|---|---|---|---|---|---|---|---|---|---|---|---|---|---|---|---|---|---|---|
R. Stephen Stagner |
2011 | $ | 2,628 | $ | 11,862 | $ | 5,499 | — | $ | 19,989 | |||||||||
Stephen G. Fendrich |
2011 | $ | 6,862 | $ | 11,862 | $ | 583 | $ | 38,928 | (d) | $ | 58,235 | |||||||
James R. Black |
2011 | $ | 1,951 | $ | 8,395 | $ | 5,499 | — | $ | 15,845 | |||||||||
Kenneth E. Murphy III |
2011 | — | — | — | — | — | |||||||||||||
Karrie Forbes |
2011 | — | — | $ | 4,805 | — | $ | 4,805 | |||||||||||
- (a)
- Amounts
shown reflect Company-paid premiums for Messrs. Stagner, Fendrich and Black's life and disability insurance.
- (b)
- Amounts
shown reflect Company-paid premiums for Messrs. Stagner, Fendrich and Black's health coverage, including medical,
dental and vision coverage.
- (c)
- Amounts
shown reflect the Company's matching contributions to the named executive officer's 401(k) Plan account. The 401(k) Plan provides for
an annual match of 331/3% of contribution amounts.
- (d)
- Amount shown reflects reimbursement of relocation expenses in connection with Mr. Fendrich's relocation to Houston, Texas, including temporary housing expenses of $25,600, and a "gross-up" of $13,328 to cover taxes on his temporary housing expenses.
Grants of Plan-Based Awards Table
The following table sets forth information regarding grants of plan-based awards made to our named executive officers during fiscal 2011:
| |
|
|
|
|
|
|
|
|
All other option awards: number of securities underlying options (#)(e) |
|
|
||||||||||||||||||||||
|---|---|---|---|---|---|---|---|---|---|---|---|---|---|---|---|---|---|---|---|---|---|---|---|---|---|---|---|---|---|---|---|---|---|
| |
|
|
Estimated Future Payouts Under Non-Equity Incentive Plan Awards |
Estimated Future Payouts Under Equity Incentive Plan Awards |
Exercise or Base Price of Option Awards ($/Share)(f) |
|
|||||||||||||||||||||||||||
| |
|
|
Grant date fair value of awards ($)(g) |
||||||||||||||||||||||||||||||
Name
|
|
Grant Date |
Threshold ($) |
Target ($)(c) |
Maximum ($)(c) |
Threshold (#) |
Target (#)(d) |
Maximum (#) |
|||||||||||||||||||||||||
R. Stephen Stagner |
Bonus(a) | — | — | $ | 203,050 | $ | 406,100 | — | — | — | — | — | — | ||||||||||||||||||||
|
Stock Options | 11/17/2011 | — | — | — | — | 86,970 | — | 86,970 | $ | 19.00 | $ | 1,477,620 | ||||||||||||||||||||
Stephen G. Fendrich |
Bonus(a) |
— |
— |
$ |
162,500 |
$ |
325,000 |
— |
— |
— |
— |
— |
— |
||||||||||||||||||||
|
Stock Options | 11/17/2011 | — | — | — | — | 43,485 | — | 43,485 | $ | 19.00 | $ | 738,810 | ||||||||||||||||||||
James R. Black |
Bonus(a) |
— |
— |
$ |
144,950 |
$ |
289,900 |
— |
— |
— |
— |
— |
— |
||||||||||||||||||||
|
Stock Options | 11/17/2011 | — | — | — | — | 43,485 | — | 43,485 | $ | 19.00 | $ | 738,810 | ||||||||||||||||||||
Kenneth E. Murphy III |
Bonus(b) |
— |
— |
$ |
70,000 |
$ |
140,000 |
— |
— |
— |
— |
— |
— |
||||||||||||||||||||
|
Stock Options | 11/17/2011 | — | — | — | — | 25,298 | — | 25,298 | $ | 19.00 | $ | 429,813 | ||||||||||||||||||||
Karrie Forbes |
Bonus(b) |
— |
— |
$ |
51,625 |
$ |
103,250 |
— |
— |
— |
— |
— |
— |
||||||||||||||||||||
|
Stock Options | 11/17/2011 | — | — | — | — | 25,298 | — | 25,298 | $ | 19.00 | $ | 429,813 | ||||||||||||||||||||
- (a)
- Non-equity incentive plan compensation for Messrs. Stagner, Fendrich and Black is determined and paid in accordance with the terms of their respective employment agreements, and is based on achievement of Company performance targets that were approved by the Board of Managers prior to the initial public offering.
106
- (b)
- Non-equity
incentive plan compensation for Mr. Murphy and Ms. Forbes is determined and paid in accordance with the
terms of their respective letter agreements, and is based on achievement of Company performance targets that were approved by the Board of Managers prior to the initial public offering.
- (c)
- These
amounts represent target and maximum bonus opportunities for each of the named executive officers. Messrs. Stagner, Fendrich and
Black's employment agreements provide that their target bonus opportunity for fiscal 2011 will be based on base salaries of $406,100, $325,000 and $289,900, respectively, regardless of whether an
initial public offering had been consummated during such fiscal year. For fiscal 2011, each named executive officer also received a supplemental bonus based of a portion of an incremental bonus pool
of 10% of the Company's actual Adjusted EBITDA over the Company's Adjusted EBITDA maximum level target. The actual amount of the bonus earned by each named executive officer for fiscal 2011 is
reported in the "Summary Compensation Table" under the heading "Non-Equity Incentive Plan Compensation." For a description of the supplemental bonuses and performance targets relating to
the Company's bonus opportunities for fiscal 2011, please refer to "—Compensation Discussion and Analysis—Elements of Named
Executive Officer Compensation—Bonus and Short-Term Incentive Arrangements".
- (d)
- All
stock option awards included in this column were granted under the Omnibus Plan in connection with the initial public offering and are
options to purchase common stock of the Company. The award, included in this column, which comprises one-half of the stock options granted to each of our named executive officers, is
subject to a four-year performance-based vesting schedule. The performance vesting component is based on specified stock price increase targets. For a description of the stock option
awards, please refer to "—Compensation Discussion and Analysis—Elements of Named Executive Officer
Compensation—Long-Term Stock-Based Incentive Arrangements".
- (e)
- All
stock option awards included in this column were granted under the Omnibus Plan in connection with the initial public offering and are
options to purchase common stock of the Company. The award, included in this column, which comprises one-half of the stock options granted to each of our named executive officers, is
subject to a five-year time-based vesting schedule. For a description of the stock option awards, please refer to
"—Compensation Discussion and Analysis—Elements of Named Executive Officer Compensation—Stock-Based Incentive
Arrangements".
- (f)
- The
exercise price of the stock options is the fair market value of a share of our common stock on the date of grant, which was determined
based on the per share offering price of our common stock in the initial public offering.
- (g)
- Amounts shown reflect the fair value of the stock option awards on the grant date. The underlying valuation assumptions for stock option awards are further discussed in Note 14 to the 2011 Financials, which are included elsewhere in this prospectus.
Narrative Disclosure to Summary Compensation Table and Grant of Plan-Based Awards Table
Each of our named executive officers is party to an employment agreement (in the cases of Messrs. Stagner, Fendrich and Black) or a letter agreement (in the cases of Mr. Murphy and Ms. Forbes), each of which provides for a base salary and other benefits, as described above in "—Compensation Discussion and Analysis". All of our named executive officers are eligible to participate in our Executive Nonqualified Excess Plan (our nonqualified deferred compensation plan) and our benefit plans and programs.
Our named executive officers were also eligible to receive bonuses based on the Company's achievement of an Adjusted EBITDA target for fiscal 2011. For 2011, the Adjusted EBITDA target was set by the Board of Managers, after consultation with our CEO, CFO and CSO. If the Adjusted EBITDA target was achieved, Messrs. Stagner, Fendrich and Black were entitled to receive a target bonus equal to 50% of base salary, Mr. Murphy was entitled to receive a target bonus equal to 35% of base salary and Ms. Forbes was entitled to receive a target bonus equal to 25% of base salary. If the Company achieved between 90% and 100% of the annual Adjusted EBITDA target, the cash bonus would be determined by linear interpolation between the target percentages described above. If the Company achieved greater than 100% of the annual Adjusted EBITDA target, each executive had the opportunity to receive a bonus of up to two times his or her respective target cash bonus.
In addition to the bonuses described above, our named executive officers are eligible to share with other members of the senior management of the Company in an incremental bonus pool of 10% of the actual amount of annual Adjusted EBITDA in excess of the annual Adjusted EBITDA maximum level target. The amounts paid in respect of such incremental bonus pool are described above under "—Compensation Discussion and Analysis—Elements of Named Executive Officer Compensation—Bonus and Short-Term Incentive Arrangements".
107
We believe that the majority of our named executive officers' total compensation should be tied to variable, performance-based compensation and that the performance-based elements of compensation should be more heavily weighted towards long-term equity awards. For fiscal 2011, fixed, guaranteed compensation (i.e., base salary) represented only 20% of total compensation (measured at target level of performance) for Mr. Stagner, and 27% for our other named executive officers. The remainder was comprised of performance-based compensation, with the majority of such compensation granted in the form of stock option awards.
Outstanding Equity Awards as of Fiscal Year End
The following table summarizes the number of stock options and Class B Units underlying outstanding equity awards for each named executive officer as of January 31, 2012, the last day of fiscal 2011. Stock options were granted by the Company under our Omnibus Plan and are option to purchase common stock of the Company. The Class B Units are equity awards made prior to the initial public offering by our then-sole stockholder, Mattress Holdings, LLC, and are not equity awards of the Company.
| |
|
|
OPTION AWARDS | STOCK AWARDS | ||||||||||||||||||||||||||
|---|---|---|---|---|---|---|---|---|---|---|---|---|---|---|---|---|---|---|---|---|---|---|---|---|---|---|---|---|---|---|
Name
|
Grant Date |
Equity Class (a) |
Number of Securities Underlying Unexercised Options— Unexercisable (#)(b) |
Equity Incentive Awards: Number of Securities Underlying Unexercised Unearned Options (#)(c) |
Option Exercise Price ($)(d) |
Option Expiration Date(e) |
Number of Shares or Units of Stock That Have Not Vested (#) |
Market Value of Shares or Units of Stock That Have Not Vested ($)(i) |
Equity Incentive Awards: Number of Unearned Shares, Units or Other Rights That Have Not Vested (#) |
Equity Incentive Awards: Market or Payout Value of Unearned Shares, Units or Other Rights That Have Not Vested ($)(i) |
||||||||||||||||||||
R. Stephen Stagner |
1/18/2007 | B-2(f) | — | — | — | — | — | — | 107,468 | $ | 3,259,267 | |||||||||||||||||||
|
B-3(g) | — | — | — | — | — | — | 26,867 | $ | 814,817 | ||||||||||||||||||||
|
B-4(h) | — | — | — | — | — | — | 26,867 | $ | 814,817 | ||||||||||||||||||||
|
8/21/2009 | B-2(f) | — | — | — | — | — | — | 15,484 | $ | 469,595 | |||||||||||||||||||
|
B-3(g) | — | — | — | — | — | — | 3,871 | $ | 117,399 | ||||||||||||||||||||
|
B-4(h) | — | — | — | — | — | — | 3,871 | $ | 117,399 | ||||||||||||||||||||
|
11/17/2011 | — | 86,970 | 86,970 | $ | 19.00 | 11/17/2021 | — | — | — | — | |||||||||||||||||||
Stephen G. Fendrich |
10/21/2010 |
B-2(f) |
— |
— |
— |
— |
— |
— |
100,000 |
$ |
3,032,779 |
|||||||||||||||||||
|
B-3(g) | — | — | — | — | — | — | 25,000 | $ | 758,195 | ||||||||||||||||||||
|
B-4(h) | — | — | — | — | — | — | 25,000 | $ | 758,195 | ||||||||||||||||||||
|
11/17/2011 | — | 43,485 | 43,485 | $ | 19.00 | 11/17/2021 | — | — | — | — | |||||||||||||||||||
James R. Black |
1/18/2007 |
B-2(f) |
— |
— |
— |
— |
— |
— |
71,645 |
$ |
2,172,834 |
|||||||||||||||||||
|
B-3(g) | — | — | — | — | — | — | 17,911 | $ | 543,201 | ||||||||||||||||||||
|
B-4(h) | — | — | — | — | — | — | 17,911 | $ | 543,201 | ||||||||||||||||||||
|
8/21/2009 | B-2(f) | — | — | — | — | — | — | 10,322 | $ | 313,043 | |||||||||||||||||||
|
B-3(g) | — | — | — | — | — | — | 2,581 | $ | 78,276 | ||||||||||||||||||||
|
B-4(h) | — | — | — | — | — | — | 2,581 | $ | 78,276 | ||||||||||||||||||||
|
11/17/2011 | — | 43,485 | 43,485 | $ | 19.00 | 11/17/2021 | — | — | — | — | |||||||||||||||||||
Kenneth E. Murphy III |
3/5/2007 |
B-2(f) |
— |
— |
— |
— |
— |
— |
10,747 |
$ |
325,933 |
|||||||||||||||||||
|
B-3(g) | — | — | — | — | — | — | 2,687 | $ | 81,491 | ||||||||||||||||||||
|
B-4(h) | — | — | — | — | — | — | 2,687 | $ | 81,491 | ||||||||||||||||||||
|
8/21/2009 | B-2(f) | — | — | — | — | — | — | 1,548 | $ | 46,947 | |||||||||||||||||||
|
B-3(g) | — | — | — | — | — | — | 387 | $ | 11,737 | ||||||||||||||||||||
|
B-4(h) | — | — | — | — | — | — | 387 | $ | 11,737 | ||||||||||||||||||||
|
11/9/2009 | B-2(f) | — | — | — | — | — | — | 4,098 | $ | 124,283 | |||||||||||||||||||
|
B-3(g) | — | — | — | — | — | — | 1,025 | $ | 31,086 | ||||||||||||||||||||
|
B-4(h) | — | — | — | — | — | — | 1,025 | $ | 31,086 | ||||||||||||||||||||
|
10/21/2010 | B-2(f) | — | — | — | — | — | — | 19,606 | $ | 594,607 | |||||||||||||||||||
|
B-3(g) | — | — | — | — | — | — | 4,902 | $ | 148,667 | ||||||||||||||||||||
|
B-4(h) | — | — | — | — | — | — | 4,902 | $ | 148,667 | ||||||||||||||||||||
|
11/17/2011 | — | 25,298 | 25,298 | $ | 19.00 | 11/17/2021 | — | — | — | — | |||||||||||||||||||
108
| |
|
|
OPTION AWARDS | STOCK AWARDS | ||||||||||||||||||||||||||
|---|---|---|---|---|---|---|---|---|---|---|---|---|---|---|---|---|---|---|---|---|---|---|---|---|---|---|---|---|---|---|
Name
|
Grant Date |
Equity Class (a) |
Number of Securities Underlying Unexercised Options— Unexercisable (#)(b) |
Equity Incentive Awards: Number of Securities Underlying Unexercised Unearned Options (#)(c) |
Option Exercise Price ($)(d) |
Option Expiration Date(e) |
Number of Shares or Units of Stock That Have Not Vested (#) |
Market Value of Shares or Units of Stock That Have Not Vested ($)(i) |
Equity Incentive Awards: Number of Unearned Shares, Units or Other Rights That Have Not Vested (#) |
Equity Incentive Awards: Market or Payout Value of Unearned Shares, Units or Other Rights That Have Not Vested ($)(i) |
||||||||||||||||||||
Karrie Forbes |
3/5/2007 | B-2(f) |
— | — | — | — | — | — | 10,747 | $ | 325,933 | |||||||||||||||||||
|
B-3(g) | — | — | — | — | — | — | 2,687 | $ | 81,491 | ||||||||||||||||||||
|
B-4(h) | — | — | — | — | — | — | 2,687 | $ | 81,491 | ||||||||||||||||||||
|
8/21/2009 | B-2(f) | — | — | — | — | — | — | 1,548 | $ | 46,947 | |||||||||||||||||||
|
B-3(g) | — | — | — | — | — | — | 387 | $ | 11,737 | ||||||||||||||||||||
|
B-4(h) | — | — | — | — | — | — | 387 | $ | 11,737 | ||||||||||||||||||||
|
11/9/2009 | B-2(f) | — | — | — | — | — | — | 4,614 | $ | 139,932 | |||||||||||||||||||
|
B-3(g) | — | — | — | — | — | — | 1,154 | $ | 34,998 | ||||||||||||||||||||
|
B-4(h) | — | — | — | — | — | — | 1,154 | $ | 34,998 | ||||||||||||||||||||
|
11/17/2011 | — | 25,298 | 25,298 | $ | 19.00 | 11/17/2021 | — | — | — | — | |||||||||||||||||||
- (a)
- The
Class B Units are divided into four tranches: Class B-1 Units; Class B-2 Units;
Class B-3 Units; and Class B-4 Units. For a description of the Class B Units, please refer to "—Compensation Discussion and
Analysis—Elements of Named Executive Officer Compensation—Long-Term Stock-Based Incentive Arrangements". Stock option awards granted under the Omnibus Plan are not
divided into separate equity classes.
- (b)
- Reflects
stock options granted under the Omnibus Plan that vest based on service-based vesting conditions. Such stock options vest in equal
annual installments over five years beginning on the first anniversary of the grant date. No such stock options are currently exercisable.
- (c)
- Reflects
stock options granted under the Omnibus Plan that are subject to performance-based vesting conditions for which the performance
conditions have not been satisfied at the end of fiscal year 2011. Such stock options are subject to a four-year performance-based vesting schedule, with such performance vesting based on
specified stock price increase targets.
- (d)
- The
exercise price of stock options is the fair market value of a share of our common stock on the grant date. The exercise price for the
stock options granted on November 17, 2011 was $19.00 per share, and was determined based on the per share offering price of our common stock in the initial public offering. No stock options
have been granted since the initial public offering.
- (e)
- All
stock options have a ten-year term.
- (f)
- The
Class B-2 Units vest in their entirety immediately prior to a change of control or, if earlier, the
Lock-up Expiration Date, if the return on investment to the JWC Investors meets or exceeds a specified annual internal rate of return on invested capital and a specified return on invested
capital of such JWC Investors. Any unvested Class B-2 Units become "earned" ratably over five years, with 20% of such units vesting on January 18 of each year, subject to
continued employment. In general, once a Class B-2 Unit becomes earned, it will not be subject to forfeiture in the event of a named executive officer's termination of employment.
However, a named executive officer will forfeit his or her earned Class B-2 Units if such executive terminates his or her employment without good reason or the Company terminates
the executive officer's employment for cause. In the case of Messrs. Stagner and Black, however, their earned Class B-2 Units will not be subject to forfeiture if the
executive terminates employment without good reason, provided such termination occurs after January 18, 2012. As described under "—Compensation Discussion and
Analysis—Elements of Named Executive Officer Compensation—Long-Term Stock-Based Incentive Arrangements," above, all of the Class B-2 Units vested
in full after the end of fiscal 2011 as a result of the applicable performance thresholds being met in full.
- (g)
- The
Class B-3 Units vest in their entirety immediately prior to a change of control or, if earlier, the
Lock-up Expiration Date, if the return on investment to the JWC Investors meets or exceeds a specified return on invested capital of such JWC Investors. As described under
"—Compensation Discussion and Analysis—Elements of Named Executive Officer Compensation—Long-Term Stock-Based Incentive Arrangements," above, all of the
Class B-2 Units vested in full after the end of fiscal 2011 as a result of the applicable performance thresholds being met in full.
- (h)
- The
Class B-4 Units vest in their entirety immediately prior to a change of control or, if earlier, the
Lock-up Expiration Date, if the return on investment to the JWC Investors meets or exceeds a specified return on invested capital of such JWC Investors. As described under
"—Compensation Discussion and Analysis—Elements of Named Executive Officer Compensation—Long-Term Stock-Based Incentive Arrangements," above, all of the
Class B-2 Units vested in full after the end of fiscal 2011 as a result of the applicable performance thresholds being met in full.
- (i)
- Value is determined using the fair value of Class B Units on the last day of our 2011 fiscal year based on a valuation performed by the Company. Each holder of the vested Class B Units is entitled to his or her pro rata share of future distributions to the equity owners of Mattress Holdings, LLC after certain other equity holders have received aggregate preferred distributions equal to the greater of (i) $154.3 million or (ii) the fair value of Mattress Holdings, LLC's equity on the applicable grant date of the Class B Units. No value was actually realized by the holders of such Class B Units at fiscal year end.
109
Option Exercises and Stock Vested Table
The following table sets forth information regarding the number and value of vested Class B Units for each named executive officer during fiscal 2011. No stock options were exercised by our named executive officers during fiscal 2011.
Name
|
Grant Date | Equity Class | Number of Units Acquired on Vesting (#)(a) |
Value Realized on Vesting ($)(b) |
||||||||
|---|---|---|---|---|---|---|---|---|---|---|---|---|
R. Stephen Stagner |
1/18/2007 | Class B-1 | 21,494 | $ | 324,405 | |||||||
|
8/21/2009 | Class B-1 | 3,097 | $ | 46,686 | |||||||
Stephen G. Fendrich |
10/21/2010 |
Class B-1 |
90,000 |
$ |
1,271,932 |
|||||||
James R. Black |
1/18/2007 |
Class B-1 |
14,329 |
$ |
216,272 |
|||||||
|
8/21/2009 | Class B-1 | 2,064 | $ | 31,124 | |||||||
Kenneth E. Murphy III |
3/5/2007 |
Class B-1 |
2,149 |
$ |
32,438 |
|||||||
|
8/21/2009 | Class B-1 | 310 | $ | 4,671 | |||||||
|
11/9/2009 | Class B-1 | 2,459 | $ | 37,070 | |||||||
|
10/21/2010 | Class B-1 | 18,626 | $ | 263,229 | |||||||
Karrie Forbes |
3/5/2007 |
Class B-1 |
2,149 |
$ |
32,438 |
|||||||
|
8/21/2009 | Class B-1 | 310 | $ | 4,671 | |||||||
|
11/9/2009 | Class B-1 | 1,846 | $ | 27,825 | |||||||
- (a)
- Reflects
time-based Class B Units that vested during fiscal 2011. The unvested portion of the outstanding
time-based Class B Units vested upon consummation of the initial public offering. For a description of the Class B Units, please refer to "—Compensation
Discussion and Analysis—Elements of Named Executive Officer Compensation—Long-Term Stock-Based Incentive Arrangements".
- (b)
- Value is determined using the fair value of the Class B Units on the vesting date based on a valuation performed by the Company. No value was actually realized by the holders of such Class B Units upon vesting.
Non-Qualified Deferred Compensation Table
The following table shows the amounts held by our named executive officers under the Company's Executive Nonqualified Excess Plan, our non-qualified deferred compensation plan, for fiscal 2011.
Name
|
Executive Contributions in Last Fiscal Year ($)(a) |
Registrant Contributions in Last Fiscal Year ($)(b) |
Aggregate Earnings in Last Fiscal Year ($)(c) |
Aggregate Withdrawals/ Distributions ($) |
Aggregate Balance at end of Fiscal 2011 ($) |
|||||||||||
|---|---|---|---|---|---|---|---|---|---|---|---|---|---|---|---|---|
R. Stephen Stagner |
$ | 9,600 | — | $ | (9,561 | ) | — | $ | 186,208 | |||||||
Stephen G. Fendrich |
— | — | — | — | — | |||||||||||
James R. Black |
— | — | $ | (4,190 | ) | $ | 53,130 | $ | 154,520 | |||||||
Kenneth E. Murphy III |
$ | 21,356 | — | $ | (2,080 | ) | $ | 23,791 | $ | 89,988 | ||||||
Karrie Forbes |
$ | 20,969 | — | $ | (981 | ) | — | $ | 145,602 | |||||||
- (a)
- All
amounts deferred by the named executive officers for fiscal 2011 have also been reported in the "Summary Compensation Table" above.
- (b)
- No Company contributions or credits were made into this plan for fiscal 2011.
110
- (c)
- Reflects market-based earnings on amounts credited to participant's accounts under the plan.
The Executive Nonqualified Excess Plan is an unfunded, unsecured nonqualified deferred compensation plan under which certain management employees may elect to defer all or a portion of their base salaries and annual bonuses until a specified date or event. All amounts credited to a participant's account under the plan are notionally invested in mutual funds or other investments available in the market.
Under the Executive Nonqualified Excess Plan, participants are 100% vested in their elective deferrals at all times and become 100% vested in Company contributions upon attainment of age 55, a change of control, or the participant's death or disability. Company contributions vest on a graded schedule beginning with 20% after a participant has completed three years of service, and 20% in each year thereafter until the participant is 100% vested after completing seven years of service. Distributions will occur upon the earliest of (a) a participant's separation from service, (b) the disability of a participant, (c) the death of a participant, (d) a change in control event, or (e) an unforeseeable emergency. In certain instances, a participant may designate certain deferrals as "in-service" or "education" credits, which would permit the participant to receive a distribution of such amount on a specified date. Plan assets are held within a rabbi trust and the Company is restricted from accessing the assets.
Potential Payments Upon Termination or Change in Control
Each of our named executive officers, other than Mr. Murphy, is entitled to receive certain benefits upon a qualifying termination of employment. Mr. Murphy is not entitled to receive any severance benefits upon a termination of employment. The benefits that Messrs. Stagner, Fendrich and Black are entitled to receive upon a termination of employment are set forth in their respective employment agreements. The benefits that Ms. Forbes is entitled to receive upon a termination of employment are set forth in her letter agreement. The Company does not maintain a severance plan.
Each named executive officer was also entitled to accelerated vesting of all or a portion of his or her Class B Units in connection with a change of control. The Class B-2, B-3 and B-4 Units were to vest in their entirety immediately prior to a change of control or, if earlier, the Lock-up Expiration Date, if the return on investment to the JWC Investors meets or exceeds certain established performance thresholds. The following table summarizes the payments that would have been made to our named executive officers upon the occurrence of a qualifying termination of employment or change in control of the Company, assuming that each named executive officer's termination of employment or a change in control occurred on January 31, 2012, the last business day of our fiscal year.
111
Potential Payment Upon Termination or Change in Control
Named Executive Officer
|
Benefit | Change of Control ($)(d) |
Without Cause or For Good Reason ($)(e) |
Non-Renewal (by Company) ($)(e) |
Death ($)(e) |
Disability ($)(e) |
||||||||||||
|---|---|---|---|---|---|---|---|---|---|---|---|---|---|---|---|---|---|---|
R. Stephen Stagner |
Cash Severance(a) |
— | $ | 750,000 | $ | 750,000 | $ | 750,000 | $ | 611,400 | ||||||||
|
Acceleration of Equity(b) |
$ | 9,329,310 | — | — | — | — | |||||||||||
|
Health/Welfare(c) |
— | $ | 17,794 | $ | 17,794 | — | $ | 17,794 | |||||||||
Stephen G. Fendrich |
Cash Severance(a) |
— |
$ |
350,000 |
$ |
262,500 |
$ |
350,000 |
$ |
188,600 |
||||||||
|
Acceleration of Equity(b) |
$ | 7,491,947 | — | — | — | — | |||||||||||
|
Health/Welfare(c) |
— | $ | 11,863 | $ | 8,897 | — | $ | 11,863 | |||||||||
James R. Black |
Cash Severance(a) |
— |
$ |
525,000 |
$ |
525,000 |
$ |
525,000 |
$ |
469,200 |
||||||||
|
Acceleration of Equity(b) |
$ | 6,219,530 | — | — | — | — | |||||||||||
|
Health/Welfare(c) |
— | $ | 12,593 | $ | 12,593 | — | $ | 12,593 | |||||||||
Kenneth E. Murphy III |
Cash Severance(a) |
— |
— |
— |
— |
— |
||||||||||||
|
Acceleration of Equity(b) |
$ | 2,712,754 | — | — | — | — | |||||||||||
|
Health/Welfare(c) |
— | — | — | — | — | ||||||||||||
Karrie Forbes |
Cash Severance(a) |
— |
$ |
115,000 |
— |
— |
— |
|||||||||||
|
Acceleration of Equity(b) |
$ | 1,282,998 | — | — | — | — | |||||||||||
|
Health/Welfare(c) |
— | — | — | — | — | ||||||||||||
- (a)
- The
cash severance for Messrs. Stagner, Fendrich and Black is determined under their respective employment agreements. The cash
severance for Ms. Forbes is determined pursuant to her letter agreement. The amounts in the table above do not include any annual bonus that was earned by its terms as of the last day of fiscal
2011. For a description of the employment agreements for Messrs. Stagner, Fendrich and Black, please see below.
- (b)
- Each
tranche of the Class B Units contained different vesting and acceleration terms. All outstanding Class B-1
Units vested in full upon the consummation of the initial public offering. The Class B-2, B-3 and B-4 Units were to vest in their entirety immediately prior
to a change of control or, if earlier, the Lock-up Expiration Date, if certain specified returns are achieved by the JWC Investors. The value of the Class B-2,
B-3 and B-4 Units for purposes of this table is determined using the fair value of the Class B Units as of the last day of fiscal 2011 based on a valuation performed by
the Company, taking into account the residual value of such units. As described under "—Compensation Discussion and Analysis—Elements of Named Executive Officer
Compensation—Long-Term Stock-Based Incentive Arrangements," all of the Class B-2, B-3 and B-4 Units vested in full subsequent to the
end of fiscal 2011 on May 15, 2012 because the applicable performance thresholds were met in full.
- (c)
- These
figures are based upon COBRA premium rates for medical and dental coverage in effect at the end of fiscal 2011.
- (d)
- Neither
the employment agreements nor the letter agreements provide for payment of benefits solely in the event of a change of control.
However, the terms of the Class B Units provided for an acceleration of equity if certain conditions were met. Please see footnote (b) above for additional information. No amounts have
been included in this table with respect to the acceleration of the outstanding options because under our Omnibus Plan the Compensation Committee is not required to provide for the acceleration of
outstanding options upon a change of control.
- (e)
- For a discussion of each named executive officer's benefits in the event of a termination of employment due to the reason specified in the heading of each column, please see below. With respect to a termination due to
112
disability, Messrs. Stagner, Fendrich and Black are, pursuant to their respective employment agreements, also entitled to continuation of disability insurance coverage to the extent necessary to continue benefits that the executive became entitled to receive prior to the termination of his employment with the Company. These benefits have not been quantified for purposes of this table.
- •
- For Messrs. Stagner and Black:
- •
- Eighteen (18) months salary continuation;
- •
- Eighteen (18) months continuation of medical and dental coverage;
- •
- If such termination or resignation is on or after the last day of any fiscal year for which a bonus is payable, the amount
of such bonus ("Accrued Bonus Payment"); and
- •
- Accrued Compensation.
- •
- For Mr. Fendrich:
- •
- Twelve (12) months salary continuation;
- •
- Twelve (12) months continuation of medical and dental coverage (unless and until he becomes covered by another
employer's medical and dental plans);
- •
- Accrued Bonus Payment; and
- •
- Accrued Compensation.
Termination by the Company for Cause or Resignation by Executive Without Good Reason
Upon termination of employment by Messrs. Stagner, Fendrich or Black other than for good reason, or by the Company for cause, each named executive officer is only entitled to receive earned but unpaid base salary and any accrued and unpaid benefits pursuant to our employee benefit plans or programs in which the executive participates on the executive officer's last day of employment ("Accrued Compensation").
Termination by Company Without Cause or Resignation by Executive for Good Reason
In accordance with the employment agreements of Messrs. Stagner, Fendrich and Black, if a named executive officer's employment is terminated without cause (as such term is defined in their respective agreements) or the named executive officer terminates his employment for good reason (as such term is defined in their respective agreements), then the named executive officer is, subject to his compliance with post-termination obligations relating to confidentiality, intellectual property, non-competition and non-solicitation, entitled to the following:
In accordance with Ms. Forbes's letter agreement, if Ms. Forbes's employment is terminated by the Company without cause, she is entitled to six (6) months salary continuation together with any Accrued Compensation. Mr. Murphy is not entitled to any termination payments under these circumstances, other than Accrued Compensation.
Termination Due to Death or Disability
Upon termination of Messrs. Stagner, Fendrich or Black's employment due to death, the estate of such named executive officer will be entitled to the executive officer's Accrued Compensation and Accrued Bonus Payment.
In addition, if Messrs. Stagner, Fendrich or Black's employment is terminated due to death, his estate will also be entitled to eighteen (18) months salary continuation in the cases of Messrs. Stagner or Black and twelve (12) months salary continuation in the case of Mr. Fendrich.
113
Upon termination due to disability, Messrs. Stagner, Fendrich and Black will each be entitled to Accrued Compensation, Accrued Bonus Payment, and to the following amounts:
- •
- Salary continuation (less the amount that the executive receives pursuant to any Company-sponsored long-term
disability insurance policy) for eighteen (18) months for Messrs. Stagner and Black and twelve (12) months for Mr. Fendrich;
- •
- Premiums for medical and dental coverage for eighteen (18) months for Messrs. Stagner and Black and twelve
(12) months for Mr. Fendrich; and
- •
- Continuation of disability insurance coverage to the extent necessary to continue benefits that the executive officer became entitled to receive prior to the termination of his employment with the Company.
Mr. Murphy and Ms. Forbes are not entitled to any termination payments under these circumstances, other than Accrued Compensation.
Termination Due to Non-Renewal of Term
The employment agreements of Messrs. Stagner, Fendrich and Black provide that the term of their employment will be automatically extended for subsequent one-year terms, unless three (3) months written notice of non-renewal is provided by either the Company or the named executive officer. If the named executive officer provides such notice to us, he is only entitled to Accrued Compensation. However, if the Company provides such notice to the named executive officer, the named executive officer is entitled to the following:
- •
- Messrs. Stagner and Black are entitled to the benefits to which they would be entitled if the Company terminated
such executive officer's employment without cause, or if they resigned for good reason, as described above in "—Termination by Company Without Cause or Resignation by Executive for Good
Reason".
- •
- Mr. Fendrich is entitled to the following benefits:
- •
- Nine (9) months salary continuation;
- •
- Nine (9) months continuation of medical and dental coverage (unless and until he becomes covered by another
employer's medical and dental plans);
- •
- Accrued Bonus Payment; and
- •
- Accrued Compensation.
Restrictive Covenants
Under the terms of their respective agreements and letter agreements, each named executive officer has agreed to confidentiality obligations during and after employment. Under their employment agreements and letter agreements, each named executive officer has agreed to the following:
- •
- Messrs. Stagner and Black have agreed to non-competition and non-solicitation obligations
for eighteen (18) months following employment termination.
- •
- Messrs. Fendrich and Murphy and Ms. Forbes have agreed to non-competition and non-solicitation obligations for twelve (12) months following employment termination.
Director Compensation
In fiscal 2011, none of our directors received compensation for their services on our board of directors, other than Mr. Tinsey, who was paid a cash fee of $11,125 for his Board service.
114
Under our independent director compensation policy, which was approved by our board of directors on January 27, 2012, each member of our board of directors who meets all of the applicable independence requirements set forth therein (including the heightened independence standards applicable to audit committee members under the NASDAQ Rules) is eligible to receive compensation for his or her services as a director as follows, beginning in fiscal year 2012. Currently, only Messrs. Eitel and Tinsey are eligible to receive compensation under the policy.
- •
- Base Compensation. Each independent director receives an annual retainer of $40,000, payable in four equal installments at
the beginning of each fiscal quarter for services provided to our board of directors.
- •
- Committees. Each independent director who serves as a chair of any committee of our board of directors shall receive an
additional annual retainer of $5,000, payable at the beginning of each fiscal year. Each independent director who is a member of the audit committee receives an additional annual retainer of $5,000,
and the chair of the Audit Committee receives an annual additional retainer of $10,000, in each case payable at the beginning of each fiscal year.
- •
- Reimbursement of Travel and Other Expenses. Each independent director is reimbursed for his ordinary and reasonable
expenses in connection with attending meetings of our board of directors and any committee thereof on which he serves.
- •
- Restricted Stock Grants. Each independent director receives an annual grant of restricted stock under the Omnibus Plan with a fair market value equal to $40,000. Subject to such director's continued service as an independent director, such restricted stock becomes fully vested on the first anniversary of the date of grant.
Except for reimbursement for reasonable travel expenses relating to attendance at board of directors and committee meetings, directors who do not meet the criteria of our independent director compensation policy, such as employee directors (currently Mr. Stagner) and directors affiliated with J.W. Childs (currently Messrs. Childs, Fiorentino, Suttin and Watts), are not compensated for their services as directors.
115
The board of directors has adopted written policies and procedures for the review, approval or ratification of any transaction, arrangement or relationship in which we are a participant, the amount involved exceeds $120,000 and one of our executive officers, directors, director nominees, 5% stockholders (or their immediate family or household members) or any firm, corporation or other entity in which any of the foregoing persons has a position or relationship (or, together with his or her immediate family members, a 10% or greater beneficial ownership interest) (each, a "Related Person") has a direct or indirect material interest.
If a Related Person proposes to enter into such a transaction, arrangement or relationship (a "Related Person Transaction"), the Related Person must report the proposed transaction to our Compliance Officer. If the Compliance Officer determines that the proposed transaction is a Related Person Transaction, it shall be submitted to the audit committee for consideration. The policy also permits the chair of the audit committee to review and, if deemed appropriate, approve proposed Related Person Transactions that arise between audit committee meetings.
In the event we become aware of a Related Person Transaction that has not been previously approved or previously ratified under this policy, such ongoing or pending transactions will be submitted to the audit committee or the chair of the audit committee promptly. Based on the conclusions reached, the audit committee or the chair will evaluate all options, including ratification, amendment or termination. If the transaction is completed, the audit committee or the chair will determine if rescission of the transaction and/or any disciplinary action is appropriate, and will ask the Compliance Officer to evaluate the Company's controls and procedures to determine the reason the transaction was not submitted for prior approval.
A Related Person Transaction reviewed under the policy will be considered approved or ratified if it is authorized by the Audit Committee after full disclosure of the Related Person's interest in the transaction. As appropriate for the circumstances, the Audit Committee will review and consider:
- •
- the benefits to us;
- •
- the impact on a director's independence in the event the related person is a director, an immediate family member of a
director or an entity in which a director has a position or relationship;
- •
- the availability of other sources for comparable products or services;
- •
- the terms of the transaction; and
- •
- the terms available to unrelated third parties or to employees generally.
The audit committee may approve or ratify a Related Person Transaction only if the audit committee determines that, under all of the circumstances, the transaction is in, or is not inconsistent, with the Company's best interests. The audit committee may impose any conditions on the Related Person Transaction that it deems appropriate.
Management Agreement with J.W. Childs Associates, L.P.
J.W. Childs provided financial and strategic corporate planning services and other management consulting services to the Company pursuant to the terms of a management agreement dated January 18, 2007, as amended on March 20, 2009 (the "Management Agreement"). The Management Agreement was terminated upon the completion of our initial public offering. Under the Management Agreement, we paid an annual management fee of $360,000, payable to J.W. Childs in equal monthly cash installments. We incurred $418,232, $494,438 and $433,346 in paid or accrued reimbursement expenses and management fees and interest thereon with respect to fiscal 2009, 2010 and 2011,
116
respectively. We paid a $360,000 termination fee in November 2011 to terminate the management agreement upon the completion of our initial public offering, as a result of which the agreement terminated.
We also reimbursed J.W. Childs and its controlled investment funds on demand for all expenses arising out of the services provided under the management agreement, its debt restructuring in March 2009 and J.W. Childs's equity investment in us.
Registration Rights Agreement
In connection with our initial public offering, certain indirect holders of our equity immediately prior to the initial public offering became party to a registration rights agreement with us. Pursuant to the agreement, J.W. Childs, which indirectly owns an aggregate of 20,232,910 shares of our common stock as of September 19, 2012 (after giving effect to the assumed dissolution of Mattress Holdings, LLC on September 19, 2012), has a right to require us to register its shares under the Securities Act after expiration in December 2012 of the lock-up agreements executed in connection with this offering. In addition, the holders of the remaining shares of our outstanding common stock immediately prior to our initial public offering who become party to the registration rights agreement are entitled to include their shares of common stock in any such registrations, subject to the ability of the underwriters to limit the number of shares included under certain circumstances. We are obligated to pay all fees, costs and expenses of any such registration, other than underwriting discounts and commissions. This offering is not being made pursuant to the terms and conditions of the registration rights agreement.
PIK Notes
On January 28, 2008, February 27, 2008, May 20, 2009 and June 22, 2009, we entered into agreements pursuant to which we issued PIK Notes in aggregate principal amounts of $7,000,000, $1,901,082, $17,100,875 and $2,219,313, respectively, to certain investors. Certain members of management and investment funds associated with J.W. Childs and Neuberger Berman Group, LLC, respectively, were parties to one or more of these agreements. Each such group of affiliated funds held in excess of 10% or more of the outstanding units of Mattress Holdings, LLC, our direct parent. In connection our initial public offering, the outstanding balance of principal and accrued interest of $57.3 million under the PIK Notes were either (1) repaid through the use of proceeds from the initial public offering or (2) converted into shares of our common stock at a conversion rate equal to the $19.00 per share initial public offering price of our common stock. As a result, funds associated with J.W. Childs and Neuberger Berman Group, LLC received 2,354,978 and 391,147 shares of our common stock, respectively, Messrs. Black and Murphy and Ms. Forbes received 20,236, 862 and 4,074 shares of our common stock, respectively, and Mr. Stagner and Mr. and Ms. Forbes received $1,460,270 and $15,917, respectively, in repayment. As a result of the foregoing, the PIK Notes are no longer outstanding.
Convertible Notes
On July 19, 2011, we issued the Convertible Notes in an aggregate principal amount $40.2 million, of which $35.4 million and $4.8 million in aggregate principal amount were issued to funds associated with J.W. Childs and Neuberger Berman Group, LLC, respectively, and $0.1 million in aggregate principal amount was issued to Mr. and Ms. Forbes. The proceeds from the issuance of the Convertible Notes were used to repay a portion of the principal, plus accrued interest, of loans extended under the loan facility between Mattress Intermediate Holdings, Inc., our direct subsidiary, and a group of lenders maturing in January 2015 and for general corporate purposes. The Convertible Notes automatically converted into shares of our common stock in connection with our initial public offering at a conversion rate equal to the $19.00 per share initial public offering price of our common stock. As a
117
result, funds associated with J.W. Childs and Neuberger Berman Group, LLC received 1,939,942 and 263,269 shares of our common stock, respectively, and Mr. and Ms. Forbes received 2,742 shares of our common stock. As a result of the foregoing, the Convertible Notes are no longer outstanding.
Other Relationships with J.W. Childs
Investment funds associated with J.W. Childs indirectly own 59.92% of our outstanding common stock as of September 19, 2012 after giving effect to the dissolution of Mattress Holdings, LLC on September 19, 2012. For as long as J.W. Childs continues to directly or indirectly own shares of common stock representing more than 50% of the voting power of our common stock, J.W. Childs will be able to direct the election of all of the members of the board of directors and could exercise a controlling influence over our business and affairs, including any determinations with respect to mergers or other business combinations, the acquisition or disposition of assets, the incurrence of indebtedness, the issuance of any additional common stock or other equity securities, the repurchase or redemption of common stock and the payment of dividends. Similarly, these entities will have the power to determine matters submitted to a vote of our stockholders without the consent of our other stockholders, will have the power to prevent a change in our control and could take other actions that might be favorable to them.
118
DESCRIPTION OF CERTAIN INDEBTEDNESS
2007 Senior Credit Facility
General
On January 18, 2007, Mattress Holding, our indirect subsidiary, entered into a credit agreement with UBS Securities LLC and certain of its affiliates and other lenders for a term loan and revolving credit facility, which was amended and restated on February 16, 2007 (as amended and restated, the "2007 Senior Credit Facility"). As of July 31, 2012, the 2007 Senior Credit Facility consisted of (i) a $240.0 million term loan facility maturing January 2014 and (ii) a $35.0 million revolving credit facility maturing on January 18, 2013, which includes a $15.0 million letter of credit subfacility and a $5.0 million swingline loan subfacility. As of July 31, 2012, there was an aggregate of $227.2 million of term loan borrowings outstanding under the 2007 Senior Credit Facility, which is net of an unamortized debt discount of $0.3 million. As of July 31, 2012 we had $5.0 million in outstanding revolver borrowings and total borrowing capacity of $29.0 million on the 2007 Senior Credit Facility. On August 28, 2012, the Company paid off the outstanding revolver borrowings on the 2007 Senior Credit Facility. At September 7, 2012, there were standby letters of credit outstanding in the amount of $1.0 million and additional borrowings available of $34.0 million.
Interest Rate and Fees
Borrowings under the 2007 Senior Credit Facility bear interest at a rate equal to an applicable margin plus, at our option, either (a) a base rate determined by reference to the highest of (i) the corporate base rate of interest established by the administrative agent and (ii) the federal funds effective rate from time to time plus 0.50%, or (b) the London Interbank Offered Rate, or "LIBOR," determined by reference to the costs of funds for deposits for the interest period relevant to such borrowing adjusted for certain additional costs.
The applicable margin percentages for term loans are 1.25% for base rate loans and 2.25% for LIBOR loans. The applicable margin percentages for revolving loans are based upon our total leverage ratio and vary from 1.25% to 1.75% for base rate loans and from 2.25% to 2.75% for LIBOR loans. As of July 31, 2012, the applicable margin percentage for revolving loans was 1.25% for base rate loans and 2.25% for LIBOR loans, and as of that date, we had $5.0 million in outstanding revolver borrowings. Swingline loans bear interest at an interest rate equal to the interest rate for base rate loans, and as of July 31, 2012, no such borrowings were outstanding. On the last day of each quarter, we also pay a commitment fee (payable in arrears) in respect of any unused commitments under the revolving credit facility, subject to adjustment based upon the level of the total leverage ratio which varies from 0.375% to 0.50%. As of July 31, 2012, the commitment fee was 0.375%. We also pay fees for the issuance and maintenance of letters of credit.
Amortization of Term Loans
Outstanding borrowings under the 2007 Senior Credit Facility are payable in quarterly principal installments of $0.6 million, with the outstanding balance due at maturity on January 18, 2014. The quarterly payments are subject to reduction as a result of Mandatory Prepayments discussed below.
Mandatory and Optional Prepayments
The 2007 Senior Credit Facility requires us to prepay outstanding term loans, subject to certain exceptions, with:
- •
- 50% of our annual excess cash flow as may be reduced to a minimum of 25% based upon the total leverage ratio (as of February 1, 2011 such percentage had been reduced to 25%) is payable 120 days after the end of our fiscal year;
119
- •
- 100% of the net cash proceeds of certain asset sales and casualty and condemnation events, subject to reinvestment rights
and certain other exceptions;
- •
- 100% of the net cash proceeds of any incurrence of certain debt, other than debt permitted under the 2007 Senior Credit
Facility; and
- •
- 100% of the net cash proceeds from specified issuance of preferred equity securities.
The foregoing mandatory prepayments will be applied first to the next four scheduled quarterly payments on the term loan facility in direct order of maturity, and second to the remaining quarterly payments on the term loan facility on a pro rata basis.
In addition, we may voluntarily repay outstanding loans under the 2007 Senior Credit Facility at any time without premium or penalty, other than customary "breakage" costs with respect to LIBOR loans.
Collateral and Guarantees
The 2007 Senior Credit Facility entered into by Mattress Holding is guaranteed by, subject to certain exceptions, Mattress Holding's immediate parent entity, Mattress Holdco, and by each of the existing and future subsidiaries of Mattress Holding. All obligations under the 2007 Senior Credit Facility, and the guarantees of those obligations, are secured by substantially all of the existing and future property and assets of Mattress Holding and the guarantors under the 2007 Senior Credit Facility, and by a pledge of Mattress Holdings' capital stock and the capital stock of, subject to certain exceptions, each of our domestic subsidiaries (and, if applicable, by up to 66% of the capital stock of any future first-tier controlled foreign subsidiaries of our U.S. subsidiaries) under the 2007 Senior Credit Facility.
Certain Covenants
The 2007 Senior Credit Facility requires us to comply on a quarterly basis with the following financial covenants:
- •
- a maximum total leverage ratio; and
- •
- a minimum interest coverage ratio.
These financial covenants are measured using, among other things, Adjusted EBITDA of Mattress Holding and its subsidiaries, as adjusted to include pro forma results of acquisitions. As of the fiscal quarter ended July 31, 2012, the terms of the 2007 Senior Credit Facility required that we maintain a total leverage ratio of no more than 4.00:1 and a minimum interest coverage ratio of 3.00:1. As of July 31, 2012, we were in compliance with these financial covenants. The total leverage ratio financial covenant and the minimum interest coverage ratio financial covenant each become more restrictive over time, and will require that Mattress Holding maintain a total leverage ratio of no more than 3.50:1 and a minimum interest coverage ratio of 3.0:1 as of the end of fiscal 2012.
The 2007 Senior Credit Facility limits the permitted capital expenditures of Mattress Holding and its subsidiaries to $40 million for each of fiscal 2012 and 2013. The permitted limit may be increased for any year by the amount of equity capital that is contributed to Mattress Holding during the year and designated for that purpose. In addition, if the aggregate amount of capital expenditures made in any year are less than the permitted amount, the amount of the shortfall in that year may increase the permitted amount of capital expenditures for the immediately succeeding (but not any other) year.
Subject to certain limitations and restrictions, we have the ability to exercise equity cure rights, which allow the inclusion of capital contributions made to Mattress Holdings in the results of its operations for the purpose of measuring the maximum total leverage ratio and minimum interest
120
coverage ratio. We maintained compliance with financial covenants for the fiscal quarter ended February 3, 2009, through the exercise of an equity cure right that involved us making a capital contribution to Mattress Holding in the amount of approximately $16.9 million on March 20, 2009.
In addition, the 2007 Senior Credit Facility includes negative covenants that on and after the closing date will, subject to significant exceptions, limit the ability of Mattress Holding, its immediate parent entity, Mattress Holdco, and by each of the existing and future subsidiaries of Mattress Holding to, among other things:
- •
- incur indebtedness;
- •
- create liens;
- •
- engage in mergers or consolidations;
- •
- sell assets (including pursuant to sale and leaseback transactions);
- •
- pay dividends and distributions or repurchase our capital stock;
- •
- make investments, acquisitions, loans or advances;
- •
- make capital expenditures (as described above);
- •
- repay, pay or redeem certain indebtedness;
- •
- engage in certain transactions with affiliates;
- •
- enter into agreements limiting subsidiary distributions;
- •
- enter into agreements limiting the ability to create liens;
- •
- amend material agreements governing certain indebtedness; and
- •
- change our lines of business.
The 2007 Senior Credit Facility includes certain customary representations and warranties, affirmative covenants and events of default, including payment defaults, breach of representations and warranties, covenant defaults, cross-defaults to certain indebtedness, certain events of bankruptcy, certain events under ERISA, material judgments, the invalidity of material provisions of the 2007 Senior Credit Facility documentation, actual or asserted failure of the guarantees or security documents for the 2007 Senior Credit Facility, and a change of control.
121
PRINCIPAL AND SELLING STOCKHOLDERS
As of September 19, 2012, there were 33,768,828 shares of common stock outstanding. The following table sets forth information regarding beneficial ownership, as of September 19, 2012, of outstanding shares of our common stock, par value $0.01 per share, by:
- •
- each person or group known to us to own more than 5% of the aggregate number of our common stock;
- •
- each member of the board of directors and each of its named executive officers;
- •
- each other stockholder selling shares in this offering;
- •
- all of our directors and executive officers and their affiliates as a group; and
- •
- all of our directors, executive officers, selling stockholders and their affiliates as a group.
Prior to our initial public offering, Mattress Holdings, LLC was the record and beneficial owner of 100% of our outstanding common stock. As of September 19, 2012, Mattress Holdings, LLC held 22,399,952 shares, or 66.3%, of the Company's outstanding common stock, and its outstanding membership interests consisted of 15,399 voting Class A Units, 2,214,027 non-voting Class B Units and 17,079,817 voting Class C Units. In connection with this offering, Mattress Holdings, LLC will be dissolved and the shares of our common stock held by it will be distributed to its unitholders, which include members of management and investment funds. Certain of the unitholders of Mattress Holdings, LLC are the selling stockholders referenced in this prospectus. The table below reflects the number of shares of our common stock that will be held by the individuals and entities listed below immediately following the dissolution.
Unless otherwise indicated below, the address for each listed director, officer and selling stockholder is 5815 Gulf Freeway, Houston, Texas, 77023. Beneficial ownership has been determined in accordance with the applicable rules and regulations promulgated under the Exchange Act. To our knowledge, except under applicable community property laws or as otherwise indicated, the persons named in the table have sole voting and sole investment control with respect to all shares shown as beneficially owned. For information regarding the terms of our common stock, see "Description of Capital Stock." For information regarding our relationship with certain of the persons named below, see "Related Party Transactions."
| |
Common Stock Beneficially Owned Before Offering |
Common Stock Offered Hereby (no over-allotment option exercise) |
Common Stock Beneficially Owned After Offering (no over-allotment option exercise) |
|||||||||||||
|---|---|---|---|---|---|---|---|---|---|---|---|---|---|---|---|---|
Name and Address of Beneficial Owner
|
# | % | # | # | % | |||||||||||
Beneficial Owners of 5% or more of the Company's shares: |
||||||||||||||||
Investment funds associated with J.W. Childs(1) |
20,232,910 | 59.92 | % | 1,500,000 | 18,732,910 | 55.47 | % | |||||||||
Investment funds associated with Neuberger Berman Group, LLC(2) |
3,031,695 | 8.98 | % | 3,031,695 | — | * | % | |||||||||
Directors, Executive Officers and Selling Stockholders: |
||||||||||||||||
James R. Black(3) |
512,922 | 1.52 | % | 38,779 | 474,143 | 1.40 | % | |||||||||
John W. Childs(4) |
— | — | % | — | — | — | % | |||||||||
Charles Eitel |
— | — | % | — | — | — | % | |||||||||
Stephen G. Fendrich(5) |
235,384 | * | % | — | 235,384 | * | % | |||||||||
David A. Fiorentino(4)(6) |
12,500 | * | % | — | 12,500 | * | % | |||||||||
Karrie Forbes(7) |
105,606 | * | % | 11,169 | 94,437 | * | % | |||||||||
Kenneth E. Murphy III(8) |
107,300 | * | % | 17,435 | 89,865 | * | % | |||||||||
R. Steve Stagner(9) |
1,426,691 | 4.22 | % | 107,171 | 1,319,520 | 3.91 | % | |||||||||
122
| |
Common Stock Beneficially Owned Before Offering |
Common Stock Offered Hereby (no over-allotment option exercise) |
Common Stock Beneficially Owned After Offering (no over-allotment option exercise) |
|||||||||||||
|---|---|---|---|---|---|---|---|---|---|---|---|---|---|---|---|---|
Name and Address of Beneficial Owner
|
# | % | # | # | % | |||||||||||
Adam L. Suttin(4)(10) |
12,500 | * | % | — | 12,500 | * | % | |||||||||
Frederick C. Tinsey III(11) |
34,206 | * | % | — | 34,206 | * | % | |||||||||
William E. Watts(4)(12) |
10,000 | * | % | — | 10,000 | * | % | |||||||||
Matthew Forbes(13) |
33,191 | * | % | 3,511 | 29,680 | * | % | |||||||||
Daniel McGuire(14) |
92,059 | * | % | 7,051 | 85,008 | * | % | |||||||||
George McGill(15) |
38,987 | * | % | 7,051 | 31,936 | * | % | |||||||||
Bruce Levy(16) |
38,983 | * | % | 2,820 | 36,163 | * | % | |||||||||
Craig McAndrews(17) |
38,983 | * | % | — | 38,983 | * | % | |||||||||
Kindel Elam |
— | — | % | — | — | — | % | |||||||||
All executive officers and directors as a group (16 persons)(18) |
2,574,062 | 7.62 | % | 184,425 | 2,389,637 | 7.08 | % | |||||||||
All executive officers, directors and selling stockholders as a group (19 persons)(19) |
25,963,917 | 76.89 | % | 4,726,682 | 21,237,235 | 62.89 | % | |||||||||
- *
- Indicates
beneficial ownership of less than 1%
- (1)
- Represents
(i) 4,294,920 shares of the Company's common stock directly held by J.W. Mattress Holdings, LLC, a limited
liability company managed by J.W. Childs Associates, Inc.; (ii) 15,155,866 shares of the Company's common stock indirectly held by J.W. Childs Equity Partners
III, L.P., a Delaware limited partnership, whose general partner is J.W. Childs Advisors III, L.P.; and (iii) 782,124 shares of the Company's common stock indirectly
held by JWC Fund III Co-Invest, LLC, a Delaware limited liability company, whose managing member is J.W. Childs Associates, L.P. J.W. Childs
Equity Partners III, L.P. and JWC Fund III Co-Invest, LLC hold their interest in the Company's common stock through J.W. Mattress
Holdings, LLC, a limited liability company managed by J.W. Childs Associates, Inc. Voting and investment control of each of J.W. Childs Equity
Partners III, L.P. and JWC Fund III Co-Invest, LLC is held by J.W. Childs Associates, Inc. Each of the J.W. Childs entities
referenced above disclaims beneficial ownership of any securities other than the securities directly held by such entity.
- (2)
- Represents
(i) 582,772 shares of the Company's common stock directly held by and 2,036,008 shares of the Company's common stock
corresponding to the equity interest in Mattress Holdings, LLC of NB Co-Investment Partners LP, a Delaware limited partnership ("NB Partners");
(ii) 15,118 shares of the Company's common stock directly held by and 52,820 shares of the Company's common stock corresponding to the equity interest in Mattress Holdings, LLC of
NB Co-Investment Group LP, a Delaware limited partnership ("NB Group"); (iii) 21,323 shares of the Company's common stock directly held by and 74,496 shares of
the Company's common stock corresponding to the equity interest in Mattress Holdings, LLC of Co-Investment Capital Partners LP, a Delaware limited partnership ("Capital
Partners" and, together with NB Partners and NB Group, the "NBCIP Entities"); and (iv) 35,203 shares of the Company's common stock directly held by and 213,955 shares of the
Company's common stock corresponding to the equity interest in Mattress Holdings, LLC of NB Fund of Funds XVIII—Co-Investment Holding LP, a Delaware
limited partnership ("NB Fund XVIII"). The investment and voting control of the securities held by each of the NBCIP Entities is exercised by its investment committee, which is
composed, in each case, of the following individuals: Messrs. John Buser, Michael Kramer, John Massey, David Morse, Michael Odrich, David Stonberg, Brian Talbot, Anthony Tutrone, Brien Smith
and Peter von Lehe. The investment and voting control of the securities held by NB Fund XVIII is exercised by its investment committee, which is composed of the following individuals:
Messrs. Hobby Abshier, John Buser, Joseph Malick, John Massey, Jonathan Shofet, Brien Smith, David Stonberg, AnthonyTutrone and Peter von Lehe. The general partner of each of the
NBCIP Entities and NB Fund XVIII and the individuals on the foregoing investment committees disclaim beneficial ownership of these securities.
- (3)
- Represents
20,236 shares of the Company's common stock directly held by Mr. Black and 492,686 shares of the Company's common stock
corresponding to Mr. Black's equity interest in Mattress Holdings, LLC.
- (4)
- Messrs. Childs, Fiorentino, Suttin and Watts are employees of J.W. Childs and, by virtue of this and the relationships described in note (2) above, may be deemed to share voting and dispositive power with respect to the 4,292,920 shares of the Company's common stock directly held by and the 15,937,988 shares of the Company's common stock corresponding to the equity interest in Mattress Holdings, LLC of J.W. Childs Mattress Holdings, LLC. Each of Messrs. Childs, Fiorentino, Suttin and Watts expressly disclaims beneficial
123
ownership of any securities owned beneficially or of record by any person or persons other than himself for purposes of Section 13(d)(3) and Rule 13d-3 of the Exchange Act and expressly disclaims beneficial ownership of any such securities except to the extent of his pecuniary interest therein.
- (5)
- Represents
235,384 shares of the Company's common stock corresponding to Mr. Fendrich's equity interest in Mattress
Holdings, LLC.
- (6)
- Represents
12,500 shares of the Company's common stock directly held by Mr. Fiorentino.
- (7)
- Represents
5,445 shares of the Company's common stock directly held by Ms. Forbes and 100,161 shares of the Company's common stock
corresponding to Ms. Forbes's equity interest in Mattress Holdings, LLC. Excludes 1,371 shares of the Company's common stock directly held by Matthew Forbes, Ms. Forbes's husband,
and 31,820 shares of the Company's common stock corresponding to Mr. Forbes's equity interest in Mattress Holdings, LLC as to which Ms. Forbes disclaims beneficial ownership
except to the extent of her pecuniary interest therein.
- (8)
- Represents
862 shares of the Company's common stock directly held by Mr. Murphy and 106,438 shares of the Company's common stock
corresponding to Mr. Murphy's equity interest in Mattress Holdings, LLC.
- (9)
- Represents
1,426,691 shares of the Company's common stock corresponding to Mr. Stagner's equity interest in Mattress
Holdings, LLC. Excludes 283,234 shares of the Company's common stock corresponding to the equity interest in Mattress Holdings, LLC that are held of record by Mr. Stagner as
trustee under the Constructive Trustee Agreement dated December 10, 2010 between Mr. Stagner and Julie Stagner, Mr. Stagner's former wife. Pursuant to the Constructive Trustee
Agreement, Ms. Stagner holds sole voting and investment power over these shares. Mr. Stagner disclaims any pecuniary interest in these shares of the Company's common stock.
- (10)
- Represents
12,500 shares of the Company's common stock indirectly held by Mr. Suttin through a trust, the beneficiaries of which are
Mr. Suttin's wife and children.
- (11)
- Represents
7,000 shares of the Company's common stock directly held by Mr. Tinsey and 27,206 shares of the Company's common stock
corresponding to Mr. Tinsey's equity interest in Mattress Holdings, LLC.
- (12)
- Represents
10,000 shares of the Company's common stock directly held by Mr. Watts.
- (13)
- Represents
1,371 shares of the Company's common stock directly held by Mr. Forbes and 31,820 shares of the Company's common stock
corresponding to Mr. Forbes's equity interest in Mattress Holdings, LLC. Excludes 5,445 shares of the Company's common stock directly held by Karrie Forbes, Mr. Forbes's wife, and
100,161 shares of the Company's common stock corresponding to Ms. Forbes's equity interest in Mattress Holdings, LLC as to which Mr. Forbes disclaims beneficial ownership except to the
extent of his pecuniary interest therein.
- (14)
- Represents
1,142 shares of the Company's common stock directly held by Mr. McGuire and 90,917 shares of the Company's common stock
corresponding to Mr. McGuire's equity interest in Mattress Holdings, LLC.
- (15)
- Represents
38,987 shares of the Company's common stock corresponding to Mr. McGill's equity interest in Mattress Holdings, LLC.
- (16)
- Represents
38,983 shares of the Company's common stock corresponding to Mr. Levy's equity interest in Mattress Holdings, LLC.
- (17)
- Represents
38,983 shares of the Company's common stock corresponding to Mr. McAndrews's equity interest in Mattress Holdings, LLC.
- (18)
- Represents 68,543 shares of the Company's common stock directly held by executive officers and directors and 2,505,519 shares of the Company's common stock corresponding to the executive officers' and directors' equity interest in Mattress Holdings, LLC.
124
General
Our authorized capital stock currently consists of 120,000,000 shares of common stock, par value $0.01 per share, and 5,000,000 shares of preferred stock, par value $0.001 per share. As of September 19, 2012, 33,768,828 shares of common stock were issued and outstanding and no shares of preferred stock were issued or outstanding. The discussion set forth below describes our capital stock, certificate of incorporation and bylaws as in effect upon consummation of this offering. The following summary of certain provisions of our capital stock describes material provisions of our certificate of incorporation and bylaws relating to such capital stock, but does not purport to be complete. We urge you to read our certificate of incorporation and bylaws, which are included as exhibits to the registration statement of which this prospectus forms a part.
Common Stock
Dividend Rights. Subject to preferences that may apply to shares of preferred stock outstanding at the time, holders of outstanding shares of common stock are entitled to receive dividends out of assets legally available at the times and in the amounts as the board of directors may from time to time determine.
Voting Rights. Except as required by law or matters relating solely to the terms of preferred stock, each outstanding share of common stock are entitled to one vote on all matters submitted to a vote of stockholders. Holders of shares of our common stock have no cumulative voting rights.
Preemptive Rights. Our common stock is not be entitled to preemptive or other similar subscription rights to purchase any of our securities.
Conversion or Redemption Rights. Our common stock is neither convertible nor redeemable.
Liquidation Rights. Upon our liquidation, the holders of our common stock will be entitled to receive, pro rata, our assets which are legally available for distribution, after payment of all debts and other liabilities and subject to the prior rights of any holders of preferred stock then outstanding.
Listing. Our common stock is listed on the NASDAQ Global Select Market under the symbol "MFRM."
Preferred Stock
Our board of directors may, without further action by our stockholders, from time to time, direct the issuance of shares of preferred stock in series and may, at the time of issuance, determine the designations, powers, preferences, privileges, and relative participating, optional or special rights as well as the qualifications, limitations or restrictions thereof, including dividend rights, conversion rights, voting rights, terms of redemption and liquidation preferences, any or all of which may be greater than the rights of the common stock. Satisfaction of any dividend preferences of outstanding shares of preferred stock would reduce the amount of funds available for the payment of dividends on shares of our common stock. Holders of shares of preferred stock may be entitled to receive a preference payment in the event of our liquidation before any payment is made to the holders of shares of our common stock. Under specified circumstances, the issuance of shares of preferred stock may render more difficult or tend to discourage a merger, tender offer or proxy contest, the assumption of control by a holder of a large block of our securities or the removal of incumbent management. Our board of directors, without stockholder approval, may issue shares of preferred stock with voting and conversion rights which could adversely affect the holders of shares of our common stock and the market value of our common stock. Subject to the rights of the holders of shares of preferred stock, the number of authorized shares of preferred stock may be increased or decreased (but not below the number of
125
shares thereof then outstanding) by the affirmative vote of the holders of a majority of the voting power of the outstanding shares of capital stock of the Company entitled to vote generally in the election of directors. There are no shares of preferred stock outstanding, and we have no present intention to issue any shares of preferred stock although we may in the future decide to do so.
Anti-takeover Effects of our Certificate of Incorporation and Bylaws
Our certificate of incorporation and our bylaws contain provisions that may delay, defer or discourage another party from acquiring control of us. We expect that these provisions, which are summarized below, will discourage coercive takeover practices or inadequate takeover bids. These provisions are also designed to encourage persons seeking to acquire control of us to first negotiate with the board of directors, which we believe may result in an improvement of the terms of any such acquisition in favor of our stockholders. However, they also give the board of directors the power to discourage acquisitions that some stockholders may favor.
Classified Board of Directors
Our board of directors is divided into three classes, Class I, Class II and Class III, with members of each class serving staggered three-year terms. Our certificate of incorporation provides that the authorized number of directors may be changed only by resolution of the board of directors. Any additional directorships resulting from an increase in the number of directors will be distributed among the three classes so that, as nearly as possible, each class will consist of one-third of the directors. Our certificate of incorporation and our bylaws also provide that a director may be removed only for cause by the affirmative vote of the holders of at least 662/3% of our voting stock, and that any vacancy on our board of directors, including a vacancy resulting from an enlargement of our board of directors, may be filled only by vote of a majority of our directors then in office. Our classified board of directors could have the effect of delaying or discouraging an acquisition of us or a change in our management.
Action by Written Consent
The Delaware General Corporation Law ("DGCL") provides that, unless otherwise stated in a corporation's certificate of incorporation, the stockholders may act by written consent without a meeting. Our certificate of incorporation provides that after the investment funds associated with J.W. Childs collectively own less than 50% of our outstanding common stock, any action required or permitted to be taken by our stockholders at an annual meeting or special meeting of the stockholders may only be taken at an annual or special meeting before which it is properly brought, and not by written consent without a meeting.
Special Meeting of Stockholders and Advance Notice Requirements for Stockholder Proposals
Our certificate of incorporation and bylaws provide that, except as otherwise required by law, special meetings of the stockholders can only be called by (a) our chairman or vice chairman of the board of directors or (b) a majority of the board of directors through a special resolution.
In addition, our bylaws require advance notice procedures for stockholder proposals to be brought before an annual meeting of the stockholders, including the nomination of directors. Stockholders at an annual meeting may only consider the proposals specified in the notice of meeting or brought before the meeting by or at the direction of the board of directors, or by a stockholder of record on the record date for the meeting who is entitled to vote at the meeting, who has delivered a timely written notice in proper form to our secretary of the stockholder's intention to bring such business before the meeting, who attends (or has a qualified representative attend) the stockholder meeting and who has otherwise complied with the provisions of our bylaws and applicable law.
126
These provisions could have the effect of delaying until the next stockholder meeting any stockholder actions, even if they are favored by the holders of a majority of our outstanding voting securities.
Amendment to Certificate of Incorporation and Bylaws
The DGCL provides generally that the affirmative vote of a majority of the outstanding stock entitled to vote on amendments to a corporation's certificate of incorporation or bylaws is required to approve such amendment, unless a corporation's certificate of incorporation or bylaws, as the case may be, requires a greater percentage. Our bylaws may be amended or repealed by a majority vote of our board of directors or, in addition to any other vote otherwise required by law, the affirmative vote of at least 662/3% of the voting power of our outstanding shares of common stock. Additionally, so long as the investment funds associated with J.W. Childs collectively beneficially own more than 50% of the outstanding shares of common stock, the affirmative vote of the holders of a majority of the voting power of the outstanding shares of common stock and, from and after the date on which the investment funds associated with J.W. Childs cease collectively to beneficially own more than 50% of the outstanding shares of common stock, the affirmative vote of at least 662/3% of the voting power of the outstanding shares of capital stock, in each case entitled to vote on the adoption, alteration, amendment or repeal of our certificate of incorporation, voting as a single class, is required to amend or repeal or to adopt any provision inconsistent with the "Classified Board of Directors," "Action by Written Consent," "Special Meetings of Stockholders," "Amendments to Certificate of Incorporation and Bylaws" and "Business Combinations" provisions described in our certificate of incorporation. These provisions may have the effect of deferring, delaying or discouraging the removal of any anti-takeover defenses provided for in our certificate of incorporation and our bylaws.
Corporate Opportunity
Our certificate of incorporation provides that we renounce any interest or expectancy in, or in being offered an opportunity to participate in, any business opportunity that may from time to time be presented to J.W. Childs or any of its officers, directors, agents, stockholders, members, partners, affiliates and subsidiaries (other than us and our subsidiaries) and that may be a business opportunity for J.W. Childs, even if the opportunity is one that we might reasonably have pursued or had the ability or desire to pursue if granted the opportunity to do so. No such person will be liable to us for breach of any fiduciary or other duty, as a director or officer or otherwise, by reason of the fact that such person, acting in good faith, pursues or acquires any such business opportunity, directs any such business opportunity to another person or fails to present any such business opportunity, or information regarding any such business opportunity, to us unless, in the case of any such person who is our director or officer, any such business opportunity is expressly offered to such director or officer solely in his or her capacity as our director or officer. None of J.W. Childs, any of the investment funds associated with J.W. Childs or any of their respective representatives has any duty to refrain from engaging directly or indirectly in the same or similar business activities or lines of business as us or any of our subsidiaries. The affirmative vote of 80% of the voting power of the outstanding shares of capital stock entitled to vote on the adoption, alteration, amendment or repeal of amendments to our certificate of incorporation, voting together as a single class, will be required to alter, amend or repeal this provision of our certificate of incorporation.
Exclusive Jurisdiction of Certain Actions
Our certificate of incorporation requires, to the fullest extent permitted by law, that derivative actions brought in the name of the Company, actions against directors, officers and employees for breach of fiduciary duty and other similar actions may be brought only in the Court of Chancery in the State of Delaware. Although we believe this provision benefits the Company by providing increased
127
consistency in the application of Delaware law in the types of lawsuits to which it applies, the provision may have the effect of discouraging lawsuits against our directors and officers.
Business Combinations
We have opted out of Section 203 of the DGCL. However, our certificate of incorporation contains similar provisions providing that we may not engage in certain "business combinations" with any "interested stockholder" for a three-year period following the time that the stockholder became an interested stockholder, unless:
- •
- prior to such time, our board of directors approved either the business combination or the transaction which resulted in
the stockholder becoming an interested stockholder;
- •
- upon consummation of the transaction that resulted in the stockholder becoming an interested stockholder, the interested
stockholder owned at least 85% of our voting stock outstanding at the time the transaction commenced, excluding certain shares; or
- •
- at or subsequent to that time, the business combination is approved by our board of directors and by the affirmative vote of holders of at least 662/3% of the outstanding voting stock that is not owned by the interested stockholder.
Generally, a "business combination" includes a merger, asset or stock sale or other transaction resulting in a financial benefit to the interested stockholder. Subject to certain exceptions, an "interested stockholder" is a person who, together with that person's affiliates and associates, owns, or within the previous three years owned, 15% or more of our voting stock.
Under certain circumstances, this provision will make it more difficult for a person who would be an "interested stockholder" to effect various business combinations with a corporation for a three-year period. This provision may encourage companies interested in acquiring our company to negotiate in advance with our board of directors because the stockholder approval requirement would be avoided if our board of directors approves either the business combination or the transaction which results in the stockholder becoming an interested stockholder. These provisions also may have the effect of preventing changes in our board of directors and may make it more difficult to accomplish transactions which stockholders may otherwise deem to be in their best interests.
Our certificate of incorporation provides that the investments funds associated with J.W. Childs, any affiliated investment entity, and any of their respective direct or indirect transferees of at least 5% of our outstanding common stock and any group as to which such persons are party to, do not constitute "interested stockholders" for purposes of this provision.
Limitations on Liability and Indemnification of Officers and Directors
Our certificate of incorporation and bylaws limits the liability of our directors to the fullest extent permitted by applicable law and provides that we will indemnify them to the fullest extent permitted by such law. We entered into indemnification agreements with our current directors and executive officers and expect to enter into a similar agreement with any new directors or executive officers. We expect to increase our directors' and officers' liability insurance coverage prior to the completion of this offering.
Transfer Agent and Registrar
The transfer agent and registrar for our common stock is Computershare Trust Company, N.A. Its address is 250 Royal Street, Canton, Massachusetts 02021. Its telephone number is (800) 962-4284.
128
CERTAIN U.S. FEDERAL INCOME AND ESTATE TAX CONSIDERATIONS FOR NON-U.S. HOLDERS OF SHARES OF OUR COMMON STOCK
The following is a summary of certain U.S. federal income and estate tax considerations relating to the purchase, ownership and disposition of shares of our common stock by Non-U.S. Holders (defined below). This summary does not purport to be a complete analysis of all the potential tax considerations relevant to Non-U.S. Holders of shares of our common stock. This summary is based upon the Internal Revenue Code of 1986, as amended (the "Internal Revenue Code"), the Treasury regulations promulgated or proposed thereunder and administrative and judicial interpretations thereof, all as of the date hereof and all of which are subject to change at any time, possibly on a retroactive basis. There can be no assurance that the Internal Revenue Service ("IRS") will not challenge one or more of the tax consequences described herein, and we have not obtained, nor do we intend to obtain, a ruling from the IRS or an opinion of counsel with respect to the U.S. federal income or estate tax consequences to a Non-U.S. Holder of the purchase, ownership or disposition of shares of our common stock.
This summary assumes that shares of our common stock are held by a Non-U.S. Holder as "capital assets" within the meaning of Section 1221 of the Internal Revenue Code. This summary does not purport to deal with all aspects of U.S. federal income and estate taxation that might be relevant to particular Non-U.S. Holders in light of their particular investment circumstances or status, nor does it address specific tax considerations that may be relevant to particular persons who are subject to special treatment under U.S. federal income tax laws (including, for example, financial institutions, broker-dealers, insurance companies, partnerships or other pass-through entities, U.S. expatriates or former long-term residents of the United States, tax-exempt organizations, pension plans, "controlled foreign corporations," "passive foreign investment companies," corporations that accumulate earnings to avoid U.S. federal income tax, persons in special situations, such as those who have elected to mark securities to market or those who hold shares of our common stock as part of a straddle, hedge, conversion transaction, synthetic security or other integrated investment, persons that have a "functional currency" other than the U.S. dollar, or holders subject to the alternative minimum tax). In addition, this summary does not address certain estate and any gift tax considerations or considerations arising under the tax laws of any state, local or non-U.S. jurisdiction.
For purposes of this summary, a "Non-U.S. Holder" means a beneficial owner of shares of our common stock that, for U.S. federal income tax purposes, is an individual, corporation, estate or trust other than:
- •
- an individual who is a citizen or resident of the United States;
- •
- a corporation, or any other organization taxable as a corporation for U.S. federal income tax purposes, that is
created or organized in or under the laws of the United States, any state thereof or the District of Columbia;
- •
- an estate, the income of which is included in gross income for U.S. federal income tax purposes regardless of its
source; or
- •
- a trust if (1) a U.S. court is able to exercise primary supervision over the trust's administration and one or more United States persons (as defined in the Internal Revenue Code) have the authority to control all of the trust's substantial decisions or (2) the trust has a valid election in effect under applicable U.S. Treasury regulations to be treated as a United States person.
If an entity that is classified as a partnership for U.S. federal income tax purposes holds shares of our common stock, the tax treatment of persons treated as its partners for U.S. federal income tax purposes will generally depend upon the status of the partner and the activities of the partnership. Partnerships and other entities that are classified as partnerships for U.S. federal income tax purposes
129
(and persons who are partners of such partnerships or other entities) holding shares of our common stock are urged to consult their own tax advisors.
A modified definition of Non-U.S. Holder applies for U.S. federal estate tax purposes (as discussed below).
THIS SUMMARY IS FOR GENERAL INFORMATION ONLY AND IS NOT INTENDED TO BE TAX ADVICE. PROSPECTIVE INVESTORS ARE URGED TO CONSULT THEIR OWN TAX ADVISORS CONCERNING THE U.S. FEDERAL INCOME AND ESTATE TAXATION, STATE, LOCAL AND NON-U.S. TAXATION AND OTHER TAX CONSEQUENCES TO THEM OF THE PURCHASE, OWNERSHIP AND DISPOSITION OF SHARES OF OUR COMMON STOCK, AS WELL AS THE APPLICATION OF STATE, LOCAL AND NON-U.S. INCOME AND OTHER TAX LAWS.
Distributions on Shares of Our Common Stock
As discussed under "Dividend Policy" above, we do not currently anticipate paying cash dividends on shares of our common stock in the foreseeable future. In the event that we do make a distribution of cash or property with respect to shares of our common stock, any such distributions generally will constitute dividends for U.S. federal income tax purposes to the extent of our current or accumulated earnings and profits, as determined under U.S. federal income tax principles and will be subject to withholding as described in the next paragraph below. If a distribution exceeds our current or accumulated earnings and profits, the excess will be treated as a tax-free return of the Non-U.S. Holder's investment, up to such holder's adjusted tax basis in its shares of our common stock (determined on a share-by-share basis). Any remaining excess will be treated as capital gain, subject to the tax treatment described below in "Gain on Sale, Exchange or Other Taxable Disposition of Our Common Stock." Any distribution described in this paragraph would also be subject to the discussion below in "Additional Withholding and Information Reporting Requirements for Shares of Our Common Stock Held By or Through Foreign Entities."
Any dividends paid to a Non-U.S. Holder with respect to shares of our common stock generally will be subject to a 30% U.S. federal withholding tax unless such Non-U.S. Holder provides us or our agent, as the case may be, with an appropriate IRS Form W-8 prior to the payment of dividends, such as:
- •
- IRS Form W-8BEN (or successor form) certifying, under penalties of perjury, that such
Non-U.S. Holder is entitled to a reduction in withholding under an applicable income tax treaty, or
- •
- IRS Form W-8ECI (or successor form) certifying, under penalties of perjury, that a dividend paid on shares of our common stock is not subject to withholding tax because it is effectively connected with the conduct of a trade or business in the United States of the Non-U.S. Holder (in which case such dividend generally will be subject to regular graduated U.S. federal income tax rates on a net income basis as described below).
The certification requirement described above also may require a Non-U.S. Holder that provides an IRS form or that claims treaty benefits to provide its U.S. taxpayer identification number.
Each Non-U.S. Holder is urged to consult its own tax advisor about the specific methods for satisfying these requirements. A claim for exemption will not be valid if the person receiving the applicable form has actual knowledge or reason to know that the statements on the form are false.
If dividends are effectively connected with the conduct of a trade or business in the United States of the Non-U.S. Holder (and, if required by an applicable income tax treaty, are attributable to a permanent establishment or fixed base maintained by such Non-U.S. Holder in the United States), the
130
Non-U.S. Holder, although exempt from the withholding tax described above (provided that the certifications described above are satisfied), will generally be subject to U.S. federal income tax on such dividends on a net income basis in the same manner as if it were a resident of the United States. In addition, if such Non-U.S. Holder is taxable as a corporation for U.S. federal income tax purposes, such Non-U.S. Holder may be subject to an additional "branch profits tax" equal to 30% of its effectively connected earnings and profits for the taxable year, unless an applicable income tax treaty provides otherwise.
If a Non-U.S. Holder is eligible for a reduced rate of U.S. federal withholding tax pursuant to an applicable income tax treaty, such holder may obtain a refund or credit of any excess amount withheld by timely filing an appropriate claim for refund with the IRS.
Gain on Sale, Exchange or Other Taxable Disposition of Shares of Our Common Stock
Subject to the discussion below under "Additional Withholding and Information Reporting Requirements for Shares of Our Common Stock Held By or Through Foreign Entities," in general, a Non-U.S. Holder will not be subject to U.S. federal income tax or withholding tax on any gain realized upon such holder's sale, exchange or other taxable disposition of shares of our common stock unless (i) such Non-U.S. Holder is an individual who is present in the United States for 183 days or more in the taxable year of disposition, and certain other conditions are met, (ii) we are or have been a "United States real property holding corporation," as defined in the Internal Revenue Code (a "USRPHC"), at any time within the shorter of the five-year period preceding the disposition and the Non-U.S. Holder's holding period with respect to the applicable shares of our common stock (the "relevant period"), or (iii) such gain is effectively connected with the conduct by such Non-U.S. Holder of a trade or business in the United States (and, if required by an applicable income tax treaty, is attributable to a permanent establishment or fixed base maintained by such Non-U.S. Holder in the United States).
If the first exception applies, the Non-U.S. Holder generally will be subject to U.S. federal income tax at a rate of 30% (unless an applicable income tax treaty provides otherwise) on the amount by which such Non-U.S. Holder's capital gains allocable to U.S. sources exceed capital losses allocable to U.S. sources during the taxable year of the disposition.
With respect to the second exception above, although there can be no assurance, we believe we are not, and we do not currently anticipate becoming, a USRPHC. However, because the determination of whether we are a USRPHC depends on the fair market value of our U.S. real property relative to the fair market value of other business assets, there can be no assurance that we are not currently or will not become a USRPHC in the future. Generally, a corporation is a USRPHC only if the fair market value of its United States real property interests (as defined in the Internal Revenue Code) equals or exceeds 50% of the sum of the fair market value of its worldwide real property interests plus certain other assets used or held for use in a trade or business. Even if we are or become a USRPHC, a Non-U.S. Holder would not be subject to U.S. federal income tax on a sale, exchange or other taxable disposition of our common stock by reason of our status as a USRPHC so long as (i) our common stock continues to be regularly traded on an established securities market (within the meaning of Internal Revenue Code Section 897(c)(3)) during the calendar year in which such sale, exchange or other taxable disposition of our common stock occurs and (ii) such Non-U.S. Holder does not own and is not deemed to own (directly, indirectly or constructively) more than 5% of our common stock at any time during the relevant period. If we are a USRPHC and the requirements of (i) or (ii) are not met, gain on the disposition of shares of our common stock generally will be taxed in the same manner as gain that is effectively connected with the conduct of a U.S. trade or business, except that the "branch profits tax" will not apply.
131
If the third exception applies, the Non-U.S. Holder generally will be subject to U.S. federal income tax on a net income basis with respect to such gain in the same manner as if such holder were a resident of the United States, unless otherwise provided in an applicable income tax treaty, and a Non-U.S. Holder that is a corporation for U.S. federal income tax purposes may also be subject to a "branch profits tax" with respect to such gain at a rate of 30%, unless an applicable income tax treaty provides otherwise.
Additional Withholding and Information Reporting Requirements for Shares of Our Common Stock Held By or Through Foreign Entities
Legislation enacted in March 2010 (commonly referred to as "FATCA") generally will impose a U.S. federal withholding tax of 30% on payments to certain non-U.S. entities (including certain intermediaries), including dividends on and the gross proceeds from a sale or other disposition of our common stock, unless such persons comply with a complicated U.S. information reporting, due diligence, disclosure and certification regime. This new regime and its requirements are different from, and in addition to, the certification requirements described elsewhere in this discussion. As currently proposed, the FATCA withholding rules would apply to certain payments, including dividend payments on our common stock, if any, paid after December 31, 2013, and to payments of gross proceeds from the sale or other dispositions of our common stock paid after December 31, 2014. Although administrative guidance and proposed regulations have been issued, regulations implementing the new FATCA regime have not been finalized and the exact scope of these rules remains unclear and potentially subject to material changes. Prospective investors should consult their own tax advisors regarding the possible impact of these rules on their investment in our common stock, including any investment in our common stock made through another entity.
Backup Withholding and Information Reporting
We must report annually to the IRS and to each Non-U.S. Holder the gross amount of the distributions on shares of our common stock paid to such holder and the tax withheld, if any, with respect to such distributions. These information reporting requirements apply even if withholding was not required. Subject to the discussion above under "Additional Withholding and Information Reporting Requirements for Shares of Our Common Stock Held By or Through Foreign Entities," a Non-U.S. Holder may have to comply with specific certification procedures to establish that the holder is not a United States person (as defined in the Internal Revenue Code) in order to avoid backup withholding at the applicable rate, currently 28% and scheduled to increase to 31% for taxable years 2013 and thereafter, with respect to dividends on our common stock. Dividends paid to Non-U.S. Holders subject to the U.S. federal withholding tax, as described above in "Distributions on Shares of Our Common Stock," generally will be exempt from U.S. backup withholding.
Information reporting and backup withholding will generally apply to the payment of the proceeds of a disposition of shares of our common stock by a Non-U.S. Holder effected by or through the U.S. office of any broker, U.S. or foreign, unless the holder certifies its status as a Non-U.S. Holder and satisfies certain other requirements, or otherwise establishes an exemption. Generally, backup withholding will not apply to a payment of disposition proceeds to a Non-U.S. Holder where the transaction is effected through a non-U.S. office of a U.S. broker or non-U.S. office of a foreign broker. For information reporting purposes, dispositions effected through a non-U.S. office of a broker with substantial U.S. ownership or operations generally will be treated in a manner similar to dispositions effected through a U.S. office of a broker. Prospective investors are urged to consult their own tax advisors regarding the application of the information reporting and backup withholding rules to them.
Copies of information returns may be made available to the tax authorities of the country in which the Non-U.S. Holder resides or is incorporated under the provisions of a specific treaty or agreement.
132
Backup withholding is not an additional tax. Any amounts withheld under the backup withholding rules from a payment made to a Non-U.S. Holder can be refunded or credited against such Non-U.S. Holder's U.S. federal income tax liability, if any, provided that an appropriate claim is timely filed with the IRS.
Federal Estate Tax
Shares of our common stock held (or treated as held) by an individual who is not a United States citizen or resident (as specifically determined for U.S. federal estate tax purposes) at the time of such individual's death will be included in such individual's gross estate for U.S. federal estate tax purposes, unless an applicable estate tax treaty provides otherwise. Generally, amounts included in the taxable estate of decedents on or before December 31, 2012, are subject to U.S. federal estate tax at a maximum rate of 35%. However, the maximum U.S. federal estate tax rate is scheduled to increase to 55% with respect to the taxable estate of decedents dying after December 31, 2012.
133
Barclays Capital Inc. and UBS Securities LLC are acting as the representatives of the underwriters and joint book-running managers of this offering. Citigroup Global Markets Inc. also is acting as a joint book-running manager of this offering. Under the terms of an underwriting agreement, which will be filed as an exhibit to the registration statement of which this prospectus forms a part, each of the underwriters named below has severally agreed to purchase from the selling stockholders the number of shares of common stock shown opposite its name below:
Underwriters
|
Number of shares |
|||
|---|---|---|---|---|
Barclays Capital Inc. |
||||
UBS Securities LLC |
||||
Citigroup Global Markets Inc. |
||||
William Blair & Company, L.L.C. |
||||
KeyBanc Capital Markets Inc. |
||||
SunTrust Robinson Humphrey, Inc. |
||||
Total |
4,726,682 | |||
The underwriting agreement provides that the underwriters' obligation to purchase shares of common stock depends on the satisfaction of the conditions contained in the underwriting agreement including:
- •
- the obligation to purchase all of the shares of common stock offered hereby (other than those shares of common stock
covered by their option to purchase additional shares as described below), if any of the shares are purchased;
- •
- the representations and warranties made by the selling stockholders to the underwriters are true;
- •
- there is no material change in our business or the financial markets; and
- •
- the selling stockholders deliver customary closing documents to the underwriters.
Commissions and Expenses
The following table summarizes the underwriting discounts and commissions the selling stockholders will pay to the underwriters. These amounts are shown assuming both no exercise and full exercise of the underwriters' option to purchase additional shares. The underwriting fee is the difference between the initial price to the public and the amount the underwriters pay to the selling stockholders for the shares.
| |
No Exercise | Full Exercise | |||||
|---|---|---|---|---|---|---|---|
Per unit |
$ | $ | |||||
Total |
$ | $ | |||||
The representatives of the underwriters have advised us that the underwriters propose to offer the shares of common stock directly to the public at the public offering price on the cover of this prospectus and to selected dealers, which may include the underwriters, at such offering price less a selling concession not in excess of $ per share. After the offering, the representatives may change the offering price and other selling terms. Sales of shares made outside of the United States may be made by affiliates of the underwriters.
We estimate that the total expenses of this offering will be approximately $580,000 (excluding underwriting discounts and commissions).
134
Option to Purchase Additional Shares
The selling stockholders have granted the underwriters an option exercisable for 30 days after the date of the underwriting agreement, to purchase, from time to time, in whole or in part, up to an aggregate of 709,002 shares at the public offering price less underwriting discounts and commissions. This option may be exercised if the underwriters sell more than 4,726,682 shares in connection with this offering. To the extent that this option is exercised, each underwriter will be obligated, subject to certain conditions, to purchase its pro rata portion of these additional shares based on the underwriter's underwriting commitment in the offering as indicated in the table at the beginning of this "Underwriting" section.
Lock-Up Agreements
The selling stockholders, our directors and our executive officers have agreed that, without the prior written consent of Barclays Capital Inc. and UBS Securities LLC, they will not directly or indirectly, (1) offer for sale, sell, pledge, or otherwise dispose of (or enter into any transaction or device that is designed to, or could be expected to, result in the disposition by any person at any time in the future of) any shares of common stock (including, without limitation, shares of common stock that may be deemed to be beneficially owned by us or them in accordance with the rules and regulations of the Securities and Exchange Commission and shares of common stock that may be issued upon exercise of any options or warrants) or securities convertible into or exercisable or exchangeable for common stock, (2) enter into any swap or other derivatives transaction that transfers to another, in whole or in part, any of the economic consequences of ownership of the common stock, (3) make any demand for or exercise any right or file or cause to be filed a registration statement, including any amendments thereto, with respect to the registration of any shares of common stock or securities convertible, exercisable or exchangeable into common stock or any of our other securities, or (4) publicly disclose the intention to do any of the foregoing for a period of 90 days after the date of this prospectus.
The 90-day restricted period described in the preceding paragraph will be extended if:
- •
- during the last 17 days of the 90-day restricted period we issue an earnings release or material news
or a material event relating to us occurs; or
- •
- prior to the expiration of the 90-day restricted period, we announce that we will release earnings results during the 16-day period beginning on the last day of the 90-day period, in which case the restrictions described in the preceding paragraph will continue to apply until the expiration of the 18-day period beginning on the issuance of the earnings release or the announcement of the material news or occurrence of material event unless such extension is waived in writing by Barclays Capital Inc. and UBS Securities LLC.
Barclays Capital Inc. and UBS Securities LLC, in their sole discretion, may release the common stock and other securities subject to the lock-up agreements described above in whole or in part at any time with or without notice. When determining whether or not to release common stock and other securities from lock-up agreements, Barclays Capital Inc. and UBS Securities LLC will consider, among other factors, the holder's reasons for requesting the release, the number of shares of common stock and other securities for which the release is being requested and market conditions at the time.
Indemnification
We and the selling stockholders have agreed to indemnify the underwriters against certain liabilities, including liabilities under the Securities Act and liabilities incurred in connection with the directed share program referenced below, and to contribute to payments that the underwriters may be required to make for these liabilities.
135
Stabilization, Short Positions and Penalty Bids
The representatives may engage in stabilizing transactions, short sales and purchases to cover positions created by short sales, and penalty bids or purchases for the purpose of pegging, fixing or maintaining the price of the common stock, in accordance with Regulation M under the Securities Exchange Act.
- •
- Stabilizing transactions permit bids to purchase the underlying security so long as the stabilizing bids do not exceed a
specified maximum.
- •
- A short position involves a sale by the underwriters of shares in excess of the number of shares the underwriters are
obligated to purchase in the offering, which creates the syndicate short position. This short position may be either a covered short position or a naked short position. In a covered short position,
the number of shares involved in the sales made by the underwriters in excess of the number of shares they are obligated to purchase is not greater than the number of shares that they may purchase by
exercising their option to purchase additional shares. In a naked short position, the number of shares involved is greater than the number of shares in their option to purchase additional shares. The
underwriters may close out any short position by either exercising their option to purchase additional shares and/or purchasing shares in the open market. In determining the source of shares to close
out the short position, the underwriters will consider, among other things, the price of shares available for purchase in the open market as compared to the price at which they may purchase shares
through their option to purchase additional shares. A naked short position is more likely to be created if the underwriters are concerned that there could be downward pressure on the price of the
shares in the open market after pricing that could adversely affect investors who purchase in the offering.
- •
- Syndicate covering transactions involve purchases of the common stock in the open market after the distribution has been
completed in order to cover syndicate short positions.
- •
- Penalty bids permit the representatives to reclaim a selling concession from a syndicate member when the common stock originally sold by the syndicate member is purchased in a stabilizing or syndicate covering transaction to cover syndicate short positions.
These stabilizing transactions, syndicate covering transactions and penalty bids may have the effect of raising or maintaining the market price of our common stock or preventing or retarding a decline in the market price of the common stock. As a result, the price of the common stock may be higher than the price that might otherwise exist in the open market. These transactions may be effected on the NASDAQ Global Select Market or otherwise and, if commenced, may be discontinued at any time.
Neither we nor any of the underwriters make any representation or prediction as to the direction or magnitude of any effect that the transactions described above may have on the price of the common stock. In addition, neither we nor any of the underwriters make representation that the representatives will engage in these stabilizing transactions or that any transaction, once commenced, will not be discontinued without notice.
Electronic Distribution
A prospectus in electronic format may be made available on the internet sites or through other online services maintained by one or more of the underwriters and/or selling group members participating in this offering, or by their affiliates. In those cases, prospective investors may view offering terms online and, depending upon the particular underwriter or selling group member, prospective investors may be allowed to place orders online. The underwriters may agree with us to allocate a specific number of shares for sale to online brokerage account holders. Any such allocation for online distributions will be made by the representatives on the same basis as other allocations.
136
Other than the prospectus in electronic format, the information on any underwriter's or selling group member's web site and any information contained in any other web site maintained by an underwriter or selling group member is not part of the prospectus or the registration statement of which this prospectus forms a part, has not been approved and/or endorsed by us or any underwriter or selling group member in its capacity as underwriter or selling group member and should not be relied upon by investors.
Our common stock is listed on the NASDAQ Global Select Market under the symbol "MFRM."
Stamp Taxes
If you purchase shares of common stock offered in this prospectus, you may be required to pay stamp taxes and other charges under the laws and practices of the country of purchase, in addition to the offering price listed on the cover page of this prospectus.
Relationships
UBS Securities LLC and its affiliates have provided various commercial banking services for us from time to time for which they have received customary fees and expenses, including serving as sole arranger and bookrunner and participating as a lender under the 2007 Senior Credit Facility. SunTrust Bank, an affiliate of SunTrust Robinson Humphrey, Inc., is also one of our lenders under the 2007 Senior Credit Facility. In connection with that transaction, SunTrust Bank has received customary fees and expenses.
The underwriters and their affiliates may, from time to time, engage in transactions with and perform services for us, such as other commercial banking services, investment banking and financial advisory services, fairness opinions and other similar services, including those that may be provided in connection with any acquisitions or investments we may make, for which they will receive customary compensation.
Additionally, in the ordinary course of their various business activities, the underwriters and their respective affiliates may make or hold a broad array of investments and actively trade debt and equity securities (or related derivative securities) and financial instruments (including bank loans) for their own account and for the accounts of their customers and may at any time hold long and short positions in such securities and instruments. Such investment and securities activities may involve our securities and instruments or holdings in or through the selling stockholders and their respective affiliates.
Selling Restrictions
European Economic Area
This document is not a prospectus for the purposes of the Prospectus Directive (as defined below).
In relation to each Member State of the European Economic Area which has implemented the Prospectus Directive (as defined below) (each, a "Relevant Member State") with effect from and including the date on which the Prospectus Directive is implemented in that Relevant Member State (the "Relevant Implementation Date"), an offer to the public of any shares of our common stock which are the subject of the offering contemplated by this prospectus supplement, may not be made in that Relevant Member State other than:
- (a)
- to
any legal entity which is a qualified investor as defined in the Prospectus Directive;
- (b)
- to fewer than 100 or, if the Relevant Member State has implemented the relevant provision of the 2010 PD Amending Directive (as defined below), 150, natural or legal persons (other than qualified investors as defined in the Prospectus Directive), as permitted under the Prospectus Directive, subject to obtaining the prior consent of the Initial Purchasers for any such offer; or
137
- (c)
- in any other circumstances fully within Article 3(2) of the Prospectus Directive,
provided that no such offer of our common stock shall result in a requirement for the publication by us or any underwriter of a prospectus pursuant to Article 3 of the Prospectus Directive.
For the purposes of this provision, the expression an "offer to the public" in relation to any shares of our common stock in any Relevant Member State means the communication in any form and by any means of sufficient information on the terms of the offer and our common stock to be offered so as to enable an investor to decide to purchase or subscribe for our common stock, as the same may be varied in that Relevant Member State by any measure implementing the Prospectus Directive in that Relevant Member State and the expression "Prospectus Directive" means Directive 2003/71/EC (and amendments thereto, including the 2010 PD Amending Directive, to the extent implemented in the Relevant Member State), and includes any relevant implementing measure in each Relevant Member State and the expression "2010 PD Amending Directive" means Directive 2010/73/EU.
United Kingdom
This prospectus supplement is only being distributed to, and is only directed at, persons in the United Kingdom that are qualified investors within the meaning of Article 2(1)(e) of the Prospectus Directive, which we refer to as Qualified Investors, that are also (i) investment professionals falling within Article 19(5) of the Financial Services and Markets Act 2000 (Financial Promotion) Order 2005, which we refer to as the Order, or (ii) high net worth entities, falling within Article 49(2)(a) to (d) of the Order, and (iii) any other person to whom it may lawfully be communicated pursuant to the Order, all such persons which we refer to together as relevant persons. This prospectus supplement and its contents are confidential and should not be distributed, published or reproduced (in whole or in part) or disclosed by recipients to any other persons in the United Kingdom. Any investment activity to which this prospectus supplement relates will only be available to, and will only be engaged with, relevant persons. Any person in the United Kingdom that is not a relevant person should not act or rely on this document or any of its contents.
All applicable provisions of the Financial Services and Markets Act 2000 (as amended) must be complied with in respect to anything done by any person in relation to our common stock in, from or otherwise involving the United Kingdom.
Switzerland
The prospectus does not constitute an issue prospectus pursuant to Article 652a or Article 1156 of the Swiss Code of Obligations ("CO") and the shares will not be listed on the SIX Swiss Exchange. Therefore, the Prospectus may not comply with the disclosure standards of the CO and/or the listing rules (including any prospectus schemes) of the SIX Swiss Exchange. Accordingly, the shares may not be offered to the public in or from Switzerland, but only to a selected and limited circle of investors, which do not subscribe to the shares with a view to distribution.
Australia
No prospectus or other disclosure document (as defined in the Corporations Act 2001 (Cth) of Australia ("Corporations Act")) in relation to the common stock has been or will be lodged with the Australian Securities & Investments Commission ("ASIC"). This document has not been lodged with ASIC and is only directed to certain categories of exempt persons. Accordingly, if you receive this document in Australia:
(a) you confirm and warrant that you are either:
(i) a "sophisticated investor" under section 708(8)(a) or (b) of the Corporations Act;
138
(ii) a "sophisticated investor" under section 708(8)(c) or (d) of the Corporations Act and that you have provided an accountant's certificate to us which complies with the requirements of section 708(8)(c)(i) or (ii) of the Corporations Act and related regulations before the offer has been made;
(iii) a person associated with the company under section 708(12) of the Corporations Act; or
(iv) a "professional investor" within the meaning of section 708(11)(a) or (b) of the Corporations Act,
and to the extent that you are unable to confirm or warrant that you are an exempt sophisticated investor, associated person or professional investor under the Corporations Act, any offer made to you under this document is void and incapable of acceptance; and
(b) you warrant and agree that you will not offer any of the common stock for resale in Australia within 12 months of that common stock being issued unless any such resale offer is exempt from the requirement to issue a disclosure document under section 708 of the Corporations Act.
Hong Kong
The common stock may not be offered or sold in Hong Kong, by means of any document, other than (a) to "professional investors" as defined in the Securities and Futures Ordinance (Cap. 571, Laws of Hong Kong) and any rules made under that Ordinance or (b) in other circumstances which do not result in the document being a "prospectus" as defined in the Companies Ordinance (Cap. 32, Laws of Hong Kong) or which do not constitute an offer to the public within the meaning of that Ordinance. No advertisement, invitation or document relating to the common stock may be issued or may be in the possession of any person for the purpose of the issue, whether in Hong Kong or elsewhere, which is directed at, or the contents of which are likely to be read by, the public in Hong Kong (except if permitted to do so under the laws of Hong Kong) other than with respect to the common stock which are intended to be disposed of only to persons outside Hong Kong or only to "professional investors" as defined in the Securities and Futures Ordinance (Cap. 571, Laws of Hong Kong) or any rules made under that Ordinance.
Japan
No securities registration statement ("SRS") has been filed under Article 4, Paragraph 1 of the Financial Instruments and Exchange Law of Japan (Law No. 25 of 1948, as amended) ("FIEL") in relation to the common stock. The shares of common stock are being offered in a private placement to "qualified institutional investors" (tekikaku-kikan-toshika) under Article 10 of the Cabinet Office Ordinance concerning Definitions provided in Article 2 of the FIEL (the Ministry of Finance Ordinance No. 14, as amended) ("QIIs"), under Article 2, Paragraph 3, Item 2 i of the FIEL. Any QII acquiring the shares of common stock in this offer may not transfer or resell those shares except to other QIIs.
Korea
The shares may not be offered, sold and delivered directly or indirectly, or offered or sold to any person for reoffering or resale, directly or indirectly, in Korea or to any resident of Korea except pursuant to the applicable laws and regulations of Korea, including the Korea Securities and Exchange Act and the Foreign Exchange Transaction Law and the decrees and regulations thereunder. The shares have not been registered with the Financial Services Commission of Korea for public offering in Korea. Furthermore, the shares may not be resold to Korean residents unless the purchaser of the shares
139
complies with all applicable regulatory requirements (including but not limited to government approval requirements under the Foreign Exchange Transaction Law and its subordinate decrees and regulations) in connection with the purchase of the shares.
Singapore
This prospectus has not been registered as a prospectus with the Monetary Authority of Singapore. Accordingly, this prospectus and any other document or material in connection with the offer or sale, or invitation for subscription or purchase, of the shares may not be circulated or distributed, nor may the shares be offered or sold, or be made the subject of an invitation for subscription or purchase, whether directly or indirectly, to persons in Singapore other than (i) to an institutional investor under Section 274 of the Securities and Future Act, Chapter 289 of Singapore (the "SFA"), (ii) to a "relevant person" as defined in Section 275(2) of the SFA, or any person pursuant to Section 275(1A), and in accordance with the conditions, specified in Section 275 of the SFA or (iii) otherwise pursuant to, and in accordance with the conditions of, any other applicable provision of the SFA.
Where the shares are subscribed and purchased under Section 275 of the SFA by a relevant person which is:
(a) a corporation (which is not an accredited investor (as defined in Section 4A of the SFA)) the sole business of which is to hold investments and the entire share capital of which is owned by one or more individuals, each of whom is an accredited investor; or
(b) a trust (where the trustee is not an accredited investor (as defined in Section 4A of the SFA)) whose sole whole purpose is to hold investments and each beneficiary is an accredited investor, shares, debentures and units of shares and debentures of that corporation or the beneficiaries' rights and interest (howsoever described) in that trust shall not be transferable within six months after that corporation or that trust has acquired the shares under Section 275 of the SFA except:
(i) to an institutional investor under Section 274 of the SFA or to a relevant person (as defined in Section 275(2) of the SFA) and in accordance with the conditions, specified in Section 275 of the SFA;
(ii) (in the case of a corporation) where the transfer arises from an offer referred to in Section 275(1A) of the SFA, or (in the case of a trust) where the transfer arises from an offer that is made on terms that such rights or interests are acquired at a consideration of not less than $200,000 (or its equivalent in a foreign currency) for each transaction, whether such amount is to be paid for in cash or by exchange of securities or other assets;
(iii) where no consideration is or will be given for the transfer; or
(iv) where the transfer is by operation of law.
By accepting this prospectus, the recipient hereof represents and warrants that he is entitled to receive it in accordance with the restrictions set forth above and agrees to be bound by limitations contained herein. Any failure to comply with these limitations may constitute a violation of law.
140
The validity of the issuance of the shares of common stock to be sold in this offering will be passed upon for us by Ropes & Gray LLP, Chicago, Illinois. Fulbright & Jaworski L.L.P., Houston, Texas, will act as counsel to the underwriters.
The audited financial statements and schedules of Mattress Firm Holding Corp. included in this prospectus and elsewhere in the registration statement of which this prospectus forms part have been so included in reliance upon the report of Grant Thornton LLP, independent registered public accountants, upon the authority of said firm as experts in accounting and auditing in giving said report.
The audited financial statements of MGHC Holding Corporation included in this prospectus have been so included in reliance upon the report of McGladrey LLP, independent registered public accountants, upon the authority of said firm as experts in accounting and auditing in giving said report.
WHERE YOU CAN FIND MORE INFORMATION
We have filed with the SEC a registration statement on Form S-1 under the Securities Act with respect to the shares of our common stock being offered by this prospectus. This prospectus, which forms a part of the registration statement, does not contain all of the information set forth in the registration statement. For further information with respect to us and the shares of our common stock, reference is made to the registration statement and the exhibits and schedules filed as a part thereof. Statements contained in this prospectus as to the contents of any contract or other document are not necessarily complete. We are subject to the informational requirements of the Securities Exchange Act and, in accordance therewith, we file reports and other information with the SEC. The registration statement, such reports and other information can be inspected and copied at the Public Reference Room of the SEC located at 100 F Street, N.E., Washington, D.C. 20549. Copies of such materials, including copies of all or any portion of the registration statement, can be obtained from the Public Reference Room of the SEC at prescribed rates. You can call the SEC at 1-800-SEC-0330 to obtain information on the operation of the Public Reference Room. Such materials may also be accessed electronically by means of the SEC's website at www.sec.gov.
141
INDEX TO CONSOLIDATED FINANCIAL STATEMENTS
F-1
REPORT OF INDEPENDENT REGISTERED PUBLIC ACCOUNTING FIRM
Board
of Directors and Stockholders
Mattress Firm Holding Corp.
We have audited the accompanying consolidated balance sheets of Mattress Firm Holding Corp. (a Delaware corporation) and subsidiaries (collectively, the "Company") as of February 1, 2011 and January 31, 2012 and the related consolidated statements of operations, stockholders' equity, and cash flows for each of the three fiscal years in the period ended January 31, 2012. Our audits of the basic financial statements included the financial statement schedules listed in the appendix appearing under Item 15. These financial statements and financial statement schedules are the responsibility of the Company's management. Our responsibility is to express an opinion on these financial statements and financial statement schedules based on our audits.
We conducted our audits in accordance with the standards of the Public Company Accounting Oversight Board (United States). Those standards require that we plan and perform the audit to obtain reasonable assurance about whether the financial statements are free of material misstatement. The Company is not required to have, nor were we engaged to perform an audit of its internal control over financial reporting. Our audit included consideration of internal control over financial reporting as a basis for designing audit procedures that are appropriate in the circumstances, but not for the purpose of expressing an opinion on the effectiveness of the Company's internal control over financial reporting. Accordingly, we express no such opinion. An audit also includes examining, on a test basis, evidence supporting the amounts and disclosures in the financial statements, assessing the accounting principles used and significant estimates made by management, as well as evaluating the overall financial statement presentation. We believe that our audits provide a reasonable basis for our opinion.
In our opinion, the consolidated financial statements referred to above present fairly, in all material respects, the financial position of Mattress Firm Holding Corp. and subsidiaries as of February 1, 2011 and January 31, 2012 and the results of their operations and their cash flows for each of the three fiscal years in the period ended January 31, 2012, in conformity with accounting principles generally accepted in the United States of America. Also, in our opinion, the related financial statement schedules, when considered in relation to the basic financial statements taken as a whole, present fairly, in all material respects, the information set forth therein.
/s/ GRANT THORNTON LLP
Houston, Texas
April 20, 2012
F-2
MATTRESS FIRM HOLDING CORP.
CONSOLIDATED BALANCE SHEETS
| |
February 1, 2011 | January 31, 2012 | July 31, 2012 | |||||||
|---|---|---|---|---|---|---|---|---|---|---|
| |
|
|
(unaudited) |
|||||||
| |
(in thousands, except share amounts) |
|||||||||
ASSETS |
||||||||||
Current assets: |
||||||||||
Cash and cash equivalents |
$ | 4,445 | $ | 47,946 | $ | 6,188 | ||||
Accounts receivable, net |
12,033 | 18,607 | 24,632 | |||||||
Inventories |
26,726 | 40,961 | 60,800 | |||||||
Deferred income taxes |
82 | 12,574 | 10,982 | |||||||
Prepaid expenses and other current assets |
10,746 | 12,054 | 16,227 | |||||||
Total current assets |
54,032 | 132,142 | 118,829 | |||||||
Property and equipment, net |
77,601 | 95,674 | 120,132 | |||||||
Intangible assets, net |
84,913 | 84,795 | 90,057 | |||||||
Goodwill |
287,379 | 291,141 | 331,769 | |||||||
Debt issue costs and other, net |
9,708 | 9,729 | 9,336 | |||||||
Total assets |
$ | 513,633 | $ | 613,481 | $ | 670,123 | ||||
LIABILITIES AND STOCKHOLDERS' EQUITY |
||||||||||
Current liabilities: |
||||||||||
Notes payable and current maturities of long-term debt |
$ | 6,255 | $ | 2,414 | $ | 1,805 | ||||
Accounts payable |
29,237 | 42,396 | 52,055 | |||||||
Accrued liabilities |
21,865 | 31,780 | 47,386 | |||||||
Customer deposits |
4,371 | 6,294 | 8,703 | |||||||
Total current liabilities |
61,728 | 82,884 | 109,949 | |||||||
Long-term debt, net of current maturities |
233,784 | 225,940 | 230,425 | |||||||
Long-term debt due to related parties |
158,664 | — | — | |||||||
Deferred income taxes |
29,960 | 31,045 | 27,726 | |||||||
Other noncurrent liabilities |
45,179 | 49,353 | 56,941 | |||||||
Total liabilities |
529,315 | 389,222 | 425,041 | |||||||
Commitments and contingencies (Note 10) |
||||||||||
Stockholders' equity: |
||||||||||
Common stock, $0.01 par value; 120,000,000 shares authorized; 22,399,952 shares issued and outstanding at February 1, 2011 and 33,768,828 shares issued and outstanding at January 31, 2012 and July 31, 2012 |
224 | 338 | 338 | |||||||
Additional paid-in capital |
156,241 | 361,717 | 362,719 | |||||||
Accumulated deficit |
(172,147 | ) | (137,796 | ) | (117,975 | ) | ||||
Total stockholders' (deficit) equity |
(15,682 | ) | 224,259 | 245,082 | ||||||
Total liabilities and stockholders' equity |
$ | 513,633 | $ | 613,481 | $ | 670,123 | ||||
The accompanying notes are an integral part of these consolidated financial statements.
F-3
MATTRESS FIRM HOLDING CORP.
CONSOLIDATED STATEMENTS OF OPERATIONS
| |
|
|
|
Twenty-Six Weeks Ended | ||||||||||||
|---|---|---|---|---|---|---|---|---|---|---|---|---|---|---|---|---|
| |
Fiscal 2009 |
Fiscal 2010 |
Fiscal 2011 |
August 2, 2011 |
July 31, 2012 |
|||||||||||
| |
|
|
|
(unaudited) |
||||||||||||
| |
(in thousands, except share and per share amounts) |
|||||||||||||||
Net sales |
$ | 432,250 | $ | 494,115 | $ | 703,910 | $ | 331,838 | $ | 471,832 | ||||||
Cost of sales |
280,506 | 313,962 | 428,018 | 205,227 | 287,126 | |||||||||||
Gross profit from retail operations |
151,744 | 180,153 | 275,892 | 126,611 | 184,706 | |||||||||||
Franchise fees and royalty income |
2,100 | 3,195 | 4,697 | 2,072 | 2,532 | |||||||||||
|
153,844 | 183,348 | 280,589 | 128,683 | 187,238 | |||||||||||
Operating expenses: |
||||||||||||||||
Sales and marketing expenses |
95,305 | 113,963 | 167,605 | 80,718 | 115,692 | |||||||||||
General and administrative expenses |
32,336 | 34,111 | 51,684 | 24,123 | 35,878 | |||||||||||
Goodwill impairment charge |
— | 536 | — | — | — | |||||||||||
Loss on store closings and impairment of store assets |
5,179 | 2,486 | 759 | 39 | 71 | |||||||||||
Total operating expenses |
132,820 | 151,096 | 220,048 | 104,880 | 151,641 | |||||||||||
Income from operations |
21,024 | 32,252 | 60,541 | 23,803 | 35,597 | |||||||||||
Other expense (income): |
||||||||||||||||
Interest income |
(12 | ) | (6 | ) | (9 | ) | (3 | ) | (1 | ) | ||||||
Interest expense |
27,126 | 31,063 | 29,310 | 16,949 | 4,289 | |||||||||||
Loss (gain) from debt extinguishment |
(2,822 | ) | — | 5,704 | 1,873 | — | ||||||||||
|
24,292 | 31,057 | 35,005 | 18,819 | 4,288 | |||||||||||
Income (loss) before income taxes |
(3,268 | ) | 1,195 | 25,536 | 4,984 | 31,309 | ||||||||||
Income tax expense (benefit) |
1,405 | 846 | (8,815 | ) | 319 | 11,488 | ||||||||||
Net income (loss) |
$ | (4,673 | ) | $ | 349 | $ | 34,351 | $ | 4,665 | $ | 19,821 | |||||
Basic net income per common share |
$ | (0.21 | ) | $ | 0.02 | $ | 1.40 | $ | 0.21 | $ | 0.59 | |||||
Diluted net income per common share |
$ | (0.21 | ) | $ | 0.02 | $ | 1.40 | $ | 0.21 | $ | 0.59 | |||||
Basic weighted average shares outstanding |
22,399,952 | 22,399,952 | 24,586,274 | 22,399,952 | 33,768,828 | |||||||||||
Diluted weighted average shares outstanding |
22,399,952 | 22,399,952 | 24,586,274 | 22,399,952 | 33,867,158 | |||||||||||
The accompanying notes are an integral part of these consolidated financial statements.
F-4
MATTRESS FIRM HOLDING CORP.
CONSOLIDATED STATEMENTS OF STOCKHOLDERS' EQUITY
| |
Common Stock | |
|
|
||||||||||||
|---|---|---|---|---|---|---|---|---|---|---|---|---|---|---|---|---|
| |
Additional Paid-in Capital | Accumulated Deficit | Total Stockholders' Equity (Deficit) | |||||||||||||
| |
Shares | Par Value | ||||||||||||||
| |
(in thousands, except share amounts) |
|||||||||||||||
Balances at February 3, 2009 |
22,399,952 | $ | 224 | $ | 156,518 | $ | (167,823 | ) | $ | (11,081 | ) | |||||
Stock-based compensation |
— | — | 84 | — | 84 | |||||||||||
Contributed capital |
— | — | 154 | — | 154 | |||||||||||
Net loss |
— | — | — | (4,673 | ) | (4,673 | ) | |||||||||
Balances at February 2, 2010 |
22,399,952 | 224 | 156,756 | (172,496 | ) | (15,516 | ) | |||||||||
Stock-based compensation |
— | — | (515 | ) | — | (515 | ) | |||||||||
Net income |
— | — | — | 349 | 349 | |||||||||||
Balances at February 1, 2011 |
22,399,952 | 224 | 156,241 | (172,147 | ) | (15,682 | ) | |||||||||
Issuance of common stock, net of costs |
6,388,888 | 64 | 110,382 | — | 110,446 | |||||||||||
Issuance of common stock upon conversion of PIK notes |
2,774,035 | 28 | 52,680 | — | 52,708 | |||||||||||
Issuance of common stock upon conversion of Convertible Notes |
2,205,953 | 22 | 41,891 | — | 41,913 | |||||||||||
Stock-based compensation |
— | — | 523 | — | 523 | |||||||||||
Net income |
— | — | — | 34,351 | 34,351 | |||||||||||
Balances at January 31, 2012 |
33,768,828 | 338 | 361,717 | (137,796 | ) | 224,259 | ||||||||||
Stock-based compensation (unaudited) |
— | — | 1,002 | — | 1,002 | |||||||||||
Net income (unaudited) |
— | — | — | 19,821 | 19,821 | |||||||||||
Balances at July 31, 2012 (unaudited) |
33,768,828 | $ | 338 | $ | 362,719 | $ | (117,975 | ) | $ | 245,082 | ||||||
The accompanying notes are an integral part of these consolidated financial statements.
F-5
MATTRESS FIRM HOLDING CORP.
CONSOLIDATED STATEMENTS OF CASH FLOWS
| |
|
|
|
Twenty-Six Weeks Ended | ||||||||||||
|---|---|---|---|---|---|---|---|---|---|---|---|---|---|---|---|---|
| |
Fiscal 2009 | Fiscal 2010 | Fiscal 2011 | August 2, 2011 | July 31, 2012 | |||||||||||
| |
|
|
|
(unaudited) |
||||||||||||
| |
(in thousands) |
|||||||||||||||
Cash flows from operating activities: |
||||||||||||||||
Net income (loss) |
$ | (4,673 | ) | $ | 349 | $ | 34,351 | $ | 4,665 | $ | 19,821 | |||||
Adjustments to reconcile net income (loss) to cash flows provided by operating activities: |
||||||||||||||||
Depreciation and amortization |
16,286 | 15,448 | 17,450 | 8,717 | 10,175 | |||||||||||
Interest expense accrued and paid-in-kind |
17,739 | 23,201 | 20,575 | 12,505 | — | |||||||||||
Loan fees and other amortization |
2,335 | 2,221 | 2,530 | 1,212 | 1,217 | |||||||||||
Loss (gain) from debt extinguishment |
(2,822 | ) | — | 5,704 | 1,873 | — | ||||||||||
Deferred income tax (benefit) expense |
(22 | ) | (118 | ) | (11,271 | ) | — | 4,261 | ||||||||
Stock-based compensation |
84 | (515 | ) | 523 | 39 | 1,002 | ||||||||||
Goodwill impairment charge |
— | 536 | — | — | — | |||||||||||
Loss (gain) on store closings and impairment of store assets |
4,095 | 1,034 | 324 | (134 | ) | 71 | ||||||||||
Effects of changes in operating assets and liabilities, excluding business acquisitions: |
||||||||||||||||
Accounts receivable |
3,306 | (6,028 | ) | (6,574 | ) | (1,481 | ) | (3,116 | ) | |||||||
Inventories |
(875 | ) | (2,056 | ) | (10,555 | ) | (4,908 | ) | (14,672 | ) | ||||||
Prepaid expenses and other current assets |
(938 | ) | (2,178 | ) | (1,306 | ) | 584 | (1,354 | ) | |||||||
Other assets |
(2,218 | ) | (2,773 | ) | (2,914 | ) | (1,726 | ) | 391 | |||||||
Accounts payable |
(12,602 | ) | 6,265 | 13,159 | 13,035 | 1,763 | ||||||||||
Accrued liabilities |
2,150 | 1,454 | 9,333 | 9,638 | 7,913 | |||||||||||
Customer deposits |
(28 | ) | 1,068 | 1,518 | 2,846 | 850 | ||||||||||
Other noncurrent liabilities |
(960 | ) | 4,521 | 8,828 | 1,890 | 1,774 | ||||||||||
Net cash provided by operating activities |
20,857 | 42,429 | 81,675 | 48,755 | 30,096 | |||||||||||
Cash flows from investing activities: |
||||||||||||||||
Purchases of property and equipment |
(10,863 | ) | (27,330 | ) | (34,356 | ) | (11,681 | ) | (31,667 | ) | ||||||
Business acquisitions, net of cash acquired |
— | (10,762 | ) | (7,958 | ) | (100 | ) | (43,984 | ) | |||||||
Net cash used in investing activities |
(10,863 | ) | (38,092 | ) | (42,314 | ) | (11,781 | ) | (75,651 | ) | ||||||
Cash flows from financing activities: |
||||||||||||||||
Proceeds from issuance of debt |
24,191 | 2,985 | 40,198 | 40,198 | 15,000 | |||||||||||
Principal payments of debt |
(33,537 | ) | (3,271 | ) | (145,231 | ) | (50,686 | ) | (11,203 | ) | ||||||
Proceeds from issuance of common stock, net of costs |
— | — | 110,446 | — | — | |||||||||||
Debt issuance costs |
(1,001 | ) | — | (1,273 | ) | (1,273 | ) | — | ||||||||
Net cash provided by (used in) financing activities |
(10,347 | ) | (286 | ) | 4,140 | (11,761 | ) | 3,797 | ||||||||
Net increase (decrease) in cash and cash equivalents |
(353 | ) | 4,051 | 43,501 | 25,213 | (41,758 | ) | |||||||||
Cash and cash equivalents, beginning of period |
747 | 394 | 4,445 | 4,445 | 47,946 | |||||||||||
Cash and cash equivalents, end of period |
$ | 394 | $ | 4,445 | $ | 47,946 | $ | 29,658 | $ | 6,188 | ||||||
The accompanying notes are an integral part of these consolidated financial statements.
F-6
MATTRESS FIRM HOLDING CORP.
NOTES TO CONSOLIDATED FINANCIAL STATEMENTS
1. Business and Summary of Significant Accounting Policies
Business—Mattress Firm Holding Corp., through its wholly owned subsidiaries, is engaged in the retail sale of mattresses and bedding-related products in various metropolitan markets in the United States through company-operated and franchisee-owned mattress specialty stores that operate primarily under the name Mattress Firm. Mattress Firm Holding Corp. conducts its operations through its indirect, wholly owned subsidiary, Mattress Holding Corp. and its subsidiaries (collectively "Mattress Holding"). Mattress Firm Holding Corp. and Mattress Holding are referred to collectively as the "Company" or "Mattress Firm."
Initial Public Offering—On November 23, 2011, the Company completed the initial public offering of 6,388,888 shares of its common stock at a public offering price of $19.00 per share pursuant to a registration statement on Form S-1, as amended (File No. 333-174830), which was declared effective on November 17, 2011. The Company raised a total of $121.4 million in gross proceeds in the initial public offering or approximately $110.4 million in net proceeds after deducting underwriting discounts and commissions of $8.5 million and $2.5 million of offering-related costs.
On November 23, 2011, the Company used a portion of the net proceeds from the initial public offering as follows: (i) $88.8 million to repay in full all amounts outstanding under the 2009 Loan Facility (see Note 5); (ii) $4.6 million to repay in full the Company's PIK Notes that did not convert into shares of the Company's common stock upon the completion of the initial public offering (see Note 5); and (iii) $1.6 million to pay accrued management fees and interest thereon and a related termination fee to J.W. Childs Associates, L.P. in connection with the termination of the management agreement between J.W. Childs Associates, L.P. and the Company that became effective with the completion of the initial public offering. The remaining net proceeds after payment of other estimated costs associated with the initial public offering, were retained by the Company for working capital and general corporate purposes.
Furthermore, in connection with the consummation of the initial public offering, (i) Convertible Notes with an aggregate principal and accrued interest balance of $41.9 million were converted into 2,205,953 shares the Company's common stock at a price per share equal to the initial public offering price, and (ii) the PIK Notes that were not repaid with net proceeds from the initial public offering, with an aggregate principal and accrued interest balance of $52.7 million, were converted into 2,774,035 shares of the Company's common stock at a price per share equal to the initial public offering price (see Note 5).
Ownership—Mattress Holdings, LLC owns 22.4 million shares of the Company's common stock and is the majority stockholder. Prior to the initial public offering, the Company was a wholly-owned subsidiary of Mattress Holdings, LLC. Mattress Holdings, LLC is majority owned by JWC Mattress Holdings, LLC, a limited liability company managed by J.W. Childs Associates, Inc. ("J.W. Childs"), and has various minority owners including certain members of the Company's management (together with J.W. Childs, the "Equity Owners"). Certain of the Equity Owners also own 5.0 million shares of the Company's common stock through the conversion of Convertible Notes and PIK Notes in connection with the initial public offering.
Basis of Presentation—The accompanying financial statements present the consolidated balance sheets, statements of operations, stockholders' equity and cash flows of the Company. All significant intercompany accounts and transactions have been eliminated.
F-7
MATTRESS FIRM HOLDING CORP.
NOTES TO CONSOLIDATED FINANCIAL STATEMENTS (Continued)
1. Business and Summary of Significant Accounting Policies (Continued)
Fiscal Year—The Company's fiscal year consists of 52 or 53 weeks ending on the Tuesday closest to January 31. Each of the fiscal years ended February 2, 2010 ("Fiscal 2009"), February 1, 2011 ("Fiscal 2010") and January 31, 2012 ("Fiscal 2011) consisted of 52 weeks.
Unaudited Interim Financial Information—The accompanying consolidated balance sheet as of July 31, 2012, the consolidated statements of operations and cash flows for the twenty-six weeks ended August 2, 2011 and July 31, 2012 and the consolidated statement of stockholders' equity for the twenty-six weeks ended July 31, 2012 are unaudited. The unaudited interim financial statements have been prepared on the same basis as the annual consolidated financial statements and, in the opinion of management, reflect all adjustments, which include only normal recurring adjustments, necessary to present fairly the Company's financial position and results of operations and cash flows for the twenty-six weeks ended August 2, 2011 and July 31, 2012. The financial data and the other information disclosed in these notes to the consolidated financial statements related to these twenty-six week periods are unaudited. The results of the twenty-six weeks ended July 31, 2012 are not necessarily indicative of the results to be expected for the fiscal year ending January 29, 2013 or for any other interim period or other future year.
Accounting Estimates—The preparation of financial statements in conformity with U.S. GAAP requires management to make estimates and assumptions that affect the reported amounts of assets and liabilities and disclosure of contingent assets and liabilities at the date of the financial statements and the reported amounts of revenues and expenses during the reporting period. Actual results could differ from those estimates. Estimates that are more susceptible to change in the near term are the accruals for sales returns and exchanges, product warranty costs, impairment and store closing costs.
Fair Value Measures—The amounts reported in the consolidated balance sheets for cash and cash equivalents, accounts receivable, accounts payable and accrued liabilities approximate their respective fair values because of the short-term maturity of these instruments. The table below summarizes the estimated fair values and respective carrying values of the Company's 2007 Senior Credit Facility (exclusive of the revolver), 2009 Loan Facility and PIK Notes as of February 1, 2011, January 31, 2012 and July 31, 2012 (amounts in millions):
| |
February 1, 2011 | January 31, 2012 | July 31, 2012 | ||||||||||||||||
|---|---|---|---|---|---|---|---|---|---|---|---|---|---|---|---|---|---|---|---|
| |
Estimated Fair Value |
Carrying Value |
Estimated Fair Value |
Carrying Value |
Estimated Fair Value |
Carrying Value |
|||||||||||||
Senior Credit Facility |
$ | 212.3 | $ | 230.7 | $ | 223.0 | $ | 228.3 | $ | 224.1 | $ | 227.2 | |||||||
2009 Loan Facility |
$ | 151.5 | $ | 109.8 | $ | — | $ | — | $ | — | $ | — | |||||||
PIK Notes |
$ | 62.7 | $ | 48.9 | $ | — | $ | — | $ | — | $ | — | |||||||
The fair value of the 2007 Senior Credit Facility was estimated based on the ask and bid prices quoted from an external source. The fair values of the 2009 Loan Facility, the PIK Notes and the Convertible Notes were estimated using an income approach based on the discounted future cash flows of the debt instruments. The fair value estimates have been affected by the general economic conditions and corresponding effects on the credit markets that have occurred over the past three years. The carrying amounts of other debt instruments at fixed rates approximated their respective fair values due to the comparability of interest rates for the same or similar issues that are available. The Financial Accounting Standards Board ("FASB") has issued guidance on the definition of fair value, the framework for using fair value to measure assets and liabilities, and disclosure about fair value
F-8
MATTRESS FIRM HOLDING CORP.
NOTES TO CONSOLIDATED FINANCIAL STATEMENTS (Continued)
1. Business and Summary of Significant Accounting Policies (Continued)
measurements. The guidance establishes a three-tier fair value hierarchy, which prioritizes the inputs used to measure fair value. These tiers include:
- •
- Level 1: Defined as observable inputs such as quoted prices in active markets for identical assets or liabilities
as of the reporting date. Active markets are those in which transactions for the asset or liability occur in sufficient frequency and volume to provide pricing information on an ongoing basis.
- •
- Level 2: Defined as pricing inputs other than quoted prices in active markets included in Level 1, which are
either directly or indirectly observable as of the reporting date. Level 2 includes those financial instruments that are valued using models or other valuation methodologies. These models are
primarily industry-standard models that consider various assumptions, including quoted forward prices for commodities, time value, volatility factors and current market and contractual prices for the
underlying instruments, as well as other relevant economic measures.
- •
- Level 3: Defined as pricing inputs that are unobservable from objective sources. These inputs may be used with internally developed methodologies that result in management's best estimate of fair value.
The Company measures its nonqualified deferred compensation plan on a recurring basis. The plan's assets are valued based on the marketable securities tied to the plan. Additionally, the Company measures goodwill, intangible assets, and property and equipment on a nonrecurring basis, if step 1 of the impairment tests fail. Property and equipment fair value is based on estimated cash flows. Estimated cash flows are primarily based on projected revenues, operating costs and maintenance capital expenditures of individual stores and are discounted based on comparable industry average rates for weighted average cost of capital.
Assets requiring recurring or non-recurring fair value measurements as previously described consisted of the following (amounts in thousands):
| |
|
Fair Value Measurements | |
|||||||||||||
|---|---|---|---|---|---|---|---|---|---|---|---|---|---|---|---|---|
| |
Net Book Value as of Feb. 1, 2011 |
Fiscal 2010 Impairments |
||||||||||||||
| |
Level 1 | Level 2 | Level 3 | |||||||||||||
Nonqualified deferred compensation plan (Note 13) |
$ | 1,116 | $ | — | $ | 1,116 | $ | — | $ | — | ||||||
Goodwill requiring impairment (Note 4) |
$ | 2,610 | $ | — | $ | — | $ | 2,610 | $ | 536 | ||||||
Property and equipment requiring impairment (Note 3) |
$ | 290 | $ | — | $ | — | $ | 290 | $ | 1,723 | ||||||
| |
|
Fair Value Measurements | |
|||||||||||||
|---|---|---|---|---|---|---|---|---|---|---|---|---|---|---|---|---|
| |
Net Book Value as of Jan. 31, 2012 |
Fiscal 2011 Impairments |
||||||||||||||
| |
Level 1 | Level 2 | Level 3 | |||||||||||||
Nonqualified deferred compensation plan (Note 13) |
$ | 882 | $ | — | $ | 882 | $ | — | $ | — | ||||||
Property and equipment requiring impairment (Note 3) |
$ | 246 | $ | — | $ | — | $ | 246 | $ | 134 | ||||||
F-9
MATTRESS FIRM HOLDING CORP.
NOTES TO CONSOLIDATED FINANCIAL STATEMENTS (Continued)
1. Business and Summary of Significant Accounting Policies (Continued)
| |
|
Fair Value Measurements | |
|||||||||||||
|---|---|---|---|---|---|---|---|---|---|---|---|---|---|---|---|---|
| |
Net Book Value as of July 31, 2012 |
Fiscal 2011 Impairments |
||||||||||||||
| |
Level 1 | Level 2 | Level 3 | |||||||||||||
Nonqualified deferred compensation plan (Note 13) |
$ | 1,029 | $ | — | $ | 1,029 | $ | — | $ | — | ||||||
Net Sales—Sales revenue, including fees collected for delivery services, is recognized upon delivery and acceptance of mattresses and bedding products by the Company's customers and is recorded net of estimated returns. Customer deposits collected prior to the delivery of merchandise are recorded as a liability. Net sales are recognized net of sales tax collected from customers and remitted to various taxing jurisdictions.
Cost of Sales, Sales and Marketing and General and Administrative Expense—The following summarizes the primary costs classified in each major expense category (the classification of which may vary within our industry).
Cost of sales:
- •
- Costs associated with purchasing and delivering our products to our stores and customers, net of vendor incentives earned
on the purchase of products;
- •
- Physical inventory losses;
- •
- Store and warehouse occupancy and depreciation expense of related facilities and equipment;
- •
- Store and warehouse operating costs, including warehouse labor costs and utilities, repairs and maintenance and supplies
costs of warehouse and store facilities; and
- •
- Estimated costs to provide for customer returns and exchanges and to service customer warranty claims.
Sales and marketing expenses:
- •
- Advertising and media production;
- •
- Payroll and benefits for sales associates; and
- •
- Merchant service fees for customer credit and debit card payments, check guarantee fees and promotional financing expense.
General and administrative expenses:
- •
- Payroll and benefit costs for corporate office and regional management employees;
- •
- Stock-based compensation costs;
- •
- Occupancy costs of corporate facility;
- •
- Information systems hardware, software and maintenance;
- •
- Depreciation related to corporate assets;
- •
- Management fees;
F-10
MATTRESS FIRM HOLDING CORP.
NOTES TO CONSOLIDATED FINANCIAL STATEMENTS (Continued)
1. Business and Summary of Significant Accounting Policies (Continued)
- •
- Insurance; and
- •
- Other overhead costs.
Vendor Incentives—Cash payments received from vendors as incentives to enter into or to maintain long-term supply arrangements, including new store funds described in the following paragraph, are deferred and amortized as a reduction of cost of sales using a systematic approach. Vendor incentives that are based on a percentage of the cost of purchased merchandise, such as cooperative advertising funds, are accounted for as a reduction of the price of the vendor's products and result in a reduction of cost of sales when the merchandise is sold. Certain vendor arrangements provide for volume-based incentives that require minimum purchase volumes and may provide for increased incentives when graduated purchase volumes are met. The recognition of earned incentives that vary based on purchase levels includes the effect of estimates of the Company's purchases of the vendor's products and may result in adjustments in subsequent periods if actual purchase volumes deviate from the estimates. Vendor incentives that are direct reimbursements of costs incurred by the Company to sell the vendor's products are accounted for as a reduction of the related costs when recognized in the Company's results of operations. From time to time, certain vendors provide funds to the Company to advertise their products. The Company recognized $0.9 million, $3.7 million and $3.9 million as a reduction to sales and marketing expense during Fiscal 2009, Fiscal 2010 and Fiscal 2011, respectively, and $1.5 million and $2.4 million during the twenty-six weeks ended August 2, 2011 and July 31, 2012, respectively, related to such direct vendor advertising funds.
The Company receives cash funds from certain vendors upon the opening of a new store ("new store funds") if the opening results in an increase in the total number of stores in operation. Under the Company's current supply arrangements, it is obligated to repay a portion of new store funds if an arrangement is terminated early. The Company classifies new store funds as a noncurrent liability and recognizes a pro-rata portion in the results of operations over 36 months.
Sales Returns and Exchanges—The Company accrues a liability for estimated costs of sales returns and exchanges in the period that the related sales are recognized. The Company provides its customers with a comfort satisfaction guarantee whereby the customer may receive a refund or exchange the original mattress for a replacement of equal or similar quality for a period of up to 100 days after the original purchase. Mattresses received back under this policy are reconditioned pursuant to state laws and resold through the Company's clearance center stores as used merchandise. The Company accrues a liability for the estimated costs related to the revaluation of the returned merchandise to the lower of cost or market, net of anticipated exchange fees charged to the customer, at the time the sale is recorded based upon historical experience. In August 2010, the Company revised its general exchange policy to eliminate the majority of exchange fees previously charged to a customer, which has resulted in a higher estimate of future exchange costs. The Company regularly assesses and adjusts the estimated liability by updating claims rates for actual trends and projected claim costs. A revision of estimated claim rates and claim costs or revisions to the Company's exchange policies may have a material adverse effect on future results of operations.
F-11
MATTRESS FIRM HOLDING CORP.
NOTES TO CONSOLIDATED FINANCIAL STATEMENTS (Continued)
1. Business and Summary of Significant Accounting Policies (Continued)
Activity with respect to the liability for sales returns and exchanges, included in other accrued liabilities, was as follows (amounts in thousands):
| |
Fiscal 2010 |
Fiscal 2011 |
|||||
|---|---|---|---|---|---|---|---|
Balance at beginning of period |
$ | 68 | $ | 513 | |||
Sales return and exchange provision |
1,613 | 3,651 | |||||
Sales return and exchange claims |
(1,168 | ) | (3,085 | ) | |||
Balance at end of period |
$ | 513 | $ | 1,079 | |||
Product Warranties—The Company provides a 10-year non-prorated manufacturer warranty service period ("basic warranty"), and an additional five-year warranty ("extended warranty") on certain mattress products. The customer is not charged a fee for warranty coverage and the Company is financially responsible for the basic and the extended warranties on these mattress products. Other mattress products have warranties provided by the manufacturer directly to the customer. The Company accrues for the estimated cost of warranty coverage at the time the sale is recorded. In estimating the liability for product warranties, the Company considers the impact of recoverable salvage value on product received back under warranty. Based upon the Company's historical warranty claim experience, as well as recent trends that might suggest that past experience may differ from future claims, management periodically reviews and adjusts, if necessary, the liability for product warranties. Activity with respect to the liability for product warranties was as follows (amounts in thousands):
| |
Fiscal 2009 |
Fiscal 2010 |
Fiscal 2011 |
|||||||
|---|---|---|---|---|---|---|---|---|---|---|
Balance at beginning of period |
$ | 1,706 | $ | 1,802 | $ | 2,063 | ||||
Warranty provision |
899 | 1,265 | 2,238 | |||||||
Warranty claims |
(803 | ) | (1,004 | ) | (1,535 | ) | ||||
Balance at end of period |
1,802 | 2,063 | 2,766 | |||||||
Less: Current portion included in accrued liabilities |
648 | 783 | 1,285 | |||||||
Noncurrent portion included in other liabilities |
$ | 1,154 | $ | 1,280 | $ | 1,481 | ||||
Franchise Fees and Royalty Income—The Company has granted franchise rights to private operators for a term of 20 or 30 years on a market-by-market basis. The Company provides standard operating procedure manuals, the right to use systems and trademarks, assistance in site locations of stores and warehouses, training and support services, advertising materials and management and accounting software to its franchisees. The Company is entitled to a nonrefundable initial franchise fee that is recognized in income when all material services have been substantially performed, which is upon the opening of a new store. In addition, the Company earns ongoing royalties based on a percentage of gross franchisee sales, payable twice a month, which are recognized in income during the period sales are recognized by the franchisees.
The Company evaluates the credentials, business plans and the financial strength of potential franchisees before entering into franchise agreements and before extending credit terms for franchise fee and royalty payments. Concentrations of credit risk with respect to accounts receivable with franchisees after considering existing allowances for doubtful accounts, are considered by management
F-12
MATTRESS FIRM HOLDING CORP.
NOTES TO CONSOLIDATED FINANCIAL STATEMENTS (Continued)
1. Business and Summary of Significant Accounting Policies (Continued)
to be limited as a result of the small size of the franchisee network relative to company-operated stores and the years of experience with the current franchisee owners. The Company has the right, under the terms of its franchise agreements, to assume the operations of franchisees that do not comply with the conditions of the franchise agreement, including a default on the payments owed to the Company. In such instances, the assumption may involve purchase consideration in the form of cash and the assumption of certain franchisee obligations, including obligations to the Company. Based upon collection experience with existing franchisees allowance for doubtful accounts was $0 and $12,000 as of February 1, 2011 and January 31, 2012, respectively.
Pre-opening Expense—Store pre-opening expenses, which consist primarily of occupancy costs, are expensed as incurred.
Advertising and Media Production Expense—The Company incurs advertising costs associated with print and broadcast advertisements. Such costs are expensed as incurred except for media production costs, which are deferred and charged to expense in the period that the advertisement initially airs. Advertising and media production expense, net of direct funds received from certain vendors, was $29.4 million, $39.1 million, and $60.2 million for Fiscal 2009, Fiscal 2010 and Fiscal 2011, respectively and $30.7 million and $43.0 million during the twenty-six weeks ended August 2, 2011 and July 31, 2012, respectively.
Income Taxes—Deferred tax assets and liabilities are reflected on the balance sheet for temporary differences between the amount of assets and liabilities for financial and tax reporting purposes that will reverse in subsequent years. Deferred tax assets and liabilities are measured using tax rates expected to apply to taxable income in the years in which those temporary differences are estimated to be recovered or settled. The effect on deferred tax assets and liabilities of a change in the tax rate is recognized in income or expense in the period that the change is effective. Valuation allowances are established when necessary to reduce deferred tax assets to the amounts that are more likely than not to be realized.
The Company calculates its current deferred tax provision based on estimates and assumptions that could differ from the actual results reflected in income tax returns filed in subsequent years. Adjustments based on filed returns are recorded when identified.
The amount of income taxes the Company pays is subject to ongoing audits by federal and state tax authorities. Reserves are provided for potential exposures when it is considered more-likely-than-not that a taxing authority may take a sustainable position on a matter contrary to the Company's position. The Company evaluates these reserves, including interest thereon, on a periodic basis to ensure that they have been appropriately adjusted for events, including audit settlements that may impact the ultimate payment for such exposure. To the extent that the Company's assessment of such tax positions changes, the change in estimate is recorded in the period in which the determination is made. The Company reports tax-related interest and penalties as a component of income tax expense.
Stock Based Compensation—The Company measures compensation cost with respect to equity instruments granted as share-based payments to employees based upon the estimated fair value of the equity instruments at the date of the grant. The cost as measured is recognized as expense over the period during which an employee is required to provide services in exchange for the award, or to their
F-13
MATTRESS FIRM HOLDING CORP.
NOTES TO CONSOLIDATED FINANCIAL STATEMENTS (Continued)
1. Business and Summary of Significant Accounting Policies (Continued)
eligible retirement date, if earlier. The benefit of tax deductions in excess of recognized compensation expense, if any, is reported as a financing cash flow in the Statement of Cash Flows.
The Company follows the SEC's Staff Accounting Bulletin No. 107 "Share-Based Payment" ("SAB 107"), as amended by Staff Accounting Bulletin No. 110 ("SAB 110"), which provides supplemental application guidance based on the views of the SEC. The Company estimates the expected term of the stock options, which represents the period of time from the grant date that the Company expects its stock options to remain outstanding, using the simplified method as permitted by SAB 107 and SAB 110. The Company applies the simplified method because it does not have sufficient historical exercise data to provide a reasonable basis upon which to estimate the expected terms due to the limited period of time its equity shares have been publicly traded.
Cash and Cash Equivalents—Cash and cash equivalents include cash and highly liquid investments that are readily convertible into cash and have maturities of three months or less when purchased. In addition, cash equivalents include sales proceeds in the course of settlement from credit card merchant service providers, which typically convert to cash within three days of the sales transaction.
Accounts Receivable—Accounts receivable are recorded net of an allowance for expected losses.
The Company offers financing to customers by utilizing the services of independent, third party finance companies that extend credit directly to the Company's customers with no recourse to the Company for credit related losses. The finance companies have the discretion to establish and revise the credit criteria used in evaluating whether to extend financing to the Company's customers. Accounts receivable include sales proceeds of financed sales, net of related fees, which are in the course of funding by the finance companies. The Company reviews the financial condition of its finance providers and has experienced only minimal losses on the collection of accounts receivables. Accounts receivable from finance companies are recorded net of an allowance for expected losses of approximately $104,000 and $97,000 as of February 1, 2011 and January 31, 2012, respectively. The remaining receivables are periodically evaluated for collectability and an allowance is established based on historical collection trends and write-off history as appropriate.
Accounts receivable consists of the following (amounts in thousands):
| |
February 1, 2011 |
January 31, 2012 |
|||||
|---|---|---|---|---|---|---|---|
Vendor incentives |
$ | 6,370 | $ | 11,054 | |||
Finance companies |
2,247 | 4,106 | |||||
Tenant improvement allowances |
2,346 | 2,068 | |||||
Franchisees and other |
1,070 | 1,379 | |||||
|
$ | 12,033 | $ | 18,607 | |||
Inventories—Our inventories consist of finished goods inventories of mattresses and other products, including finished goods that are for showroom display in the Company's stores. Inventories are valued at the lower of cost or market. Cost is determined by the first-in, first-out method and consists primarily of the purchase price paid to vendors, as adjusted to include the effect of vendor incentives that are based on a percentage of the cost of purchased merchandise. The Company does not purchase or hold inventories on behalf of franchisees.
F-14
MATTRESS FIRM HOLDING CORP.
NOTES TO CONSOLIDATED FINANCIAL STATEMENTS (Continued)
1. Business and Summary of Significant Accounting Policies (Continued)
Property and Equipment—Property and equipment are stated at cost less accumulated depreciation. Improvements to leased property are amortized over the shorter of their estimated useful lives or lease periods (including expected renewal periods). Repairs and maintenance are expensed as incurred. Expenditures which extend asset useful lives are capitalized. Depreciation is provided on the straight-line method at rates based on the estimated useful lives of individual assets or classes of assets as follows:
| |
Years | |||
|---|---|---|---|---|
Buildings |
30 | |||
Equipment, computers and software |
3 - 5 | |||
Furniture and fixtures |
7 | |||
Store signs |
7 | |||
Vehicles |
5 | |||
The Company capitalizes costs of software developed or obtained for internal use in accordance with U.S. GAAP. Once the capitalization criteria have been met, external direct costs of materials and services used in development of internal-use software, payroll and payroll related costs for employees directly involved in the development of internal-use software and interest costs incurred when developing software for internal use are capitalized. These capitalized costs are amortized over the useful life of the software on a straight-line basis.
The cost and accumulated depreciation of assets sold or otherwise disposed of are removed from the accounts and any gain or loss thereon is included in the results of operations.
The Company considers future asset retirement obligations, if such obligations can be reasonably estimated, at the time an asset is acquired or constructed with a corresponding increase in the cost basis of the asset. The Company has minimal conditional obligations with respect to the termination and abandonment of leased locations and the estimated fair value is immaterial.
The Company reviews long-lived assets for impairment when events or changes in circumstances indicate the carrying value of these assets may exceed their current fair values. The investments in store leasehold costs and related equipment represent the Company's most significant long-lived assets. The Company evaluates store-level results to determine whether projected future cash flows over the remaining lease terms are sufficient to recover the carrying value of the fixed asset investment in each individual store. If projected future cash flows are less than the carrying value of the fixed asset investment, an impairment charge is recognized to the extent that the fair value, as determined by discounted cash flows or appraisals, is less than the carrying value of such assets. The carrying value of leasehold improvements as well as certain other property and equipment are subject to impairment write-downs as a result of such evaluation. After an impairment loss is recognized, the adjusted carrying amount of the asset group establishes the new accounting basis. As further described in Note 3, the Company has recognized impairment losses during Fiscal 2009, Fiscal 2010 and Fiscal 2011.
Goodwill and Intangible Assets—Assets acquired and liabilities assumed in a business acquisition are recorded at fair value on the date of the acquisition. Purchase consideration in excess of the aggregate fair value of acquired net assets is allocated to identifiable intangible assets, to the extent of their fair value, and any remaining excess purchase consideration is allocated to goodwill. The total amount of goodwill arising from an acquisition may be assigned to one or more reporting units in
F-15
MATTRESS FIRM HOLDING CORP.
NOTES TO CONSOLIDATED FINANCIAL STATEMENTS (Continued)
1. Business and Summary of Significant Accounting Policies (Continued)
situations where the acquired business consists of specialty mattress retail operations in multiple metropolitan markets or when other reporting units are expected to benefit from synergies of the combination. The method of assigning goodwill to reporting units shall be reasonable and supportable and applied in a consistent manner and may involve estimates and assumptions. As described in Note 2, the Company has recognized goodwill and acquired intangible assets as a result of business acquisitions.
The Company tests goodwill and other indefinite lived intangible assets for impairment annually and when events and circumstances indicate that the carrying value of these assets may exceed their current fair values. The Company assigns the carrying value of these intangible assets to its "reporting units" and applies the test for goodwill at the reporting unit level. A reporting unit is defined as an operating segment or one level below a segment (a "component") if the component is a business and discrete information is prepared and reviewed regularly by segment management. Each of the Company's metropolitan markets is an operating segment. The store unit components that comprise each operating segment are aggregated into a reporting unit on the basis that all stores have similar economic characteristics. All of the Company's goodwill has been allocated to its metropolitan market reporting units for impairment testing. The test for goodwill impairment involves a qualitative evaluation as to whether or not it is more likely than not that the fair value of a reporting unit is less than its carrying value using an assessment of relevant events and circumstances. If any reporting unit is concluded to be more likely impaired than not the following steps are performed for such reporting unit: (1) comparing the fair value of a reporting unit with the carrying value of its net assets and (2) if the carrying value exceeds fair value, the fair value of goodwill is compared with the respective carrying value and an impairment loss is recognized in the amount of the excess. The impairment test for indefinite lived assets consists of a comparison of the fair value of the asset with its carrying amount. If the carrying amount of an intangible asset exceeds its fair value, an impairment loss is recognized in an amount equal to that excess. After an impairment loss is recognized, the adjusted carrying amount of the asset establishes the new accounting basis. As further described in Note 4, the Company recognized a goodwill impairment loss during Fiscal 2010.
Debt Issue Costs and Other Assets—Significant components of other assets include debt issue costs, lease deposits and other assets. Debt issue costs are amortized to interest expense over the term of the related debt instruments. Other assets are amortized over their estimated useful lives. Debt issue costs and other assets are stated net of accumulated amortization of $7.6 million, $9.5 million and $11.0 million at February 1, 2011, January 31, 2012 and July 31, 2012, respectively.
Deferred Lease Liabilities—Rent expense is recognized on a straight-line basis over the lease term (including expected renewal periods), after consideration of rent escalations, rent holidays and up-front payments or rent allowances provided by landlords as incentives to enter into lease agreements. The start of the lease term for the purposes of the calculation is the earlier of the lease commencement date or the date the Company takes possession of the property. A deferred lease liability is recognized for the cumulative difference between rental payments and straight-line rent expense. Deferred lease liabilities are a component of other noncurrent liabilities.
Reportable Segments—The Company's operations consist primarily of the retail sale of mattresses and bedding-related products in various metropolitan areas in the United States through company-operated and franchisee-operated mattress specialty stores that operate under the name Mattress Firm. The Company also generates sales through its website and special events primarily to customers who
F-16
MATTRESS FIRM HOLDING CORP.
NOTES TO CONSOLIDATED FINANCIAL STATEMENTS (Continued)
1. Business and Summary of Significant Accounting Policies (Continued)
reside in the metropolitan markets in which company-operated stores are located. The Company's chief operating decision maker reviews the aggregated results of company-operated stores at the metropolitan market level, including market-level cost data, consisting primarily of advertising, warehousing and overhead expenses that are directly incurred, managed and reported at the market level. Management focuses on improving the profitability at the market level and, therefore, each company-operated metropolitan market is an operating segment. The company-operated market, website and special events business segments are aggregated into a single reportable segment ("retail segment") as a result of the similar nature of the products sold and other similar economic characteristics that are expected to continue into future periods. Furthermore, the Company generates franchise fees and royalty income from the operation of franchisee-operated Mattress Firm stores in metropolitan markets in which the Company does not operate. Franchise operations are a separate reportable segment, for which the results of operations, as viewed by management, are fully represented by the franchise fees and royalty income reported on the face of the statements of operations because costs associated with the franchise business are not distinguished from other cost data viewed by management. The Company's assets are used primarily in the operation of its retail segment and the assets directly attributed to the franchise operations are not separately disclosed because they are not material.
The Company's total net sales are generated from three major categories of products, consisting of (1) conventional mattresses which utilize steel-coil innersprings, (2) specialty mattresses which utilize materials other than steel-coil innersprings and (3) furniture and accessories which include headboards and footboards, bed frames, mattress pads and pillows, and from delivery service revenues. The following table represents the components of our total net sales (amounts in thousands):
| |
|
|
|
Twenty-Six Weeks Ended | ||||||||||||
|---|---|---|---|---|---|---|---|---|---|---|---|---|---|---|---|---|
| |
Fiscal 2009 |
Fiscal 2010 |
Fiscal 2011 |
August 2, 2011 |
July 31, 2012 |
|||||||||||
Conventional mattresses |
$ | 258,069 | $ | 288,058 | $ | 323,461 | $ | 163,193 | $ | 197,844 | ||||||
Specialty mattresses |
134,813 | 160,281 | 318,868 | 139,081 | 233,927 | |||||||||||
Furniture and accessories |
29,282 | 33,905 | 46,367 | 22,201 | 31,252 | |||||||||||
Total product sales |
422,164 | 482,244 | 688,696 | 324,475 | 463,023 | |||||||||||
Delivery service revenues |
10,086 | 11,871 | 15,214 | 7,363 | 8,809 | |||||||||||
Total net sales |
$ | 432,250 | $ | 494,115 | $ | 703,910 | $ | 331,838 | $ | 471,832 | ||||||
Prior-year components of the Company's total net sales have been reclassified between specialty mattresses and conventional mattresses in a manner consistent with the current-year presentation.
New Accounting Standards Adopted in this Report—In December 2010, the FASB issued new guidance that modifies Step 1 of the impairment test for goodwill for reporting units with zero or negative carrying amounts. For those reporting units, an entity is required to perform Step 2 of the goodwill impairment test if it is more likely than not that a goodwill impairment exists. In evaluating whether it is more likely than not that a goodwill impairment exists, an entity should consider whether there are any adverse qualitative factors indicating that an impairment may exist. The Company adopted the provisions of this new guidance on February 2, 2011 and it did not have a material impact on the Company's financial position, results of operations, or cash flows.
F-17
MATTRESS FIRM HOLDING CORP.
NOTES TO CONSOLIDATED FINANCIAL STATEMENTS (Continued)
1. Business and Summary of Significant Accounting Policies (Continued)
In December 2010, the FASB issued new guidance regarding the disclosure requirements related to supplementary pro forma financial information about business combinations. For entities that enter into business combinations that are material, either individually or in the aggregate, the revised guidance requires that public entities disclose the revenue and earnings of the combined entity as if the business combination(s) that occurred during the current year had occurred as of the beginning of the comparable prior annual reporting period only. The amendment also expands the supplemental pro forma disclosures required to include a description of the nature and amount of material, non-recurring pro forma adjustments directly attributable to the business combination included in the reported pro forma revenue and earnings. The new guidance is effective prospectively for business combinations for which the acquisition date is on or after the beginning of the first annual reporting period beginning after December 15, 2010, and early adoption is permitted. The Company adopted the provisions of the new guidance on February 2, 2011 and the adoption of this standard may result in additional disclosures, but it did not have a material impact on the Company's financial position, results of operations, or cash flows.
In September 2011, the FASB issued new guidance for the testing of goodwill impairment. This guidance provides an entity the option to first assess qualitative factors to determine whether the existence of events or circumstances leads to a determination that it is more likely than not that the fair value of a reporting unit is less than its carrying value. If, after assessing the totality of events or circumstances, an entity determines it is not more likely than not that the fair value of a reporting unit is less than its carrying amount, then performing the two-step impairment test is unnecessary. However, if an entity concludes otherwise, then it is required to perform the first step of the two-step impairment test currently required under U.S. GAAP by calculating the fair value of the reporting unit and comparing the fair value with the carrying amount of the reporting unit. If the carrying amount of a reporting unit exceeds its fair value, then the entity is required to perform the second step of the goodwill impairment test to measure the amount of the impairment loss, if any. An entity has the option to bypass the qualitative assessment for any reporting unit in any period and proceed directly to performing the first step of the two-step goodwill impairment test. An entity may resume performing the qualitative assessment in any subsequent period. The guidance is effective for annual and interim goodwill impairment tests performed for fiscal years beginning after December 15, 2011. Early adoption of the new guidance is permitted. We adopted this guidance with our Fiscal 2011 year-end goodwill impairment testing.
In May 2011, the FASB issued new guidance regarding fair value measurements to ensure consistency between U.S. GAAP and International Financial Reporting Standards. The new guidance applies to all reporting entities that are required or permitted to measure or disclose the fair value of an asset, a liability, or an instrument classified in a reporting entity's stockholders' equity in the financial statements. The new guidance applies prospectively effective during periods beginning after December 15, 2011. The company adopted the provisions of the new guidance effective February 1, 2012 and the adoption of this standard did not have a material impact on the Company's financial position, results of operations, or cash flows.
In June 2011, the FASB issued new guidance to increase the prominence of other comprehensive income in financial statements. This guidance provides the option to present the components of net income and comprehensive income in either one single statement or in two consecutive statements reporting net income and other comprehensive income. This guidance is effective for fiscal years and interim periods beginning after December 15, 2011. The Company adopted the provisions of the new
F-18
MATTRESS FIRM HOLDING CORP.
NOTES TO CONSOLIDATED FINANCIAL STATEMENTS (Continued)
1. Business and Summary of Significant Accounting Policies (Continued)
guidance effective February 1, 2012 and the adoption of this standard did not have a material impact on the Company's consolidated financial statements.
New Accounting Standards Not Yet Adopted—In December 2011, the FASB issued new guidance which requires disclosures of gross and net information about financial and derivative instruments eligible for offset in the statement of financial position or subject to a master netting agreement. This guidance is effective for the Company in the first fiscal quarter of 2013 and is not expected to have a material impact on the Company's consolidated financial position, results of operations or cash flows.
In July 2012, the FASB issued new guidance which gives companies the option to perform a qualitative assessment to determine whether it is more likely than not that an indefinite-lived intangible asset is impaired, and in some cases, bypass the two- step impairment test. This guidance is effective for annual and interim indefinite-lived intangible asset impairment tests performed for fiscal years beginning after September 15, 2012. Early adoption of the new guidance is permitted. The Company is currently assessing when it will adopt this guidance.
2. Acquisitions
The Company completed a number of acquisitions of the equity interests or operating assets of specialty mattress retailers. These acquisitions: (a) increase the Company's store locations and market share in markets in which the Company previously operated, which generally results in greater expense synergies and leverage over market-level costs, such as advertising and warehousing, or (b) provide an efficient way to enter new markets in which the Company did not previously operate and which provide a platform for further growth. Results of operations of the acquired businesses are included in the Company's results of operations from the respective effective dates of the acquisitions.
Acquisitions During Fiscal 2010—Effective May 13, 2010, the Company acquired the land and building of a Mattress Firm store location in Houston, Texas, for a purchase price of $2.3 million consisting of cash and a mortgage loan in the amount of $2.1 million, as further described in Note 5. No goodwill was recognized related to the transaction.
Effective October 15, 2010, the Company acquired the equity interests of a mattress specialty retailer, Peak Management, LLC ("Peak"), a former Mattress Firm franchisee, for $3.8 million, consisting of cash and a contingent payment that is based on future sales of the acquired stores. The contingent payment in the amount of $2.0 million was paid in December 2011 based on sales results during the 12-month period ending November 30, 2011. The acquisition added 8 stores in eastern Tennessee and northeast Alabama, which were new areas of Company operations. The acquisition resulted in $3.0 million of goodwill, the majority of which is expected to be deductible for income tax purposes.
Effective December 1, 2010, the Company acquired the equity interests of a mattress specialty retailer, Maggie's Enterprises, Inc. ("Maggie's"), for $15.7 million, consisting of cash and issuance of a seller note in the principal amount of $7.2 million, as further described in Note 5. The acquisition added 26 stores, primarily in eastern Virginia, an area where the Company did not previously conduct operations. The acquired stores continue to be operated under the name Mattress Discounters pursuant to a license agreement with the owner of the trade name. The acquisition resulted in $11.1 million of goodwill, the majority of which is expected to be deductible for income tax purposes.
F-19
MATTRESS FIRM HOLDING CORP.
NOTES TO CONSOLIDATED FINANCIAL STATEMENTS (Continued)
2. Acquisitions (Continued)
The purchase price paid at closing for several of the acquisitions are subject to typical holdbacks for working capital adjustments and seller indemnifications. Total direct acquisition costs of approximately $0.3 million were charged to general and administrative expense during Fiscal 2010. Resolution of holdbacks and adjustments on 2010 acquisitions resulted in $0.1 million in additional cash used in acquisitions and $0.6 million in additional goodwill during fiscal 2011.
The allocation of the purchase price to the assets and liabilities of the acquisitions, based on management's estimate of their fair values, and a reconciliation to the cash provided by the acquisitions on the respective acquisition closing dates is as follows (amounts in thousands):
| |
Maggie's | Peak and Other |
Total | |||||||
|---|---|---|---|---|---|---|---|---|---|---|
Current assets |
$ | 4,024 | $ | 970 | $ | 4,994 | ||||
Property and equipment |
784 | 3,103 | 3,887 | |||||||
Goodwill |
11,130 | 2,978 | 14,108 | |||||||
Other noncurrent assets |
3,319 | 66 | 3,385 | |||||||
Current liabilities |
(2,148 | ) | (763 | ) | (2,911 | ) | ||||
Other noncurrent liabilities |
(1,375 | ) | (290 | ) | (1,665 | ) | ||||
Total assets acquired, net of liabilities assumed |
15,734 | 6,064 | 21,798 | |||||||
Reconciliation to cash used in acquisitions: |
||||||||||
Contingent payment obligation |
— | (1,980 | ) | (1,980 | ) | |||||
Seller notes issued |
(7,200 | ) | — | (7,200 | ) | |||||
Cash of acquired businesses |
(1,769 | ) | (87 | ) | (1,856 | ) | ||||
Cash used in acquisitions, net of cash acquired |
$ | 6,765 | $ | 3,997 | $ | 10,762 | ||||
The net sales, pre-tax income and net income included in the Company's Fiscal 2010 results of operations related to the acquisition of Maggie's from the acquisition date to February 1, 2011 were $3.2 million, $0.3 million and $0.2 million, respectively.
The following table presents the consolidated financial information of the Company on a pro forma basis, assuming that the acquisition of Maggie's had occurred as of February 3, 2010. The historical financial information has been adjusted to give effect to pro forma items that are directly attributable to the acquisitions and are expected to have a continuing impact on the consolidated results. These items include adjustments to record incremental depreciation and amortization expense related to the increase in fair value of the acquired assets.
The unaudited financial information set forth below has been compiled from the historical financial statements and other information, but is not necessarily indicative of the results that actually would have been achieved had the transactions occurred on the dates indicated or that may be achieved in the future (amounts in thousands except per share amounts):
| |
Fiscal 2009 | Fiscal 2010 | |||||||||||||||||
|---|---|---|---|---|---|---|---|---|---|---|---|---|---|---|---|---|---|---|---|
| |
As Reported | Pro Forma Adjustments |
Pro Forma | As Reported | Pro Forma Adjustments |
Pro Forma | |||||||||||||
Net sales |
$ | 432,250 | $ | 21,873 | $ | 454,123 | $ | 494,115 | $ | 20,341 | $ | 514,456 | |||||||
Net income (loss) |
(4,673 | ) | 165 | (4,508 | ) | 349 | 147 | 496 | |||||||||||
Diluted net income (loss) per common share |
$ | (0.21 | ) | $ | 0.01 | $ | (0.20 | ) | $ | 0.02 | $ | — | $ | 0.02 | |||||
F-20
MATTRESS FIRM HOLDING CORP.
NOTES TO CONSOLIDATED FINANCIAL STATEMENTS (Continued)
2. Acquisitions (Continued)
Acquisition During Fiscal 2011—Effective November 15, 2011, the Company acquired the leasehold interests, store assets, distribution center assets and related inventory, and assumed certain liabilities, of Mattress Giant Corporation relating to the operation of 55 mattress specialty retail stores and three distribution centers located in the states of Georgia, Missouri, Illinois and Minnesota for a cash purchase price of approximately $7.9 million. The acquired stores will be rebranded as Mattress Firm stores during Fiscal 2012. The acquisition resulted in $3.2 million of goodwill, the majority of which is expected to be deductible for income tax purposes.
The final purchase price is subject to purchase price holdbacks for adjustments up to $0.5 million which had not settled as of January 31, 2012. Acquisition-related costs for U.S. GAAP purposes are costs the acquirer incurs to effect a business combination, including advisory, legal, accounting, valuation, and other professional or consulting fees. The Company incurred a total of $0.6 million of acquisition-related costs charged to general and administrative expense during Fiscal 2011.
The allocation of the purchase price to the assets and liabilities of the acquisitions, based on management's estimate of their fair values, and a reconciliation to the cash provided by the acquisitions on the respective acquisition closing dates is as follows (amounts in thousands):
Current assets |
$ | 3,815 | ||
Property and equipment |
1,414 | |||
Goodwill |
3,165 | |||
Intangible assets |
150 | |||
Other noncurrent assets |
81 | |||
Current liabilities |
(404 | ) | ||
Other noncurrent liabilities |
(363 | ) | ||
Cash used in acquisitions, net of cash acquired |
$ | 7,858 | ||
Acquisitions During Fiscal 2012—Effective May 2, 2012, the Company completed the acquisition of all of the equity interests in MGHC Holding Corporation ("Mattress Giant") for approximately $44 million subject to customary post-closing purchase price adjustments. The closing was funded with existing cash reserves and $10 million of borrowings under the revolving portion of the 2007 Senior Credit Facility (as defined below). The acquisition added 181 mattress specialty retail stores in certain markets in Florida and Texas where the Company currently operates Mattress Firm stores. The process of rebranding the acquired stores as Mattress Firm commenced immediately after the closing of the transaction with the conversion of in-store merchandising and computer systems and the addition of temporary signage. Permanent rebranding, including renovations and the addition of permanent signage is expected to be complete by the end of fiscal 2012. The acquisition increased the Company's store locations and market share in markets in which the Company previously operated, which generally results in greater expense synergies and leverage over market-level costs, such as advertising and warehousing. The acquisition resulted in $43.0 million of goodwill, the majority of which will not be deductible for income tax purposes.
F-21
MATTRESS FIRM HOLDING CORP.
NOTES TO CONSOLIDATED FINANCIAL STATEMENTS (Continued)
2. Acquisitions (Continued)
The allocation of the purchase price to the assets and liabilities of the acquisition, based on management's estimate of their fair values on the acquisition closing date is as follows (amounts in thousands):
Accounts receivable |
$ | 2,909 | ||
Inventories |
5,167 | |||
Prepaid expenses and other current assets |
2,819 | |||
Property, plant and equipment |
3,043 | |||
Goodwill |
43,000 | |||
Intangible assets |
5,119 | |||
Deferred tax asset |
4,255 | |||
Security deposits |
640 | |||
Accounts payable |
(12,896 | ) | ||
Accrued liabilities |
(7,693 | ) | ||
Customer deposits |
(1,559 | ) | ||
Other noncurrent liabilities |
(820 | ) | ||
Cash used in acquisition, net of cash acquired |
$ | 43,984 | ||
The net sales included in the Company's consolidated statement of operations related to the acquisition of Mattress Giant from the acquisition date to July 31, 2012 was $33.2 million.
The following table presents the selected consolidated financial information of the Company on a pro forma basis, assuming that the acquisition of Mattress Giant had occurred as of February 2, 2011. The historical financial information has been adjusted to give effect to pro forma items that are directly attributable to the acquisition and are expected to have a continuing impact on the consolidated results. These items include adjustments to record incremental depreciation and amortization expense related to the increase in fair value of the acquired assets.
The unaudited financial information set forth below has been compiled from the historical financial statements and other information, but is not necessarily indicative of the results that actually would have been achieved had the transaction occurred on the date indicated or that may be achieved in the future (amounts in thousands except per share amounts):
| |
Twenty-Six Weeks Ended August 2, 2011 |
Twenty-Six Weeks Ended July 31, 2012 |
|||||||||||||||||
|---|---|---|---|---|---|---|---|---|---|---|---|---|---|---|---|---|---|---|---|
| |
As Reported | Pro Forma Adjustments |
Pro Forma | As Reported | Pro Forma Adjustments |
Pro Forma | |||||||||||||
Net sales |
$ | 331,838 | $ | 64,434 | $ | 396,272 | $ | 471,832 | $ | 31,825 | $ | 503,657 | |||||||
Net income |
4,665 | 1,941 | 6,606 | 19,821 | 1,479 | 21,300 | |||||||||||||
Diluted net income per common share |
$ | 0.21 | $ | 0.08 | $ | 0.29 | $ | 0.59 | $ | 0.04 | $ | 0.63 | |||||||
The Company incurred a total of $0.6 million and $1.8 million of acquisition-related costs for the thirteen and twenty-six weeks ended July 31, 2012, respectively, related to the Mattress Giant acquisition.
F-22
MATTRESS FIRM HOLDING CORP.
NOTES TO CONSOLIDATED FINANCIAL STATEMENTS (Continued)
3. Property and Equipment
Property and equipment consist of the following (amounts in thousands):
| |
February 1, 2011 |
January 31, 2012 |
|||||
|---|---|---|---|---|---|---|---|
Land |
$ | 1,159 | $ | 1,159 | |||
Building |
1,621 | 1,621 | |||||
Leasehold improvements |
91,910 | 118,546 | |||||
Equipment, computers and software |
20,833 | 23,683 | |||||
Store signs |
10,576 | 12,762 | |||||
Furniture and fixtures |
8,861 | 10,478 | |||||
Vehicles |
507 | 474 | |||||
|
135,467 | 168,723 | |||||
Accumulated depreciation |
(57,866 | ) | (73,049 | ) | |||
|
$ | 77,601 | $ | 95,674 | |||
Based upon the review of the performance of individual stores, and a decline in performance of certain stores, impairment losses of approximately $2.3 million, $1.7 million and $0.1 million were recognized during Fiscal 2009, Fiscal 2010 and Fiscal 2011, respectively, which are reported as a component of "Loss on store closings and impairment of store assets" in the Statements of Operations. The impairment loss amounts were determined as the excess of the carrying value of property and equipment of those stores with potential impairment in excess of the estimated fair value based on estimated cash flows. Estimated cash flows are primarily based on projected revenues, operating costs and maintenance capital expenditures of individual stores and are discounted based on comparable industry average rates for weighted average cost of capital.
4. Goodwill and Intangible Assets
A summary of the changes in the carrying amounts of goodwill and non-amortizable intangible assets for Fiscal 2010 and 2011 were as follows (amounts in thousands):
| |
Goodwill | Nonamortizable Intangibles |
|||||
|---|---|---|---|---|---|---|---|
Balance at February 2, 2010 |
$ | 273,807 | $ | 80,600 | |||
Current period business acquisitions |
14,108 | — | |||||
Impairment charge |
(536 | ) | — | ||||
Balance at February 1, 2011 |
287,379 | 80,600 | |||||
Prior year business acquisition adjustment |
597 | — | |||||
Current period business acquisitions |
3,165 | — | |||||
Balance at January 31, 2012 |
$ | 291,141 | $ | 80,600 | |||
The amounts of accumulated goodwill impairment were $143.9 million, $144.4 million and $144.4 million as of February 2, 2010, February 1, 2011 and January 31, 2012, respectively. All amounts of goodwill impairment are attributable to the Company's retail reportable segment.
F-23
MATTRESS FIRM HOLDING CORP.
NOTES TO CONSOLIDATED FINANCIAL STATEMENTS (Continued)
4. Goodwill and Intangible Assets (Continued)
A summary of the changes in the carrying amounts of amortizable intangible assets for Fiscal 2010 and 2011 were as follows (amounts in thousands):
| |
Gross Cost |
Accumulated Amortization |
Net Carrying Value |
|||||||
|---|---|---|---|---|---|---|---|---|---|---|
Balance at February 2, 2010 |
$ | 2,718 | $ | (1,353 | ) | $ | 1,365 | |||
Current period business acquisitions |
3,255 | — | 3,255 | |||||||
Amortization expense |
— | (307 | ) | (307 | ) | |||||
Balance at February 1, 2011 |
5,973 | (1,660 | ) | 4,313 | ||||||
Current period business acquisitions |
150 | — | 150 | |||||||
Reaquired franchise rights |
205 | — | 205 | |||||||
Amortization expense |
— | (473 | ) | (473 | ) | |||||
Balance at February 1, 2012 |
$ | 6,328 | $ | (2,133 | ) | $ | 4,195 | |||
The components of intangible assets were as follows (dollar amounts in thousands):
| |
Useful Life (Years) |
February 1, 2011 |
January 31, 2012 |
|||||||
|---|---|---|---|---|---|---|---|---|---|---|
Nonamortizing: |
||||||||||
Trade names and trademarks |
$ | 80,600 | $ | 80,600 | ||||||
Amortizing: |
||||||||||
Franchise agreement rights |
20 | $ | 1,000 | $ | 1,205 | |||||
Acquired trade names |
2-20 | 3,965 | 4,035 | |||||||
Non-compete agreements |
3-5 | 1,008 | 1,088 | |||||||
|
5,973 | 6,328 | ||||||||
Accumulated amortization |
(1,660 | ) | (2,133 | ) | ||||||
|
4,313 | 4,195 | ||||||||
|
$ | 84,913 | $ | 84,795 | ||||||
Expense included in general and administrative expense related to the amortization of intangible assets was $0.5 million, $0.3 million and $0.5 million for Fiscal 2009, Fiscal 2010 and Fiscal 2011, respectively.
The weighted average amortization period remaining for intangible assets is 16 years. Amortization expense for intangible assets at January 31, 2012, is expected to be as follows for each of the next five fiscal years ending on or about January 31 (amounts in thousands):
2012 |
$ | 433 | ||
2013 |
$ | 381 | ||
2014 |
$ | 223 | ||
2015 |
$ | 223 | ||
2016 |
$ | 223 |
Goodwill is related to purchase price allocation resulting from acquisitions. The Company's operations are comprised of market-level operating segments that are each a reporting unit for goodwill
F-24
MATTRESS FIRM HOLDING CORP.
NOTES TO CONSOLIDATED FINANCIAL STATEMENTS (Continued)
4. Goodwill and Intangible Assets (Continued)
impairment purposes. To the extent Step 2 of the goodwill impairment test is required, it consists of (1) comparing the fair value of a reporting unit with the carrying value of its net assets and (2) if the carrying value exceeds fair value, the fair value of goodwill is compared with the respective carrying value and an impairment loss is recognized in the amount of the excess. An estimated fair value of the enterprise, which was allocated to each reporting unit for goodwill impairment purposes, was derived by a combination of an income approach and a market approach, which incorporates both management's views and those of the market. The income approach provides an estimated fair value based on the Company's anticipated cash flows that are discounted using a weighted average cost of capital rate. The market approach provides an estimated fair value based on multiples of operating results to enterprise value of comparable publicly-traded entities that are applied to the Company's historical operating results. The estimated fair values computed using the income approach and the market approach are then weighted and combined into a single fair value. The primary assumptions used in the income approach are estimated cash flows and weighted average cost of capital. Estimated cash flows are primarily based on projected revenues, operating costs and capital expenditures and are discounted based on comparable industry average rates for weighted average cost of capital.
For the goodwill impairment test performed for Fiscal 2010, the amount of enterprise value allocated to the Company's reporting units was less than carrying values of net assets, inclusive of goodwill, for two reporting units, which experienced declines in results of operations in Fiscal 2010. As a result, the Company performed the second step of the goodwill impairment and determined that the carrying value of goodwill exceeded the fair value for the two reporting units and, accordingly, a non-cash impairment charge of $0.5 million was recognized in Fiscal 2010.
5. Notes Payable and Long-term Debt
Notes payable and long-term debt consist of the following (amounts in thousands):
| |
February 1 2011 |
January 31, 2012 |
July 31, 2012 |
|||||||
|---|---|---|---|---|---|---|---|---|---|---|
2007 Senior Credit Facility |
$ | 230,243 | $ | 228,330 | $ | 232,216 | ||||
Equipment financing and other notes payable |
551 | 24 | 14 | |||||||
Seller Notes |
7,200 | — | — | |||||||
Mortgage loan |
2,045 | — | — | |||||||
Total long-term debt |
240,039 | 228,354 | 232,230 | |||||||
Current maturities of long-term debt |
6,255 | 2,414 | 1,805 | |||||||
Long-term debt, net of current maturities |
$ | 233,784 | $ | 225,940 | $ | 230,425 | ||||
2009 Loan Facility |
$ | 109,755 | $ | — | $ | — | ||||
PIK Notes |
48,909 | — | — | |||||||
Convertible Notes |
— | — | — | |||||||
Total long-term debt due to related parties |
$ | 158,664 | $ | — | $ | — | ||||
2007 Senior Credit Facility—On January 18, 2007, Mattress Holding, an indirect subsidiary of the issuer, entered into a credit agreement with UBS Securities LLC and certain of its affiliates and other lenders for a senior secured term loan and revolving credit facility, which was amended and restated on February 16, 2007 (as amended and restated, the "2007 Senior Credit Facility"). Outstanding
F-25
MATTRESS FIRM HOLDING CORP.
NOTES TO CONSOLIDATED FINANCIAL STATEMENTS (Continued)
5. Notes Payable and Long-term Debt (Continued)
borrowings at February 1, 2011, January 31, 2012 and July 31, 2012, are reported net of an unamortized discount of approximately $489,000, $339,000 and $259,000, respectively.
The revolving loan portion of the 2007 Senior Credit Facility provides Mattress Holding with up to $35.0 million in outstanding revolving borrowings, with up to $15.0 million of that amount available for the issuance of letters of credit. During Fiscal 2010, Mattress Holding borrowed under the revolving facility a total of $2.0 million, which was subsequently repaid during the period. There were no outstanding borrowings at February 1, 2011 or January 31, 2012 and $5.0 million of outstanding borrowings at July 31, 2012. Outstanding letters of credit on the revolving facility were $1.0 million at January 31, 2012, resulting in $24.0 million of availability for borrowings and up to $14.0 million of that amount available for the issuance of letters of credit. Outstanding letters of credit on the revolving facility were $1.0 million at July 31, 2012, resulting in $29.0 million of availability for borrowings and up to $14.0 million of that amount available for the issuance of letters of credit.
Borrowings under the 2007 Senior Credit Facility bear interest at a floating rate and may be maintained, at Mattress Holding's option, as "base rate loans" (tied to the greater of the prime rate or the federal funds rate plus 0.5%) plus an "applicable margin rate," or as "Eurocurrency rate loans" tied to LIBOR plus an applicable margin rate. The applicable margin rate percentages for term loans are 1.25% for base rate loans and 2.25% for Eurocurrency rate loans. The weighted average interest rate applicable to outstanding borrowings was 2.6% at both February 1, 2011 and January 31, 2012.
Outstanding borrowings under the term loan portion of the 2007 Senior Credit Facility are payable in quarterly installments of approximately $599,000 with the outstanding balance due at maturity on January 18, 2014. Furthermore, Mattress Holding is subject to an annual principal prepayment in an amount equal to a portion of "excess cash flow," as defined in the 2007 Senior Credit Facility, payable no later than 120 days after the end of each fiscal year. Such prepayments are first applied to reduce scheduled quarterly principal repayments for the next four quarters and then to reduce future quarterly payments through maturity on a pro-rata basis. Mattress Holding made excess cash flow payments in the amounts of approximately $0.8 million and $2.1 million on June 1, 2011 and May 21, 2010, respectively, with respect to excess cash flows related to Fiscal 2009 and 2010, respectively. The prepayments of approximately $0.8 million and $2.1 million were classified as current maturities of long-term debt as of February 2, 2010 and February 1, 2011, respectively. There are certain mandatory prepayment requirements resulting from asset sale proceeds, debt issuance proceeds and casualty and condemnation proceeds. No such prepayments were required in Fiscal 2009, Fiscal 2010 or Fiscal 2011. Mattress Holding may make prepayments on the loan without penalty.
The 2007 Senior Credit Facility is guaranteed by, subject to certain exceptions, Mattress Holding's immediate parent entity, Mattress Holdco, and by each of the existing and future subsidiaries of Mattress Holding. All obligations under the 2007 Senior Credit Facility, and the guarantees of those obligations, are secured by substantially all of the existing and future property and assets of Mattress Holding and the guarantors under the 2007 Senior Credit Facility, and by a pledge of Mattress Holding's capital stock and the capital stock of each of its subsidiaries. Mattress Holding is subject to certain financial covenants under the agreement principally consisting of maximum debt leverage and minimum interest coverage ratios. Subject to certain restrictions, Mattress Holding has the ability to exercise equity cure rights, which allow the inclusion of capital contributions received from Mattress Firm Holding Corp. in the results of operations for the purpose of measuring the maximum debt leverage and minimum interest coverage ratios. In addition, the 2007 Senior Credit Facility places limits
F-26
MATTRESS FIRM HOLDING CORP.
NOTES TO CONSOLIDATED FINANCIAL STATEMENTS (Continued)
5. Notes Payable and Long-term Debt (Continued)
on the amounts of annual capital expenditures and contains restrictions on, subject to certain exceptions, including, but not limited to, engaging in transactions with affiliates; prepaying subordinated debt; incurring indebtedness and liens; declaring dividends or redeeming or repurchasing capital stock; making loans and investments; and engaging in mergers, acquisitions, consolidations and asset sales. On March 20, 2009, Mattress Holding exercised an equity cure right through the receipt of a capital contribution from Mattress Firm Holding Corp. (from the proceeds of the issuance of a PIK Note further described below) in the amount of $16.9 million in cash to maintain compliance with financial covenants in Fiscal 2008. Mattress Holding was in compliance with all loan covenants at January 31, 2012 and July 31, 2012.
Seller Notes—In connection with the acquisition of Maggie's on December 1, 2010 (further described in Note 2), Mattress Holding, through its subsidiary, Mattress Firm, Inc., issued unsecured promissory notes in the aggregate principal amount of $7.2 million to the sellers of the business. Such notes bore interest at 8.0% and were payable in eight equal quarterly installments of principal and interest through November 2012. On July 29, 2011, the Company prepaid the Seller Notes in full.
Mortgage Loan—In connection with the purchase of a store property on May 13, 2010 (further described in Note 2), Mattress Holding entered into a mortgage loan with a financial institution at an interest rate equal to the greater of 5.25% or the prime rate plus 1.5%. The loan was payable in monthly installments of principal and interest of approximately $14,000, subject to future revisions from prime rate fluctuations, with the remaining outstanding balance payable at maturity on May 13, 2015. On July 29, 2011, the Company prepaid the mortgage loan in full.
Equipment Financing and Other Short-Term Notes Payable—Mattress Holding and its subsidiaries have various outstanding notes payable related to the purchase of equipment and other uncollateralized notes payable at 6.8% interest with monthly principal and interest payments of various amounts through 2013. Equipment financing notes payable are collateralized by certain equipment with carrying values that approximate the outstanding principal balances of the related notes payable.
Debt With Related Parties
2009 Loan Facility—On January 18, 2007, Mattress Holding entered into a financing agreement with a group of institutional investors that also own equity interests in Mattress Holdings, LLC, for a senior subordinated loan facility for term borrowings in the original amount of $120.0 million. The financing agreement was amended on February 16, 2007, which included a prepayment of the original borrowing in the amount of $40.0 million (the "2007 Subordinated Loan Facility"). The 2007 Subordinated Loan Facility was originally guaranteed by each existing subsidiary of Mattress Holding and its immediate parent Mattress Holdco, Inc. ("Mattress Holdco"). On March 20, 2009, Mattress Intermediate Holdings. Inc. ("Mattress Intermediate"), an indirect parent of Mattress Holding and a direct subsidiary of Mattress Firm Holding Corp., assumed all obligations of Mattress Holding in respect of the 2007 Subordinated Loan Facility, including accrued interest through such date, and the obligations and guarantees of Mattress Holding, Mattress Holdco and their respective subsidiaries were released and discharged. In connection therewith, the 2007 Subordinated Loan Facility was amended and restated ("2009 Loan Facility").
F-27
MATTRESS FIRM HOLDING CORP.
NOTES TO CONSOLIDATED FINANCIAL STATEMENTS (Continued)
5. Notes Payable and Long-term Debt (Continued)
Effective March 20, 2009, borrowings under the 2009 Loan Facility bore interest at 16% per annum. Accrued interest was payable quarterly by adding such interest to the principal amount outstanding on each interest payment date. The 2009 Loan Facility required no principal payments prior to its maturity on January 18, 2015, except for mandatory quarterly principal payments on or after March 20, 2014 to the extent required to prevent the loan from being considered an "applicable high yield discount obligation" within the meaning of the Internal Revenue Code. All obligations under the 2009 Loan Facility were unsecured.
The amendment and restatement resulting in the 2009 Loan Facility was recognized as an extinguishment of the 2007 Subordinated Loan Facility for financial reporting purposes. Accordingly, the carrying value of the debt was adjusted to its estimated market value as of March 20, 2009, which resulted in a $5.8 million debt discount and a gain on extinguishment, net of a loss of $2.8 million from the write off of unamortized debt issue costs, resulting in the recognition of a net gain on debt extinguishment of $2.8 million during Fiscal 2009. The debt discount was being amortized over the remaining term of the 2009 Loan Facility, resulting in a 17.2% effective interest rate. The Company incurred $1.0 million of direct costs related to the amendment and restatement, which was being amortized over the remaining term of the 2009 Loan Facility.
There was an aggregate of $109.8 million and zero outstanding under the 2009 Loan Facility as of February 1, 2011 and January 31, 2012, respectively, net of an unamortized discount of $5.4 million and zero, respectively. On July 19, 2011, the Company made a voluntary prepayment of $40.0 million under the 2009 Loan Facility. On November 23, 2011 the Company used $88.8 million of the net proceeds from the initial public offering to repay in full all amounts outstanding under the 2009 Loan Facility. In connection with the voluntary prepayments, the Company recognized a loss on debt extinguishment in the amount of $5.7 million during Fiscal 2011.
PIK Notes—At various times from October 24, 2007 through May 20, 2009, Mattress Firm Holding Corp. issued paid-in-kind notes ("PIK Notes") to certain equity investors of Mattress Holdings, LLC and certain affiliates of those equity investors. The proceeds from each separate issuance were contributed to the equity of Mattress Holding for various purposes. Under the terms issued, the PIK Notes would mature at various dates between October 24, 2012 and March 19, 2015.
The PIK Notes bore interest at a rate of 12% per annum. Accrued interest was payable either annually or semiannually, as was applicable for each separate note issuance, with each such interest payment made through the addition of such interest amount to the outstanding principal amount of each of the PIK Notes. The PIK Notes required no principal payments prior to their maturity and the Company was permitted to prepay the PIK Notes, in whole or in part, at anytime without premium or penalty. The PIK Notes were not guaranteed by any of the Company's subsidiaries or parent entities and all obligations under the PIK Notes were unsecured.
On November 23, 2011, in connection with the consummation of the initial public offering, (1) the Company used $4.6 million of the net proceeds from the initial public offering to repay in full the Company's PIK Notes that did not convert into shares of the Company's common stock upon the completion of the initial public offering and (2) the aggregate remaining principal and accrued interest balance of $52,7 million were converted into 2,774,035 shares the Company's common stock at a price per share equal to the initial public offering price of $19.00 per common share.
F-28
MATTRESS FIRM HOLDING CORP.
NOTES TO CONSOLIDATED FINANCIAL STATEMENTS (Continued)
5. Notes Payable and Long-term Debt (Continued)
Convertible Notes—On July 19, 2011, the Company issued convertible notes in an aggregate principal amount of $40.2 million ("Convertible Notes") to certain equity investors of Mattress Holdings, LLC and certain affiliates of those equity investors. The Convertible Notes bore interest at a rate of 12%, payable annually on July 18 of each year through the addition of the accrued interest to the outstanding principal balance of the notes. The Convertible Notes were to mature on July 18, 2016, although the Company was permitted to prepay the Convertible Notes, in whole or in part, at any time without premium or penalty. The Convertible Notes did not contain any financial or operating covenants. Pursuant to an automatic conversion feature, on November 23, 2011, in connection with the consummation of the initial public offering, the Convertible Notes with an aggregate principal and accrued interest balance of $41.9 million converted into 2,205,953 shares of common stock at a price per share equal to the initial public offering price of $19.00 per common share.
Future Maturities of Notes Payable and Long-Term Debt—The aggregate maturities of notes payable and long-term debt at January 31, 2012 were as follows (amounts in thousands):
Fiscal year ending on or about January 31: |
||||
2013 |
$ | 2,394 | ||
2014 |
226,299 | |||
2015 |
— | |||
2016 |
— | |||
2017 |
— | |||
Thereafter |
— | |||
|
$ | 228,693 | ||
6. Income Taxes
Income tax expense consists of the following (amounts in thousands):
| |
Fiscal 2009 |
Fiscal 2010 |
Fiscal 2011 |
|||||||
|---|---|---|---|---|---|---|---|---|---|---|
Current: |
||||||||||
Federal |
$ | — | $ | — | $ | 291 | ||||
State |
1,427 | 964 | 2,165 | |||||||
|
1,427 | 964 | 2,456 | |||||||
Deferred: |
||||||||||
Federal |
(22 | ) | — | (10,912 | ) | |||||
State |
— | (118 | ) | (359 | ) | |||||
|
(22 | ) | (118 | ) | (11,271 | ) | ||||
Total income tax expense |
$ | 1,405 | $ | 846 | $ | (8,815 | ) | |||
F-29
MATTRESS FIRM HOLDING CORP.
NOTES TO CONSOLIDATED FINANCIAL STATEMENTS (Continued)
6. Income Taxes (Continued)
The differences between the effective tax rate reflected in the provision for income taxes on income (loss) before income taxes and the statutory federal rate is as follows (amounts in thousands, except for percentages):
| |
Fiscal 2009 |
Fiscal 2010 |
Fiscal 2011 |
|||||||
|---|---|---|---|---|---|---|---|---|---|---|
Computed tax at 35% of income (loss) |
$ | (1,144 | ) | $ | 419 | $ | 8,938 | |||
State income taxes, net of federal income tax benefit |
1,072 | 627 | 2,168 | |||||||
Stock-based compensation |
30 | (180 | ) | 53 | ||||||
Goodwill impairment |
— | 164 | — | |||||||
Change in valuation allowance |
1,419 | (234 | ) | (20,050 | ) | |||||
Other |
28 | 50 | 76 | |||||||
Total income tax expense |
$ | 1,405 | $ | 846 | $ | (8,815 | ) | |||
Effective income tax rate |
(43.0 | )% | 70.7 | % | (34.5 | )% | ||||
The effective tax rate was (34.5%) for the year ended January 31, 2012, compared to 70.7% for the year ended February 1, 2011, and differs primarily as a result of the Company releasing all of its valuation allowance during Fiscal 2011.
F-30
MATTRESS FIRM HOLDING CORP.
NOTES TO CONSOLIDATED FINANCIAL STATEMENTS (Continued)
6. Income Taxes (Continued)
Deferred income taxes reflect the net tax effects of temporary differences between the carrying amount of assets and liabilities for financial reporting purposes and the amounts used for income tax purposes. The significant components of the Company's deferred tax assets and liabilities are as follows (amounts in thousands):
| |
February 1, 2011 | January 31, 2012 | |||||||||||
|---|---|---|---|---|---|---|---|---|---|---|---|---|---|
| |
Current | Noncurrent | Current | Noncurrent | |||||||||
Deferred income tax assets: |
|||||||||||||
Allowance for doubtful accounts |
$ | 39 | $ | — | $ | 36 | $ | — | |||||
Inventories |
465 | — | 682 | — | |||||||||
Accrued liabilities |
2,043 | — | 2,799 | — | |||||||||
Noncurrent liabilities |
— | 1,788 | — | 3,392 | |||||||||
Charitable contribution carryforward |
— | 107 | 250 | — | |||||||||
Tax credits |
— | 366 | 654 | — | |||||||||
Net operating loss carryforward |
— | 14,941 | 8,286 | — | |||||||||
Goodwill |
— | 3,917 | — | 2,328 | |||||||||
|
2,547 | 21,119 | 12,707 | 5,720 | |||||||||
Valuation allowance |
(2,376 | ) | (17,674 | ) | — | — | |||||||
|
171 | 3,445 | 12,707 | 5,720 | |||||||||
Deferred income tax liabilities: |
|||||||||||||
Nonamortizing intangible assets |
— | (29,878 | ) | — | (30,053 | ) | |||||||
Other current assets |
(89 | ) | — | (133 | ) | — | |||||||
Amortizable intangible assets |
— | (806 | ) | — | (756 | ) | |||||||
Property and equipment |
— | (2,721 | ) | — | (5,956 | ) | |||||||
|
(89 | ) | (33,405 | ) | (133 | ) | (36,765 | ) | |||||
Net deferred income tax assets (liabilities) |
$ | 82 | $ | (29,960 | ) | $ | 12,574 | $ | (31,045 | ) | |||
Certain reclassifications have been made to the prior year deferred tax assets and liabilities to conform to current period financial statement presentation with no effect on our previously reported net deferred income tax assets (liabilities) on the consolidated financial position, results of operations or cash flows.
At January 31, 2012, the Company had approximately $38 million of net operating loss carryforwards that expire at various dates beginning in 2018, if not utilized to offset future taxable income.
The Company has net tax basis in excess of book basis in amortizable goodwill of approximately $5.0 million related to goodwill recorded on certain acquisitions, which occurred through the end of Fiscal 2011. The tax basis in amortizable goodwill in excess of the related book basis is not recognized in deferred tax assets. To the extent the amortization of the excess tax basis results in a cash tax benefit, the benefit will first go to reduce goodwill, then other long-term intangible assets, and then tax expense. As of January 31, 2012, the Company has not received any cash tax benefit related to the amortization of excess tax basis of approximately $3.9 million.
F-31
MATTRESS FIRM HOLDING CORP.
NOTES TO CONSOLIDATED FINANCIAL STATEMENTS (Continued)
6. Income Taxes (Continued)
As of February 2, 2011, the Company provided a valuation allowance in the amount of $20.1 million to reduce deferred tax assets related to net operating loss carryforwards and other deductible temporary differences to the amount that was considered more-likely-than-not to be realized. The determination that a valuation allowance was required was based in part on the existence of operating losses in prior fiscal years, as adjusted for permanent differences. As of January 31, 2012, operating income in recent periods and projected future taxable income, including income associated with the cessation of interest deductions resulting from Fiscal 2011 debt retirements and the future reversal of temporary differences related to existing deferred tax liabilities, provides sufficient evidence that it is more-likely-than-not that deferred tax assets will be realized in future periods. Accordingly, the Company recognized a deferred tax benefit during Fiscal 2011 in the amount of $20.1 million, consisting of a $5.9 million reduction resulting primarily from the utilization of a net operating loss carryforwards and a $14.2 million reduction resulting from the year-end evaluation supporting that deferred tax assets will be realized in future periods. The Company and its subsidiaries are included in a consolidated income tax return in the U.S. federal jurisdiction and file separate income tax returns in several states. The Company and its subsidiaries are no longer subject to U.S. federal or state and local income tax examinations by tax authorities for years before the tax year ending February 3, 2009 and are not currently undergoing an income tax examination in any jurisdiction.
The Company's accounting policy with respect to uncertain tax positions is described in Note 1. All unrecognized tax benefits were in connection with a previous acquisition, and resulted in a $0.4 million increase to goodwill, with a corresponding reduction of deferred tax assets related to net operating loss carryforwards. These unrecognized tax benefits, if recognized, would be recorded in the statement of operations and thus would impact the company's effective tax rate in the period in which they are recognized. Unrecognized tax benefits, if recognized, will favorably affect the Company's effective income tax rate upon recognition.
The Company recognizes interest and penalties related to unrecognized tax benefits as a component of income tax expense. The Company has not accrued any interest expense on unrecognized tax benefits as of January 31, 2012. The Company does not anticipate it will be assessed penalties on this filing position. The Company does not expect that any significant changes will occur in unrecognized tax benefits over the next twelve months. A reconciliation of the beginning and ending amount of unrecognized tax benefits for Fiscal 2010 and 2011 is as follows (amounts in thousands):
Balance at beginning of period |
$ | 369 | ||
Change |
— | |||
Balance at February 2, 2010 |
369 | |||
Change |
— | |||
Balance at February 1, 2011 |
369 | |||
Increases related to prior year tax positions |
4 | |||
Balance at January 31, 2012 |
$ | 373 | ||
Income tax expense during interim periods is based on the estimated annual effective income tax rate plus any discrete items which are recorded in the period in which they occur. Discrete items include such events as changes in estimates due to the finalization of tax returns, tax audit settlements, tax law changes, and increases or decreases in valuation allowances related to prior year estimates. The
F-32
MATTRESS FIRM HOLDING CORP.
NOTES TO CONSOLIDATED FINANCIAL STATEMENTS (Continued)
6. Income Taxes (Continued)
determination of the consolidated provision for income taxes, deferred tax assets and liabilities and related valuation allowance needs require management to make judgments and estimates. Although management believes that its tax estimates are reasonable, the ultimate tax determination involves significant judgments that could become subject to audit by tax authorities in the ordinary course of business, as well as the generation of sufficient future taxable income.
The Company recognized $11.5 million of income tax expense for the twenty-six weeks ended July 31, 2012, compared to $0.3 million of income tax expense for the twenty-six weeks ended August 2, 2011. The effective tax rate was 36.7% for the twenty-six weeks ended July 31, 2012, compared to 6.4% for the twenty-six weeks ended August 2, 2011, and differs primarily due to the fact that the Company had a full valuation allowance recorded against its deferred tax assets during the first twenty-six weeks of 2011. The effective tax rate of 36.7% for the current period differs from the federal statutory rate of 35% primarily due to state income taxes.
The Company files income tax returns in U.S. federal and state jurisdictions. As of July 31, 2012, open tax years in federal and some state jurisdictions date back to October 2002 due to the taxing authorities' ability to adjust operating loss carryforwards.
7. Accrued Liabilities and Other Noncurrent Liabilities
The Company estimates certain material expenses in an effort to recognize those expenses in the period incurred. The most material estimates relate to lease commitment reserves related to store closings (see Note 8), product warranty returns (see Note 1) and insurance-related expenses, significant portions of which are self-insured related to workers' compensation and employee health insurance. The ultimate cost of our workers' compensation insurance accruals is recorded based on actuarial valuations and historical claims experience. Our employee medical insurance accruals are recorded based on our medical claims processed as well as historical medical claims experience for claims incurred but not yet reported. We maintain stop-loss coverage to limit the exposure to certain insurance-related risks. Differences in our estimates and assumptions could result in an accrual requirement materially different from the calculated accrual. Historically, such differences have not been significant.
F-33
MATTRESS FIRM HOLDING CORP.
NOTES TO CONSOLIDATED FINANCIAL STATEMENTS (Continued)
7. Accrued Liabilities and Other Noncurrent Liabilities (Continued)
Accrued liabilities consist of the following (amounts in thousands):
| |
February 1, 2011 |
January 31, 2012 |
July 31, 2012 |
|||||||
|---|---|---|---|---|---|---|---|---|---|---|
Unbilled advertising |
$ | 1,400 | $ | 5,212 | $ | 10,537 | ||||
Employee wages, payroll taxes and withholdings |
3,327 | 7,861 | 6,477 | |||||||
Sales tax |
3,352 | 4,720 | 6,393 | |||||||
Accrued construction in-progress costs |
958 | 1,489 | 4,593 | |||||||
Income tax payable |
1,419 | 1,985 | 4,373 | |||||||
Acquisition contingent payment |
1,980 | 324 | 1,887 | |||||||
Accrued employee compensated absences |
869 | 1,114 | 1,727 | |||||||
Insurance |
886 | 1,652 | 1,311 | |||||||
Product warranty returns |
783 | 1,285 | 1,213 | |||||||
Accrued interest |
629 | 575 | 547 | |||||||
Other |
6,262 | 5,563 | 8,328 | |||||||
|
$ | 21,865 | $ | 31,780 | $ | 47,386 | ||||
Other noncurrent liabilities consist of the following (amounts in thousands):
| |
February 1, 2011 |
January 31, 2012 |
|||||
|---|---|---|---|---|---|---|---|
Deferred lease liabilities |
$ | 34,511 | $ | 39,344 | |||
Deferred vendor incentives |
4,311 | 7,646 | |||||
Product warranty returns, less current portion |
1,280 | 1,481 | |||||
Noncurrent accrued interest |
3,160 | — | |||||
Related party management fees |
800 | — | |||||
Other |
1,117 | 882 | |||||
|
$ | 45,179 | $ | 49,353 | |||
8. Store Closings
Management reviews the performance of individual stores to determine whether to renew or extend leases or to close a store at or prior to the lease termination date. Results of operations and estimated closing costs from individual store and warehouse location closings are included in continuing operations. Management also reviews retail operating results at the market level in determining whether to exit and close all store and warehouse locations in a market based on an evaluation of the investment required to improve market results to an acceptable level and the estimated costs to discontinue operations. Each market is an operating segment and, accordingly, operating results of stores and warehouses closed for an entire market and the related loss from closing are reported as discontinued operations. The Company did not exit any markets during Fiscal 2009, Fiscal 2010 or Fiscal 2011.
Costs associated with location closings: The Company remains directly liable for future lease obligations for certain closed store and warehouse locations and contingently liable for locations that are assigned to third parties. The Company may enter into sublease agreements with third parties for
F-34
MATTRESS FIRM HOLDING CORP.
NOTES TO CONSOLIDATED FINANCIAL STATEMENTS (Continued)
8. Store Closings (Continued)
certain closed locations while retaining the primary lease obligation with landlords. The Company accrues a liability for the estimated future costs to close locations at the time of closing. Such accruals include, as applicable, the difference between future lease obligations and anticipated sublease rentals. Future contingent lease commitments related to assigned and subleased properties and the related future sublease rentals are disclosed in Note 10.
The change in the estimated liability for location closing costs, which is included in other accrued liabilities, is as follows (amounts in thousands):
| |
Fiscal 2009 |
Fiscal 2010 |
Fiscal 2011 |
|||||||
|---|---|---|---|---|---|---|---|---|---|---|
Balance at beginning of period |
$ | 1,482 | $ | 1,714 | $ | 153 | ||||
Increase (decrease) in store closing reserves: |
||||||||||
Rent paid |
(1,973 | ) | (2,304 | ) | (784 | ) | ||||
Sublease income |
413 | 478 | 512 | |||||||
Closed store additions |
1,208 | 371 | 650 | |||||||
Adjustments to existing reserves |
584 | (106 | ) | 33 | ||||||
Balance at end of period |
$ | 1,714 | $ | 153 | $ | 564 | ||||
The Company revises the estimated liability for location closing costs when new facts and circumstances become available. It is reasonably possible that the Company's actual future costs to sublease or otherwise terminate leases related to closed properties could be different than the estimate as a result of economic conditions outside the control of the Company and that the effects could be material to the Company's consolidated financial statements.
9. Stockholders' Equity
Dividends
As a holding company, the ability of Mattress Firm Holding Corp. to pay dividends is limited by its ability to receive dividends or distributions from its subsidiaries. The 2007 Senior Credit Facility imposes restrictions on Mattress Holding with respect to the payment of dividends to Mattress Firm Holding Corp.
Common Stock
On November 3, 2011, the Company's Board of Directors approved an increase in the number of authorized shares of the Company's common stock to 120,000,000 and a 227,058-for-one forward stock split of the Company's common stock, with no corresponding change to the par value. All common share numbers and per share amounts for all periods presented have been adjusted retroactively.
As further described in Note 1, the Company completed an initial public offering of 6,388,888 shares of common stock on November 23, 2011 at $19 per share, resulting in $110.4 million of net proceeds after deducting underwriting discounts and commissions of $8.5 million and $2.5 million of offering related costs. In addition, as further described in Notes 1 and 5, the Company issued an aggregate of 4,979,988 shares of common stock in the conversion of PIK Notes and Convertible Notes in connection with the completion of the offering.
F-35
MATTRESS FIRM HOLDING CORP.
NOTES TO CONSOLIDATED FINANCIAL STATEMENTS (Continued)
9. Stockholders' Equity (Continued)
Common Stock Reserved for Future Issuance
As further described in Note 14, approximately 4.2 million shares of common stock are reserved for issuances under the 2011 Omnibus Incentive Plan.
Earnings per Share
Basic net income (loss) per common share is computed by dividing the net income applicable to common shares by the weighted average number of common shares outstanding during the period. Diluted net income per common share is computed by dividing net income by the weighted average number of common shares outstanding during the period, adjusted to reflect potentially dilutive securities using the treasury stock method for stock option awards. Diluted net income per common share adjusts basic net income per common share for the effects of stock options and other potentially dilutive financial instruments only in the periods in which such effect is dilutive.
The following table presents a reconciliation of the weighted average shares outstanding used in the earnings per share calculations:
| |
|
|
|
Twenty-Six Weeks Ended | ||||||||||||
|---|---|---|---|---|---|---|---|---|---|---|---|---|---|---|---|---|
| |
Fiscal 2009 |
Fiscal 2010 |
Fiscal 2011 |
August 2, 2011 |
July 31, 2012 |
|||||||||||
Basic weighted average shares outstanding |
22,399,952 | 22,399,952 | 24,586,274 | 22,399,952 | 33,768,828 | |||||||||||
Effect of dilutive securities: |
||||||||||||||||
Stock options |
— | — | — | — | 97,350 | |||||||||||
Restricted shares |
— | — | — | — | 980 | |||||||||||
Diluted weighted average shares outstanding |
22,399,952 | 22,399,952 | 24,586,274 | 22,399,952 | 33,867,158 | |||||||||||
Diluted net income per common share for Fiscal 2011 excludes stock options for the purchase of 1,223,874 shares of common stock as their inclusion would be anti-dilutive.
One-half of the stock options granted to the Company's employees are subject to a five-year time-based vesting schedule, while the remaining one-half of the stock options are subject to a four-year market-based vesting schedule, with such vesting based on specified stock price increase targets, as set forth in the option award agreement evidencing the grant of such stock options. The Company includes market-based stock option awards in the dilutive potential common shares when they become contingently issuable and exclude the awards when they are not contingently issuable. Diluted weighted average shares outstanding for the twenty-six weeks ended July 31, 2012 excludes stock options for the purchase of 458,936 shares of common stock as the applicable vesting criteria were not satisfied as of July 31, 2012.
10. Commitments and Contingencies
The Company conducts the majority of its operations from leased store and warehouse facilities pursuant to non-cancellable operating lease agreements with initial terms ranging from one to 15 years. Certain leases include renewal options generally ranging from one to five years and contain certain rent
F-36
MATTRESS FIRM HOLDING CORP.
NOTES TO CONSOLIDATED FINANCIAL STATEMENTS (Continued)
10. Commitments and Contingencies (Continued)
escalation clauses. Most leases require the Company to pay its proportionate share of the property tax, insurance and maintenance expenses of the property. Certain leases provide for contingent rentals based on sales volumes; however, incremental rent expense resulting from such arrangements was immaterial during all periods presented in the accompanying financial statements.
Total expense incurred under operating leases, consisting of base rents and other expenses (comprised primarily of common area maintenance, property tax, and insurance), is as follows (amounts in thousands):
| |
Base Rents |
Other Expense |
Total Lease Expense |
|||||||
|---|---|---|---|---|---|---|---|---|---|---|
Fiscal 2009 |
$ | 59,521 | $ | 14,043 | $ | 73,564 | ||||
Fiscal 2010 |
$ | 63,932 | $ | 16,931 | $ | 80,863 | ||||
Fiscal 2011 |
$ | 76,108 | $ | 16,879 | $ | 92,987 | ||||
Future minimum lease payments under operating leases as of January 31, 2012, related to properties operated by the Company (amounts in thousands):
Fiscal year ending on or about January 31: |
||||
2013 |
$ | 81,852 | ||
2014 |
70,412 | |||
2015 |
57,785 | |||
2016 |
44,587 | |||
2017 |
29,660 | |||
Thereafter |
53,272 | |||
|
$ | 337,568 | ||
The Company remains directly and contingently obligated under lease agreements related to leased properties no longer operated by the Company as further described in Note 8. In certain instances, the Company has entered into assignment and sublease agreements with third parties, although the Company remains contingently liable with respect to future lease obligations for such leased properties. Future minimum lease payments under operating leases as of January 31, 2012, associated with properties no longer operated by the Company, and the related future sublease rentals (amounts in thousands):
| |
Company's Commitment | Sublease Rentals | |||||
|---|---|---|---|---|---|---|---|
Fiscal year ending on or about January 31: |
|||||||
2013 |
$ | 768 | $ | 476 | |||
2014 |
709 | 492 | |||||
2015 |
497 | 422 | |||||
2016 |
409 | 400 | |||||
2017 |
416 | 406 | |||||
Thereafter |
572 | 564 | |||||
|
$ | 3,371 | $ | 2,760 | |||
F-37
MATTRESS FIRM HOLDING CORP.
NOTES TO CONSOLIDATED FINANCIAL STATEMENTS (Continued)
10. Commitments and Contingencies (Continued)
The Company guarantees and is primarily liable for approximately $1.2 million as of January 31, 2012 in future lease commitments through November 30, 2017 with respect to a real estate lease of a franchisee.
The Company has contracts related to sponsorships and space rentals at special event venues, with future minimum commitments as of January 31, 2012 of $2.1 million and $2.1 million for Fiscal 2012 and 2013, respectively.
The Company is subject to legal proceedings and claims that arise in the ordinary course of business. Management does not believe that the outcome of any of those matters will have a material adverse effect on the Company's financial position, results of operations or cash flows.
On May 26, 2011, the Company settled a lawsuit involving alleged violations of the Fair Labor Standards Act brought in April 2010 by a former employee. The Company paid the settlement amount of $1.6 million to a claims-made reversionary fund on August 9, 2011, and such amount was recognized in sales and marketing expenses during the fiscal year ended February 1, 2011 and was included in accrued liabilities at February 1, 2011.
11. Concentration Risk
Financial instruments that potentially subject the Company to concentrations of risk are primarily cash and cash equivalents and accounts receivable. Information with respect to the credit risk associated with accounts receivable is described in Note 1.
The Company places its cash deposits with financial institutions. At times, such amounts may be in excess of the federally insured limits. Management believes the financial strength of the financial institutions minimizes the credit risk related to the Company's deposits.
12. Related Party Transactions
Management Fees
The Company incurred management fees and other direct expenses from affiliates of J.W. Childs under the terms of a management agreement, prior to the termination of the agreement on November 23, 2011. Beginning on March 20, 2009, and continuing until the termination of the agreement, the Company was not required to pay accrued management fees until such time as the Company began making interest payments related to the outstanding amounts under the 2009 Loan Facility (see Note 5). Interest on the outstanding balance of accrued management fees accrued at a rate of 16%, and all accrued interest was added to the outstanding balance of accrued management fees. Other noncurrent liabilities included accrued management fees, including interest, of approximately $0.8 million at February 1, 2011. On November 23, 2011, the management agreement was terminated in connection of Company's initial public offering, and $1.6 million of the net proceeds raised in the offering were used to pay the outstanding balance accrued management fees, including interest accrued thereon, and a management agreement termination fee of $360,000. The aggregate amount of management fees, interest expense accrued thereon, and the termination fee recognized in the Company's results of operations totaled $0.4 million, $0.4 million and $0.6 million for Fiscal 2009, Fiscal 2010 and Fiscal 2011, respectively. During the twenty-six weeks ended August 2, 2011, the Company incurred management fees and other direct expenses of $0.2 million.
F-38
MATTRESS FIRM HOLDING CORP.
NOTES TO CONSOLIDATED FINANCIAL STATEMENTS (Continued)
12. Related Party Transactions (Continued)
2009 Loan Facility, PIK Notes and Convertible Notes
As further described in Note 5, prior to the completion of the initial public offering on November 23, 2011, the Company had outstanding debt with parties that own equity interests in Mattress Holdings LLC and certain affiliates of those equity investors, consisting of the 2009 Loan Facility, PIK Notes and Convertible Notes (collectively, "Related Party Debt"). Interest accrued on Related Party Debt was paid through the addition of the accrued interest to the outstanding principal amount of debt. In connection with the completion of the initial public offering, the total outstanding obligations of Related Party Debt was paid off with net proceeds from the offering or were converted to shares of the Company's common stock. The aggregate outstanding borrowings on Related Party Debt was $158.7 million at February 1, 2011 and $188.0 million at November 23, 2011, prior to completion of the initial public offering. Interest expense on Related Party Debt included in the result of operations totaled $17.7 million, $23.2 million and $20.6 million in Fiscal 2009, Fiscal 2010 and Fiscal 2011, respectively. Interest expense incurred under these debt instruments totaled $12.9 million for the twenty-six weeks ended August 2, 2011.
Equity Support Letter
Subsequent to the exercise of an equity cure right under the 2007 Senior Credit Facility on March 20, 2009 and in connection with the amendment and restatement of the 2007 Subordinated Loan Facility, resulting in the 2009 Loan Facility, certain affiliates of J.W. Childs and the 2009 Loan Facility lenders (who are also equity investors in Mattress Holdings, LLC), entered into a letter agreement whereby J.W. Childs agreed to infuse additional capital into Mattress Holding in an amount up to $17.0 million, subject to Mattress Holdings attainment of minimum financial results thresholds, if such capital would be required to effect an equity cure under the 2007 Senior Credit Facility. On November 4, 2011, the letter agreement was amended to terminate upon the conversion or payment of the entire amount outstanding under the PIK Notes, including all accrued and unpaid interest thereon. Upon such payment on November 23, 2011, the letter agreement terminated. No events had occurred from March 20, 2009 until the termination of the letter agreement that would have required the parties to exercise the capital infusion requirement.
13. Retirement Plans
The Company sponsors a 401(k) defined contribution plan (the "Retirement Plan") that covers substantially all employees. Participants may elect to defer a percentage of their salary, subject to annual limitations imposed by the Internal Revenue Code. The Company makes matching contributions at its discretion. The Company temporarily suspended matching contributions beginning in March 2009 and continuing through April 2010. Approximate matching contributions and other expenses related to the Retirement Plan were as follows (amounts in thousands):
Fiscal 2009 |
$ | 1 | ||
Fiscal 2010 |
$ | 333 | ||
Fiscal 2011 |
$ | 534 |
The Company also sponsors an executive nonqualified deferred compensation plan. Participants may elect to defer a percentage of their earned wages to the plan. The Company may, at its discretion, provide matching and profit-sharing contributions under this plan. The Company has not elected to
F-39
MATTRESS FIRM HOLDING CORP.
NOTES TO CONSOLIDATED FINANCIAL STATEMENTS (Continued)
13. Retirement Plans (Continued)
make any discretionary contributions. The plan assets and related deferred compensation liability included in other assets and other noncurrent liabilities at February 1, 2011, January 31, 2012 and July 31, 2012, were approximately $1.1 million, $0.9 million and $1.0 million, respectively. The plan assets are held within a rabbi trust and are restricted from Company access.
14. Stock-Based Compensation
Class B Units—Mattress Holdings, LLC, the parent of Mattress Firm Holding Corp., established a class of equity ownership units ("Class B Units") that were issued primarily to employees of the Company for future services at the discretion of the board of managers of Mattress Holdings, LLC. Class B Units that have been issued will remain outstanding until the date that Mattress Holdings, LLC is ultimately dissolved, except for Class B Units that are forfeited. There is no stated limit on the number of Class B Units that may be issued, although the Company does not intend to issue additional Class B Units subsequent to November 23, 2011. Each holder of vested Class B Units is entitled to its pro rata share of future distributions to the equity owners of Mattress Holdings, LLC after certain other equity holders have received aggregate preferred distributions equal to the greater of (i) $154.3 million or (ii) the fair value of Mattress Holdings, LLC's equity on the relevant grant date of the Class B Units. Each Class B Unit grant is comprised of four tranches with separate vesting criteria. The B-1 tranche comprises 40% of the total units granted and vests over five years in 20% increments on each grant's anniversary date. Any unvested portion of the B-1 tranche fully vests immediately prior to the earlier of a change of control or the completion of an initial public offering (such change of control or initial public offering, a ("Liquidity Event"). The B-2 tranche, which comprises 40% of the total units granted, and the B-3 and B-4 tranches, each of which comprises 10% of the total units granted, vest in their entirety upon the expiration of lock-up agreements entered into by J.W. Childs and its affiliates ("Lock-up Agreements") in connection with the initial public offering if the return on investment to JWC Mattress Holdings, LLC meets or exceeds established thresholds. Holders of Class B Units who are employees of the Company are subject to forfeiture of all or a portion of Class B Units upon termination of employment.
The shares of common stock of Mattress Firm Holding Corp. held by Mattress Holdings, LLC will be distributed to its unit holders, including holders of Class B Units, at a date determined by J.W. Childs, although no sooner than May 15, 2012, in connection with the dissolution of Mattress Holdings, LLC, and the determination of the number of shares that each unit holder will be entitled to receive in such distribution will be determined as of May 15, 2012.
The method used by the Company to estimate the fair value of Class B Unit grants was based upon a two-step process as of the date of each award. The first step involved valuation of the Company and the related after-debt value attributable to the equity owners.
The Company's fair value for grants of Class B Unit awards was based upon a composite of values determined by a market approach, using both market multiple and comparable transaction methodologies, and a discounted cash flow methodology. The second step to valuing Class B Units involved the allocation of the total equity value determined on each grant date among the Class B Units and other equity holders using a probability-weighted expected return methodology. Under this method, the allocation of equity value to Class B units was determined for a number of possible outcomes, with each outcome weighted based upon management's estimate of the likelihood of such outcome. The outcomes considered were: (1) ongoing operations without a Liquidity Event,
F-40
MATTRESS FIRM HOLDING CORP.
NOTES TO CONSOLIDATED FINANCIAL STATEMENTS (Continued)
14. Stock-Based Compensation (Continued)
(2) Liquidity Event resulting from a merger or sale to another party, (3) Liquidity Event resulting from an initial public offering of the Company's common stock and (4) a distressed sale.
The estimated weighted average fair value per unit of Class B Units issued was approximately $0.24 and $0.23 during Fiscal 2009 and Fiscal 2010, respectively. The fair value of the Class B Unit awards, net of estimated forfeitures, is recognized as expense over terms that range from 2.5 years to 2.9 years, which are based upon the timing and weighting of the expected outcomes derived from the fair value calculation. Stock-based compensation expense (benefit) recognized in the consolidated results of operations related to the Class B Units was approximately $84,000, ($515,000), and approximately $151,000 during Fiscal 2009, Fiscal 2010 and Fiscal 2011, respectively. No income tax benefits are expected to be recognized by the Company with respect to the issuance and subsequent vesting of Class B Units. Compensation expense recorded during Fiscal 2010 included the effect of forfeitures that occurred during Fiscal 2010 that were in excess of previous estimates and which resulted in the reversal of previously recognized expense in the amount of approximately $575,000.
A summary of the status of unvested Class B Units at January 31, 2012, and changes during Fiscal 2011 is as follows (unit amounts in thousands):
| |
Class B Units | Weighted Average Grant-Date Fair Value |
|||||
|---|---|---|---|---|---|---|---|
Unvested at February 1, 2011 |
1,628 | $ | 0.89 | ||||
Granted |
— | — | |||||
Vested |
(313 | ) | 0.61 | ||||
Forfeited |
(38 | ) | 0.23 | ||||
Unvested at January 31, 2012 |
$ | 1,277 | $ | 0.98 | |||
The total fair value of Class B Units, as determined on the respective grant dates, was approximately $234,000, $132,000 and $192,000 for Class B Units that vested during Fiscal 2009, Fiscal 2010 and Fiscal 2011, respectively.
As of January 31, 2012, there was approximately $20,000 of total unrecognized compensation costs related to unvested Class B Units that will be recognized as expense during Fiscal 2012.
2011 Omnibus Incentive Plan—On November 3, 2011, the Company's Board of Directors adopted the Mattress Firm Holding Corp. 2011 Omnibus Incentive Plan to provide for the grant of equity-based awards to Company employees, directors and other service providers. A total of 4,206,000 shares of the Company's common stock have been reserved for future grants under the 2011 Omnibus Incentive Plan. On November 17, 2011, the Company granted certain employees stock options with respect to an aggregate of 1,247,553 shares of the Company's common stock at an exercise price equal to the initial public offering price of $19.00 per share, with an estimated fair value of $8.50 per share. One-half of the stock options granted to the Company's employees are subject to a five-year time-based vesting schedule, while the remaining one-half of the stock options are subject to a four-year market-based vesting schedule, with such vesting based on specified stock price increase targets, as set forth in the option award agreement evidencing the grant of such stock options.
F-41
MATTRESS FIRM HOLDING CORP.
NOTES TO CONSOLIDATED FINANCIAL STATEMENTS (Continued)
14. Stock-Based Compensation (Continued)
The following assumptions were used to calculate the fair value of the Company's time-based stock options on the date of grant utilizing the Black-Scholes option pricing model:
Risk-free interest rate |
1.28 | % | ||
Dividend yield |
0 | % | ||
Volatility factor |
55 | % | ||
Weighted average expected life (in years) |
6.5 |
The following assumptions were used to calculate the fair value of the Company's market-based stock options on the grant date utilizing a Monte Carlo Simulation approach:
Risk-free interest rate |
1.28 | % | ||
Dividend yield |
0 | % | ||
Volatility factor |
55 | % | ||
Suboptimal exercise factor |
2.5 | x |
A summary of the status of outstanding stock options at January 31, 2012, and changes during Fiscal 2011 is as follows (stock option amounts in thousands):
| |
Stock Options |
Weighted Average Exercise Price Per Share |
|||||
|---|---|---|---|---|---|---|---|
Outstanding at February 1, 2011 |
— | $ | — | ||||
Granted |
1,248 | 19.00 | |||||
Exercised |
— | — | |||||
Forfeited |
(24 | ) | 19.00 | ||||
Outstanding at January 31, 2012 |
1,224 | $ | 19.00 | ||||
Exercisable at January 31, 2012 |
— | $ | — | ||||
Weighted average fair value per option granted |
$ | 8.50 | |||||
There were no stock options exercised during Fiscal 2011 and no tax benefits from the exercise of stock options have been recognized. Any future excess tax benefits derived from the exercise of stock options will be recorded prospectively and reported as cash flows from financing activities.
There were approximately 3.0 million shares available for future grants under the stock incentive plan as of January 31, 2012. Vesting dates on the stock options range from November 17, 2012 to November 17, 2016. The expiration date of all stock options that are currently outstanding is November 17, 2021.
Stock-based compensation expense recognized in the consolidated results of operations related to the stock options was approximately $372,000 during Fiscal 2011. As of January 31, 2012, there was approximately $8.1 million of total unrecognized compensation costs related to the stock options that will be recognized as expense over a remaining weighted average period of 4.33 years. The total intrinsic value of options outstanding as of January 31, 2012 was approximately $17.2 million.
F-42
MATTRESS FIRM HOLDING CORP.
NOTES TO CONSOLIDATED FINANCIAL STATEMENTS (Continued)
15. Supplemental Statement of Cash Flow Information
Supplemental information to the statement of cash flows is as follows (amounts in thousands):
| |
Fiscal 2009 |
Fiscal 2010 |
Fiscal 2011 |
|||||||
|---|---|---|---|---|---|---|---|---|---|---|
Interest paid |
$ | 7,370 | $ | 6,430 | $ | 7,512 | ||||
Net taxes paid |
$ | 368 | $ | 674 | $ | 2,490 | ||||
Noncash Investing and Financing Activities—Assets acquired, liabilities assumed and debt issued in connection with business combinations are described in Note 2. Noncash interest expense including amounts accrued in other noncurrent liabilities and added to the outstanding principal balance of the 2009 Loan Facility, PIK Notes and Convertible Notes totaled $17.7 million, $23.2 million and $20.6 million for Fiscal 2009, Fiscal 2010 and Fiscal 2011, respectively.
On November 23, 2011, in connection with the initial public offering, the PIK Notes and Convertible Notes were either repaid or converted into shares of our common stock. As a result of the transaction, $90.7 million in debt and $3.9 million in accrued interest was converted to stockholders' equity.
16. Quarterly Results of Operations (Unaudited)
| |
1st Quarter | 2nd Quarter | 3rd Quarter | 4th Quarter | |||||||||||||||||||||
|---|---|---|---|---|---|---|---|---|---|---|---|---|---|---|---|---|---|---|---|---|---|---|---|---|---|
| |
FY 2010 | FY 2011 | FY 2010 | FY 2011 | FY 2010 | FY 2011 | FY 2010 | FY 2011 | |||||||||||||||||
Net sales |
$ | 108,363 | $ | 151,924 | $ | 127,583 | $ | 179,914 | $ | 130,675 | $ | 183,514 | $ | 127,494 | $ | 188,558 | |||||||||
Cost of sales |
71,677 | 95,946 | 79,436 | 109,281 | 82,410 | 110,106 | 80,439 | 112,685 | |||||||||||||||||
Gross profit from retail operations |
36,686 | 55,978 | 48,147 | 70,633 | 48,265 | 73,408 | 47,055 | 75,873 | |||||||||||||||||
Franchise fees and royalty income |
593 | 987 | 827 | 1,085 | 832 | 1,329 | 943 | 1,296 | |||||||||||||||||
|
37,279 | 56,965 | 48,974 | 71,718 | 49,097 | 74,737 | 47,998 | 77,169 | |||||||||||||||||
Operating expenses: |
|||||||||||||||||||||||||
Sales and marketing expenses |
24,213 | 35,637 | 30,132 | 45,077 | 29,135 | 41,420 | 30,483 | 45,471 | |||||||||||||||||
General and administrative expenses |
8,770 | 11,770 | 7,463 | 12,357 | 8,398 | 11,638 | 9,480 | 15,919 | |||||||||||||||||
Goodwill impairment charge |
— | — | — | — | — | — | 536 | — | |||||||||||||||||
Loss on store closings and impairment of store assets |
548 | 174 | (101 | ) | (135 | ) | 67 | 285 | 1,972 | 435 | |||||||||||||||
Total operating expenses |
33,531 | 47,581 | 37,494 | 57,299 | 37,600 | 53,343 | 42,471 | 61,825 | |||||||||||||||||
Income from operations |
3,748 | 9,384 | 11,480 | 14,419 | 11,497 | 21,394 | 5,527 | 15,344 | |||||||||||||||||
Other expense (income): |
|||||||||||||||||||||||||
Interest income |
— | (2 | ) | (1 | ) | (1 | ) | — | (1 | ) | (5 | ) | (5 | ) | |||||||||||
Interest expense |
7,360 | 8,277 | 7,664 | 8,672 | 7,828 | 8,530 | 8,211 | 3,831 | |||||||||||||||||
Loss from debt extinguishment |
— | — | — | 1,873 | — | — | — | 3,831 | |||||||||||||||||
|
7,360 | 8,275 | 7,663 | 10,544 | 7,828 | 8,529 | 8,206 | 7,657 | |||||||||||||||||
Income (loss) before income taxes |
(3,612 | ) | 1,109 | 3,817 | 3,875 | 3,669 | 12,865 | (2,679 | ) | 7,687 | |||||||||||||||
Income tax expense (benefit) |
(1,764 | ) | 80 | 1,865 | 239 | 1,791 | 551 | (1,046 | ) | (9,685 | ) | ||||||||||||||
Net income (loss) |
$ | (1,848 | ) | $ | 1,029 | $ | 1,952 | $ | 3,636 | $ | 1,878 | $ | 12,314 | $ | (1,633 | ) | $ | 17,372 | |||||||
Basic and diluted net income per common share |
$ | (0.08 | ) | $ | 0.05 | $ | 0.09 | $ | 0.16 | $ | 0.08 | $ | 0.55 | $ | (0.07 | ) | $ | 0.56 | |||||||
Due to the method of calculating weighted average common shares outstanding, the sum of the quarterly per share amounts may not equal net earnings per common share attributable to common shareholders for the respective years.
F-43
MATTRESS FIRM HOLDING CORP.
NOTES TO CONSOLIDATED FINANCIAL STATEMENTS (Continued)
16. Quarterly Results of Operations (Unaudited) (Continued)
As further described in Note 5, interest expense decreased $4.4 million in the fourth quarter of Fiscal 2011 as compared to the fourth quarter of Fiscal 2010 as a result of the payment and conversion of $188.0 million of debt in connection with the initial public offering.
As further described in Note 5, on July 19, 2011, the Company made a voluntary prepayment of $40.0 million under the 2009 Loan Facility. In connection with the voluntary prepayment, the Company recognized a loss on debt extinguishment in the amount of $1.9 million in the second quarter of Fiscal 2011. In addition, on November 23, 2011 the Company used $88.8 million of the net proceeds from the initial public offering to repay in full all amounts outstanding under the 2009 Loan Facility. In connection with the voluntary prepayment, the Company recognized a loss on debt extinguishment in the amount of $3.8 million in the fourth quarter of Fiscal 2011.
As further described in Note 6, the Company recognized a deferred tax benefit during Fiscal 2011 in the amount of $20.1 million, consisting of a $5.9 million reduction in the third quarter of Fiscal 2011 resulting from the utilization of deferred tax assets, primarily net operating loss carryforwards, and a $14.2 million reduction in the fourth quarter of Fiscal 2011 resulting from the year-end evaluation supporting that deferred tax assets will be realized in future periods.
17. Subsequent Events
Subsequent events evaluated through April 20, 2012
On April 9, 2012, the Company entered into an agreement for the purchase of all of the equity interests of MGHC Holding Corporation for approximately $44 million in cash, subject to customary purchase-price adjustments. The Company expects that the transaction, which remains subject to customary closing conditions, will be completed during its second fiscal quarter ending July 31, 2012. The Company expects to fund the majority of the purchase price from cash reserves.
Subsequent events occurring after April 20, 2012 and through September 19, 2012
On May 2, 2012, as further described in Note 2, the Company completed the acquisition of all of the equity interests of MGHC Holding Corporation.
On August 28, 2012, the Company paid off the outstanding revolver borrowings on the 2007 Senior Credit Facility of $5.0 million. At September 7, 2012, there were standby letters of credit outstanding in the amount of $1.0 million and additional borrowings available of $34.0 million.
On September 4, 2012, the Company entered into an agreement to acquire the leasehold interests, store assets, distribution center assets and related inventories, and assume certain liabilities, of Mattress Xpress, Inc. and Mattress Xpress of Georgia, Inc. (collectively "Mattress Xpress") relating to the operation of 35 mattress specialty stores located in Florida and Georgia for a total purchase price of approximately $15.8 million, subject to customary adjustments. Under the terms of the purchase agreement, Mattress Xpress will provide unsecured financing to the Company in the amount of approximately $7.8 million in connection with the purchase, which will be payable over a term of one year in quarterly installments, including interest at 8%. The closing of the purchase is expected to occur in the third fiscal quarter of 2012 and remains subject to the prior satisfaction of customary closing conditions. The Company intends to rebrand the stores as Mattress Firm subsequent to the closing of the transaction.
F-44
Independent Auditor's Report
To
the Board of Directors and Stockholders
MGHC Holding Corporation and Subsidiaries
Dallas, Texas
We have audited the accompanying consolidated balance sheets of MGHC Holding Corporation and Subsidiaries as of January 1, 2011 and December 31, 2011, and the related consolidated statements of operations, stockholders' deficit and cash flows for each of the three fiscal years in the period ended December 31, 2011. These financial statements are the responsibility of the Company's management. Our responsibility is to express an opinion on these financial statements based on our audits.
We conducted our audits in accordance with auditing standards generally accepted in the United States of America. Those standards require that we plan and perform the audit to obtain reasonable assurance about whether the financial statements are free of material misstatement. An audit includes examining, on a test basis, evidence supporting the amounts and disclosures in the financial statements. An audit also includes assessing the accounting principles used and significant estimates made by management, as well as evaluating the overall financial statement presentation. We believe that our audits provide a reasonable basis for our opinion.
In our opinion, the consolidated financial statements referred to above present fairly, in all material respects, the financial position of MGHC Holding Corporation and Subsidiaries as of January 1, 2011 and December 31, 2011, and the results of their operations and their cash flows for each of the three fiscal years in the period ended December 31, 2011 in conformity with accounting principles generally accepted in the United States of America.
/s/
McGladrey LLP
Dallas, Texas
June 29, 2012
F-45
MGHC Holding Corporation and Subsidiaries
Consolidated Balance Sheets
(In thousands, except share and per share amounts)
| |
January 1, 2011 |
December 31, 2011 |
March 31, 2012 |
|||||||
|---|---|---|---|---|---|---|---|---|---|---|
| |
|
|
(unaudited) |
|||||||
ASSETS |
||||||||||
Current assets: |
||||||||||
Accounts receivable, less allowance for doubtful accounts of $251, $50 and $49, respectively |
$ | 2,229 | $ | 3,051 | $ | 2,969 | ||||
Inventories |
8,928 | 4,452 | 4,787 | |||||||
Prepaid rent |
— | 2,533 | 2,428 | |||||||
Prepaid expenses |
1,142 | 1,043 | 806 | |||||||
Total current assets |
12,299 | 11,079 | 10,990 | |||||||
Property and equipment, net |
5,860 | 2,995 | 2,854 | |||||||
Other assets, net |
2,292 | 2,211 | 2,265 | |||||||
Goodwill |
25,328 | 22,766 | 22,766 | |||||||
Intangible assets |
46,989 | 18,863 | 18,863 | |||||||
Total assets |
$ | 92,768 | $ | 57,914 | $ | 57,738 | ||||
LIABILITIES AND STOCKHOLDERS' DEFICIT |
||||||||||
Current liabilities: |
||||||||||
Current portion of long-term debt |
$ | 519 | $ | 449 | $ | 449 | ||||
Bank overdraft |
1,835 | 3,383 | 2,482 | |||||||
Accounts payable |
18,445 | 14,115 | 13,586 | |||||||
Accrued expenses and other current liabilities |
7,500 | 5,897 | 4,467 | |||||||
Customer deposits |
2,439 | 1,710 | 1,355 | |||||||
Total current liabilities |
30,738 | 25,554 | 22,339 | |||||||
Deferred rent |
7,979 | 4,009 | 3,759 | |||||||
Deferred income taxes |
16,860 | 12,271 | 12,271 | |||||||
Long-term debt, less current portion |
58,751 | 19,977 | 23,616 | |||||||
Other noncurrent liabilities |
644 | 1,386 | 1,352 | |||||||
Total liabilities |
114,972 | 63,197 | 63,337 | |||||||
Commitments and contingencies (Note 9) |
||||||||||
Stockholders' deficit: |
||||||||||
Common stock, $.001 par value, authorized 20,000,000 shares as of January 1, 2011 and 3,000,000 shares as of December 31, 2011 and March 31, 2012; issued and outstanding 16,937,200 as of January 1, 2011, 1,722,500 as of December 31, 2011 and March 31, 2012, |
17 | 2 | 2 | |||||||
Additional paid-in capital |
147,111 | 189,430 | 189,492 | |||||||
Accumulated deficit |
(169,332 | ) | (194,715 | ) | (195,093 | ) | ||||
Total stockholders' deficit |
(22,204 | ) | (5,283 | ) | (5,599 | ) | ||||
Total liabilities and stockholders' deficit |
$ | 92,768 | $ | 57,914 | $ | 57,738 | ||||
See Notes to Consolidated Financial Statements.
F-46
MGHC Holding Corporation and Subsidiaries
Consolidated Statements of Operations
(In thousands)
| |
|
|
|
Thirteen Weeks Ended | ||||||||||||
|---|---|---|---|---|---|---|---|---|---|---|---|---|---|---|---|---|
| |
Fiscal 2009 |
Fiscal 2010 |
Fiscal 2011 |
April 2, 2011 |
March 31, 2012 |
|||||||||||
| |
|
|
|
(unaudited) |
(unaudited) |
|||||||||||
Net sales |
$ | 142,251 | $ | 147,667 | $ | 128,155 | $ | 33,855 | $ | 31,825 | ||||||
Cost of sales |
107,120 | 113,425 | 93,405 | 24,591 | 22,791 | |||||||||||
Gross profit |
35,131 | 34,242 | 34,750 | 9,264 | 9,034 | |||||||||||
Sales and marketing expenses |
32,180 | 34,705 | 27,683 | 6,333 | 6,655 | |||||||||||
General and administrative expenses |
17,279 | 14,001 | 12,627 | 3,630 | 2,911 | |||||||||||
Intangible asset impairment charge |
— | — | 19,049 | — | — | |||||||||||
Loss on store closings and impairment of store assets |
— | 720 | 546 | 179 | — | |||||||||||
Total operating expenses |
49,459 | 49,426 | 59,905 | 10,142 | 9,566 | |||||||||||
Loss from operations |
(14,328 | ) | (15,184 | ) | (25,155 | ) | (878 | ) | (532 | ) | ||||||
Other income (expense): |
||||||||||||||||
Gain on debt restructuring |
30,691 | — | — | — | — | |||||||||||
Interest income |
7 | — | — | — | 1 | |||||||||||
Interest expense |
(9,574 | ) | (295 | ) | (365 | ) | (82 | ) | (97 | ) | ||||||
Miscellaneous income, net |
222 | 79 | 95 | 65 | 182 | |||||||||||
Other income (expense), net |
21,346 | (216 | ) | (270 | ) | (17 | ) | 86 | ||||||||
Income (loss) from continuing operations before provision for (benefit from) income taxes |
7,018 | (15,400 | ) | (25,425 | ) | (895 | ) | (446 | ) | |||||||
Provision for (benefit from) income taxes |
(1,019 | ) | 64 | (6,717 | ) | 34 | 33 | |||||||||
Income (loss) from continuing operations |
8,037 | (15,464 | ) | (18,708 | ) | (929 | ) | (479 | ) | |||||||
Income (loss) from discontinued operations, net of tax expense of $0 in fiscal 2009, fiscal 2010 and for the thirteen weeks ended April 2, 2011 and March 31, 2012, and $2,277 in fiscal 2011. |
(3,973 | ) | (4,436 | ) | (6,675 | ) | (1,080 | ) | 101 | |||||||
Net income (loss) |
$ | 4,064 | $ | (19,900 | ) | $ | (25,383 | ) | $ | (2,009 | ) | $ | (378 | ) | ||
See Notes to Consolidated Financial Statements.
F-47
MGHC Holding Corporation and Subsidiaries
Consolidated Statements of Stockholders' Deficit
(In thousands, except for share amounts)
| |
Common Stock | |
|
|
||||||||||||
|---|---|---|---|---|---|---|---|---|---|---|---|---|---|---|---|---|
| |
Additional Paid-In Capital |
Accumulated Deficit |
Total Stockholders' Deficit |
|||||||||||||
| |
Shares | Amount | ||||||||||||||
Balance, December 27, 2008 |
10,164,571 | $ | 101,646 | $ | 6,562 | $ | (153,496 | ) | $ | (45,288 | ) | |||||
Reverse stock split |
(10,164,561 | ) | (101,646 | ) | 101,646 | — | — | |||||||||
Stock option expense |
— | — | 1,718 | — | 1,718 | |||||||||||
Issuance of stock |
16,937,190 | 17 | 16,920 | — | 16,937 | |||||||||||
Related party debt extinguishment |
— | — | 20,265 | — | 20,265 | |||||||||||
Net income |
— | — | — | 4,064 | 4,064 | |||||||||||
Balance, December 26, 2009 |
16,937,200 | 17 | 147,111 | (149,432 | ) | (2,304 | ) | |||||||||
Net loss |
— | — | — | (19,900 | ) | (19,900 | ) | |||||||||
Balance, January 1, 2011 |
16,937,200 | 17 | 147,111 | (169,332 | ) | (22,204 | ) | |||||||||
Cancellation of outstanding stock |
(16,937,200 | ) | (17 | ) | 17 | — | — | |||||||||
Issuance of new stock |
1,322,500 | 2 | 13,223 | — | 13,225 | |||||||||||
Related party debt extinguishment in exchange for stock and warrants |
400,000 | — | 28,898 | — | 28,898 | |||||||||||
Stock option expense |
— | — | 181 | — | 181 | |||||||||||
|
— | |||||||||||||||
Net loss |
— | — | — | (25,383 | ) | (25,383 | ) | |||||||||
Balance, December 31, 2011 |
1,722,500 | 2 | 189,430 | (194,715 | ) | (5,283 | ) | |||||||||
Stock option expense (unaudited) |
— | — | 62 | — | 62 | |||||||||||
Net loss (unaudited) |
— | — | — | (378 | ) | (378 | ) | |||||||||
Balance, March 31, 2012 (unaudited) |
1,722,500 | $ | 2 | $ | 189,492 | $ | (195,093 | ) | $ | (5,599 | ) | |||||
See Notes to Consolidated Financial Statements.
F-48
MGHC Holding Corporation and Subsidiaries
Consolidated Statements of Cash Flows
(In thousands)
| |
|
|
|
Thirteen Weeks Ended | ||||||||||||
|---|---|---|---|---|---|---|---|---|---|---|---|---|---|---|---|---|
| |
Fiscal 2009 |
Fiscal 2010 |
Fiscal 2011 |
April 2, 2011 |
March 31, 2012 |
|||||||||||
| |
|
|
|
(unaudited) |
(unaudited) |
|||||||||||
Cash flows from operating activities: |
||||||||||||||||
Net income (loss) |
$ | 4,064 | $ | (19,900 | ) | $ | (25,383 | ) | $ | (2,009 | ) | $ | (378 | ) | ||
Adjustments to reconcile net income (loss) to net cash provided by (used in) operating activities: |
||||||||||||||||
Depreciation and amortization |
4,829 | 3,683 | 2,061 | 925 | 300 | |||||||||||
Impairment losses |
— | 1,067 | 19,187 | — | — | |||||||||||
Loss on disposal of discontinued operations |
— | — | 3,450 | — | — | |||||||||||
Deferred income taxes |
463 | (76 | ) | (5,973 | ) | — | — | |||||||||
Stock compensation expense |
1,718 | — | 181 | — | 62 | |||||||||||
Amortization of deferred financing fees |
673 | — | 68 | 12 | 18 | |||||||||||
Interest converted to subordinated debt |
6,760 | — | — | — | — | |||||||||||
Gain on debt restructuring |
(30,691 | ) | — | — | — | — | ||||||||||
Changes in: |
||||||||||||||||
Accounts receivable |
1,714 | 3,473 | 259 | (711 | ) | 82 | ||||||||||
Inventories |
(909 | ) | 9,433 | 904 | 475 | (335 | ) | |||||||||
Prepaid rent |
— | — | (2,533 | ) | (4,087 | ) | 105 | |||||||||
Prepaid expenses |
4,927 | 321 | (141 | ) | (65 | ) | 151 | |||||||||
Accounts payable |
8,634 | 745 | (4,330 | ) | (6,050 | ) | (529 | ) | ||||||||
Accrued expenses and other liabilities |
162 | 837 | (2,222 | ) | (1,439 | ) | (1,452 | ) | ||||||||
Customer deposits |
(166 | ) | 429 | (729 | ) | (21 | ) | (355 | ) | |||||||
Receivable for income taxes |
(1,583 | ) | 1,583 | — | — | 22 | ||||||||||
Deferred rent |
(146 | ) | 324 | (2,299 | ) | (846 | ) | (250 | ) | |||||||
Vendor advances |
(2,803 | ) | (51 | ) | 1,058 | 1,292 | (25 | ) | ||||||||
Net cash provided by (used in) operating activities |
(2,354 | ) | 1,868 | (16,442 | ) | (12,524 | ) | (2,584 | ) | |||||||
Cash flows from investing activities: |
||||||||||||||||
Change in other assets |
(1,304 | ) | 811 | 86 | 28 | (3 | ) | |||||||||
Purchase of property and equipment |
(710 | ) | (664 | ) | (691 | ) | (79 | ) | (152 | ) | ||||||
Proceeds from sale of discontinued operations |
— | — | 12,470 | — | — | |||||||||||
Net cash provided by (used in) investing activities |
(2,014 | ) | 147 | 11,865 | (51 | ) | (155 | ) | ||||||||
Cash flows from financing activities: |
||||||||||||||||
Capital contribution from stock issuance |
12,000 | — | 13,225 | 13,125 | — | |||||||||||
Debt restructuring fees |
(1,181 | ) | — | (392 | ) | (368 | ) | — | ||||||||
Payments on term loan |
(4,371 | ) | (849 | ) | (3,904 | ) | (96 | ) | (60 | ) | ||||||
Change in bank overdraft |
(4,119 | ) | (996 | ) | 1,548 | 3,314 | (901 | ) | ||||||||
Borrowings from revolver |
36,968 | 78,835 | 65,375 | 18,400 | 13,100 | |||||||||||
Payments on revolver |
(34,929 | ) | (79,005 | ) | (71,275 | ) | (21,800 | ) | (9,400 | ) | ||||||
Net cash provided by (used in) financing activities |
4,368 | (2,015 | ) | 4,577 | 12,575 | 2,739 | ||||||||||
Net change in cash |
— | — | — | — | — | |||||||||||
Cash, beginning of period |
— | — | — | — | — | |||||||||||
Cash, end of period |
$ | — | $ | — | $ | — | $ | — | $ | — | ||||||
Supplemental disclosures of cash flow information: |
||||||||||||||||
Total income taxes paid (refunded), net |
$ | 128 | $ | (1,436 | ) | $ | 135 | $ | (8 | ) | $ | 13 | ||||
Total interest paid |
$ | 2,200 | $ | 454 | $ | 588 | $ | 104 | $ | 101 | ||||||
Noncash investing and financing activities: |
||||||||||||||||
Debt to equity conversion |
$ | 4,937 | $ | — | $ | 4,919 | $ | 4,919 | $ | — | ||||||
Related party debt extinguishment |
$ | 20,678 | $ | — | $ | 24,121 | $ | 24,121 | $ | — | ||||||
See Notes to Consolidated Financial Statements.
F-49
MGHC Holding Corporation and Subsidiaries
Notes to Consolidated Financial Statements
Note 1. Description of Business and Organization
Description of Business
MGHC Holding Corporation (MGHC or Holding Corporation) is a Delaware corporation formed on June 13, 2006, and the parent of Mattress Giant Acquisition Corporation, a retailer of specialty bedding and related furniture items operating 194 stores throughout the United States under the name "Mattress Giant". MGHC was majority owned by funds controlled by Freeman Spogli Equity Partners V, Limited Partnership (Freeman Spogli) (see Note 13). MGHC and its subsidiaries are collectively referred to herein as the "Company".
Note 2. Significant Accounting Policies
Principles of Consolidation
The consolidated financial statements include the accounts of MGHC Holding Corporation and its subsidiaries. Intercompany balances and transactions have been eliminated in consolidation.
Fiscal Period
The fiscal period of the Company is based on a 52 or 53-week calendar, which ends on the Saturday closest to December 31. The fiscal years ended December 26, 2009 (fiscal 2009), January 1, 2011 (fiscal 2010) and December 31, 2011 (fiscal 2011) were 52, 53 and 52-week periods, respectively.
Unaudited Interim Financial Information
The accompanying consolidated balance sheet as of March 31, 2012 and the consolidated statements of operations and cash flows for the thirteen-week periods ended April 2, 2011 and March 31, 2012 and the consolidated statement of stockholders' deficit for the thirteen weeks ended March 31, 2012 are unaudited. The unaudited interim financial statements have been prepared on the same basis as the annual consolidated financial statements and, in the opinion of management, reflect all adjustments, which include only normal recurring adjustments, necessary to present fairly the Company's financial position and results of operations and cash flows for the thirteen-week periods ended April 2, 2011 and March 31, 2012. The financial data and the other information disclosed in these notes to the consolidated financial statements related to the thirteen-week periods are unaudited. The results of the thirteen weeks ended April 2, 2011 and March 31, 2012 are not necessarily indicative of the result to be expected for the fiscal year ending December 30, 2012 or for any other interim period or other future year.
Business Concentrations
In fiscal 2009, 2010 and 2011, merchandise purchased from the Company's top six vendors represented approximately 92%, 96% and 94% of Company purchases, respectively. The Company expects to continue to obtain a significant percentage of its merchandise from these vendors in future periods. While the Company generally considers its relationships satisfactory, given the significant concentration of its purchases from a few key vendors, its access to merchandise that is considered appropriate for its stores may be subject to the policies and practices of these key vendors.
F-50
MGHC Holding Corporation and Subsidiaries
Notes to Consolidated Financial Statements (Continued)
Note 2. Significant Accounting Policies (Continued)
Use of Estimates
The preparation of the consolidated financial statements in conformity with U.S. generally accepted accounting principles requires management of the Company to make a number of estimates and assumptions relating to the reported amounts of certain assets and liabilities and disclosure of contingent assets and liabilities at the date of the consolidated financial statements and the reported amounts of revenues and expenses during the period. The principal estimates used in the preparation of these financial statements are allowances for bad debts and inventory valuation, impairment of long-lived assets and goodwill, and self-insurance reserves. Actual results could differ from those estimates and are reported in the period they become known.
Accounts Receivable
Accounts receivable consist primarily of allowances due from vendors, credit card processors and trade receivables. The allowance for doubtful accounts is the Company's best estimate of the amount of probable credit losses in the Company's existing accounts receivable, and is based on historical experience and other currently available evidence. Historically, the Company has not experienced significant losses related to its accounts receivable. Collateral is generally not required and interest is not charged on past due accounts. Account balances are charged off against the allowance after all means of collection have been exhausted and the potential for recovery is considered remote.
Inventories
Inventories are accounted for at the lower of cost, using the first-in, first-out (FIFO) method, or market. All inventories are goods held for resale.
Property and Equipment
Property and equipment are stated at cost and depreciated using the straight-line method over the estimated useful lives or the related lease terms (in the case of leasehold improvements), if shorter. When assets are retired or otherwise disposed of, the cost and related accumulated depreciation are removed from the accounts and any resulting gain or loss is reflected in income for the period. The cost of maintenance and repairs is charged to expense as incurred, whereas significant renewals and improvements are capitalized.
Leasehold Interests
The Company has favorable and unfavorable leasehold interests subject to amortization over periods of 3 to 7 years. Favorable leasehold interests are included in intangible assets and were fully amortized as of January 1, 2011. Unfavorable leasehold interests are included in other noncurrent liabilities and have a net carrying amount of approximately $349,000 and $36,000 as of January 1, 2011 and December 31, 2011, respectively. Amortization expense for favorable leasehold interests was approximately $1,134,000 and $480,000 for fiscal 2009 and 2010, respectively. For unfavorable leasehold interests the amortization was approximately $315,000, $271,000 and $152,000 in fiscal 2009, 2010 and 2011, respectively.
F-51
MGHC Holding Corporation and Subsidiaries
Notes to Consolidated Financial Statements (Continued)
Note 2. Significant Accounting Policies (Continued)
Impairment of Long-Lived Assets
Impairment of long-lived assets, other than goodwill and assets with indefinite lives, is evaluated under Accounting Standards Codification (ASC) 360-10, Accounting for the Impairment or Disposal of Long-Lived Assets, which requires impairment losses to be recorded on long-lived assets used in operations when indicators of impairment are present and the undiscounted cash flows estimated to be generated by those assets are less than the assets' carrying amount. If the carrying value of the related asset exceeds the undiscounted cash flows, the carrying value is reduced to its fair value. Various factors, including future sales growth and profit margins, are included in this analysis. If the estimated future cash flows are less than the carrying value of the assets, an impairment charge is recorded equal to the difference between the asset's fair value and carrying value. The Company tests long-lived assets when events and circumstances indicate that the carrying value of these assets may exceed their current fair value. Since the projection of future cash flows involves judgment and estimates, differences in circumstances or estimates could produce different results (see Note 8).
Goodwill and Other Intangible Assets
Goodwill represents the excess of the aggregate purchase price over the fair value of the net assets acquired in a purchase business combination. In accordance with ASC 350, Goodwill and Other Intangible Assets, goodwill is tested annually for impairment and is tested for impairment more frequently if events and circumstances indicate that the asset might be impaired. An impairment loss is recognized to the extent that the carrying amount exceeds the asset's fair value. This determination is made at the reporting unit level and consists of two steps. First, the Company determines the fair value of a reporting unit and compares it to its carrying amount. Second, if the carrying amount of a reporting unit exceeds its fair value, an impairment loss is recognized for any excess of the carrying amount of the reporting unit's goodwill over the implied fair value of that goodwill. The implied fair value of goodwill is determined by allocating the fair value of the reporting unit in a manner similar to a purchase price allocation, in accordance with the accounting for business combinations. The residual fair value after this allocation is the implied fair value of the reporting unit goodwill. The Company performs its annual impairment test at the end of their fiscal year for each of its reporting units. No goodwill impairment was recorded during fiscal 2009, 2010 or 2011. During fiscal 2011, the Company reduced the carrying value of goodwill by approximately $2,562,000 as a result of the sale of its operations in certain markets (see Note 3).
The Company's intangible assets consist of trade names, which are not subject to amortization (indefinite lives). The impairment test for indefinite lived intangibles consists of a comparison of the fair value of the intangible asset with its carrying value. If the carrying value of the intangible asset exceeds its fair value, an impairment loss is recognized in an amount equal to that excess. The estimates of fair value of intangible assets not subject to amortization are determined using a discounted cash flow valuation methodology. Significant assumptions are inherent in this process, including estimated discount rates. Discount rate assumptions are based on an assessment of the risk inherent in the respective intangible assets. No impairment of indefinite lived intangibles was recorded during fiscal 2009 or 2010. During fiscal 2011, the Company recorded approximately $19,049,000 related to the impairment of its trade names. During fiscal 2011, the Company reduced the value of its trade names by approximately $9,077,000 as a result of the sale of its operations in certain markets (see Note 3).
F-52
MGHC Holding Corporation and Subsidiaries
Notes to Consolidated Financial Statements (Continued)
Note 2. Significant Accounting Policies (Continued)
Customer Deposits
Customer deposits consist of amounts paid by customers as deposits for layaway sales or for items that have not yet been delivered. Generally, goods are delivered to the customer within one week of payment.
Deferred Rent
The Company's leases for office space, retail stores and distribution facilities are accounted for as operating leases. Rent expense is recognized on a straight-line basis from the date the Company takes possession of the property to begin preparation of the site for occupancy to the end of the lease term, including renewal options determined to be reasonably assured. Certain lease agreements provide for tenant improvement allowances from landlords for construction of leasehold improvements for new stores. The Company capitalizes these leasehold improvements and separately records allowances received from landlords as a deferred lease credit to deferred rent on the consolidated balance sheet that is amortized on a straight-line basis over the lease term as a reduction of rent expense, which is consistent with the amortization period for the constructed assets. Certain leases provide for contingent rents that are determined as a percentage of revenues in excess of specified levels. The Company records a contingent rent liability along with the corresponding rent expense when specified levels have been achieved or when management determines that achieving the specified levels during the fiscal year is probable.
Income Taxes
Income taxes are accounted for under the asset and liability method. A current or deferred tax liability or asset is recognized for the tax consequences of all events recognized in the financial statements, measured by applying the provisions of presently enacted tax laws and rates to the temporary difference between the tax basis of an asset or liability and its reported amount in the financial statements. Deferred tax assets are reduced by a valuation allowance when, in the opinion of management, it is more likely than not that some portion or all of the deferred tax assets will not be realized. Deferred tax assets and liabilities are adjusted for the effects of the changes in tax laws and rates on the date of enactment.
On December 28, 2008, the Company adopted ASC 740-10, Accounting for Uncertainty in Income Taxes, which addresses the determination of whether tax benefits claimed or expected to be claimed on a tax return should be recorded in the financial statements. Under this guidance, the Company may recognize the tax benefit from an uncertain tax position only if it is more likely than not that the tax position will be sustained on examination by taxing authorities, based on the technical merits of the position. The tax benefits recognized in the financial statements from such a position are measured based on the largest benefit that has a greater than 50% likelihood of being realized upon ultimate settlement. The guidance on accounting for uncertainty in income taxes also addresses derecognition, classification, interest and penalties on income taxes and accounting interim periods. The Company recognizes interest accrued related to unrecognized tax benefits in interest expense and penalties as part of income tax expense. During the year ended December 31, 2011, the Company did not incur any interest and penalties. With few exceptions, the Company is no longer subject to income tax examinations by the U.S. federal, state or local tax authorities for years before 2007.
F-53
MGHC Holding Corporation and Subsidiaries
Notes to Consolidated Financial Statements (Continued)
Note 2. Significant Accounting Policies (Continued)
Income tax expense during interim periods is based on the estimated annual effective income tax rate plus any discrete items which are recorded in the period in which they occur.
Net Sales
Sales revenue, including fees collected for delivery services, is recognized upon delivery and acceptance of mattresses and bedding products by the Company's customers and is recorded net of estimated returns. Customer deposits collected prior to the delivery of merchandise are recorded as a liability. Net sales are recognized net of sales tax collected from customers and remitted to various taxing jurisdictions.
Cost of Sales, Sales and Marketing and General and Administrative Expense
The following summarizes the primary costs classified in each major expense category.
Cost of sales:
- •
- Costs associated with purchasing and delivering products to the stores and customers, net of vendor incentives earned on
the purchase of products;
- •
- Physical inventory losses;
- •
- Store and warehouse occupancy and depreciation expense of related facilities and equipment;
- •
- Store and warehouse operating costs, including warehouse labor costs and utilities, repairs and maintenance and supplies
costs of warehouse and store facilities; and
- •
- Costs to provide for customer returns and exchanges and to service customer warranty claims.
Sales and marketing expenses:
- •
- Advertising and media production;
- •
- Payroll and benefits for sales associates; and
- •
- Merchant service fees for customer credit and debit card payments, check guarantee fees and promotional financing expense.
General and administrative expenses:
- •
- Payroll and benefit costs for corporate office and regional management employees;
- •
- Stock-based compensation costs;
- •
- Occupancy costs of corporate facility;
- •
- Information systems hardware, software and maintenance;
- •
- Depreciation related to corporate assets;
- •
- Insurance; and
- •
- Other overhead costs.
F-54
MGHC Holding Corporation and Subsidiaries
Notes to Consolidated Financial Statements (Continued)
Note 2. Significant Accounting Policies (Continued)
Advertising Costs
The Company incurs advertising costs associated with print and broadcast advertisements. Such costs are expensed as incurred except for media production cost, which are deferred and charged to expense in the period that the advertisement initially appears. The Company records advertising funds received from vendors related to holiday-specific or event-specific promotions as a reduction of advertising expense. Net advertising expenses were approximately $10,608,000, $10,554,000 and $8,573,000 for fiscal 2009, 2010 and 2011, respectively, and $882,000 and $1,219,000 for the thirteen weeks ended April 2, 2011 and March 31, 2012, respectively.
Vendor Allowances
Vendor allowances are received by the Company from its vendors through a variety of programs and arrangements, including purchase discounts, purchase rebates, volume rebates, new store credits, floor sample discounts and purchase price protections. Purchase rebates, volume rebates, floor sample discounts and purchase price protections are recorded as a reduction of the inventory cost and included as a reduction of cost of sales when the related inventory is sold. New store credits are recorded as a reduction of cost of sales over the contractual term of the agreement, if a formal agreement exists, or 12 months, if no formal agreement exists. At January 1, 2011, December 31, 2011 and March 31, 2012, the Company had amounts receivable through such programs totaling approximately $417,000, $236,000 and $408,000, respectively, that were included in accounts receivable. Advanced payments from vendors are included in accrued expenses and other noncurrent liabilities totaling approximately $295,000, $1,351,000 and $1,325,000 as of January 1, 2011, December 31, 2011 and March 31, 2012, respectively.
Share-Based Compensation Expense
ASC 718-10, Share-Based Payment, requires all share-based payments to employees to be recognized in the financial statements as compensation expense based on their fair values using an option-pricing model, such as the Black-Scholes model, at the date of grant. The Company recognizes compensation expense on a straight-line basis over the vesting period or to the date a participant becomes eligible for retirement, if earlier.
Store Opening Costs
Store opening costs are expensed as incurred.
Recent Accounting Pronouncements
In May 2011, the Financial Accounting Standards Board (FASB) issued updated accounting guidance related to fair value measurements and disclosures that result in common fair value measurements and disclosures between U.S. GAAP and International Financial Reporting Standards. This guidance includes amendments that clarify the application of existing fair value measurement requirements, in addition to other amendments that change principles or requirements for measuring fair value and for disclosing information about fair value measurements. This guidance is effective for annual periods beginning after December 15, 2011. The adoption of this guidance is not expected to have a material effect on the Company's consolidated financial statements.
F-55
MGHC Holding Corporation and Subsidiaries
Notes to Consolidated Financial Statements (Continued)
Note 2. Significant Accounting Policies (Continued)
In September 2011, the FASB issued guidance to amend and simplify the rules related to testing goodwill for impairment. The revised guidance allows an entity to make an initial qualitative evaluation, based on the entity's events and circumstances, to determine whether it is more likely than not that the fair value of a reporting unit is less than its carrying amount. The results of this qualitative assessment determine whether it is necessary to perform the currently required two-step impairment test. The amendments are effective for annual and interim goodwill impairment tests performed for fiscal years beginning after December 15, 2011.
Note 3. Discontinued Operations
On November 15, 2011, the Company sold the assets associated with its operations in St. Louis, Minneapolis and Atlanta including 55 stores and three distributions centers. On December 29, 2011, the Company sold the assets associated with its operations in the northeastern United States which included 68 stores and two distribution centers. Results from these markets are classified as discontinued operations. In accordance with ASC 360-10, Accounting for the Impairment or Disposal of Long-Lived Assets, the operating results of the stores closed and available for sale for all years presented has been reported as discontinued operations as follows (amounts in thousands):
| |
|
|
|
Thirteen Weeks Ended | ||||||||||||
|---|---|---|---|---|---|---|---|---|---|---|---|---|---|---|---|---|
| |
Fiscal 2009 |
Fiscal 2010 |
Fiscal 2011 |
April 2, 2011 |
March 31, 2012 |
|||||||||||
| |
|
|
|
(unaudited) |
(unaudited) |
|||||||||||
Results of discontinued operations, net of tax expense of $0 tax in fiscal 2009, 2010 and the thirteen weeks ended April 2, 2011 and March 31, 2012 and $893 tax in fiscal 2011 |
$ | (3,973 | ) | $ | (4,436 | ) | $ | (3,225 | ) | $ | (1,080 | ) | $ | 101 | ||
Loss on disposal of assets, net of tax expense of $1,384 in fiscal 2011 |
— |
— |
(3,450 |
) |
— |
— |
||||||||||
Total income (loss) from discontinued operations, net of tax expense of $0 in fiscal 2009, 2010 and the thirteen weeks ended April 2, 2011 and March 31, 2012 and $2,277 in fiscal 2011 |
$ |
(3,973 |
) |
$ |
(4,436 |
) |
$ |
(6,675 |
) |
$ |
(1,080 |
) |
$ |
101 |
||
Total revenue generated by the discontinued markets was approximately $85,471,000, $81,215,000 and $62,101,000 for fiscal 2009, 2010 and 2011, respectively, and $17,001,000 and $248,000 for the thirteen weeks ended April 2, 2011 and March 31, 2012, respectively.
F-56
MGHC Holding Corporation and Subsidiaries
Notes to Consolidated Financial Statements (Continued)
Note 4. Property and Equipment, Net
Property and equipment, net at January 1, 2011 and December 31, 2011 consist of the following (amounts in thousands):
| |
Useful Lives | Fiscal 2010 | Fiscal 2011 | ||||||
|---|---|---|---|---|---|---|---|---|---|
Leasehold improvements |
5 - 10 years | $ | 13,716 | $ | 8,878 | ||||
Store fixtures, equipment and furnitures |
5 - 10 years | 4,020 | 2,434 | ||||||
Computers and related equipment |
3 years | 1,700 | 1,151 | ||||||
Trucks and autos |
3 years | 436 | 195 | ||||||
|
19,872 | 12,658 | |||||||
Less accumulated depreciation and amortization |
(14,012 | ) | (9,663 | ) | |||||
Property and equipment, net |
$ | 5,860 | $ | 2,995 | |||||
Depreciation expense was approximately $3,751,000, $3,324,000 and $2,152,000 in fiscal 2009, 2010 and 2011, respectively, and $935,000 and $293,000 for the thirteen weeks ended April 2, 2011 and March 31, 2012, respectively.
Note 5. Other Assets
Other assets at January 1, 2011 and December 31, 2011 consist of the following (amounts in thousands):
| |
Useful Lives | Fiscal 2010 |
Fiscal 2011 |
||||||
|---|---|---|---|---|---|---|---|---|---|
Deposits |
$ | 2,214 | $ | 1,963 | |||||
Deferred financing cost |
3 - 4 years | — | 250 | ||||||
Other assets |
3 - 5 years | 966 | 1,013 | ||||||
|
3,180 | 3,226 | |||||||
Less accumulated amortization |
(888 | ) | (1,015 | ) | |||||
Other assets, net |
$ | 2,292 | $ | 2,211 | |||||
The Company capitalizes costs incurred in connection with the issuance of its long-term debt and the revolving credit facility and amortizes those costs over the life of the related debt instrument. Amortization of deferred financing fees, which totaled $673,000, $0, and $68,000 during fiscal 2009, 2010 and 2011, respectively, is recorded as interest expense on the accompanying consolidated statements of operations. Effective July 17, 2009, deferred financing fees of approximately $2,905,000 were written off against the "Gain on debt restructuring" in the consolidated statement of operations in connection with the debt restructuring (see Note 7).
Additional amortization expense of other assets was approximately $259,000, $150,000 and $61,000 for fiscal 2009, 2010 and 2011, respectively.
F-57
MGHC Holding Corporation and Subsidiaries
Notes to Consolidated Financial Statements (Continued)
Note 6. Accrued Expenses and Other Current Liabilities
Accrued expenses and other current liabilities at January 1, 2011 and December 31, 2011 consist of the following (amounts in thousands):
| |
Fiscal 2010 |
Fiscal 2011 |
|||||
|---|---|---|---|---|---|---|---|
Accrued payroll and employee benefits |
$ | 2,773 | $ | 2,182 | |||
Accrued interest |
87 | 60 | |||||
Accrued taxes, other than income taxes |
1,587 | 964 | |||||
Accrued advertising |
403 | 35 | |||||
Accrued merchandise payable |
1,372 | 811 | |||||
Rent reductions |
445 | 416 | |||||
Other accrued expenses and liabilities |
833 | 1,429 | |||||
|
$ | 7,500 | $ | 5,897 | |||
Note 7. Long-Term Debt
Long-term debt at January 1, 2011 and December 31, 2011 consists of the following (amounts in thousands):
| |
Fiscal 2010 |
Fiscal 2011 |
March 31, 2012 |
|||||||
|---|---|---|---|---|---|---|---|---|---|---|
| |
|
|
(unaudited) |
|||||||
Senior debt: |
||||||||||
Revolving credit facility |
$ | 6,100 | $ | 200 | $ | 3,900 | ||||
Term loan—principal plus paid-in-kind interest |
20,785 | 18,415 | 18,654 | |||||||
Term loan carrying value under ASC 470-60 |
3,345 | 1,811 | 1,511 | |||||||
Subordinated debt: |
||||||||||
Mezzanine loan—principal plus paid-in-kind interest |
23,374 | — | — | |||||||
Mezzanine loan carrying value under ASC 470-60 |
5,666 | — | — | |||||||
|
59,270 | 20,426 | 24,065 | |||||||
Less current portion |
(519 | ) | (449 | ) | (449 | ) | ||||
Long-term portion |
$ | 58,751 | $ | 19,977 | $ | 23,616 | ||||
2009 Restructuring
During fiscal 2009, the Company violated certain debt covenants; therefore, on July 17, 2009, the Company entered into amendments with their senior and subordinated lenders. Since the lenders granted concessions resulting in lower effective borrowing rates, the changes to each debt facility were considered under ASC 470-60, Troubled Debt Restructurings by Debtors. The total fees paid for the restructuring were approximately $1,181,000, of which approximately $413,000 was recorded against additional paid-in capital and the remaining portion reduced the "Gain on debt restructuring" in the consolidated statement of operations.
F-58
MGHC Holding Corporation and Subsidiaries
Notes to Consolidated Financial Statements (Continued)
Note 7. Long-Term Debt (Continued)
2011 Restructuring
During the first quarter of fiscal 2011, MGHC entered into a transaction that resulted in the extinguishment of the Subordinated Mezzanine Loan and the related accrued interest in exchange for stock and warrants, and the extension of the maturity of the remaining indebtedness, which after the transaction, consisted of the Senior Term Loan and the Senior Revolving Credit Facility. As part of the transaction, MGHC cancelled all outstanding stock and authorized the issuance of new MGHC shares. Additionally, a total $13,225,000 of additional capital was contributed related to the issuance of MGHC stock during the year.
On January 31, 2011, MGHC entered into several amendments to credit agreements relating to its Senior Term Loan, its Senior Revolving Credit Facility and Subordinated Mezzanine Loan. Those amendments, among other things, allowed shareholders to contribute additional equity to fund ongoing operating expenses, waived certain financial covenants for a period in 2011, replacing them with updated financial covenants, and extended the maturity dates for both the Senior Term Loan and the Senior Revolving Credit Facility to June 30, 2014.
Subordinated Mezzanine Loan lenders entered into agreements through which they exchanged their outstanding debt which consisted of a loan having a principal balance of $20 million and related accrued interest for 400,000 shares of stock of MGHC and 500,000 stock warrants of MGHC. Shareholders contributed $10,125,000 of additional equity in exchange for 1,012,500 shares of MGHC stock. The warrants can be exercised at a price of $10 per share until the expiration date of January 31, 2012.
On March 25, 2011, the Board of Directors of MGHC authorized and approved the sale of 300,000 shares of common stock for a purchase price of $10 per share to Freeman Spogli and on April 1, 2011, authorized the sale of 10,000 shares of common stock for a purchase price of $10 per share to management.
Senior Revolving Credit Facility
As of the beginning of fiscal 2009, the Company had a $13 million Senior Revolving Credit Facility with a maturity date of August 2, 2011. Effective July 17, 2009, the Company paid approximately $6,385,000 of the outstanding balance, the lenders extinguished approximately $2,657,000 of the outstanding balance, and MGHC issued 211,715 shares of common stock at $1 per share to the lenders as payment for the remaining balance. The portion of debt that was extinguished was recorded in the "Gain on debt restructuring" in the consolidated statement of operations. Various terms of the facility were changed to reduce the availability to $9 million and extend the maturity date to June 29, 2012.
During the first quarter of fiscal 2011, the Company entered into an amendment which, among other things, extended the maturity to June 30, 2014. As a result of the series of assets sales during the fourth quarter of fiscal 2011, the credit facility was reduced from $9 million to $6.8 million as of December 31, 2011. The Senior Revolving Credit Facility requires quarterly interest payments, which are determined as the base rate (prime or LIBOR rates) plus an applicable margin, as defined in the agreement. The interest rate was 5.3% as of December 31, 2011 and January 1, 2011. Total borrowings under the Senior Revolving Credit Facility as of December 31, 2011 were $200,000 while total availability was $6.6 million.
F-59
MGHC Holding Corporation and Subsidiaries
Notes to Consolidated Financial Statements (Continued)
Note 7. Long-Term Debt (Continued)
Senior Term Loan
As of the beginning of fiscal 2009, the Company had a $50 million Senior Term Loan with varying quarterly principal payments and a balloon payment at maturity on August 2, 2011. Effective July 17, 2009, the Company paid approximately $4,371,000 of the outstanding balance and the lenders extinguished approximately $10,339,000 of the outstanding balance, which resulted in a Senior Term Loan balance of approximately $19,984,000. ASC 470-60, Troubled Debt Restructurings by Debtors, requires a reduction in the principal balance of the loan when the debt balance is greater than the total future cash payments (defined as principal plus interest) under the new terms. The application of ASC 470-60 resulted in estimated future interest payments of approximately $4,996,000 which were reflected on that balance sheet at that time. Various terms of the Senior Term Loan were also changed, which included reduced quarterly principal payments, a different calculation method for interest and the extension of maturity date to June 29, 2012.
On January 31, 2011, the Senior Term Loan was amended which, among other things, allowed shareholders to contribute additional equity to fund ongoing operating expenses, waived certain financial covenants for a period in 2011, replacing them with updated financial covenants and extended the maturity date to June 30, 2014. During the fourth quarter of fiscal 2011, amendments were executed in connection with the sales of the discontinued operations (see Note 3) which resulted in the Company paying approximately $3,493,000 of the outstanding balance and reducing quarterly principal payments. The amended Senior Term Loan requires quarterly principal payments of approximately $42,000 starting from March 31, 2012, with a balloon payment of approximately $19,477,000 plus any unpaid interest at maturity on June 30, 2014. Interest is payable quarterly and is determined as LIBOR or Alternative Base Rate plus applicable margin and an additional 3% cash interest plus 3% paid-in-kind interest or 1% cash interest and 6% paid-in-kind interest. In October 2010, the Company elected to decrease its cash interest to 1% and increase its paid-in-kind interest to 6%. The effective interest rate was 7.5% and 7.8% at January 1, 2011 and December 31, 2011, respectively.
The Senior Term Loan also requires that mandatory prepayments shall become due based on the Company's "Excess Cash Flow", as defined in the agreement, beginning in fiscal 2011.
As of January 1, 2011 and December 31, 2011, the Company has approximately $19,784,000 and $16,141,000 principal balance plus approximately $1,001,000 and $2,274,000 of accrued paid-in-kind interest, respectively. The remaining portion of future interest payments under ASC 470-60 is approximately $3,345,000 and $1,811,000 as of January 1, 2011 and December 31, 2011, respectively.
Subordinated Mezzanine Loan
As of December 27, 2008, the Mezzanine Loan due to shareholders of MGHC was an interest-only loan with a balloon payment of principal on August 1, 2012. The annual interest rate was fixed at 13.25%, until April 2008 when it changed to 16.25% payable in kind. Effective July 17, 2009, the lenders extinguished approximately $38,334,000 of the outstanding balance and MGHC issued 4,725,475 shares of common stock at $1 per share to the lenders as payment for a portion of the balance, which resulted in a $20 million Mezzanine Loan. The annual paid-in-kind interest rate was reduced to 11% and the maturity date was extended to December 31, 2012.
ASC 470-60 requires a reduction in the principal balance of the loan when the debt balance is greater than the total future cash payments (defined as principal plus interest) under the new terms.
F-60
MGHC Holding Corporation and Subsidiaries
Notes to Consolidated Financial Statements (Continued)
Note 7. Long-Term Debt (Continued)
The application of ASC 470-60 resulted in estimated future interest payments of approximately $9,040,000 and a reduction of the debt balance by approximately $29,294,000, of which the Freeman Spogli amount of approximately $2,929,000 was recorded as additional paid-in capital on the consolidated statement of stockholders' deficit and the remaining amount of approximately $26,364,000 was recorded in the "Gain on debt restructuring" in the consolidated statement of operations. As of January 1, 2011, the Company had a $20 million principal balance plus approximately $3,374,000 of accrued paid-in-kind interest. The remaining portion of future interest payments under ASC 470-60 was approximately $5,665,000 as of January 1, 2011.
On January 31, 2011, the lenders extinguished the balance of the Mezzanine Loan and the accrued interest in exchange for 400,000 shares of stock of MGHC and 500,000 stock warrants of MGHC. In accordance with ASC 470, approximately $29,040,000, representing the difference between the value of the equity received and the carrying value of the debt, was recorded as additional paid-in capital on the consolidated statement of stockholders' deficit.
All of the Company's assets are pledged as collateral under the Senior Revolving Credit Facility, Senior Term Loan and Subordinated Mezzanine Loan, and the Company is subject to compliance with certain covenants, including minimum liquidity levels and maximum capital purchases, as defined in each of the facilities.
Convertible Promissory Note
The $15 million Convertible Promissory Note with Freeman Spogli had a fixed interest rate of 18.25% and was computed on a quarterly basis. All accrued interest was added to the principal amount of the note. The maturity date was February 2, 2013. At December 27, 2008, the principal balance of the Convertible Promissory Note included approximately $1,233,000 of accrued paid in kind interest. Effective July 17, 2009, Freeman Spogli extinguished the debt, which was recorded as additional paid-in capital on the statement of stockholders' deficit for approximately $17,748,000.
As of December 31, 2011, total long-term debt is scheduled to mature in future fiscal years as follows (amounts in thousands):
2012 |
$ | 449 | ||
2013 |
216 | |||
2014 |
19,761 | |||
|
$ | 20,426 | ||
Note 8. Fair Value Measurements
Certain assets and liabilities are accounted for at fair value on either a recurring or non-recurring basis. Fair value is defined as the price that would be received to sell an asset or paid to transfer a liability in an orderly transaction between market participants at the measurement date. The hierarchy below lists three levels of fair value based on the extent to which inputs used in measuring fair value are observable in the market. These levels are:
Level 1—Observable inputs—quoted prices in active markets for identical assets and liabilities;
F-61
MGHC Holding Corporation and Subsidiaries
Notes to Consolidated Financial Statements (Continued)
Note 8. Fair Value Measurements (Continued)
Level 2—Observable inputs other than the quoted prices in active markets for identical assets and liabilities—includes quoted prices for similar instruments, quoted prices for identical or similar instruments in inactive markets, and amounts derived from valuation models where all significant inputs are observable in active markets; and
Level 3—Unobservable inputs—includes amounts derived from valuation models where one or more significant inputs are unobservable and require us to develop relevant assumptions.
In accordance with ASC 360, the Company reviewed its real estate portfolio for impairment, focusing on operations with negative cash flow, particularly in markets where the economic recovery has been slower. Future cash flows are projected for the remaining lease life to estimate the fair value of the assets. The Company primarily used a discounted cash flow valuation model, incorporating projections of future cash flow which considered such factors as discount rates, future sales levels, gross margins, and other expenses as well as the overall operating environment specific to the location were compared to the carrying value of the assets. These factors are considered Level 3 inputs within the fair value hierarchy. No impairment of assets was recorded in fiscal 2009. Of the 350 stores open as of the end of fiscal 2010, the Company identified 75 stores as having carrying amounts associated store assets that were not expected to be recoverable resulting in an impairment charge of approximately $1,067,000. Of the 194 stores open as of the end of fiscal 2011, fifteen stores were identified as having carrying values that were in excess of the expected future cash flows. As a result, an impairment charge of approximately $138,000 was recorded.
The Company reviewed its trade names for impairment in fiscal 2011. The Company primarily used discounted cash flow valuation models, incorporating projected revenues to estimate the fair value of the trade names. Projections of future revenues as well as discount rates commensurate with the risks involved relating to the relevant underlying asset are considered Level 3 inputs within the fair value hierarchy. As a result, an impairment charge of approximately $19,049,000 was recorded. No impairment was recorded in fiscal 2009 or 2010.
The following table represents assets reported on the consolidated balance sheets at their fair value on a nonrecurring basis as of December 31, 2011 and January 1, 2011 by level within the fair value measurement hierarchy (amounts in thousands):
| |
Quoted Prices in Active Markets for Identical Items (Level 1) |
Significant Other Observable Inputs (Level 2) |
Significant Unobservable Inputs (Level 3) |
Total Losses |
|||||||||
|---|---|---|---|---|---|---|---|---|---|---|---|---|---|
January 1, 2011: |
|||||||||||||
Property and equipment of impaired stores |
$ | — | $ | — | $ | — | $ | 1,067 | |||||
December 31, 2011: |
|||||||||||||
Property and equipment of impaired stores |
$ | — | $ | — | $ | — | $ | 138 | |||||
Trade names |
— | — | 18,862 | 19,049 | |||||||||
|
$ | — | $ | — | $ | 18,862 | $ | 19,187 | |||||
During the thirteen-week periods ended April 2, 2011 and March 31, 2012, there were no events or changes in circumstances indicating the carrying amounts of our long-lived assets may not be recoverable.
F-62
MGHC Holding Corporation and Subsidiaries
Notes to Consolidated Financial Statements (Continued)
Note 9. Commitments and Contingencies
The Company leases all of its store, warehouse and office facilities pursuant to non-cancelable operating leases that expire at various times through 2022 as of December 31, 2011. Future minimum lease payments under the operating leases in future fiscal years are as follows (amounts in thousands):
2012 |
$ | 20,958 | ||
2013 |
14,530 | |||
2014 |
9,040 | |||
2015 |
6,511 | |||
2016 |
4,555 | |||
Thereafter |
5,644 | |||
|
$ | 61,238 | ||
The total future minimum lease payments exclude expense reimbursements to lessors, as well as contingent rentals, which are based upon sales volume. For fiscal 2010 and 2011, contingent rentals were insignificant. Lease agreements frequently require the Company to pay utilities, taxes, insurance and maintenance related to the property. Rent expense was approximately $45,059,000, $45,602,000 and $37,220,000 for fiscal 2009, 2010 and 2011, respectively, and $12,516,000 and $6,820,000 for the thirteen weeks ended April 2, 2011 and March 31, 2012, respectively.
In December 2005, the Company sold the net assets of 32 stores in its Chicago region. Substantially all of the Company's leases on these stores were assigned to the buyer. As part of the lease assignments, the Company has not been released from its obligations under the lease, and both the buyer and the Company are jointly and severally liable for the obligations of the buyer under the terms of the lease. As of December 31, 2011, the Company was jointly and severally liable for 11 leases with remaining lease commitments of approximately $3,582,000 related to these stores. These leases have expiration dates continuing into 2015.
During 2011, in a series of two transactions, the Company sold the assets of its operations in the St. Louis, Minneapolis and Atlanta markets as well as the assets associated with its operations in the Northeastern section of the United States. All leases associated with the stores and distribution centers were assigned to the buyers. As part of the lease assignments, the Company has not been released from its obligations under the lease, and both the buyers and the Company are jointly and severally liable for the obligations of the buyers under the terms of the lease. As of December 31, 2011, the Company was jointly and severally liable for 127 leases with remaining lease commitments of approximately $28,664,000 related to these locations. These leases have expiration dates continuing into 2019.
Deferred rent of approximately $7,979,000 and $4,009,000 has been recorded on the consolidated balance sheets as of January 1, 2011 and December 31, 2011, respectively, to account for rent expenses on a straight-line basis over the lease term, where lease payments vary.
The Company is involved in various other claims and legal actions arising in the ordinary course of business. In the opinion of management, the ultimate disposition of these matters will not have a material adverse effect on the Company's consolidated financial position, results of operations or liquidity.
F-63
MGHC Holding Corporation and Subsidiaries
Notes to Consolidated Financial Statements (Continued)
Note 10. Income Taxes
For fiscal 2009, 2010 and 2011, the components of the provision for (benefit from) income taxes from continuing operations were as follows (amounts in thousands):
| |
Fiscal 2009 |
Fiscal 2010 |
Fiscal 2011 |
|||||||
|---|---|---|---|---|---|---|---|---|---|---|
Current tax expense (benefit): |
||||||||||
Federal |
$ | (1,626 | ) | $ | 9 | $ | — | |||
State |
144 | 131 | 149 | |||||||
Deferred tax expense (benefit): |
||||||||||
Federal |
401 | (73 | ) | (6,305 | ) | |||||
State |
62 | (3 | ) | (561 | ) | |||||
|
$ | (1,019 | ) | $ | 64 | $ | (6,717 | ) | ||
The tax effects of temporary differences that give rise to the deferred tax assets and liabilities at January 1, 2011 and December 31, 2011, are presented below (amounts in thousands):
| |
Fiscal 2010 |
Fiscal 2011 |
|||||
|---|---|---|---|---|---|---|---|
Deferred tax assets: |
|||||||
Deferred rent |
$ | 886 | $ | 17 | |||
Accruals and other current liabilities |
726 | 569 | |||||
Property and equipment |
2,255 | 808 | |||||
Net operating loss |
7,510 | 17,494 | |||||
Goodwill |
1,049 | — | |||||
|
12,426 | 18,888 | |||||
Less valuation allowance |
(12,314 | ) | (18,797 | ) | |||
Total deferred tax asset |
112 | 91 | |||||
Deferred tax liabilities: |
|||||||
Prepaid and other |
112 | 91 | |||||
Intangible assets |
16,860 | 6,826 | |||||
Goodwill |
— | 5,445 | |||||
Total deferred tax liability |
16,972 | 12,362 | |||||
Net deferred tax liability |
$ | (16,860 | ) | $ | (12,271 | ) | |
At December 31, 2011, the Company has net operating loss carryforwards for federal tax purposes of approximately $48,950,000, approximately $29,000,000 will expire in 2012 with the remainder expiring after 2030. During the years ended January 1, 2011 and December 31, 2011, the Company recorded a valuation allowance of approximately $12,314,000 and $18,797,000, respectively, on the deferred tax assets to reduce the total amount that is more likely than not to be realized.
The effective tax rate from continuing operations was (14.5%), (0.4%) and 26.4%, for fiscal 2009, 2010 and 2011, respectively. These effective tax rates differed from the statutory federal rate primarily due to the state taxes, non-deductible expenses (which primarily consist of debt forgiveness and stock option cancellation in fiscal 2009) and changes in the valuation allowance.
F-64
MGHC Holding Corporation and Subsidiaries
Notes to Consolidated Financial Statements (Continued)
Note 10. Income Taxes (Continued)
The effective tax rate was (3.8%) and (7.4%) for the thirteen weeks ended April 2, 2011 and March 31, 2012 respectively. These effective tax rates differed from the statutory federal rate primarily due to a result of changes in the valuation allowance and state income taxes.
Note 11. Share-Based Compensation
Stock Options
Prior to fiscal 2011, options were issued to officers and key employees of the Company pursuant to a stock option plan approved by the MGHC board of directors on October 26, 2006. The Plan authorized grants of options to purchase up to 1,500,000 shares of authorized but unissued common stock. Stock options could be granted with an exercise price greater than or equal to fair market value at the date of grant. Options granted under the Plan became exercisable in five equal annual installments starting one year from the grant date and expired ten years from the date of grant. As of the beginning of fiscal 2009, a total of 796,786 options were issued and outstanding. Effective July 17, 2009, MGHC accelerated the vesting of the remaining unvested options which resulted in the remaining unrecognized compensation expense of approximately $1,718,000 being recognized in fiscal 2009. Subsequently, all stock options were cancelled and the Plan was terminated. No options were issued and outstanding during fiscal 2010 and no expense was recorded during the period.
In March 2011, MGHC adopted a stock option plan (the Plan) pursuant to which MGHC's board of directors may grant stock options to officers and key employees of the Company. The Plan authorizes grants of options to purchase up to 250,000 shares of authorized but unissued common stock. Stock options can be granted with an exercise price greater than or equal to fair market value at the date of grant. Options granted under the Plan will become exercisable in installments as established by the Committee with respect to each specific grant and expire not more than ten years from the date of grant. Options may be granted for up to ten years from the Plan's adoption date.
During 2011, the Company issued 158,300 options having an exercise price of $10 per share. Options vest annually in three equal tranches and have a ten-year life.
At December 31, 2011, there were 92,700 additional shares available for MGHC to grant under the plan. The fair value of each option award is estimated on the date of grant using the Black-Scholes option pricing model. The following weighted average assumptions were utilized for the fiscal 2011 grants:
Valuation assumptions: |
||||
Expected volatility |
55 | % | ||
Expected term in years |
5 | |||
Risk-free interest rate |
1.5 | % - 2.1% | ||
Dividend yield |
0 | % |
MGHC uses historical volatility of similar public companies to estimate expected volatility. MGHC uses historical and expected data to estimate terms of the options. The risk-free rate for the expected term of the option is based on the U.S. Treasury yield curve in effect at the time of the grant.
F-65
MGHC Holding Corporation and Subsidiaries
Notes to Consolidated Financial Statements (Continued)
Note 11. Share-Based Compensation (Continued)
A summary of option activity under the Plan as of December 31, 2011 is as follows:
| |
Number of Shares |
Weighted Average Exercise Price |
Weighted Average Remaining Term |
|||||
|---|---|---|---|---|---|---|---|---|
Balance, January 1, 2011 |
— | — | — | |||||
Granted |
158,300 | $ | 10.00 | 9.3 years | ||||
Forfeited |
(15,300 | ) | $ | 10.00 | — | |||
Balance, December 31, 2011 |
143,000 | $ | 10.00 | 9.3 years | ||||
Expected to vest, December 31, 2011 |
142,470 | — | 9.3 years | |||||
Exercisable, December 31, 2011 |
— | — | — | |||||
For fiscal 2011, the weighted average grant date fair value of options granted was $4.89 per share.
In fiscal 2011, the Company recorded share-based compensation expense of approximately $181,000. At December 31, 2011, there was approximately $564,000 of total unrecognized compensation cost related to nonvested share-based compensation arrangements granted under the Plan, which is expected to be recognized over a weighted average period of three years.
MGHC currently uses authorized and unissued shares to satisfy share award exercises.
Deferred Shares
Effective August 2, 2006, MGHC, through a wholly owned subsidiary, acquired all of the outstanding common stock of Mattress Giant Holding Corporation and Subsidiaries in a business combination. Prior to the consummation of this transaction, the Company entered into Change of Control Bonus Agreements with 67 employees and Equity Based Award Agreements with two employees (collectively, the Agreements) which provided that upon a change of control, as defined in the agreements, the employee is entitled to: (i) a cash award equal to a stated dollar value, and (ii) a share-based payment award called a "deferred share award" that provides the employee with the right to receive a variable number of shares equal to a stated dollar value divided by the fair market value of MGHC common stock (as determined by the Board of Directors) immediately following the consummation of change in control. This right to receive shares will be settled by the issuance of actual fully vested shares of stock of MGHC upon (i) employee's separation from the company, (ii) employee's death or disability, or (iii) acquisition of MGHC. The option to repurchase the shares for cash at a later date is solely at the discretion of MGHC. There were no deferred shares purchased by the Company during fiscal 2009. Effective July 17, 2009, MGHC completed a 1:1,000,000 reverse stock split, and as a result, there will be no significant future payments.
Note 12. Employee Benefit Plan
401(k) Plan
The Company sponsors the Mattress Giant 401(k) Retirement Plan (the 401(k) Plan). All employees who have completed at least 75 days of employment are eligible to enroll in the 401(k) Plan. The Company matched 25% of the first 6% that each employee contributes. The Company paid
F-66
MGHC Holding Corporation and Subsidiaries
Notes to Consolidated Financial Statements (Continued)
Note 12. Employee Benefit Plan (Continued)
approximately $231,000 and $241,000 during fiscal 2009 and 2010, respectively. During fiscal 2011, the Company discontinued matching employees' contributions to the 401(k) Plan.
Note 13. Subsequent Events
On April 9, 2012, Mattress Firm, Inc. entered into a Stock Purchase Agreement with the shareholders of MGHC pursuant to which Mattress Firm, Inc. has agreed to acquire all of the issued and outstanding shares of capital stock of MGHC. The purchase price payable by Mattress Firm, Inc. for such shares pursuant to the terms of the Stock Purchase Agreement is approximately $47 million in cash, subject to working capital and other purchase price adjustments. The Stock Purchase Agreement contains customary representations, warranties and covenants. MGHC is obligated to indemnify Mattress Firm, Inc., among other things, for certain existing liabilities of the Company. In addition, subject to certain limitations, each party has agreed to indemnify the other parties for breaches of representations, warranties and covenants, and other specified matters. A portion of the purchase price will be deposited into escrow to serve as an exclusive source of recovery for certain indemnification obligations and specified purchase price adjustments.
On May 2, 2012, the transaction closed under substantially the same terms as contemplated by the Stock Purchase Agreement.
Management evaluates events or transactions that occur after the balance sheet date for potential recognition or disclosure in the financial statements. Management has considered subsequent events through June 29, 2012, the date on which the financial statements were issued.
F-67
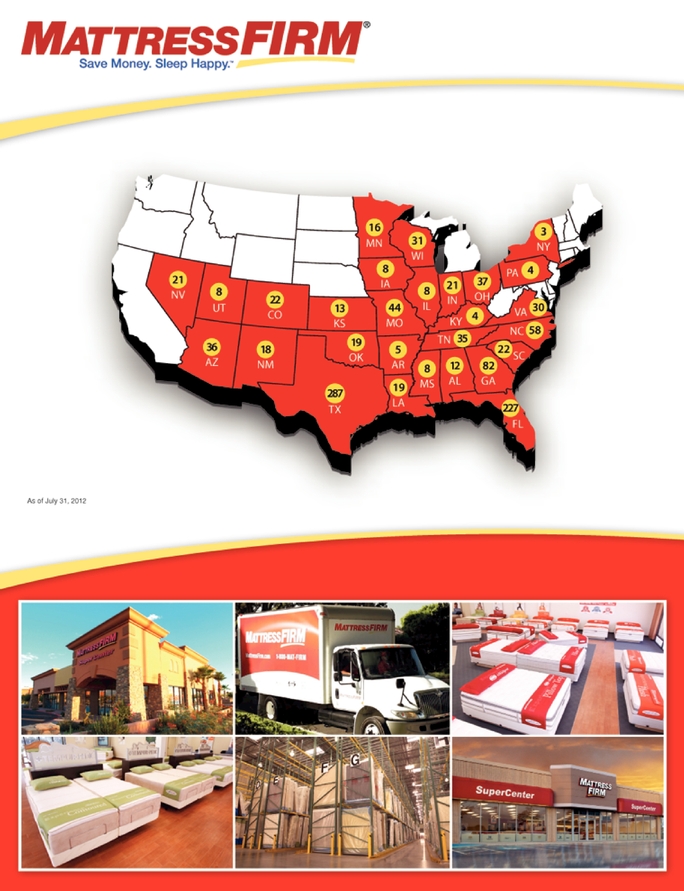
4,726,682 Shares

Common Stock
Prospectus
, 2012
Barclays
UBS Investment Bank
Citigroup
William Blair
KeyBanc Capital Markets
SunTrust Robinson Humphrey
PART II
INFORMATION NOT REQUIRED IN PROSPECTUS
Item 13. Other Expenses of Issuance and Distribution.
The following table sets forth the estimated expenses payable by us in connection with the sale and distribution of the securities registered hereby, other than underwriting discounts or commissions. All amounts are estimates except for the SEC registration fee and the Financial Industry Regulatory Authority filing fee.
SEC registration fee |
$ | 20,109 | ||
FINRA filing fee |
26,820 | |||
Blue sky fees and expenses |
20,000 | |||
Printing and engraving expenses |
100,000 | |||
Accounting fees and expenses |
90,000 | |||
Legal fees and expenses |
300,000 | |||
Transfer agent and registrar fees |
5,000 | |||
Miscellaneous fees and expenses |
18,071 | |||
TOTAL |
$ | 580,000 | ||
Item 14. Indemnification of Directors and Officers.
Section 145 of the General Corporation Law of the State of Delaware provides as follows:
A corporation shall have the power to indemnify any person who was or is a party or is threatened to be made a party to any threatened, pending or completed action, suit or proceeding, whether civil, criminal, administrative or investigative (other than an action by or in the right of the corporation) by reason of the fact that the person is or was a director, officer, employee or agent of the corporation, or is or was serving at the request of the corporation as a director, officer, employee or agent of another corporation, partnership, joint venture, trust or other enterprise, against expenses (including attorneys' fees), judgments, fines and amounts paid in settlement actually and reasonably incurred by him in connection with such action, suit or proceeding if the person acted in good faith and in a manner the person reasonably believed to be in or not opposed to the best interest of the corporation, and, with respect to any criminal action or proceeding, had no reasonable cause to believe his conduct was unlawful. The termination of any action, suit or proceeding by judgment, order, settlement, conviction or upon a plea of nolo contendere or its equivalent shall not, of itself, create a presumption that the person did not act in good faith and in a manner which the person reasonably believed to be in or not opposed to the best interests of the corporation, and, with respect to any criminal action or proceeding, had reasonable cause to believe that his conduct was unlawful.
A corporation shall have the power to indemnify any person who was or is a party or is threatened to be made a party to any threatened, pending or completed action or suit by or in the right of the corporation to procure a judgment in its favor by reason of the fact that the person is or was a director, officer, employee or agent of the corporation, or is or was serving at the request of the corporation as a director, officer, employee or agent of another corporation, partnership, joint venture, trust or other enterprise against expenses (including attorneys' fees) actually and reasonably incurred by him in connection with the defense or settlement of such action or suit if the person acted in good faith and in a manner the person reasonably believed to be in or not opposed to the best interests of the corporation and except that no indemnification shall be made with respect to any claim, issue or matter as to which such person shall have been adjudged to be liable to the corporation unless and only to the extent that the Court of Chancery or the court in which such action or suit was brought shall determine upon application that, despite the adjudication of liability but in view of all the
II-1
circumstances of the case, such person is fairly and reasonably entitled to indemnity for such expenses which the Court of Chancery or such other court shall deem proper.
As permitted by the Delaware General Corporation Law, we have included in our amended and restated certificate of incorporation a provision to eliminate the personal liability of our directors for monetary damages for breach of their fiduciary duties as directors, subject to certain exceptions. In addition, our amended and restated bylaws contain a provision indemnifying our directors and officers to the fullest extent permitted under applicable law for all liability and loss suffered by them in connection with performance of their duties as directors and officers of the Company, subject to certain exceptions, and provide that we may advance expenses to our officers and directors as incurred in connection with proceedings against them for which they may be indemnified.
We entered into indemnification agreements with our directors and officers. These agreements provide broader indemnity rights than those provided under the Delaware General Corporation Law and our amended and restated certificate of incorporation and our amended and restated bylaws. The indemnification agreements are not intended to deny or otherwise limit third party or derivative suits against us or our directors or officers, but to the extent a director or officer were entitled to indemnity or contribution under the indemnification agreement, the financial burden of a third party suit would be borne by us, and we would not benefit from derivative recoveries against the director or officer. Such recoveries would accrue to our benefit but would be offset by our obligations to the director or officer under the indemnification agreement.
The underwriting agreement provides that the underwriters are obligated, under certain circumstances, to indemnify our directors, officers and controlling persons against certain liabilities, including liabilities under the Securities Act. Reference is made to the form of underwriting agreement filed as Exhibit 1.1 hereto.
We maintain directors' and officers' liability insurance for the benefit of our directors and officers.
Item 15. Recent Sales of Unregistered Securities.
Set forth below is information regarding securities issued by us within the past three years. Also included is the consideration received by us for such securities and information relating to the section of the Securities Act, or rule of the SEC, under which exemption from registration was claimed. There were no underwritten offerings employed in connection with the transaction set forth in this Item 15.
- •
- On July 19, 2011, we issued and sold $40,198,034 aggregate principal amount of 12% convertible notes due July 18, 2016 in a private placement to six accredited investors. These unregistered securities were issued in reliance on the exemption afforded by Section 4(2) of the Securities Act and Rule 506 of Regulation D promulgated thereunder.
The securities were issued directly by the registrant and did not involve a public offering or general solicitation. The recipients of such securities represented their intentions to acquire the securities for investment purposes only and not with a view to, or for sale in connection with, any distribution thereof. All securities described in this Item 15 are deemed restricted securities for purposes of the Securities Act. The instruments representing such issued securities included appropriate legends setting forth that the securities had not been registered and the applicable restrictions on transfer.
II-2
Item 16. Exhibits and Financial Statement Schedules.
- (a)
- Exhibits
Reference is made to the Exhibit List filed as a part of this registration statement beginning on page E-1. Each of such exhibits is incorporated by reference herein.
- (b)
- Financial Statement Schedules
Schedule I—Condensed Financial Information of Mattress Firm Holding Corp |
S-1 | |
Schedule II—Valuation and Qualifying Accounts |
S-6 |
Schedules other than that listed above have been omitted since the required information is not present, or not present in amounts sufficient to require submission of the schedule, or because the information required is included in the consolidated financial statements or the notes thereto.
The undersigned Registrant hereby undertakes:
- (1)
- That,
for purposes of determining any liability under the Securities Act of 1933, the information omitted from the form of prospectus filed as part of this
registration statement in reliance upon Rule 430A and contained in a form of prospectus filed by the Registrant pursuant to Rule 424(b)(1) or (4) or 497(h) under the Securities
Act of 1933 shall be deemed to be part of this registration statement as of the time it was declared effective.
- (2)
- That,
for the purpose of determining any liability under the Securities Act of 1933, each post-effective amendment that contains a form of
prospectus shall be deemed to be a new registration statement relating to the securities offered therein, and the offering of such securities at that time shall be deemed to be the initial bona fide
offering thereof.
- (3)
- Insofar as indemnification for liabilities arising under the Securities Act of 1933 may be permitted to directors, officers and controlling persons of the Registrant pursuant to the foregoing provisions, or otherwise, the Registrant has been advised that in the opinion of the Securities and Exchange Commission such indemnification is against public policy as expressed in the Securities Act of 1933 and is, therefore, unenforceable. In the event that a claim for indemnification against such liabilities (other than the payment by the Registrant of expenses incurred or paid by a director, officer or controlling person of the Registrant in the successful defense of any action, suit or proceeding) is asserted by such director, officer or controlling person in connection with the securities being registered, the Registrant will, unless in the opinion of its counsel the matter has been settled by controlling precedent, submit to a court of appropriate jurisdiction the question whether such indemnification by it is against public policy as expressed in the Securities Act of 1933 and will be governed by the final adjudication of such issue.
II-3
Pursuant to the requirements of the Securities Act of 1933, the registrant has duly caused this registration statement to be signed on its behalf by the undersigned, thereunto duly authorized, in the City of Houston and State of Texas on September 19, 2012.
| MATTRESS FIRM HOLDING CORP. (Registrant) |
||||||
By: |
/s/ R. STEPHEN STAGNER |
|||||
| Name: | R. Stephen Stagner | |||||
| Title: | President and Chief Executive Officer | |||||
II-4
KNOW ALL PERSONS BY THESE PRESENTS, that each person whose signature appears below constitutes and appoints R. Stephen Stagner and James R. Black and each of them to act without the other, as his true and lawful attorney-in-fact and agent, with full power of substitution, for him and in his name, place and stead, in any and all capacities, to sign and file any and all amendments (including post-effective amendments) to this registration statement, and to sign any registration statement for the same offering covered by this registration statement that is to be effective upon filing pursuant to Rule 462(b) promulgated under the Securities Act of 1933, and all post-effective amendments thereto, and to file the same, with all exhibits thereto, and all documents in connection therewith, with the Securities and Exchange Commission, granting unto said attorneys-in-fact and agents, full power and authority to do and perform each and every other act on behalf of the undersigned required to be done in connection therewith.
Pursuant to the requirements of the Securities Act of 1933, this registration statement has been signed by the following persons in the capacities and on the dates indicated.
Signature
|
Title
|
Date
|
||||
|---|---|---|---|---|---|---|
| /s/ R. STEPHEN STAGNER R. Stephen Stagner |
President and Chief Executive Officer (Principal Executive Officer) | September 19, 2012 | ||||
/s/ JAMES R. BLACK James R. Black |
Executive Vice President and Chief Financial Officer (Principal Financial and Accounting Officer) |
September 19, 2012 |
||||
/s/ JOHN W. CHILDS John W. Childs |
Director |
September 19, 2012 |
||||
/s/ ADAM L. SUTTIN Adam L. Suttin |
Director |
September 19, 2012 |
||||
/s/ DAVID A. FIORENTINO David A. Fiorentino |
Director |
September 19, 2012 |
||||
/s/ WILLIAM E. WATTS William E. Watts |
Director |
September 19,2012 |
||||
/s/ FREDERICK C. TINSEY III Frederick C. Tinsey III |
Director |
September 19, 2012 |
||||
/s/ CHARLES R. EITEL Charles R. Eitel |
Director |
September 19, 2012 |
||||
II-5
MATTRESS FIRM HOLDING CORP.
SCHEDULE I—CONDENSED FINANCIAL INFORMATION OF MATTRESS FIRM HOLDING CORP.
(PARENT COMPANY)
BALANCE SHEETS
| |
February 1, 2011 |
January 31, 2012 |
|||||
|---|---|---|---|---|---|---|---|
| |
(in thousands) |
||||||
ASSETS |
|||||||
Cash and cash equivalents |
$ | — | $ | 15,473 | |||
Investment in subsidiary |
65,649 | 229,216 | |||||
Deferred income taxes |
82 | 12,574 | |||||
Other assets, net |
88 | — | |||||
Total assets |
$ | 65,819 | $ | 257,264 | |||
LIABILITIES AND STOCKHOLDER'S EQUITY |
|||||||
Current liabilities |
$ | 1,419 | $ | 1,985 | |||
Notes payable to related parties |
48,909 | — | |||||
Deferred income taxes |
29,960 | 31,045 | |||||
Other noncurrent liabilities |
3,160 | — | |||||
Total liabilities |
83,448 | 33,030 | |||||
Commitments and contingencies |
|||||||
Common stock, $0.01 par value; 120,000,000 shares authorized; 22,399,952 and 33,768,828 shares issued and outstanding at February 1, 2011 and January 31, 2012, respectively |
224 |
338 |
|||||
Additional paid-in capital |
154,294 | 361,692 | |||||
Accumulated deficit |
(172,147 | ) | (137,796 | ) | |||
Total stockholder's equity (deficit) |
(17,629 | ) | 224,234 | ||||
Total liabilities and stockholder's equity |
$ | 65,819 | $ | 257,264 | |||
S-1
MATTRESS FIRM HOLDING CORP.
SCHEDULE I—CONDENSED FINANCIAL INFORMATION OF MATTRESS FIRM HOLDING CORP.
(PARENT COMPANY)
STATEMENTS OF OPERATIONS
| |
Fiscal 2009 | Fiscal 2010 | Fiscal 2011 | |||||||
|---|---|---|---|---|---|---|---|---|---|---|
| |
(in thousands) |
|||||||||
Equity in undistributed earnings of subsidiary |
$ | 1,612 | $ | 6,920 | $ | 32,448 | ||||
Interest expense |
4,880 | 5,725 | 6,912 | |||||||
Gain (loss) before income taxes |
(3,268 | ) | 1,195 | 25,536 | ||||||
Income tax expense (benefit) |
1,405 | 846 | (8,815 | ) | ||||||
Net income (loss) |
$ | (4,673 | ) | $ | 349 | $ | 34,351 | |||
S-2
MATTRESS FIRM HOLDING CORP.
SCHEDULE I—CONDENSED FINANCIAL INFORMATION OF MATTRESS FIRM HOLDING CORP.
(PARENT COMPANY)
STATEMENTS OF CASH FLOWS
| |
Fiscal 2009 | Fiscal 2010 | Fiscal 2011 | |||||||
|---|---|---|---|---|---|---|---|---|---|---|
| |
(in thousands) |
|||||||||
Cash flows from operating activities: |
||||||||||
Net income (loss) |
$ | (4,673 | ) | $ | 349 | $ | 34,351 | |||
Adjustments to reconcile net loss to net cash provided by operating activities |
||||||||||
Equity in earnings of subsidiary |
(1,612 | ) | (6,920 | ) | (32,448 | ) | ||||
Deferred income tax benefit |
(22 | ) | (118 | ) | (11,407 | ) | ||||
Amortization of deferred issuance costs |
46 | 46 | 37 | |||||||
Loss from debt extinguishment |
— | — | 51 | |||||||
Effects of changes in operating assets and liabilities: |
||||||||||
Accrued liabilities |
1,427 | 964 | 566 | |||||||
Other noncurrent liabilities |
4,834 | 5,679 | 6,912 | |||||||
Net cash provided by operating activities |
— | — | (1,938 | ) | ||||||
Cash flows from investing activities: |
||||||||||
Investment in subsidiary |
(16,917 | ) | — | (128,674 | ) | |||||
Net cash used in investing activities |
(16,917 | ) | — | (128,674 | ) | |||||
Cash flows from financing activities: |
||||||||||
Proceeds from issuance of debt |
16,917 | — | 40,198 | |||||||
Principal payments of debt |
— | — | (4,559 | ) | ||||||
Proceeds from issuance of common stock, net of costs |
— | — | 110,446 | |||||||
Net cash provided by financing activities |
16,917 | — | 146,085 | |||||||
Net change in cash and cash equivalents |
— | — | 15,473 | |||||||
Cash and cash equivalents, beginning of period |
— | — | — | |||||||
Cash and cash equivalents, end of period |
$ | — | $ | — | $ | 15,473 | ||||
S-3
MATTRESS FIRM HOLDING CORP.
SCHEDULE I—NOTES TO CONSOLIDATED FINANCIAL INFORMATION (PARENT COMPANY)
1. Background
These condensed parent company financial statements and notes of Mattress Firm Holding Corp. (the "Company") should be read in conjunction with the consolidated financial statements of Mattress Firm Holding Corp. and subsidiaries. The 2007 Senior Credit Facility of Mattress Holding, an indirect subsidiary of Mattress Firm Holding Corp., contains provisions whereby Mattress Holding is prohibited from distributing dividends to Mattress Firm Holding Corp. or other subsidiaries of Mattress Firm Holding Corp. As of February 1, 2011 and January 31, 2012, the net assets of Mattress Holding subject to such restrictions under the 2007 Senior Credit Facility were $149.8 million and $183.7 million, respectively.
2. Initial Public Offering
On November 23, 2011, the Company completed the initial public offering of shares of its common stock pursuant to a registration statement on Form S-1, as amended (File No. 333-174830), which was declared effective on November 17, 2011. Under the registration statement, the Company registered the offering and sale of up to an aggregate of 6,388,888 shares of common stock at a public offering price of $19.00 per share. The Company raised a total of $121.4 million in gross proceeds in the initial public offering of all 6,388,888 shares, or approximately $110.4 million in net proceeds after deducting underwriting discounts and commissions of $8.5 million and $2.4 million of estimated offering-related costs.
On November 23, 2011, the Company contributed a portion of the net proceeds from the initial public offering as follows: (i) $88.8 million of such net proceeds to repay in full all amounts outstanding under the loan facility between Mattress Intermediate Holdings, Inc., the Company's direct subsidiary, and a group of lenders maturing in January 2015 and the related accrued interest; (ii) $4.6 million of such net proceeds to repay in full the Company's 12% payment-in-kind investor notes that did not convert into shares of the Company's common stock upon the completion of the initial public offering; and (iii) $1.6 million of such net proceeds to pay accrued managed fees and interested thereon and a related termination fee to J.W. Childs Associates, L.P. in connection with the termination of the management agreement between J.W. Childs Associates, L.P. and the Company that became effective with the completion of the initial public offering. Also in connection with the consummation of the initial public offering, the Company's 12% payment-in-kind investor notes converted into 4,979,888 shares of the Company's common stock at a price per share equal to the initial public offering price of $19.00 per common share. See Notes 3 for additional information on debt activity.
3. Long-term Debt
As of February, 2011 Mattress Firm Holding Corp. had $48.9 million of outstanding Paid-in-Kind Notes, or "PIK Notes," issued to the equity investors of Mattress Holding, LLC (the parent company of Mattress Firm Holding Corp.) and various affiliates of those equity investors. The PIK Notes were issued at various times from October 24, 2007 through May 20, 2009 and mature at various dates between October 24, 2012 and March 19, 2015.
The PIK Notes bore interest at a rate of 12% per annum. Accrued interest was payable annually or semiannually, as applicable, with each such interest payment to be made through the addition of such interest amount to the outstanding principal amount of the PIK Notes. The PIK Notes required no principal payments prior to their maturity, and Mattress Firm Holding Corp. was permitted to
S-4
MATTRESS FIRM HOLDING CORP.
SCHEDULE I—NOTES TO CONSOLIDATED FINANCIAL INFORMATION (PARENT COMPANY) (Continued)
3. Long-term Debt (Continued)
prepay the PIK Notes, in whole or in part, at any time without premium or penalty. Amounts prepaid will be applied first to accrued interest and then to the repayment of the outstanding principal amounts of the PIK Notes.
On November 23, 2011, in connection with the consummation of the initial public offering, (1) the Company used $4.6 million of the net proceeds from the initial public offering to repay in full the Company's PIK Notes that did not convert into shares of the Company's common stock upon the completion of the initial public offering and (2) the aggregate remaining principal and accrued interest balance of $41.9 million were converted into 2,205,953 shares the Company's common stock at a price per share equal to the initial public offering price of $19.00 per common share.
The PIK Notes were not guaranteed by any of the subsidiaries of Mattress Firm Holding Corp. All obligations under the PIK Notes were unsecured. The PIK Notes contained no financial or restrictive covenants.
On July 19, 2011, the Company issued convertible notes in an aggregate principal amount of $40.2 million ("Convertible Notes"). The Convertible Notes accrued interest at an annual rate of 12%, payable annually on July 18 of each year and are to mature on July 18, 2016. All interest was paid "in kind" rather than in cash, meaning that payments of interest were made as additions to the outstanding principal amount of the Convertible Notes. The Company was permitted to prepay the Convertible Notes, in whole or in part, at any time without premium or penalty. On November 23, 2011, in connection with the consummation of the initial public offering, the Convertible Notes with an aggregate principal and accrued interest balance of $41.9 million automatically converted into 2,205,953 shares of common stock at a price per share equal to the initial public offering price of $19.00 per common share.
S-5
MATTRESS FIRM HOLDING CORP.
SCHEDULE II—VALUATION AND QUALIFYING ACCOUNTS
For the three years ended January 31, 2012
| |
|
Additions | |
|
||||||||||||
|---|---|---|---|---|---|---|---|---|---|---|---|---|---|---|---|---|
Description
|
Balance at Beginning of Period |
Charged to Income |
Charged to Other Accounts |
Deductions from Reserves(1) |
Balance at End of Period |
|||||||||||
| |
(in thousands) |
|||||||||||||||
Year Ended February 2, 2010: |
||||||||||||||||
Uncollectible accounts receivable |
$ | 53 | $ | 64 | $ | — | $ | — | $ | 117 | ||||||
Sales returns reserve |
66 | 1,048 | — | 1,046 | 68 | |||||||||||
Store closing reserve |
1,482 | 2,440 | — | 2,207 | 1,714 | |||||||||||
Year Ended February 1, 2011: |
||||||||||||||||
Uncollectible accounts receivable |
$ | 117 | $ | — | $ | — | $ | 13 | $ | 104 | ||||||
Sales returns reserve |
68 | 1,613 | — | 1,168 | 513 | |||||||||||
Store closing reserve |
1,714 | 666 | — | 2,227 | 153 | |||||||||||
Year Ended January 31, 2012: |
||||||||||||||||
Uncollectible accounts receivable |
$ | 104 | $ | — | $ | — | $ | 7 | $ | 97 | ||||||
Sales returns reserve |
513 | 3,651 | — | 3,085 | 1,079 | |||||||||||
Store closing reserve |
153 | 1,402 | — | 991 | 564 | |||||||||||
- (1)
- Deductions from reserves represent losses or expenses for which the respective reserves were created. In the case of the uncollectible accounts receivable, deductions are net of recovered amounts previously written off.
S-6
| Exhibit Number |
Exhibit Title | ||
|---|---|---|---|
| 1.1 | * | Form of Underwriting Agreement. | |
2.1 |
Stock Purchase Agreement dated April 9, 2012, by and among Mattress Firm, Inc., the sellers party thereto and FS Equity Partners V, L.P., as seller representatives (incorporated by reference to Exhibit 2.1 to Mattress Firm Holding Corp.'s Report on Form 8-K (File No. 001-35354) filed April 10, 2012). |
||
2.2 |
Asset Purchase Agreement dated September 4, 2012, by and among Mattress Firm, Inc., as buyer, Mattress XPress, Inc., Mattress XPress of Georgia, Inc., Steven Milesic and Steve Lytell (incorporated by reference to Exhibit 2.1 to Mattress Firm Holding Corp.'s Report on Form 8-K (File No. 001-35354) filed September 6, 2012). |
||
3.1 |
Amended and Restated Certificate of Incorporation of Mattress Firm Holding Corp. (incorporated by reference to Exhibit 3.1 to Mattress Firm Holding Corp.'s Report on Form 8-K (File No. 001-35354) filed November 29, 2011). |
||
3.2 |
Amended and Restated Bylaws of Mattress Firm Holding Corp. (incorporated by reference to Exhibit 3.2 to Mattress Firm Holding Corp.'s Report on Form 10-K (File No. 001-35354) filed April 20, 2012). |
||
4.1 |
Registration Rights Agreement between Mattress Firm Holding Corp. and certain equity holders of Mattress Holdings, LLC (incorporated by reference to Exhibit 4.1 to Mattress Firm Holding Corp.'s Registration Statement on Form S-1/A (File No. 333-174830) filed September 28, 2011). |
||
5.1 |
* |
Form of Opinion of Ropes & Gray LLP. |
|
10.1 |
† |
Mattress Firm Holding Corp. 2011 Omnibus Incentive Plan (incorporated by reference to Exhibit 10.1 to Mattress Firm Holding Corp.'s Registration Statement on Form S-1/A (File No. 333-174830) filed November 7, 2011). |
|
10.2 |
† |
Second Amended and Restated Employment Agreement of R. Stephen Stagner, dated September 14, 2011(incorporated by reference to Exhibit 10.2 to Mattress Firm Holding Corp.'s Registration Statement on Form S-1/A (File No. 333-174830) filed September 28, 2011). |
|
10.3 |
† |
Amended and Restated Employment Agreement of James R. Black, dated September 14, 2011 (incorporated by reference to Exhibit 10.3 to Mattress Firm Holding Corp.'s Registration Statement on Form S-1/A (File No. 333-174830) filed September 28, 2011). |
|
10.4 |
† |
Amended and Restated Employment Agreement of Stephen G. Fendrich, dated September 14, 2011 (incorporated by reference to Exhibit 10.4 to Mattress Firm Holding Corp.'s Registration Statement on Form S-1/A (File No. 333-174830) filed September 28, 2011). |
|
10.5 |
† |
Offer Letter and Employment, Confidentiality and Non-Competition Agreement of George McGill, dated June 5, 2009 and June 8, 2009, respectively (incorporated by reference to Exhibit 10.5 to Mattress Firm Holding Corp.'s Registration Statement on Form S-1/A (File No. 333-174830) filed September 28, 2011). |
|
E-1
| Exhibit Number |
Exhibit Title | ||
|---|---|---|---|
| 10.6 | † | Offer Letter and Employment, Confidentiality and Non-Competition Agreement of Bruce Levy, dated December 10, 2008 and December 12, 2008, respectively (incorporated by reference to Exhibit 10.6 to Mattress Firm Holding Corp.'s Registration Statement on Form S-1/A filed September 28, 2011). | |
10.7 |
Credit Agreement, dated as of January 18, 2007, as amended and restated as of February 16, 2007, among Mattress Holding Corp., as Borrower, Mattress Holdco, Inc. and the other guarantors party thereto, the lenders party thereto and UBS Securities LLC, as Sole Arranger, Sole Bookmanager and Syndication Agent, UBS AG, Stamford Branch, as Issuing Bank, Administrative Agent and Collateral Agent, UBS Loan Finance LLC, as Swingline Lender, and Amegy Bank National Association, as Documentation Agent (incorporated by reference to Exhibit 10.7 to Mattress Firm Holding Corp.'s Registration Statement on Form S-1/A (File No. 333-174830) filed August 26, 2011). |
||
10.8 |
Amendment No. 1, dated as of June 28, 2011, to the Credit Agreement, dated as of January 18, 2007, as amended and restated as of February 16, 2007 and amended by the Term Loan Increase Joinder dated October 24, 2007, among Mattress Holding Corp., Mattress Holdco, Inc., the lenders party thereto, the subsidiary guarantors party thereto, UBS Securities LLC, and UBS AG, Stamford Branch (incorporated by reference to Exhibit 10.8 to Mattress Firm Holding Corp.'s Registration Statement on Form S-1/A (File No. 333-174830) filed July 8, 2011). |
||
10.9 |
Form of Director and Officer Indemnification Agreement (incorporated by reference to Exhibit 10.11 to Mattress Firm Holding Corp.'s Registration Statement on Form S-1/A (File No. 333-174830) filed September 28, 2011). |
||
10.10 |
Simmons Dealer Incentive Agreement between Simmons Bedding Company and Mattress Firm, Inc., dated June 1, 2010 (incorporated by reference to Exhibit 10.13 to Mattress Firm Holding Corp.'s Registration Statement on Form S-1/A (File No. 333-174830) filed July 8, 2011). |
||
10.11 |
Product Supply Agreement between Sealy Mattress Company and Mattress Firm, Inc., dated January 1, 2009 (incorporated by reference to Exhibit 10.14 to Mattress Firm Holding Corp.'s Registration Statement on Form S-1/A (File No. 333-174830) filed July 8, 2011). |
||
10.12 |
Amendment to 2009 Agreement between Sealy Mattress Company and Mattress Firm, Inc., dated November 30, 2010 (incorporated by reference to Exhibit 10.15 to Mattress Firm Holding Corp.'s Registration Statement on Form S-1/A (File No. 333-174830) filed July 8, 2011). |
||
10.13 |
First Amendment to Product Supply Agreement between Sealy Mattress Company and Mattress Firm, Inc., dated May 1, 2009 (incorporated by reference to Exhibit 10.17 to Mattress Firm Holding Corp.'s Registration Statement on Form S-1/A (File No. 333-174830) filed July 8, 2011). |
||
10.14 |
Retailer Agreement between Mattress Firm, Inc. and Tempur-Pedic North America, LLC, effective May 23, 2012 (incorporated by reference to Exhibit 10.1 to Mattress Firm Holding Corp.'s Quarterly Report on Form 10-Q (File No. 001-35354) filed September 12, 2012). |
||
10.15 |
† |
Mattress Firm Holding Corp. Executive Annual Incentive Plan (incorporated by reference to Exhibit 10.21 to Mattress Firm Holding Corp.'s Registration Statement on Form S-1/A (File No. 333-174830) filed November 7, 2011). |
|
E-2
| Exhibit Number |
Exhibit Title | ||
|---|---|---|---|
| 10.16 | Form of Option Award Agreement (incorporated by reference to Exhibit 10.24 to Mattress Firm Holding Corp.'s Registration Statement on Form S-1/A (File No. 333-174830) filed November 7, 2011). | ||
10.17 |
† |
Independent Director Compensation Policy (incorporated by reference to Exhibit 10.25 to Mattress Firm Holding Corp's Report on Form 10-K (File No. 001-35354) filed April 20, 2012). |
|
21.1 |
** |
Subsidiaries of Mattress Firm Holding Corp. |
|
23.1 |
** |
Consent of Grant Thornton LLP. |
|
23.2 |
** |
Consent of McGladrey LLP. |
|
23.3 |
* |
Consent of Ropes & Gray LLP (included in Exhibit 5.1). |
|
24.1 |
** |
Powers of Attorney (included in signature page) |
|
101.INS |
* |
XBRL Instance Document |
|
101.SCH |
* |
XBRL Taxonomy Extension Schema Document |
|
101.CAL |
* |
XBRL Taxonomy Extension Calculation Linkbase Document |
|
101.LAB |
* |
XBRL Taxonomy Extension Lables Linkbase Document |
|
101.PRE |
* |
XBRL Taxonomy Extension Presentation Linkbase Document |
|
101.DEF |
* |
XBRL Taxonomy Extension Definition Linkbase Document |
|
- *
- To
be subsequently filed.
- **
- Filed
herewith.
- †
- Indicates management contracts or compensatory plans or arrangements in which our executive officers or directors participate.
E-3