Attached files
| file | filename |
|---|---|
| EX-1.1 - FORM OF UNDERWRITING AGREEMENT - RH | d70987dex11.htm |
| EX-23.2 - CONSENT OF PRICEWATERHOUSECOOPERS LLP - RH | d70987dex232.htm |
| EX-23.3 - CONSENT OF PRICEWATERHOUSECOOPERS LLP - RH | d70987dex233.htm |
Table of Contents
As filed with the Securities and Exchange Commission on September 19, 2012
Registration No. 333-176767
UNITED STATES
SECURITIES AND EXCHANGE COMMISSION
Washington, D.C. 20549
Amendment No. 5
to
FORM S-1
REGISTRATION STATEMENT
UNDER
THE SECURITIES ACT OF 1933
RESTORATION HARDWARE HOLDINGS, INC.
(Exact name of registrant as specified in its charter)
| Delaware | 5712 | 45-3052669 | ||
| (State or other jurisdiction of incorporation or organization) |
(Primary Standard Industrial Classification Code Number) |
(I.R.S. Employer Identification Number) |
15 Koch Road, Suite J
Corte Madera, CA 94925
(415) 924-1005
(Address, including zip code, and telephone number, including area code, of registrant’s principal executive offices)
Carlos E. Alberini
Chief Executive Officer
15 Koch Road, Suite J
Corte Madera, CA 94925
(415) 924-1005
(Name, address, including zip code, and telephone number, including area code, of agent for service)
Copies to:
| Stewart L. McDowell, Esq. Steven R. Shoemate, Esq. Gibson Dunn & Crutcher, LLP 555 Mission Street San Francisco, CA 94105 Tel: (415) 393-8200 Fax: (415) 986-5309 |
Gavin B. Grover, Esq. John M. Rafferty, Esq. Andrew D. Thorpe, Esq. Morrison & Foerster LLP 425 Market Street San Francisco, CA 94105 Tel: (415) 268-7000 Fax: (415) 268-7522 |
Sharon R. Flanagan, Esq. Justin L. Bastian, Esq. Sidley Austin LLP 555 California Street San Francisco, CA 94104 Tel: (415) 772-1200 Fax: (415) 772-7400 |
Approximate date of commencement of proposed sale to the public: As soon as practicable after the effective date of this registration statement.
If any of the securities being registered on this Form are to be offered on a delayed or continuous basis pursuant to Rule 415 under the Securities Act of 1933 check the following box. ¨
If this Form is filed to register additional securities for an offering pursuant to Rule 462(b) under the Securities Act, please check the following box and list the Securities Act registration statement number of the earlier effective registration statement for the same offering. ¨
If this Form is a post-effective amendment filed pursuant to Rule 462(c) under the Securities Act, check the following box and list the Securities Act registration statement number of the earlier effective registration statement for the same offering. ¨
If this Form is a post-effective amendment filed pursuant to Rule 462(d) under the Securities Act, check the following box and list the Securities Act registration statement number of the earlier effective registration statement for the same offering. ¨
Indicate by check mark whether the registrant is a large accelerated filer, an accelerated filer, a non-accelerated filer, or a smaller reporting company. See the definition of “large accelerated filer,” “accelerated filer” and “smaller reporting company” in Rule 12b-2 of the Exchange Act.
| Large accelerated filer | ¨ | Accelerated filer | ¨ | |||
| Non-accelerated filer | x (Do not check if a smaller reporting company) | Smaller reporting company | ¨ | |||
The Registrant hereby amends this Registration Statement on such date or dates as may be necessary to delay its effective date until the Registrant shall file a further amendment which specifically states that this Registration Statement shall thereafter become effective in accordance with Section 8(a) of the Securities Act of 1933, as amended, or until the Registration Statement shall become effective on such date as the Securities and Exchange Commission, acting pursuant to said Section 8(a), may determine.
CALCULATION OF REGISTRATION FEE
|
| ||||
| Title of Each Class of Securities to be Registered |
Proposed Maximum Aggregate Offering Price(1)(2) |
Amount of Registration Fee | ||
| Common stock, $0.0001 par value |
$150,000,000 | (3) | ||
|
| ||||
|
| ||||
| (1) | Estimated solely for the purpose of computing the amount of the registration fee pursuant to Rule 457(o) under the Securities Act of 1933, as amended. |
| (2) | Includes offering price of shares that the underwriters have the option to purchase. |
| (3) | Registration fee for the common stock being offered under this amended Registration Statement has been previously paid at the time of the initial filing of this Registration Statement on September 9, 2011. |
Table of Contents
The information in this preliminary prospectus is not complete and may be changed. We and the selling stockholders may not sell these securities until the registration statement filed with the Securities and Exchange Commission is effective. This preliminary prospectus is not an offer to sell these securities and it is not soliciting an offer to buy these securities in any state or other jurisdiction where the offer or sale is not permitted.
Subject to Completion
Preliminary Prospectus dated September 19, 2012
PROSPECTUS
Shares

Common Stock
This is Restoration Hardware Holdings, Inc.’s initial public offering.
We are selling shares of our common stock and the selling stockholders identified in this prospectus are selling shares of our common stock. We will not receive any of the proceeds from the sale of shares to be offered by the selling stockholders.
We expect the public offering price to be between $ and $ . Since June 2008 and prior to this offering, there has been no public market for the shares. After pricing this offering, we expect that the shares will trade on the NYSE under the symbol “RH.”
We are an “emerging growth company” as defined in the Jumpstart Our Business Startups Act of 2012 and, as such, will be subject to reduced public company reporting requirements.
Investing in our common stock involves risks that are described in the “Risk Factors” section beginning on page 18 of this prospectus.
| Per Share | Total | |||||||
| Public offering price |
$ | $ | ||||||
| Underwriting discount |
$ | $ | ||||||
| Proceeds, before expenses, to us |
$ | $ | ||||||
| Proceeds, before expenses, to the selling stockholders |
$ | $ | ||||||
The underwriters may also exercise their option to purchase up to an additional shares from the selling stockholders, at the public offering price, less the underwriting discount, for 30 days after the date of this prospectus. In connection with this offering, fees will be paid to the qualified independent underwriter. See “Underwriting.”
Neither the Securities and Exchange Commission nor any state securities commission has approved or disapproved of these securities or determined if this prospectus is truthful or complete. Any representation to the contrary is a criminal offense.
The shares will be ready for delivery on or about , 2012.
| BofA Merrill Lynch | Goldman, Sachs & Co. | |||||||
| Baird | William Blair | Piper Jaffray | Stifel Nicolaus Weisel | |||||
The date of this prospectus is , 2012.
Table of Contents
| Page | ||||
| ii | ||||
| 1 | ||||
| 18 | ||||
| 41 | ||||
| 43 | ||||
| 44 | ||||
| 45 | ||||
| 47 | ||||
| Selected Historical Consolidated Financial and Operating Data |
49 | |||
| Management’s Discussion and Analysis of Financial Condition and Results of Operations |
54 | |||
| 83 | ||||
| 103 | ||||
| 110 | ||||
| 118 | ||||
| 120 | ||||
| 127 | ||||
| 129 | ||||
| 133 | ||||
| Material U.S. Federal Income Tax Considerations to Non-U.S. Holders |
135 | |||
| 139 | ||||
| 146 | ||||
| 146 | ||||
| 147 | ||||
| F-1 | ||||
You should rely only on the information contained in this prospectus or in any free writing prospectus that we authorize to be delivered to you. Neither we nor the selling stockholders or underwriters have authorized anyone to provide you with additional or different information. If anyone provides you with additional, different or inconsistent information, you should not rely on it. This prospectus is an offer to sell only the shares offered hereby, but only under circumstances and in jurisdictions where it is lawful to do so. The information contained in this prospectus is current only as of its date.
i
Table of Contents
We use a 52 – 53 week fiscal year ending on the Saturday closest to January 31. Fiscal years are identified in this prospectus according to the calendar year prior to the calendar year in which they end. For example, references to “2011,” “fiscal 2011” or similar references refer to the fiscal year ended January 28, 2012.
All of the outstanding capital stock of Restoration Hardware, Inc. was acquired on June 16, 2008, by Home Holdings, LLC, which we refer to in this prospectus as the “Acquisition.” Home Holdings’ equity interests are held primarily by (i) CP Home Holdings, LLC, an investment entity managed by funds affiliated with Catterton Management Company, LLC, (ii) Tower Three Home LLC, an investment fund managed by Tower Three Partners, LLC, and (iii) funds affiliated with Glenhill Capital Management LLC. In this prospectus, we refer to CP Home Holdings, LLC and its affiliated funds as “Catterton,” we refer to Tower Three Home LLC and its affiliated funds as “Tower Three” and we refer to Glenhill Capital Management LLC and its affiliated funds as “Glenhill.” As a result of the Acquisition, a new basis of accounting was created beginning June 17, 2008. In this prospectus, the periods prior to the Acquisition are referred to as the “Predecessor” periods and the periods after the Acquisition are referred to as the “Successor” periods. The Predecessor periods presented in this prospectus for 2008 include the period from February 3, 2008 through June 16, 2008, reflecting approximately 19 weeks of operations, and the Successor periods presented in this prospectus for 2008 include the period from June 17, 2008 through January 31, 2009, reflecting approximately 33 weeks of operations. Due to the Acquisition, the financial statements presented in this prospectus for the Successor periods are not comparable to those of the Predecessor periods.
In this prospectus, when we refer to “store level cash contribution margin,” we mean store net revenues less product costs and cash operating costs related to store operations, divided by store net revenues.
In this prospectus, when we refer to “store demand” in a market, we mean the dollar value of orders booked by customers associated with that particular location for the specified period.
In this prospectus, when we refer to “direct demand” in a market, we mean the dollar value of orders booked by customers through catalogs and e-commerce in that market for the specified period.
ii
Table of Contents
This summary highlights some of the key information contained elsewhere in this prospectus. This summary does not contain all of the information that you should consider in making your investment decision. You should read the following summary together with the entire prospectus carefully, including “Risk Factors,” “Management’s Discussion and Analysis of Financial Condition and Results of Operations,” the more detailed information regarding our Company and the common stock being sold in this offering, as well as our consolidated financial statements and the related notes appearing elsewhere in this prospectus, before deciding to invest in our common stock. Some of the statements in this prospectus constitute forward-looking statements. See “Forward-Looking Statements and Market Data.”
Except where the context otherwise requires or where otherwise indicated, the terms “Restoration Hardware,” “we,” “us,” “our,” “our Company” and “our business” refer, prior to the Reorganization discussed below, to Restoration Hardware, Inc. and, after the Reorganization, to Restoration Hardware Holdings, Inc., in each case together with its consolidated subsidiaries, including Restoration Hardware, Inc., as a combined entity. The term “Restoration Hardware Holdings” refers to Restoration Hardware Holdings, Inc. and the term “Home Holdings” refers to Home Holdings, LLC, and, in each case, not to any of their subsidiaries.
Our Company
We believe RH is one of the most innovative and fastest growing luxury brands in the home furnishings marketplace. We believe our brand stands alone and is redefining this highly fragmented and growing market, contributing to our superior sales growth and market share gains over the past several years as compared to industry growth rates. Our ability to innovate, curate and integrate products, categories, services and businesses with a completely authentic and distinctive point of view, then rapidly scale them across our fully integrated multi-channel infrastructure is a powerful platform for continued long-term growth. We evolved our brand to become RH, positioning our Company to curate a lifestyle beyond the four walls of the home. Our unique product development, go-to-market and supply chain capabilities, together with our significant scale, enable us to offer a compelling combination of design, quality and value that we believe is unparalleled in the marketplace.
Our business is fully integrated across our multiple channels of distribution, consisting of our stores, catalogs and websites. As of July 28, 2012, we operated a total of 73 retail stores, consisting of 71 Galleries and 2 full line Design Galleries, and 10 outlet stores throughout the United States and Canada. In fiscal 2011, we distributed approximately 26.1 million catalogs, and our websites logged over 14.3 million unique visits.
Over the last several years, we achieved strong growth in sales and profitability, as illustrated by the following:
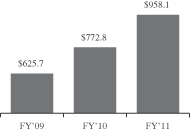
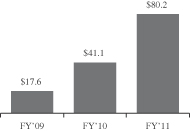
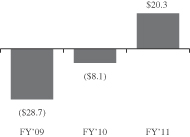
| • | From fiscal 2009 to fiscal 2011, we increased our net revenues 53% to $958.1 million, our Adjusted EBITDA 356% to $80.2 million and our Adjusted EBITDA margin by 555 basis points to 8.4%. Over the same time period we increased our net income by $49.0 million from a net loss of $28.7 million to net income of $20.3 million; and |
| • | We achieved ten consecutive quarters of double-digit net revenue growth through our fiscal quarter ended July 28, 2012. We achieved this growth as we reduced our store base from 95 retail locations as of January 30, 2010, to 73 locations as of July 28, 2012. |
1
Table of Contents
| Net revenues |
Adjusted EBITDA |
Net income (loss) | ||
| (dollars in millions) | ||||
|
|
|
See “Selected Historical Consolidated Financial and Operating Data” for a discussion of Adjusted EBITDA and a reconciliation of the differences between Adjusted EBITDA and net income (loss).
Our Competitive Strengths
We attribute our success to the following competitive strengths:
Our Market-Redefining Luxury Brand. We believe RH stands alone as a leading luxury brand of inspired design, and is redefining the highly fragmented home furnishings market by offering a compelling combination of design, quality and value. We believe we are changing the home furnishings landscape by attracting affluent consumers from designer showrooms and high-end boutiques, as well as aspirational consumers trading up from department stores and other home furnishings retailers. In a market characterized by smaller, independent competitors, we believe our luxury positioning, superior quality and significant scale enable us to grow our market share.
Our Unique Development Model. We believe our unique approach to the development of new products, categories and services enables us to gain market share, adapt our business to emerging trends, stay relevant with our customers and enter into new businesses that leverage our strengths. The foundation of our unique development model is:
| • | Innovation. We are dedicated to offering products and services that push established boundaries. The scope of our innovation is demonstrated in every aspect of our organization, including in our products and services, our stores and presentation, our channel-agnostic go-to-market strategy and our fully integrated supply chain and systems infrastructure. |
| • | Curation. At our core we are not designers, rather we are curators and composers of inspired design and experiences. We travel the world in search of people, ideas, items, experiences and inspiration, and then create a composition that is unique and entirely our own. |
| • | Integration. Everything we curate and compose must be beautifully and intelligently integrated, enhancing the appeal of our offering and experience. This process involves both “art and science” as we integrate new products, categories, services and businesses that enhance our existing offering, and as our supporting functions and infrastructure are integrated to achieve our goals. |
Our ability to innovate, curate and integrate products, categories, services and businesses, then rapidly scale them across our fully integrated multi-channel infrastructure is a powerful platform for continued long-term growth.
Our Superior Capabilities. Our product development and multi-channel go-to-market capabilities, together with our fully integrated infrastructure and significant scale, enable us to offer a compelling combination of design, quality and value that we believe is unparalleled in the marketplace.
| • | Highly Differentiated Product Development Capabilities. We have established a cross-functional organization centered on product leadership, with teams that collaborate across functions and work |
2
Table of Contents
| closely with our network of artisan partners. Our product development platform and significant scale have enabled us to introduce an increasing number of new products with each collection and dramatically shorten our product lead times, while allowing us to offer greater value to our customers. |
| • | Multi-Channel Go-To-Market Ability. We pursue a market-based rather than a channel-based sales strategy where we size our stores to the potential of the area that each location serves and leverage our direct channels to provide access to our complete product offering. This approach is designed to enhance the customer experience, generate greater sales, increase our market share and deliver higher returns on invested capital. |
| • | Fully Integrated Infrastructure. Our infrastructure is integrated across our channels, providing strong direct sourcing capabilities, a centrally managed inventory and a reconfigured distribution network and new order management, warehouse management and point-of-sale systems. We believe our sophisticated operating platform provides us with significant capabilities to support our future growth. |
Our High-Performance Culture and Team. We have built a high-performance organization driven by a company-wide commitment to our core values of People, Quality, Service and Innovation. We believe our leadership team, led by our Chief Executive Officer, Carlos Alberini, is a key driver of our success and positions us to execute our long-term growth strategy. We also benefit from the vision and advice of Gary Friedman, our former Chairman and Co-Chief Executive Officer, who serves as our Creator and Curator on an advisory basis.
Our Growth Strategy
Key elements of our growth strategy are to:
Transform Our Real Estate Platform. We believe we have an opportunity to significantly increase our sales by transforming our real estate platform from a mall-based retail footprint to a portfolio focused on full line Design Galleries. With a target size of approximately 21,500 square feet of selling space, our full line Design Galleries have approximately three times the selling square footage of our current average Gallery. We have identified approximately 50 key metropolitan markets where we can open new full line Design Galleries. We believe, based on our analysis of the market, that we have the opportunity to double our current selling square footage in the U.S. and Canada over the next 7 to 10 years by opening full line Design Galleries in these 50 identified markets.
We opened our first two full line Design Galleries in Los Angeles in June 2011 and Houston in November 2011, where we consolidated demand by closing existing retail stores in each market. In the Los Angeles market, we have increased store demand by over 90% and direct demand by over 30% in the first full year of operation of our new full line Design Gallery. In the Houston market, in the first 9 months of operation of the new full line Design Gallery, we have increased store demand by over 60% and direct demand by over 50%. Over the next 24 months, we plan to open full line Design Galleries in iconic or high profile locations in Scottsdale, Boston, Greenwich (Connecticut) and Atlanta. We are also actively exploring opening Design Galleries in other key markets such as New York City, Miami, Dallas and Chicago.
Expand Our Offering and Increase Our Market Share. We participate in the domestic housewares and home furnishings market, that based on our research we believe represented $143 billion in sales in 2010. Our annual net revenues currently represent less than 1% of this market, and we believe we have a significant opportunity to increase our market share by:
| • | Growing our merchandise assortment and introducing new products and categories, including current initiatives in furniture, rugs, lighting, tabletop and baby and child; |
| • | Expanding our service offerings including interior design, product customization and gift registry services; and |
| • | Exploring and testing new business opportunities complementary to our core business that leverage our defining strengths of taste, style and innovation. |
3
Table of Contents
Increase Brand Awareness. We will continue to increase our brand awareness and customer loyalty through our real estate transformation, our circulation strategy, our digital and social media marketing initiative, and our increased advertising and public relations efforts. Our stores are a critical branding vehicle and we believe the transformation of our real estate platform to a portfolio focused on full line Design Galleries will contribute to increased brand awareness as our customers experience an enhanced expression of our luxury brand positioning. Our Source Books and other catalogs are also an important branding and advertising vehicle. Our Source Book strategy has contributed to a 41% increase in the number of catalog pages circulated and a 27% increase in net revenues for our direct business in fiscal 2011. We plan to increase the number of catalog pages circulated in fiscal 2012 by more than 75% over fiscal 2011.
Pursue International Expansion. We plan to strategically expand our business into select countries outside of the United States and Canada over the next several years. We believe that our luxury brand positioning and unique aesthetic will have strong international appeal.
Increase Operating Margins. We have the opportunity to continue to improve our operating margins by leveraging our fixed occupancy costs and scalable infrastructure, and by expanding our merchandise margins. We believe that our real estate transformation, specifically consolidating multiple Galleries into single full line Design Galleries, will allow us to better leverage our fixed occupancy costs.
For a discussion of risks that could adversely affect our growth strategies, see “Risk Factors—Risks Related to Our Business.”
Our High-Performance Culture
Our culture is driven by our management team, which instills a company-wide commitment to our core values of People, Quality, Service and Innovation. We believe our distinct corporate culture allows us to attract highly talented team members who are passionate and driven and who share our vision.
Evolution of Our Business
In 2001, we began to reposition Restoration Hardware from a nostalgic, discovery-items business to a leading home furnishings brand. In 2008, we were taken private by investment funds affiliated with Catterton, Tower Three and Glenhill. As a private company, we were able to accelerate the pace of the transformation of our business and brand and the development of our multi-channel business model and infrastructure. Over the last eleven years, we built a new company as we:
| • | Elevated our brand positioning; |
| • | Enhanced our product development process; |
| • | Refined our go-to-market strategy; |
| • | Reconceptualized our stores and developed our full line Design Gallery format; |
| • | Built a new supply chain and systems infrastructure; and |
| • | Strengthened our management team. |
We believe these initiatives have contributed to our recent strong performance and increased profitability, and position us for sustained growth and profitability.
4
Table of Contents
Our Market
We participate in the large and growing domestic housewares and home furnishings market. Based on our research, we believe this market generated $143 billion in retail sales in 2010 and is projected to grow at a compound annual growth rate of 3% – 4% between 2011 and 2015. Our annual net revenues currently represent less than 1% of this market, providing us with a substantial opportunity to gain market share.
According to Euromonitor International, a market research and analysis firm, the U.S. housewares and home furnishings market is highly fragmented. The top 20 companies comprised only 20% of the total market in 2008, with the largest player representing less than 3% of the total market. As a result of the weakening housing market and economic downturn in 2007, many home furnishings retailers were forced to close stores, dramatically scale back operations or lower prices. While our sales results were also adversely affected during this period, this disruption also created an opportunity for us to differentiate our brand in the marketplace. We believe we are well positioned to gain market share in the current competitive environment as a result of our compelling combination of design, quality and value.
We target households with incomes of $200,000 and higher, which we believe drive a disproportionate share of spending in the home furnishings market. We believe that these consumers are highly attractive as they tend to be less impacted by an economic downturn and return to spending more quickly in an economic recovery.
Summary Risk Factors
We are subject to a number of risks, including risks that may prevent us from achieving our business objectives or that may adversely affect our business, financial condition, results of operations, cash flows and prospects. You should carefully consider the following risks, including the risks discussed in the section entitled “Risk Factors,” before investing in our common stock:
| • | We are undertaking a large number of business initiatives at the same time and if these new initiatives are not successful, they may have a negative impact on our operating results. |
| • | Growth in our business may not be sustained and may not generate a corresponding improvement in our results of operations. |
| • | If we fail to successfully anticipate consumer preferences and demand, or to manage our inventory commensurate with demand, our results of operations may be adversely affected. |
| • | Our growth strategy and performance depend on our ability to purchase our merchandise in sufficient quantities at competitive prices, including our products that are produced by artisans and specialty vendors, and any disruptions we experience in our ability to obtain our products in a timely fashion or in the quantities required could have a material adverse effect on our business. |
| • | If any of our vendors is not able to meet our product requirements, we may not be able to develop relationships with new alternative vendors to replace those product requirements in a timely and satisfactory manner, which could lead to product shortages and customer backorders, which could harm our business. |
| • | We do not have exclusive relationships with many of our vendors, and there is a risk that our vendors may sell similar or identical products to our competitors, which could harm our business. |
| • | We may not have adequate remedies with our vendors for defective merchandise, which could damage our reputation and brand image and harm our business. |
| • | Changes in consumer spending or the housing market may significantly harm our revenue and results of operations. |
| • | If we lose key personnel or are unable to hire additional qualified personnel, our business may be harmed. |
5
Table of Contents
| • | Our operations have significant liquidity and capital requirements and depend on the availability of adequate financing on reasonable terms, and if we are unable to borrow sufficient capital, it could have a significant negative effect on our business. |
| • | A number of factors that affect our ability to successfully open new stores or to optimize our store footprint are beyond our control, and these factors may harm our ability to execute our strategy of sizing stores to the potential of the market, which may negatively affect our results of operations. |
| • | Our operating results are subject to quarterly and seasonal fluctuations, and results for any quarter may not necessarily be indicative of the results that may be achieved for the full fiscal year. |
| • | Our business depends in part on a strong brand image. We continue to invest in the development of our brand and the marketing of our business, and if we are not able to maintain and enhance our brand or market our product offerings, we may be unable to attract a sufficient number of customers or sell sufficient quantities of our products. |
| • | We are exploring opportunities to expand into new categories or complementary businesses. If we are not successful in these new categories or business areas, it may have an adverse effect on our results of operations and our reputation. |
| • | Our former Chairman and Co-Chief Executive Officer, Gary Friedman, resigned from these positions and as a director of the Company effective as of , 2012. There can be no assurance that these developments will not have an adverse impact on us. |
Reorganization
Restoration Hardware Holdings was incorporated as a Delaware corporation on August 18, 2011, by our sole stockholder, Home Holdings, for the purpose of acquiring all of the stock of Home Holdings’ wholly owned subsidiary, Restoration Hardware, Inc. Restoration Hardware Holdings will acquire all of the outstanding shares of Restoration Hardware, Inc. prior to the effectiveness of this offering. Outstanding units under the 2008 Home Holdings equity compensation plan, which we refer to as the Team Resto Ownership Plan, will be converted in connection with this offering into shares of our common stock. In this prospectus, we refer to these transactions as the “Reorganization.”
Principal Equity Holders
Home Holdings’ equity interests are held primarily by funds affiliated with Catterton, Tower Three and Glenhill. In this prospectus, we refer to Catterton, Tower Three and Glenhill as our “Principal Equity Holders.”
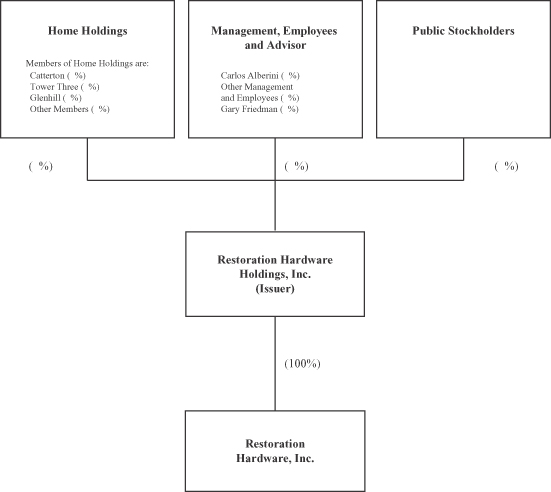
Home Holdings will remain in place and will continue to be the single largest holder of our common stock immediately after the completion of this offering. Interests of Catterton, Tower Three and Glenhill in our Company will continue to be held indirectly through their ownership interests in Home Holdings immediately following this offering. We intend to enter into a stockholders agreement with Home Holdings in connection with the offering. The stockholders agreement will provide for a waiver of the corporate opportunity doctrine with respect to Home Holdings and its affiliates, including the Principal Equity Holders. The stockholders agreement and our certificate of incorporation will provide that Home Holdings shall appoint two members to the board of directors and that no action may be taken or vote approved by our board of directors or any committee thereof (other than the audit committee) without the affirmative vote of both directors nominated by Home Holdings, for so long as Home Holdings holds at least shares of our common stock. In addition, the stockholders agreement will provide that certain actions may not be taken without the prior approval of Home Holdings. See “Certain Relationships and Related Party Transactions—Stockholders Agreement.”
Catterton. Catterton is a leading private equity firm with an exclusive focus on providing equity capital in support of small to middle-market consumer companies that are positioned for attractive growth. Since its
6
Table of Contents
founding in 1989, Catterton has invested in approximately 80 companies and led equity investments totaling over $3.3 billion. Currently, Catterton is actively managing more than $2.5 billion of equity capital focused on all sectors of the consumer industry: food, beverage, retail, restaurants, consumer products, consumer services and media and marketing services. Catterton’s combination of investment capital, strategic operating skills and industry network has enabled it to become a highly sought after firm within this industry.
Tower Three. Tower Three is an operationally-focused private equity fund formed to create a concentrated portfolio of investments in U.S.-based middle-market businesses. Tower Three’s professionals are experienced with operational management, financial restructuring, private equity and credit markets. With long-term committed capital from major institutional investors, Tower Three has the flexibility to participate in a variety of transactions.
Glenhill. Glenhill is a privately owned investment partnership that invests primarily in public equity markets internationally. Founded in 2001, Glenhill is led by Glenn J. Krevlin, who has served as the managing member of Krevlin Advisors, LLC, an investment management firm, which is the general partner of Glenhill.
Funds affiliated with Catterton and Tower Three invested in Home Holdings in order to fund Home Holdings’ acquisition of Restoration Hardware, Inc. Funds associated with Glenhill acquired their interests in Home Holdings pursuant to a rollover agreement, pursuant to which such funds agreed to contribute a portion of their shares of Restoration Hardware, Inc.’s common stock in exchange for a pro rata equity interest in Home Holdings. See “Certain Relationships and Related Party Transactions.”
Our Principal Equity Holders are also in the business of making investments in companies and may from time to time acquire and hold interests in businesses that compete directly or indirectly with us. Our Principal Equity Holders may also pursue acquisition opportunities that are complementary to our business and, as a result, those acquisition opportunities may not be available to us. See “Risk Factors—Home Holdings, Catterton, Tower Three, and Glenhill will continue to have significant influence over us after this offering, including over decisions that require the approval of stockholders, and their interests in our business may be different from yours.”
7
Table of Contents
The following chart sets forth the anticipated distribution of voting power among our stockholders as of the completion of this offering, assuming no exercise by the underwriters of their option to purchase additional shares:
Payments to Principal Equity Holders and Officers, Directors and Advisor in Connection with the Offering
In connection with this offering, pursuant to our management services agreement with affiliates of our Principal Equity Holders, we plan to pay Catterton Management Company, LLC, Tower Three Partners LLC and GJK Capital Advisors, LLC, fees in the amount of $ , $ and $ , respectively. In addition, the units in Home Holdings held by certain of our officers and advisor will vest in connection with this offering, including units held by Carlos Alberini, our Chief Executive Officer, units held by Ken Dunaj, our Chief Operating Officer, and units held by Gary Friedman, who serves as our Creator and Curator on an advisory basis. See “Executive Compensation—Employee Benefit and Stock Plans—Team Resto Ownership Plan.”
8
Table of Contents
Corporate and Other Information
Restoration Hardware Holdings, Inc. is a Delaware corporation. Our corporate headquarters is located at 15 Koch Road, Suite J, Corte Madera, CA 94925. Our telephone number is (415) 924-1005. Our principal website addresses are www.restorationhardware.com and www.rh.com. We also operate a website for our Baby & Child brand at www.rhbabyandchild.com. The information on any of our websites is not deemed to be incorporated in this prospectus or to be part of this prospectus.
This prospectus includes our trademarks, such as “Restoration Hardware,” “RH” and “Restoration Hardware Baby & Child,” which are protected under applicable intellectual property laws and are the property of Restoration Hardware. This prospectus also contains trademarks, service marks, trade names and copyrights of other companies, which are the property of their respective owners. Solely for convenience, trademarks and trade names referred to in this prospectus may appear without the ® or TM symbols, but such references are not intended to indicate, in any way, that we will not assert, to the fullest extent under applicable law, our rights or the right of the applicable licensor to these trademarks and trade names.
9
Table of Contents
The Offering
| Total common stock offered |
shares |
| Common stock offered by us |
shares |
| Common stock offered by the selling stockholders |
shares |
| Common stock to be outstanding immediately after this offering |
shares |
| Use of proceeds |
We estimate that the net proceeds to us from this offering, after deducting the underwriting discount and estimated offering expenses, will be approximately $ million, assuming the shares are offered at $ per share (the midpoint of the estimated price range set forth on the cover of this prospectus). |
| We will not receive any proceeds from the sale of shares by the selling stockholders. |
| We intend to use the net proceeds from the sale of common stock by us in this offering to repay a portion of the outstanding amounts under the Restoration Hardware, Inc. revolving line of credit and term loan and to pay other fees and expenses incurred in connection with this offering, including payments to affiliates of Catterton, Tower Three and Glenhill pursuant to the terms of the management services agreement we have entered into with them. See “Use of Proceeds.” |
| Principal stockholders |
Upon completion of this offering, Home Holdings will own shares, or %, of our outstanding common stock. Of that amount, Catterton will beneficially own shares, or %, of our outstanding common stock, Tower Three will beneficially own shares, or %, of our outstanding common stock, and Glenhill will beneficially own shares, or %, of our outstanding common stock. |
| We are a “controlled company” within the meaning of the NYSE listing rules, and therefore will be exempt from certain of the corporate governance listing requirements of the NYSE. See “Management—Corporate Governance.” |
| Home Holdings and the directors appointed by Home Holdings have certain approval rights. See “Certain Relationships and Related Party Transactions—Stockholders Agreement.” |
| Dividend policy |
We currently intend to retain all available funds and any future earnings for use in the operation of our business, and therefore we do not anticipate paying any cash dividends in the foreseeable future. |
10
Table of Contents
| Any future determination to pay dividends will be at the discretion of our board of directors and will depend upon our results of operations, financial condition, capital requirements and other factors that our board of directors deems relevant. We are a holding company, and substantially all of our operations are carried out by our subsidiary, Restoration Hardware, Inc., and its subsidiaries. Restoration Hardware, Inc.’s ability to pay dividends to us is limited by the terms of its credit agreement, which may in turn limit our ability to pay dividends on our common stock. Our ability to pay dividends may also be restricted by the terms of any future credit agreement or any future debt or preferred securities of ours or of our subsidiaries. See “Dividend Policy.” |
| Conflicts of interest |
As described under “Use of Proceeds,” Bank of America, N.A., an affiliate of Merrill Lynch, Pierce, Fenner & Smith Incorporated, an underwriter in this offering, is a lender under the Restoration Hardware, Inc. revolving line of credit and term loan and may receive more than five percent of the net proceeds of this offering. Thus, Merrill Lynch, Pierce, Fenner & Smith Incorporated may be deemed to have a “conflict of interest” under the applicable provisions of Rule 5121 of the Conduct Rules of the Financial Industry Regulatory Authority, Inc., or FINRA. Accordingly, this offering will be made in compliance with the applicable provisions of Rules 5110 and 5121 of the Conduct Rules regarding the underwriting of securities of a company with a member that has a conflict of interest within the meaning of those rules. Goldman, Sachs & Co. has agreed to serve as a “qualified independent underwriter” as defined by FINRA and performed due diligence investigations and reviewed and participated in the preparation of the registration statement of which this prospectus forms a part. No underwriter with a conflict of interest will execute sales in discretionary accounts without the prior written specific approval of the customers. See “Underwriting—Conflicts of Interest.” |
| Risk factors |
Investing in our common stock involves a high degree of risk. See “Risk Factors” beginning on page 18 of this prospectus for a discussion of factors you should carefully consider before deciding to invest in our common stock. |
| Proposed symbol for trading on the NYSE |
“RH” |
Unless otherwise indicated, all information in this prospectus relating to the number of shares of our common stock to be outstanding immediately after this offering:
| • | excludes options to purchase shares of our common stock, each with an exercise price equal to the initial public offering price, that we expect to grant in connection with this offering under the Restoration Hardware 2012 Stock Incentive Plan, which we refer to as the 2012 Plan; |
11
Table of Contents
| • | excludes options to purchase shares of our common stock, with an exercise price equal to $ per share, that we expect to grant in connection with this offering to our Chief Executive Officer, Carlos Alberini, and shares of our common stock, with an exercise price equal to $ per share, that we expect to grant in connection with this offering to Gary Friedman, who serves as our Creator and Curator on an advisory basis; |
| • | excludes additional shares of common stock reserved for future grants under the 2012 Plan; |
| • | assumes an initial public offering price of $ per share (the midpoint of the estimated price range set forth on the cover of this prospectus); and |
| • | assumes no exercise by the underwriters of their option to purchase up to additional shares from the selling stockholders. |
12
Table of Contents
Summary Historical Consolidated Financial and Operating Data
The following tables present Restoration Hardware, Inc.’s summary historical consolidated financial and operating data as of the dates and for the periods indicated. Restoration Hardware Holdings was formed as a Delaware corporation on August 18, 2011. Restoration Hardware Holdings will acquire all of the outstanding shares of capital stock of Restoration Hardware, Inc. prior to the effectiveness of this offering in connection with the Reorganization, and will therefore control Restoration Hardware, Inc. Restoration Hardware Holdings has not engaged in any business or other activities except in connection with its formation and the Reorganization. Accordingly, all financial and other information herein relating to periods prior to the completion of the Reorganization is that of Restoration Hardware, Inc.
All of the outstanding capital stock of Restoration Hardware, Inc. was acquired on June 16, 2008, by Home Holdings, which we refer to in this prospectus as the “Acquisition.”
The summary consolidated financial data for the fiscal years ended January 30, 2010, January 29, 2011, and January 28, 2012 and as of January 28, 2012, were derived from Restoration Hardware, Inc.’s consolidated financial statements included elsewhere in this prospectus.
The summary consolidated financial data for the six months ended July 30, 2011, and July 28, 2012, and as of July 28, 2012, were derived from Restoration Hardware, Inc.’s unaudited consolidated interim financial statements included elsewhere in this prospectus. The unaudited consolidated interim financial statements were prepared on a basis consistent with that used in preparing our audited consolidated financial statements and include all adjustments, consisting of normal and recurring items, that we consider necessary for a fair presentation of our financial position and results of operations for the unaudited periods. The unaudited financial information for the twelve months ended July 30, 2011, has been derived by adding our financial information for the year ended January 29, 2011, to the financial information for the six months ended July 30, 2011, and subtracting the financial information for the six months ended July 31, 2010. The unaudited financial information for the twelve months ended July 28, 2012, has been derived by adding our financial information for the year ended January 28, 2012, to the financial information for the six months ended July 28, 2012, and subtracting the financial information for the six months ended July 30, 2011. We believe that presentation of unaudited financial information for these twelve-month periods is useful to investors because it presents information about how our business has performed in the twelve-month period immediately preceding the date of our most recent interim financial statements, which allows investors to review our current performance trends over a full year period, and because it presents results for four consecutive quarters, which presentation compensates for seasonal factors that might influence results in a particular quarter within the year.
Restoration Hardware, Inc.’s historical results are not necessarily indicative of future operating results, and interim results for the six months ended July 28, 2012, are not projections for the results to be expected for the fiscal year ending February 2, 2013. The summary historical consolidated data presented below should be read in conjunction with the sections entitled “Risk Factors,” “Selected Historical Consolidated Financial and Operating Data” and “Management’s Discussion and Analysis of Financial Condition and Results of Operations” and the consolidated financial statements and the related notes thereto and other financial data included elsewhere in this prospectus.
13
Table of Contents
| Year Ended | Six Months Ended | Last Twelve Months Ended (1) |
||||||||||||||||||||||||||
| January 30, 2010 |
January 29, 2011 |
January 28, 2012 |
July 30, 2011 |
July 28, 2012 |
July 30, 2011 |
July 28, 2012 |
||||||||||||||||||||||
| (dollars in thousands, excluding per share and per square foot data) | ||||||||||||||||||||||||||||
| Statement of Operations Data: |
||||||||||||||||||||||||||||
| Net revenues |
$ | 625,685 | $ | 772,752 | $ | 958,084 | $ | 420,383 | $ | 510,820 | $ | 862,281 | $ | 1,048,521 | ||||||||||||||
| Cost of goods sold |
412,629 | 501,132 | 601,735 | 265,953 | 321,425 | 553,001 | 657,207 | |||||||||||||||||||||
|
|
|
|
|
|
|
|
|
|
|
|
|
|
|
|||||||||||||||
| Gross profit |
213,056 | 271,620 | 356,349 | 154,430 | 189,395 | 309,280 | 391,314 | |||||||||||||||||||||
| Selling, general and administrative expenses |
238,889 | 275,859 | 329,753 | 150,619 | 171,729 | 300,025 | 350,863 | |||||||||||||||||||||
|
|
|
|
|
|
|
|
|
|
|
|
|
|
|
|||||||||||||||
| Income (loss) from operations |
(25,833 | ) | (4,239 | ) | 26,596 | 3,811 | 17,666 | 9,255 | 40,451 | |||||||||||||||||||
| Interest expense |
(3,241 | ) | (3,150 | ) | (5,134 | ) | (1,888 | ) | (3,054 | ) | (3,459 | ) | (6,300 | ) | ||||||||||||||
|
|
|
|
|
|
|
|
|
|
|
|
|
|
|
|||||||||||||||
| Income (loss) before income taxes |
(29,074 | ) | (7,389 | ) | 21,462 | 1,923 | 14,612 | 5,796 | 34,151 | |||||||||||||||||||
| Income tax expense (benefit) |
(423 | ) | 685 | 1,121 | 783 | 623 | 1,427 | 961 | ||||||||||||||||||||
|
|
|
|
|
|
|
|
|
|
|
|
|
|
|
|||||||||||||||
| Net income (loss) |
$ | (28,651 | ) | $ | (8,074 | ) | $ | 20,341 | $ | 1,140 | $ | 13,989 | $ | 4,369 | $ | 33,190 | ||||||||||||
|
|
|
|
|
|
|
|
|
|
|
|
|
|
|
|||||||||||||||
| Basic and diluted net income (loss) per share |
$ | (286,510 | ) | $ | (80,740 | ) | $ | 203,410 | $ | 11,400 | $ | 139,890 | $ | 43,690 | $ | 331,900 | ||||||||||||
| Basic and diluted average number of shares outstanding |
100 | 100 | 100 | 100 | 100 | 100 | 100 | |||||||||||||||||||||
| Pro forma net income (loss) per share (2): |
||||||||||||||||||||||||||||
| Basic |
$ | $ | ||||||||||||||||||||||||||
| Diluted |
$ | $ | ||||||||||||||||||||||||||
| Pro forma average number of shares outstanding (2): |
||||||||||||||||||||||||||||
| Basic |
||||||||||||||||||||||||||||
| Diluted |
||||||||||||||||||||||||||||
| Other Financial and Operating Data: |
||||||||||||||||||||||||||||
| Growth in net revenues: |
||||||||||||||||||||||||||||
| Stores (3) |
(6 | )% | 15 | % | 22 | % | 21 | % | 19 | % | 17 | % | 21 | % | ||||||||||||||
| Direct |
(15 | )% | 37 | % | 27 | % | 36 | % | 25 | % | 38 | % | 23 | % | ||||||||||||||
| Total |
(10 | )% | 24 | % | 24 | % | 27 | % | 22 | % | 26 | % | 22 | % | ||||||||||||||
| Retail (4): |
||||||||||||||||||||||||||||
| Comparable store sales change (5) |
(7 | )% | 19 | % | 25 | % | 20 | % | 29 | % | 17 | % | 29 | % | ||||||||||||||
| Retail stores open at end of period |
95 | 91 | 74 | 87 | 73 | 87 | 73 | |||||||||||||||||||||
| Average gross square footage |
1,042 | 1,014 | 913 | 946 | 801 | 977 | 841 | |||||||||||||||||||||
| Average selling square footage |
660 | 641 | 580 | 599 | 519 | 619 | 540 | |||||||||||||||||||||
| Retail sales per selling square foot (7) |
$ | 525 | $ | 635 | $ | 846 | $ | 351 | $ | 481 | $ | 710 | $ | 981 | ||||||||||||||
| Direct: |
||||||||||||||||||||||||||||
| Catalogs circulated (in thousands) (8) |
31,336 | 46,507 | 26,052 | 12,723 | 15,131 | 40,355 | 28,460 | |||||||||||||||||||||
| Catalog pages circulated |
4,418 | 6,260 | 8,848 | 3,289 | 7,417 | 6,726 | 12,975 | |||||||||||||||||||||
| Direct as a percentage of net revenues (9) |
39 | % | 43 | % | 44 | % | 45 | % | 46 | % | 45 | % | 45 | % | ||||||||||||||
| Capital expenditures |
$ | 2,024 | $ | 39,907 | $ | 25,593 | $ | 12,168 | $ | 13,517 | $ | 37,894 | $ | 26,942 | ||||||||||||||
| Adjusted EBITDA (10) |
$ | 17,596 | $ | 41,097 | $ | 80,154 | $ | 27,747 | $ | 34,897 | $ | 59,850 | $ | 87,304 | ||||||||||||||
14
Table of Contents
| As of July 28, 2012 | ||||||||
| Actual | Pro Forma As Adjusted (11) |
|||||||
| (in thousands) | ||||||||
| Balance Sheet Data: |
||||||||
| Cash and cash equivalents |
$ | 10,102 | $ | |||||
| Working capital (excluding cash and cash equivalents) (12) |
192,252 | |||||||
| Total assets |
650,874 | |||||||
| Revolving line of credit |
129,637 | |||||||
| Term loan |
14,815 | |||||||
| Total debt (including current portion) (13) |
151,089 | |||||||
| Total stockholders’ equity |
265,123 | |||||||
| (1) | The unaudited financial information for the twelve months ended July 30, 2011, has been derived by adding our financial information for the year ended January 29, 2011, to the financial information for the six months ended July 30, 2011, and subtracting the financial information for the six months ended July 31, 2010. The unaudited financial information for the twelve months ended July 28, 2012, has been derived by adding our financial information for the year ended January 28, 2012, to the financial information for the six months ended July 28, 2012, and subtracting the financial information for the six months ended July 30, 2011. |
| (2) | Pro forma net income (loss) per share gives effect to (i) the Reorganization, (ii) the issuance of shares of common stock in this offering and (iii) the application of $ million of the estimated net proceeds from the sale of common stock by us in this offering to repay a portion of the outstanding amounts under Restoration Hardware, Inc.’s revolving line of credit and term loan as if the offering and those transactions had occurred on January 30, 2011. This assumes net proceeds of this offering of $ million, assuming the shares are offered at $ per share, the midpoint of the estimated price range set forth on the cover of this prospectus, after deducting the underwriting discount and estimated offering expenses. |
| (3) | Store data represent retail stores plus outlet stores. |
| (4) | Retail data have been calculated based upon retail stores, including our Baby & Child stores, and exclude outlet stores. |
| (5) | Comparable store sales have been calculated based upon retail stores that were open at least fourteen full months as of the end of the reporting period and did not change square footage by more than 20% between periods. Comparable store sales exclude net revenues from outlet stores. |
| (6) | Average square footage (gross or selling, as applicable) is calculated for each quarter by taking the total applicable square footage at the beginning of the quarter plus the total applicable square footage at the end of the quarter and dividing by two. Average square footage for periods of six, nine and twelve months is calculated by averaging the average square footage for the quarters within such periods. |
| (7) | Retail sales per selling square foot is calculated by dividing total net revenues for all retail stores, comparable and non-comparable, by the average selling square footage for the period. |
| (8) | The catalogs and catalog pages circulated from period to period do not take into account different page sizes per catalog distributed. Page sizes and page counts vary for different catalog mailings and we sometimes mail different versions of a catalog at the same time. Accordingly, period to period comparisons of catalogs circulated and catalog pages circulated do not take these variations into account. In fiscal 2010, we mailed a larger number of catalogs that contained fewer pages and in some cases significantly smaller page sizes than in prior periods. In fiscal 2011, we mailed fewer catalogs that contained a significant increase in number of pages as compared to fiscal 2010. |
| (9) | Direct revenues include sales through our catalogs and websites. |
| (10) | A reconciliation of net income (loss) under accounting principles generally accepted in the United States (“GAAP”) to EBITDA and Adjusted EBITDA is set forth below in “Selected Historical Consolidated Financial and Operating Data.” |
15
Table of Contents
EBITDA and Adjusted EBITDA have been presented in this prospectus and are supplemental measures of financial performance that are not required by, or presented in accordance with, GAAP. We define EBITDA as consolidated net income (loss) before depreciation and amortization, interest expense and provision for income taxes. Adjusted EBITDA is calculated in accordance with and is the basis of our Management Incentive Program (or “MIP”), which is our cash-based incentive compensation program designed to motivate and reward annual performance for eligible employees, and reflects further adjustments to EBITDA to eliminate the impact of certain items, including non-cash or other items that we do not consider representative of our ongoing operating performance, as discussed in more detail in the section entitled “Selected Historical Consolidated Financial and Operating Data.”
EBITDA and Adjusted EBITDA are included in this prospectus because they are key metrics used by management, our board of directors and our Principal Equity Holders to assess our financial performance, and Adjusted EBITDA is used in connection with determining incentive compensation under our MIP. Additionally, EBITDA is frequently used by analysts, investors and other interested parties to evaluate companies in our industry. We use EBITDA and Adjusted EBITDA, alongside other GAAP measures such as gross profit, operating income (loss) and net income (loss), to measure profitability, as a key profitability target in our annual and other budgets, and to compare our performance against that of peer companies. We believe that Adjusted EBITDA provides useful information facilitating operating performance comparisons from period to period and company to company.
EBITDA and Adjusted EBITDA are not GAAP measures of our financial performance or liquidity and should not be considered as alternatives to net income (loss) as a measure of financial performance, cash flows from operating activities as a measure of liquidity or any other performance measure derived in accordance with GAAP, and they should not be construed as an inference that our future results will be unaffected by unusual or non-recurring items. Additionally, EBITDA and Adjusted EBITDA are not intended to be measures of free cash flow for management’s discretionary use, as they do not consider certain cash requirements such as tax payments and debt service requirements and certain other cash costs that may recur in the future. EBITDA and Adjusted EBITDA contain certain other limitations, including the failure to reflect our cash expenditures, cash requirements for working capital needs and cash costs to replace assets being depreciated and amortized, and exclude certain unusual charges that are not expected to recur in the future. In evaluating Adjusted EBITDA, you should be aware that in the future we may incur expenses that are the same as or similar to some of the adjustments in this presentation. Our presentation of Adjusted EBITDA should not be construed to imply that our future results will be unaffected by any such adjustments. Management compensates for these limitations by relying primarily on our GAAP results and by using EBITDA and Adjusted EBITDA only supplementally. Our measures of EBITDA and Adjusted EBITDA are not necessarily comparable to other similarly titled captions of other companies due to different methods of calculation.
(11) Pro Forma as Adjusted amounts give effect to (i) the Reorganization, (ii) the issuance of shares of common stock in this offering, (iii) the application of $ million of estimated net proceeds of this offering to repay a portion of the outstanding amounts under the Restoration Hardware, Inc. revolving line of credit and term loan, (iv) the use of $ million of the estimated net proceeds to pay other fees and expenses incurred in connection with this offering, including management fees of $ to affiliates of Catterton, Tower Three and Glenhill pursuant to the terms of the management services agreement with them, (v) $ non-cash impact to accumulated deficit for stock based compensation charges related to the shares of unvested common stock that will vest upon this offering, (vi) $ non-cash impact to accumulated deficit for stock based compensation charges related to the shares underlying options granted to Mr. Alberini and Mr. Friedman in conjunction with this offering and (vii) additional cash payments of $2.2 million to former employees that are due as a result of this stock offering. A $1.00 increase (decrease) in the assumed initial public offering price of $ per share common stock, the midpoint of the estimated price range set forth on the cover of this prospectus, would increase (decrease) the
16
Table of Contents
pro forma as adjusted amount of cash and cash equivalents by $ million, total assets by $ million, revolving line of credit by $ million, term loan by $ million, total debt (including current portion) by $ million and total stockholders’ equity by $ million, assuming the number of shares offered by us, as set forth on the cover of this prospectus, remains the same and after deducting the underwriting discount and estimated offering expenses.
| (12) | Working capital is defined as current assets, excluding cash and cash equivalents, less current liabilities, excluding the current portion of long-term debt. |
| (13) | Total debt (including current portion) includes amounts outstanding under the Restoration Hardware, Inc. revolving line of credit, term loan and capital lease obligations. |
17
Table of Contents
This offering and an investment in our common stock involve a high degree of risk. You should carefully consider the risks and uncertainties described below, together with the risks and uncertainties described elsewhere in this prospectus, including our consolidated financial statements and the related notes contained elsewhere in this prospectus, before you decide to purchase shares of our common stock. If any of the following risks or uncertainties actually occurs, our business, financial condition, results of operations, cash flow and prospects could be materially and adversely affected. As a result, the price of our common stock could decline and you could lose all or part of your investment in our common stock.
Risks Related to Our Business
Growth in our business may not be sustained and may not generate a corresponding improvement in our results of operations.
We may not be able to maintain or improve the levels of growth that we have experienced in the recent past. In addition, although we have recently experienced strong comparable store sales, if our future comparable store sales fail to meet market expectations or decline, the price of our common stock could decline. Various factors affect comparable store sales, including the number, size and location of stores we open, close, remodel or expand in any period, the overall economic and general retail sales environment, consumer preferences and demand, our ability to efficiently source and distribute products, changes in our product offerings, competition, current local and global economic conditions, changes in catalog circulation and the success of marketing programs. These factors may cause our comparable store sales results to be materially lower than recent periods and our expectations, which could harm our results of operations and result in a decline in the price of our common stock.
Although we have recently experienced sales growth as a result of a number of new business initiatives, this sales growth may not continue and the level of our sales could return to prior levels if customer response to our product offerings is not sustained. Many factors can influence customer response to our product offerings and store formats including responses from our competitors, who may introduce similar products or merchandise formats. In addition, sales levels for particular merchandise or product categories may not continue over time if customer demand levels are not sustained. The level of customer response to our full line Design Galleries may vary in different markets and store locations. Similarly, the level of customer response to our Source Book large catalog format, in which we display a greater percentage of our product assortment, may vary in different markets. In addition, there can be no assurance that we will be able to migrate customer demand successfully when we choose to close a store in a particular location in favor of a full line Design Gallery in the same or an adjacent market location. While our objective is to retain a high percentage of customer demand from store locations that we close, there can be no assurance that we will retain a high percentage of sales from stores closed in the future or that we will continue to retain a high percentage of sales from stores previously closed.
In addition, continued increased activity in our business could result in material changes in our operating costs, including increased merchandise inventory costs and costs for paper and postage associated with the mailing and shipping of catalogs and products. We cannot assure you that we will succeed in offsetting these expenses with increased efficiency or that cost increases associated with our business will not have an adverse effect on our financial results.
If we fail to successfully anticipate consumer preferences and demand, or to manage our inventory commensurate with demand, our results of operations may be adversely affected.
Our success depends in large part on our ability to originate and define home product trends, as well as to anticipate, gauge and react to changing consumer demands in a timely manner. Our products must appeal to a range of consumers whose preferences cannot always be predicted with certainty. We cannot assure you that we
18
Table of Contents
will be able to continue to develop products that customers positively respond to or that we will successfully meet consumer demands in the future. Any failure on our part to anticipate, identify or respond effectively to consumer preferences and demand could adversely affect sales of our products. If this occurs, our sales may decline significantly, and we may be required to mark down certain products to sell the resulting excess inventory or to sell such inventory through our outlet stores, either of which could have a material adverse effect on our financial condition and results of operations.
In addition, we must manage our merchandise in stock and inventory levels to track consumer demand. Much of our merchandise requires that we provide vendors with significant ordering lead time, frequently before market factors are known. In addition, the seasonal nature of our products requires us to carry a significant amount of inventory prior to peak selling seasons. If we are not able to anticipate consumer demand for our different product offerings, or successfully manage inventory levels for products that are in demand, we may experience:
| • | back orders, order cancellations and lost sales for products that are in high demand for which we did not stock adequate inventory; and |
| • | overstock inventory levels for products that have lower consumer demand, requiring us to take markdowns or other steps to sell slower-moving merchandise. |
As a result of these and other factors, we are vulnerable to demand and pricing shifts and to misjudgments in the selection and timing of merchandise purchases.
Our former Chairman and Co-Chief Executive Officer, Gary Friedman, resigned from these positions and as a director of the Company effective as of , 2012. There can be no assurance that these developments will not have an adverse impact on us.
Our former Chairman and Co-Chief Executive Officer, Gary Friedman, resigned from these positions and as a director of the Company effective as of , 2012 following an investigation by a special committee of independent directors of the board assisted by independent counsel prompted by disclosure that Mr. Friedman and a Company employee were engaged in a personal relationship, described by the parties as consensual. The investigation concluded that Mr. Friedman engaged in activities that were inconsistent with the board of directors’ expectations for executive conduct as previously communicated by the board of directors and failed to comply with certain Company policies. We have incurred substantial expenses related to the investigation. There can be no assurance that we will not incur expenses or claims in the future related to the conduct that was the subject of the investigation or similar conduct that has occurred in the past or, given Mr. Friedman’s continued involvement with the Company in his new roles, may occur in the future.
In connection with his resignation as Chairman, Co-Chief Executive Officer and a director, Mr. Friedman and the Company will enter into an advisory services agreement that provides for Mr. Friedman to advise the Company in a role described as the Creator and Curator with respect to product development, merchandising and other creative matters as more specifically outlined in “Certain Relationships and Related Party Transactions—Advisory Services Agreement with Gary Friedman.” Mr. Friedman is a significant stockholder in the Company and will continue to advise the board of directors in an observer capacity, with the honorary title of Chairman Emeritus.
Mr. Friedman’s leadership and creative talents were important contributors to the Company’s performance during his tenure as our Chairman and Co-Chief Executive Officer. While we believe that Mr. Alberini, the current sole Chief Executive Officer, and the other management team members can continue to effectively lead the Company, and we expect to benefit from Mr. Friedman’s contributions as an advisor and board observer, there can be no assurance that the absence of Mr. Friedman in his former roles will not have an adverse impact on us.
19
Table of Contents
We are undertaking a large number of business initiatives at the same time and if these new initiatives are not successful, they may have a negative impact on our operating results.
We are in the process of an ongoing major transformation of our business characterized by a period of rapid growth and a large number of new business initiatives. For example, we recently developed a full line Design Gallery format which involves larger store square footage. We plan to continue to open full line Design Galleries in select major metropolitan markets and we expect to close a number of our older stores and replace them with the full line Design Gallery format. We are currently contemplating other new product lines and extensions, as well as expanding sales to international markets. In addition, we are continuing a number of new initiatives in other areas of our business, including product sourcing and distribution and management information systems. For example, we have reduced the use of third-party buying agents in most foreign locations. In addition, we have significantly expanded the page counts of our catalogs, increased the number of households receiving our catalogs and reduced the number of catalog mailings.
The number of current business initiatives could strain our financial, operational and management resources. In addition, these initiatives may not be successful. If we are not successful in managing our current growth and the large number of new initiatives that are underway, we might experience an adverse impact on our financial performance and results of operations. All of the foregoing risks may be compounded in any economic downturn. In addition, if we fail to achieve the intended results of our current business initiatives, or if the implementation of these initiatives is delayed or abandoned, diverts management’s attention or resources from other aspects of our business or costs more than anticipated, we may experience inadequate return on investment for some of our business initiatives, which would have a negative effect on our operating results.
Our growth strategy and performance depend on our ability to purchase our merchandise in sufficient quantities at competitive prices, including our products that are produced by artisans and specialty vendors, and any disruptions we experience in our ability to obtain our products in a timely fashion or in the quantities required could have a material adverse effect on our business.
We do not own or operate any manufacturing facilities. We instead purchase all of our merchandise from a large number of vendors, many of which are the sole sources for particular products. Our growth strategy includes expanding the amount of products we sell, and our performance depends on our ability to purchase our merchandise in sufficient quantities at competitive prices. However, many of our key products are produced by artisans, specialty vendors and other vendors that may have limited production capacity. In addition, some of our vendors are small and undercapitalized firms. A number of our vendors, particularly our artisan vendors, may have limited resources, production capacities and operating histories. As a result, the capacity of some of our vendors to meet our supply requirements has been, and may in the future be, constrained at various times and our vendors may be susceptible to production difficulties or other factors that negatively affect the quantity or quality of their production during future periods. A disruption in the ability of our significant vendors to access liquidity could also cause serious disruptions or an overall deterioration of their businesses, which could lead to a significant reduction in their ability to manufacture or ship products to us.
Any difficulties that we experience in our ability to obtain products in sufficient quality and quantity from our vendors could have a material adverse effect on our business. In fiscal 2011, we purchased approximately 84% of our merchandise from vendors that are located abroad. Our ability to obtain desired merchandise in sufficient quantities could be impaired by events that adversely affect our vendors or the locations in which they operate, such as difficulties or problems associated with our vendors’ operations, business, finances, labor, importation of products, costs, production, insurance and reputation. Failure of vendors to produce adequate quantities of merchandise in a timely manner has resulted in back orders and lower revenue in certain periods of our business operation. While we believe our vendors have the capacity to meet our demand, we cannot assure you that our vendors will be able to produce adequate quantities of merchandise in a timely manner in the future.
We also do not have long-term contracts or other contractual assurances of continued supply, pricing or access to new products with our vendors, and generally we transact business with our vendors on an
20
Table of Contents
order-by-order basis. Therefore, any vendor could discontinue selling to us at any time. Any disruptions we experience in our ability to obtain our products in a timely fashion or in the quantities required could have a material adverse effect on our business.
We may not be able to locate and develop relationships with a sufficient number of new vendors, which could lead to product shortages and customer backorders, which could harm our business.
In the event that one or more of our vendors is unable to meet the quantity or quality of our product requirements, we may not be able to develop relationships with new vendors in a manner that is sufficient to supply the shortfall. Even if we do identify such new vendors, we may experience product shortages and customer backorders as we transition our product requirements to incorporate the alternative suppliers. In addition, we cannot assure you that any new vendor with which we do business, particularly any new vendor abroad, would not be subject to the same or similar quality and quantity risks as our existing suppliers.
We do not have exclusive relationships with most of our vendors, and there is a risk that our vendors may sell similar or identical products to our competitors, which could harm our business.
Our arrangements with our vendors are generally not exclusive. As a result, most of our vendors might be able to sell similar or identical products to certain of our competitors, some of which purchase products in significantly greater volume, or enter into arrangements with suppliers that could impair our ability to sell their products, including by requiring suppliers to enter into exclusive arrangements, which could limit our access to such arrangements or products. Our vendors could also initiate or expand sales of their products through their own stores or through the Internet to the retail market and therefore compete with us directly or sell their products through outlet centers or discount stores, increasing the competitive pricing pressure we face.
We may not have adequate remedies with our vendors for defective merchandise, which could damage our reputation and brand image and harm our business.
If products that we purchase from vendors are damaged or prove to be defective, we may not be able to return products to these vendors and obtain refunds of our purchase price or obtain other indemnification from them. Our vendors’ limited capacities may result in a vendor’s inability to replace any defective merchandise in a timely manner. In addition, our vendors’ limited capitalization or liquidity may mean that a vendor that has supplied defective merchandise will not be able to refund the purchase price to us or pay us any penalties or damages associated with any defects.
In addition, our vendors may not adhere to our quality control standards, and we might not identify a quality deficiency before merchandise ships to our stores or customers. Our vendors’ failure to manufacture or import quality merchandise in a timely and effective manner could damage our reputation and brand image, and could lead to an increase in product returns or exchanges or customer litigation against us and a corresponding increase in our routine and non-routine litigation costs. Further, any merchandise that does not meet our quality standards or other government requirements could become subject to a recall, which could damage our reputation and brand image and harm our business.
Changes in consumer spending or the housing market may significantly harm our revenue and results of operations.
Our business depends on consumer demand for our products and, consequently, is sensitive to a number of factors that influence consumer spending in the retail home furnishings sector, including, among other things, the general state of the economy, capital and credit markets, consumer confidence, general business conditions, the availability and cost of consumer credit, the level of consumer debt, interest rates, level of taxes affecting consumers, housing prices, new construction and other activity in the housing sector and the state of the mortgage industry and other aspects of consumer credit tied to housing, including the availability and pricing of
21
Table of Contents
mortgage refinancings and home equity lines of credit. We believe that a number of these factors have had, and may continue to have, an adverse impact on the retail home furnishings sector, and have also affected our business and results, and these factors may make it difficult for us to accurately predict our operating and financial results for future periods. For example, the prolonged slump in the housing market has affected the level of home purchases and remodelings which, in turn, has reduced consumer spending on home furnishings. As a result, the overall demand for our products has been affected by weakness in the home furnishings sector. While there have been some recent positive changes in both the housing market and the North American economy, the overall outlook remains uncertain and there can be no assurance that any economic or housing recovery will be sustained or, in particular, that our business will continue to perform well in the face of a weak overall housing market.
If we lose key personnel or are unable to hire additional qualified personnel, our business may be harmed.
The success of our business depends upon the continued service of our key personnel, including our Chief Executive Officer, Carlos Alberini. In addition, the leadership and creative talents of Gary Friedman, our former Chairman and Co-Chief Executive Officer, who currently serves as our Creator and Curator on an advisory basis, have been and are expected to continue to be important contributors to our performance. The loss of the services of our key personnel or advisor could make it more difficult to successfully operate our business and achieve our business goals. In addition, we do not maintain key man life insurance policies on any of our key personnel. As a result, we may not be able to cover the financial loss we may incur in losing the services of any of our key personnel.
Mr. Alberini’s and Mr. Friedman’s equity ownership in our Company may give them a substantial amount of personal wealth. As a result, it may be difficult for us to continue to retain and motivate these persons, and this wealth could affect their decisions about whether or not they continue to work or perform advisory services for us. If we do not succeed in retaining and motivating Mr. Alberini and Mr. Friedman, we may be unable to achieve our historical growth rates.
Competition for qualified employees and personnel in the retail industry is intense. We also may be unable to retain other existing personnel that are important to our business or hire additional qualified personnel. The process of locating personnel with the combination of skills and attributes required to carry out our goals is often lengthy. Our success depends to a significant degree upon our ability to attract, retain and motivate qualified management, marketing and sales personnel, in particular store managers, and upon the continued contributions of these people. We cannot assure you that we will be successful in attracting and retaining qualified executives and personnel.
In addition, our success depends in part upon our ability to attract, motivate and retain a sufficient number of store employees who understand and appreciate our corporate culture and customers. Turnover in the retail industry is generally high. Excessive store employee turnover will result in higher employee costs associated with finding, hiring and training new store employees. If we are unable to hire and retain store personnel capable of consistently providing a high level of customer service, our ability to open new stores may be impaired, the performance of our existing and new stores could be materially adversely affected and our brand image may be negatively impacted.
Our operations have significant liquidity and capital requirements and depend on the availability of adequate financing on reasonable terms, and if we are unable to borrow sufficient capital, it could have a significant negative effect on our business.
Our operations have significant liquidity and capital requirements. Among other things, the seasonality of our businesses requires us to purchase merchandise well in advance of the outdoor selling season in our second fiscal quarter and the holiday selling season in our fourth fiscal quarter. In addition, we have invested significant capital expenditures in remodeling and opening new stores and these capital expenditures have increased and will
22
Table of Contents
continue to increase in fiscal 2012 and succeeding fiscal periods as we open additional full line Design Galleries. During fiscal 2011, we spent $15.7 million for capital expenditures related to new stores and remodeling, and we incurred $9.9 million of additional capital expenditures related to supply chain investments and systems infrastructure. We anticipate our capital expenditure requirements to be approximately $65 million for fiscal 2012, of which $13.5 million was spent during the first six months of fiscal 2012. We plan to continue our growth and expansion, including opening full line Design Galleries in select major metropolitan markets, pursuing category extensions of our brand, and exploring new business areas. We purchased the building and land for our store in San Francisco but to date we have relied upon leases with landlords for our other locations. As we develop new stores in the future, we may explore other models for our real estate which could include joint ventures or other forms of equity ownership in the real estate interests associated with new sites and buildings. These approaches might require greater capital investment than a traditional store lease with a landlord.
We depend on our ability to generate cash flows from operating activities, as well as revolving borrowings under the Restoration Hardware, Inc. revolving line of credit, to finance the carrying costs of our inventory, to pay for capital expenditures and operating expenses and to support our growth strategy. As of July 28, 2012, we had borrowed $129.6 million under the revolving line of credit and had $86.2 million available for borrowing. In addition, the total amount outstanding under the Restoration Hardware, Inc. term loan was $14.8 million, net of $0.2 million of unamortized debt issuance costs, as of July 28, 2012. Various factors may impact our lenders’ willingness to provide funds to us, including:
| • | our continuing compliance with the terms of our revolving line of credit; |
| • | the amount of availability under the revolving line of credit, which depends on various factors, including the amount of collateral available under the revolving line of credit, which relies on a borrowing base formula tied principally to the value of our assets, including our inventory; and |
| • | our lenders’ financial strength and ability to perform under the revolving line of credit. |
If the cash flows from our operating activities are not sufficient to finance the carrying costs of inventory and to pay for capital expenditures and operating costs, and if we are unable to borrow a sufficient amount under the revolving line of credit to finance or pay for such expenditures and costs, it could have a significant negative effect on our business.
We currently believe that our cash flow from operations and funds available under the revolving line of credit will satisfy our capital and operating requirements for the next twelve months. However, any weakening of, or other adverse developments concerning our sales performance or adverse developments concerning the availability of credit under the revolving line of credit, could limit the overall amount of funds available to us.
In addition, we may experience cash flow shortfalls in the future, and we may otherwise require additional external funding, or we may need to raise funds to take advantage of unanticipated opportunities, to make acquisitions of other businesses or companies or to respond to changing business conditions or unanticipated competitive pressures. However, we cannot assure you that we will be able to raise funds on favorable terms, if at all, or that future financing requirements would not be dilutive to holders of our capital stock. If we fail to raise sufficient additional funds, we may be required to delay or abandon some of our planned future expenditures or aspects of our current operations.
A number of factors that affect our ability to successfully open new stores or optimize our store footprint are beyond our control, and these factors may harm our ability to execute our strategy of sizing stores to the potential of the market, which may negatively affect our results of operations.
We are focused on sizing our assortments and our stores to the potential of the market by adjusting the square footage and number of stores on a geographic market-by-market basis. We plan to optimize our real estate
23
Table of Contents
by continuing to open larger square footage full line Design Galleries in key markets and relocating or closing selected stores in these or adjacent markets. When we address the introduction of new stores in a particular market or changes to, or closure of, existing stores, we must make a series of decisions regarding the size and location of new stores (or the existing stores slated to undergo changes or closure) and the impact on our other existing stores in the area.
Our ability to maximize the productivity of our retail store base, depends on many factors, including, among others, our ability to:
| • | identify suitable locations, the availability of which is largely outside of our control; |
| • | size the store locations to the market opportunity; |
| • | retain customers in certain geographic markets when we close stores in that market; |
| • | negotiate acceptable new lease terms or lease renewals, modifications or terminations; |
| • | efficiently build and equip new stores or further remodel existing locations; |
| • | source sufficient levels of inventory to meet the needs of changes in our store footprint on a timely basis; |
| • | successfully integrate changes in our store base into our existing operations and information technology systems; |
| • | obtain or maintain adequate capital resources on acceptable terms; |
| • | avoid construction delays and cost overruns in connection with the expansion or further remodeling of existing stores and the opening of new stores; |
| • | maintain adequate distribution facilities, information systems and other operational systems to serve our new stores and remodeled stores; and |
| • | address competitive, merchandising, marketing, distribution and other challenges encountered in connection with expansion into new geographic areas and markets. |
Any of these challenges could delay or prevent us from completing store openings or the additional remodeling of existing stores or hinder the operations of stores we open or remodel. If any of these challenges delays the opening of a store, our results of operations will be negatively affected as we will incur leasing and other costs during the delay without associated store revenue at such location. New or remodeled stores may not be profitable or achieve our target return on investment. Unfavorable economic and business conditions and other events could also interfere with our plans to expand or modify store footprints. Our failure to effectively address challenges such as these could adversely affect our ability to successfully open new stores or change our store footprint in a timely and cost-effective manner and could have a material adverse effect on our business, results of operations and financial condition.
Our operating results are subject to quarterly and seasonal fluctuations, and results for any quarter may not necessarily be indicative of the results that may be achieved for the full fiscal year.
Our quarterly results have fluctuated in the past and may fluctuate significantly in the future, depending upon a variety of factors, including, among other things, our product offerings, the timing and level of markdowns, promotional events, store openings, store closings, the weather, remodeling or relocations, shifts in the timing of holidays, timing of catalog releases or sales, timing of delivery of orders, competitive factors and general economic conditions.
In addition, we historically have realized, and expect to continue to realize, higher net revenue and profitability in the fourth quarter of our fiscal year due to the holiday selling season and to a lesser extent in the
24
Table of Contents
second quarter due to the outdoor selling season. In fiscal 2011, we recorded net revenues of $235.6 million and $305.2 million in the second and fourth fiscal quarters or 24.6% and 31.9%, respectively, of our fiscal 2011 net revenue. In fiscal 2011, our gross profit for the second and fourth quarters was $91.2 million and $117.5 million or 25.6% and 33.0% of our fiscal 2011 gross profit, respectively. In anticipation of increased sales activity for the outdoor selling season during our second fiscal quarter and the holiday selling season during our fourth fiscal quarter, our working capital requirements are typically higher in the first and third fiscal quarters due to inventory-related working capital requirements for the outdoor selling season and the holiday selling season.
Accordingly, our results of operations may fluctuate on a seasonal basis and relative to corresponding periods in prior years. Moreover, we may take certain pricing or marketing actions that could have a disproportionate effect on our business, financial condition and results of operations in a particular quarter or selling season. During fiscal 2011, we undertook initiatives related to the opening of full line Design Gallery locations and the closure of some existing stores. In addition, during this time period, we introduced a number of new products and our Source Book. We are continuing these initiatives in fiscal 2012. For example, our recent Fall 2012 Source Books portray over 85% of our product assortment at the time of publication. These initiatives may disproportionately impact results in a particular quarter and we believe that period-to-period comparisons of our operating results are not necessarily meaningful and cannot be relied upon as indicators of future performance.
Our business depends in part on a strong brand image. We continue to invest in the development of our brand and the marketing of our business, and if we are not able to maintain and enhance our brand or market our product offerings, we may be unable to attract a sufficient number of customers or sell sufficient quantities of our products.
We believe that the brand image we have developed, and the lifestyle image associated with our brand, have contributed significantly to the success of our business to date. We also believe that maintaining and enhancing our brand is integral to our business and to the implementation of our strategies for expanding our business. This will require us to continue to make investments in areas such as marketing and advertising, as well as the day-to-day investments required for store operations, catalog mailings, website operations and employee training. Our brand image may be diminished if new products, services or other businesses fail to maintain or enhance our distinctive brand image. Furthermore, our reputation could be jeopardized if we fail to maintain high standards for merchandise and service quality, if we fail to maintain high ethical, social and environmental standards for all of our operations and activities, if we fail to comply with local laws and regulations or if we experience other negative events that affect our image or reputation. Any failure to maintain a strong brand image could have an adverse effect on our sales and results of operations.
We are exploring opportunities to expand into new categories or complementary businesses. If we are not successful in these new categories or business areas, it may have an adverse effect on our results of operations and our reputation.
We are engaged in ongoing efforts to explore new business opportunities that we believe can leverage our current business platform. We have developed a number of new product categories and extensions over the last several years, including Garden & Outdoor, Baby & Child and Big Style, small spaces. We also have introduced other merchandise categories that enhance the customer experience in our full line Design Galleries, including fresh cut flowers, magazines and tea, and plan further brand-enhancing offerings, such as an Art & Culture category, which could include works of art by independent artists, and a café or restaurant adjacent to, or inside of, select full line Design Galleries. We are incubating a number of other new areas for potential expansion of our business, some of which may become new core categories and others of which may be primarily offered as enrichment of the customer experience.
Developing and testing new business opportunities will involve us in business operations and areas of expertise that would be new to our organization and may require management time and resources. We may not
25
Table of Contents
achieve wide market acceptance or generate revenue sufficient to recoup the cost of developing and operating such new concepts, which in turn could have a material adverse effect on our results of operations. Any new businesses we enter may expose us to additional laws, regulations and risks, including the risk that we may incur ongoing operating expenses in such businesses in excess of revenues, which could harm our results of operations and financial condition. The financial profile of any such new businesses may be different than our current financial profile, which could affect our financial performance and the market price for our common stock.
We compete in the highly competitive home furnishings sector of the retail market.
The home furnishings sector within the retail market is highly competitive. We compete with the interior design trade and specialty stores, as well as antique dealers and other merchants that provide unique items and custom-designed product offerings at higher price points. We also compete with national and regional home furnishing retailers and department stores. In addition, we compete with mail order catalogs focused on home furnishings. We compete with these and other retailers for customers, suitable retail locations, vendors, qualified employees and management personnel. Many of our competitors have significantly greater financial, marketing and other resources than we do and therefore may be able to adapt to changes in customer preferences more quickly, devote greater resources to the marketing and sale of their products, generate greater national brand recognition or adopt more aggressive pricing policies than we can. In addition, increased catalog mailings by our competitors may adversely affect response rates to our own catalog mailings. Moreover, increased competition may result, and has resulted in the past, in potential or actual litigation between us and our competitors relating to such activities as competitive sales, hiring practices and other matters. As a result, increased competition may adversely affect our future financial performance, and we cannot assure you that we will be able to compete successfully in the future.
We believe that our ability to compete successfully is determined by several factors, including, among other things, the quality of our product selection, our brand, our merchandise presentation and value proposition, customer service, pricing and store locations. We may not ultimately succeed in competing with other retailers in our market.
Disruptions in the global financial markets may make it difficult for us to borrow a sufficient amount of capital to finance the carrying costs of inventory and to pay for capital expenditures and operating costs, which could negatively affect our business.
Disruptions in the global financial markets and banking systems have made credit and capital markets more difficult for companies to access, even for some companies with established revolving or other credit facilities. Under the credit agreement governing the Restoration Hardware, Inc. revolving line of credit, each financial institution that is part of the syndicate for the revolving line of credit is responsible for providing a portion of the loans to be made under the revolving line of credit. Factors that have previously affected our borrowing ability under the revolving line of credit have included the borrowing base formula limitations, adjustments in the appraised value of our inventory used to calculate the borrowing base and the availability of each of our lenders to advance its portion of requested borrowing drawdowns under the facility. If, in connection with a disruption in the global financial markets or otherwise, any participant, or group of participants, with a significant portion of the commitments in the revolving line of credit fails to satisfy its obligations to extend credit under the facility, and if we are unable to find a replacement for such participant or group of participants on a timely basis (if at all), then our liquidity and our business may be materially adversely affected.
Reductions in the volume of mall traffic or closing of shopping malls as a result of unfavorable economic conditions or changing demographic patterns could significantly reduce our sales and leave us with unsold inventory.
Most of our stores are currently located in shopping malls. Sales at these stores are derived, in part, from the volume of traffic in those malls. These stores benefit from the ability of the malls’ “anchor” tenants, generally
26
Table of Contents
large department stores and other area attractions, to generate consumer traffic in the vicinity of our stores and the continuing popularity of the malls as shopping destinations. Unfavorable economic conditions, particularly in certain regions, have adversely affected mall traffic and resulted in the closing of certain anchor stores and have threatened the viability of certain commercial real estate firms which operate major shopping malls. A continuation of this trend, including failure of a large commercial landlord or continued declines in the popularity of mall shopping generally among our customers, could reduce our sales and leave us with excess inventory. We may respond by increasing markdowns or initiating marketing promotions to reduce excess inventory, which would further adversely impact our results of operations.
Our business depends upon the successful operation of our distribution facilities, furniture home delivery hubs and customer care center, as well as our ability to fulfill orders and to deliver our merchandise to our customers in a timely manner.
Our business depends upon the successful operation of our distribution centers, furniture home delivery hubs and customer care center, as well as our order management and fulfillment services and the re-stocking of inventories within our stores. The efficient flow of our merchandise requires that our facilities have adequate capacity to support our current level of operations, and any anticipated increased levels that may follow from any growth of our business.
If we encounter difficulties associated with any of our facilities or if any of our facilities were to shut down for any reason, including as a result of fire, earthquakes (to which our California-based distribution and home delivery facilities in Tracy and Mira Loma and our corporate headquarters in Corte Madera are particularly vulnerable), power outages or other natural disasters, we could face shortages of inventory resulting in “out of stock” conditions in our stores, significantly higher costs and longer lead times associated with distributing our products to both our stores and online customers and the inability to process orders in a timely manner or ship goods to our customers. Further, any significant interruption in the operation of our customer care center, including the call center, could also reduce our ability to receive and process orders and provide products and services to our stores and customers, which could result in lost sales, cancelled sales and a loss of loyalty to our brand.
In January 2012, we opened a furniture home delivery hub in Avenel, New Jersey and, in February 2012, we opened a furniture distribution center in North East, Maryland. We also recently expanded our West Coast distribution center in Mira Loma, California and reduced the size of our furniture delivery hub in Tracy, California. As a result of these and other efforts with respect to our distribution facilities, we may encounter operational difficulties with respect to our facilities, such as disruptions in transitioning fulfillment orders to the new distribution facilities and problems associated with operating new facilities or reducing the size and changing functions of existing facilities, and any such difficulties could have a material adverse effect on our business, financial condition and results of operations.
Our results may be adversely affected by fluctuations in raw materials and energy costs.
Increases in the prices of the components and raw materials used in our products could negatively affect the sales of our merchandise and our product margins. These prices may fluctuate based on a number of factors beyond our control, including: commodity prices including prices for oil, lumber and cotton, changes in supply and demand, general economic conditions, labor costs, competition, import duties, tariffs, currency exchange rates and government regulation. In addition, energy costs have fluctuated dramatically in the past. These fluctuations may result in an increase in our transportation costs for freight and distribution, utility costs for our retail stores (particularly our facility located in Tracy, California, which has experienced problems with its power supply in recent years) and overall costs to purchase products from our vendors. Accordingly, changes in the value of the U.S. dollar relative to foreign currencies may increase our vendors’ cost of business and ultimately our cost of goods sold and our selling, general and administrative costs. If we are unable to pass such cost increases on to our customers or the higher cost of the products results in decreased demand for our products, our
27
Table of Contents
results of operations would be harmed. Any such cost increase could reduce our earnings to the extent we are unable to adjust the prices of our products.
We are subject to risks associated with our dependence on foreign imports for our merchandise.
Based on total volume dollar purchases, in fiscal 2011 we purchased approximately 84% of our merchandise from vendors located outside the United States, including 77% from Asia, the majority of which originated from China. In addition, some of the merchandise we purchase from vendors in the United States also depends, in whole or in part, on vendors located outside the United States. As a result, our business highly depends on global trade, as well as trade and cost factors that impact the specific countries where our vendors are located, including Asia. Our future success will depend in large part upon our ability to maintain our existing foreign vendor relationships and to develop new ones. While we rely on our long-term relationships with our foreign vendors, we have no long-term contracts with them and transact business on an order by order basis. Additionally, many of our imported products are subject to existing duties, tariffs and quotas that may limit the quantity of some types of goods which we may import into the United States. Our dependence on foreign imports also makes us vulnerable to risks associated with products manufactured abroad, including, among other things, risks of damage, destruction or confiscation of products while in transit to our distribution centers located in the United States, charges on or assessment of additional import duties, tariffs and quotas, loss of “most favored nation” trading status by the United States in relation to a particular foreign country, work stoppages, including without limitation as a result of events such as longshoremen strikes, transportation and other delays in shipments, including without limitation as a result of heightened security screening and inspection processes or other port-of-entry limitations or restrictions in the United States, freight cost increases, economic uncertainties, including inflation, foreign government regulations, trade restrictions, including the United States retaliating against protectionist foreign trade practices and political unrest, increased labor costs and other similar factors that might affect the operations of our vendors in specific countries such as China.
An interruption or delay in supply from our foreign sources, or the imposition of additional duties, taxes or other charges on these imports, could have a material adverse effect on our business, financial condition and results of operations unless and until alternative supply arrangements are secured.
In addition, there is a risk that compliance lapses by our vendors could occur which could lead to investigations by U.S. government agencies responsible for international trade compliance. Resulting penalties or enforcement actions could delay future imports/exports or otherwise negatively impact our business. In addition, there remains a risk that one or more of our foreign vendors will not adhere to applicable legal requirements or our global compliance standards such as fair labor standards, the prohibition on child labor and other product safety or manufacturing safety standards. The violation of applicable legal requirements by any of our vendors or the failure to adhere to labor, manufacturing safety and other laws by any of our vendors, or the divergence of the labor practices followed by any of our vendors from those generally accepted in the United States, could disrupt our supply of products from our vendors or the shipment of products to us, result in potential liability to us and harm our reputation and brand, any of which could negatively affect our business and operating results.
We rely upon independent third-party transportation providers for the majority of our product shipments.
We currently rely upon independent third-party transportation providers for our product shipments to our stores and to our customers outside of certain areas. Our utilization of their delivery services for shipments, or those of any other shipping companies we may elect to use, is subject to risks, including increases in fuel prices, which would increase our shipping costs, and strikes, work stoppages and inclement weather, which may impact the shipping companies’ abilities to provide delivery services that adequately meet our shipping needs. If we change shipping companies, we could face logistical difficulties that could adversely affect deliveries and we would incur costs and expend resources in connection with such change. Moreover, we may not be able to obtain terms as favorable as those received from the third-party transportation providers we currently use, which in turn would increase our costs.
28
Table of Contents
We may be exposed to risks and costs associated with protecting the integrity and security of our customers’ information.
A significant number of customer purchases from us across all of our channels are made using credit cards. Additionally, approximately 50% of our customer orders are placed through our website. In order for our business to function successfully, we and other market participants must be able to handle and transmit confidential information, including credit card information, securely. There can be no assurance that we currently can, or in the future will be able to, operate our facilities and our customer service and sales operations in accordance with industry recommended practices such as Payment Card Industry, or PCI, Data Security Standards. Even if we are compliant with such standards, we still may not be able to prevent security breaches involving customer transaction data. Any breach could cause consumers to lose confidence in the security of our website and choose not to purchase from us. For example, in 2008 we terminated the employment of certain employees in our call center as a result of unauthorized credit card charges. If a computer hacker or other criminal is able to circumvent our security measures, he or she could destroy or steal valuable information or disrupt our operations. Any security breach could expose us to risks of data loss, litigation and liability and could seriously disrupt our operations and harm our reputation, any of which could adversely affect our business.
In addition, states and the federal government have enacted additional laws and regulations to protect consumers against identity theft. We collect and store personal information from consumers in the course of doing business. These laws have increased the costs of doing business and, if we fail to implement appropriate safeguards or we fail to detect and provide prompt notice of unauthorized access as required by some of these laws, we could be subject to potential claims for damages and other remedies. If we were required to pay any significant amounts in satisfaction of claims under these laws, or if we were forced to cease our business operations for any length of time as a result of our inability to comply fully with any such law, our business, operating results and financial condition could be adversely affected.
Material damage to, or interruptions in, our information systems as a result of external factors, staffing shortages and difficulties in updating our existing software or developing or implementing new software could have a material adverse effect on our business or results of operations.
We depend largely upon our information technology systems in the conduct of all aspects of our operations, many of which we have only adopted and implemented within the past five years in connection with rebuilding our supply chain and infrastructure. Such systems are subject to damage or interruption from power outages, computer and telecommunications failures, computer viruses, security breaches and natural disasters. Damage or interruption to our information systems may require a significant investment to fix or replace them, and we may suffer interruptions in our operations in the interim. Management information system failures or telecommunications system problems may disrupt operations. In addition, costs and potential problems and interruptions associated with the implementation of new or upgraded systems and technology or with maintenance or adequate support of existing systems could also disrupt or reduce the efficiency of our operations. Any material interruptions or failures in our systems may have a material adverse effect on our business or results of operations.
We also rely heavily on our information technology staff. If we cannot meet our staffing needs in this area, we may not be able to fulfill our technology initiatives while continuing to provide maintenance on existing systems.
We rely on certain software vendors to maintain and periodically upgrade many of these systems so that they can continue to support our business. The software programs supporting many of our systems were licensed to us by independent software developers. The inability of these developers or us to continue to maintain and upgrade these information systems and software programs would disrupt or reduce the efficiency of our operations if we were unable to convert to alternate systems in an efficient and timely manner.
29
Table of Contents
We are vulnerable to various risks and uncertainties associated with our websites, including changes in required technology interfaces, website downtime and other technical failures, costs and technical issues as we upgrade our website software, computer viruses, changes in applicable federal and state regulation, security breaches, legal claims related to our website operations and e-commerce fulfillment and other consumer privacy concerns. Our failure to successfully respond to these risks and uncertainties could reduce website sales and have a material adverse effect on our business or results of operations.
Our failure to successfully manage the costs of our catalog and promotional mailings could have a negative impact on our business.
Catalog mailings are an important component of our business. Increases in costs relating to paper, printing, postal rates and other catalog distribution costs would affect the cost of our catalog mailings. We have recently significantly expanded the page counts of our catalogs, increased the number of households receiving our catalogs and reduced the number of catalog mailings. While we expect to send fewer of these catalogs overall, we cannot assure you that this strategy will be successful. We rely on customary discounts from the basic postal rate structure that are available for our catalog mailings, which could be changed or discontinued at any time. The market price for paper has fluctuated significantly during the past three fiscal years and may continue to fluctuate in the future. Future increases in postal rates, paper costs or printing costs would have a negative impact on our operating results to the extent that we are unable to offset such increases by raising prices, by implementing more efficient printing, mailing, delivery and order fulfillment systems or by using alternative direct-mail formats.
We have historically experienced fluctuations in customer response to our catalogs. Customer response to our catalogs depends substantially on product assortment, product availability and creative presentation, the selection of customers to whom the catalogs are mailed, changes in mailing strategies, the page size, page count, frequency and timing of delivery of the catalogs, as well as the general retail sales environment and current domestic and global economic conditions. The failure to effectively produce or distribute our catalogs could affect the timing of catalog delivery. The timing of catalog delivery has been and can be affected by postal service delays. Any delays in the timing of catalog delivery could cause customers to forgo or defer purchases. If the performance of our catalogs declines, if we misjudge the correlation between our catalog circulation and net sales, or if our catalog circulation optimization strategy is not successful, our results of operations could be negatively impacted.
Our failure to successfully anticipate merchandise returns might have a negative impact on our business.
We record a reserve for merchandise returns based on historical return trends together with current product sales performance in each reporting period. If actual returns are greater than those projected and reserved for by management, additional sales returns might be recorded in future periods. In addition, to the extent that returned merchandise is damaged, we often do not receive full retail value from the resale or liquidation of the merchandise. Further, the introduction of new merchandise, changes in merchandise mix, changes in consumer confidence or other competitive and general economic conditions may cause actual returns to exceed merchandise return reserves. Adverse economic conditions in the past have resulted in an increase in our merchandise returns. Any significant increase in merchandise returns that exceeds our reserves could harm our business and operating results.
Certain of our products may be subject to recalls or other actions by regulatory authorities, and any such recalls or similar actions could have a material adverse effect on our business.
Certain of the products we sell are subject to regulation by the federal Consumer Product Safety Commission and similar state and international regulatory authorities, which require certification and testing of certain regulated substances, among other requirements. For example, in August 2008, the Consumer Product Safety Improvement Act of 2008, or CPSIA, was signed into law. In general, the CPSIA bans the sale of children’s products containing lead in excess of certain maximum standards, and imposes other restrictions and
30
Table of Contents
requirements on the sale of children’s products, including importing, testing and labeling requirements. Our products have, from time to time, been subject to recall for product safety reasons, and issues of product safety could result in future product recalls, other actions by applicable government authorities or product liability claims. Product safety concerns may also require us, whether on a voluntary or involuntary basis, to remove selected products from our stores, particularly with respect to our Restoration Hardware Baby & Child brand. Product recalls and removal of products and defending such product liability claims can result in, among other things, lost sales, diverted resources, potential harm to our reputation and increased customer service costs, any of which could have a material adverse effect on our business and results of operations.
There are claims made against us from time to time that can result in litigation or regulatory proceedings which could distract management from our business activities and result in significant liability.
From time to time we are involved in litigation, claims and other proceedings relating to the conduct of our business, including but not limited to consumer protection class action litigation, claims related to our business, including claims related to our collection of reproductions, or employment practices and claims of intellectual property infringement. In addition, from time to time, we are subject to product liability and personal injury claims for the products that we sell and the stores we operate. Subject to certain exceptions, our purchase orders generally require the vendor to indemnify us against any product liability claims; however, if the vendor does not have insurance or becomes insolvent, we may not be indemnified. In addition, we could face a wide variety of employee claims against us, including general discrimination, privacy, labor and employment, ERISA and disability claims. Any claims could also result in litigation against us and could also result in regulatory proceedings being brought against us by various federal and state agencies that regulate our business, including the United States Equal Employment Opportunity Commission. Often these cases raise complex factual and legal issues, which are subject to risks and uncertainties and which could require significant management time. Litigation and other claims and regulatory proceedings against us could result in unexpected expenses and liability and could also materially adversely affect our operations and our reputation.
Labor activities could cause labor relations difficulties for us.
Currently none of our employees is represented by a union. However, our employees have the right at any time to form or affiliate with a union, and union organizational activities have occurred previously at our Baltimore distribution center. We cannot predict the negative effects that any future organizational activities will have on our business and operations. If we were to become subject to work stoppages, we could experience disruption in our operations and increases in our labor costs, either of which could materially adversely affect our business, financial condition or results of operations.
Our failure or inability to protect our intellectual property rights could diminish the value of our brand and weaken our competitive position.
We currently rely on a combination of copyright, trademark, trade dress and unfair competition laws, as well as confidentiality procedures and licensing arrangements, to establish and protect our intellectual property rights. We believe that our trademarks and other proprietary rights have significant value and are important to identifying and differentiating certain of our products and brand from those of our competitors and creating and sustaining demand for certain of our products. We cannot assure you that the steps taken by us to protect our intellectual property rights will be adequate to prevent infringement of such rights by others, including imitation of our products and misappropriation of our brand.
Furthermore, third parties have and may in the future assert intellectual property claims against us, particularly as we expand our business and the number of products we offer. Our defense of any claim, regardless of its merit, could be expensive and time consuming and could divert management resources. Successful infringement claims against us could result in significant monetary liability or prevent us from selling some of our products. In addition, resolution of claims may require us to redesign our products, license rights from third
31
Table of Contents
parties or cease using those rights altogether. If we fail to protect and maintain our intellectual property rights, the value of our brand could be diminished and our competitive position may suffer.
We are subject to risks associated with occupying substantial amounts of space, including future increases in occupancy costs. We may choose in the future to acquire some of our store locations, which will subject us to additional risks.
We lease all but one of our retail store locations and we also lease our outlet stores, our corporate headquarters and our six distribution and delivery facilities. The initial lease term of our retail stores generally ranges from ten to fifteen years, and certain leases contain renewal options for up to fifteen years. Most leases for our retail stores provide for a minimum rent, typically including escalating rent increases, plus a percentage rent based upon sales after certain minimum thresholds are achieved, as well as common area maintenance charges, real property insurance and real estate taxes. We purchased the building and land for our store in San Francisco, but to date we have relied upon leases with landlords for our other locations. As we develop new stores in the future, we may explore other models for our real estate which could include joint ventures or other forms of equity ownership in the real estate interests associated with new sites and buildings. These approaches might require additional capital investment and could present different risks than a traditional store lease with a landlord, including greater financial exposure if a new store location is not as successful as we originally target in our plans.
If we decide to close an existing or future store, we may nonetheless have continuing obligations with respect to that property pursuant to the applicable lease or ownership arrangements, including, among other things, paying the base rent for the balance of the lease term. Our ability to re-negotiate favorable terms on an expiring lease, to arrange for the sale of an owned property or to negotiate favorable terms for a suitable alternate location could depend on conditions in the real estate market, competition for desirable properties, our relationships with current and prospective landlords and other factors that are not within our control. Our inability to enter into new leases or renew existing leases on terms acceptable to us or be released from our obligations under leases or other obligations for stores that we close could materially adversely affect our business and results of operations.
Compliance with laws may be costly, and changes in laws could make conducting our business more expensive or otherwise change the way we do business.
We are subject to numerous regulations, including labor and employment, customs, truth-in-advertising, consumer protection, privacy, safety, environmental and zoning and occupancy laws and other laws, including consumer protection regulations that regulate retailers generally or govern our business. If these regulations were to change or were violated by us or our vendors or buying agents, the costs of certain goods could increase, or we could experience delays in shipments of our goods, be subject to fines or penalties, or suffer reputational harm, which could reduce demand for our products and harm our business and results of operations.
In addition to increased regulatory compliance requirements, changes in laws could make ordinary conduct of our business more expensive or require us to change the way we do business. For example, as a retail business, changes in laws related to employee benefits and treatment of employees, including laws related to limitations on employee hours, supervisory status, leaves of absence, mandated health benefits or overtime pay, could negatively impact us by increasing compensation and benefits costs for overtime and medical expenses. In addition, newly enacted United States health care laws and potential global and domestic greenhouse gas emission requirements and other environmental legislation and regulations could result in increased direct compliance costs for us (or may cause our vendors to raise the prices they charge us in order to maintain profitable operations because of increased compliance costs), increased transportation costs or reduced availability of raw materials.
32
Table of Contents
Because of our international operations, we could be adversely affected by violations of the United States Foreign Corrupt Practices Act and similar worldwide anti-bribery and anti-kickback laws.
We source substantially all of our products abroad, and we are increasing the level of our international sourcing activities in an effort to obtain more of our products directly from vendors located abroad. The United States Foreign Corrupt Practices Act, and other similar laws and regulations, generally prohibit companies and their intermediaries from making improper payments to non-United States officials for the purpose of obtaining or retaining business. While our policies mandate compliance with these anti-bribery laws, we cannot assure you that we will be successful in preventing our employees or other agents from taking actions in violation of these laws or regulations. Such violations, or allegations of such violations, could disrupt our business and result in a material adverse effect on our financial condition, results of operations and cash flows.
Our operations are subject to risks of natural disasters, acts of war, terrorism or widespread illness, any one of which could result in a business stoppage and negatively affect our operating results.
Our business operations depend on our ability to maintain and protect our facilities, computer systems and personnel. Our operations and consumer spending may be affected by natural disasters or other similar events, including floods, hurricanes, earthquakes, widespread illness or fires. In particular, our corporate headquarters is located in Northern California, and other parts of our operations including distribution facilities are located in Northern and Southern California, each of which is in a seismically active region susceptible to earthquakes that could disrupt our operations and affect our operating results. Many of our vendors are also located in areas that may be affected by such events. Moreover, geopolitical or public safety conditions which affect consumer behavior and spending may impact our business. Terrorist attacks in the United States or threats of terrorist attacks in the United States in the future, as well as future events occurring in response to or in connection with them, could again result in reduced levels of consumer spending. Any of these occurrences could have a significant impact on our operating results, revenue and costs.
We have experienced net losses in the past and we may experience net losses in the future.
We experienced net losses of $28.7 million and $8.1 million in fiscal 2009 and fiscal 2010, respectively. We only recently achieved profitability, as we reported net income of $20.3 million in fiscal 2011. We may experience net losses in the future, and we cannot assure you that we will sustain recently achieved profitability in future periods.
Fluctuations in our tax obligations and effective tax rate and realization of our deferred tax assets, including net operating loss carryforwards, may result in volatility of our operating results.
We are subject to income taxes in the United States and certain foreign jurisdictions. We record tax expense based on our estimates of future payments, which include reserves for uncertain tax positions in multiple tax jurisdictions, and valuation allowances related to certain net deferred tax assets, including net operating loss carryforwards. At any one time, many tax years are subject to audit by various taxing jurisdictions. The results of these audits and negotiations with taxing authorities may affect the ultimate settlement of these issues. Under United States federal and state income tax laws, if over a rolling three-year period, the cumulative change in our ownership exceeds 50%, our ability to utilize our net operating loss carryforwards to offset future taxable income may be limited. Changes in ownership can occur due to transactions in our stock or the issuance of additional shares of our common stock or, in certain circumstances, securities convertible into our common stock. Certain transactions we have completed, including our going private transaction in June 2008, and the sale of shares contemplated in this offering, may impact the timing of the utilization of our net operating loss carryforwards. Furthermore, it is possible that transactions in our stock that may not be within our control may cause us to exceed the 50% cumulative change threshold and may impose a limitation on the utilization of our net operating loss carryforwards in the future. Any such limitation on the timing of utilizing our net operating loss
33
Table of Contents
carryforwards would increase the use of cash to settle our tax obligations. We expect that throughout the year there could be ongoing variability in our quarterly tax rates as events occur and exposures are evaluated.
In addition, our effective tax rate in a given financial statement period may be materially impacted by changes in the mix and level of earnings, timing of the utilization of net operating loss carryforwards, changes in the valuation allowance for deferred taxes or by changes to existing accounting rules or regulations. Further, tax legislation may be enacted in the future that could negatively impact our current or future tax structure and effective tax rates.
Changes to accounting rules or regulations may adversely affect our results of operations.
New accounting rules or regulations and varying interpretations of existing accounting rules or regulations have occurred and may occur in the future. A change in accounting rules or regulations may even affect our reporting of transactions completed before the change is effective, and future changes to accounting rules or regulations or the questioning of current accounting practices may adversely affect our results of operations. For example, in August 2010, the Financial Accounting Standards Board (“FASB”) issued an exposure draft outlining proposed changes to current lease accounting in FASB Accounting Standards Codification (“Codification” or “ASC”) 840, “Leases.” In July 2011, the FASB made the decision to issue a revised exposure draft, which is expected to occur in the second half of 2012, with a final standard expected to be issued in 2013. The proposed new accounting pronouncement, if ultimately adopted in its proposed form, could result in significant changes to current accounting, including the capitalization of leases on the balance sheet that currently are recorded off balance sheet as operating leases. While this change would not impact the cash flow related to our store leases, it could adversely impact our balance sheet and could therefore impact our ability to raise financing from banks or other sources.
Our total assets include intangible assets with an indefinite life, goodwill and trademarks, and substantial amounts of long lived assets, principally property and equipment. Changes to estimates or projections used to assess the fair value of these assets, or operating results that are lower than our current estimates at certain store locations, may cause us to incur impairment charges that could adversely affect our results of operations.
Our total assets include intangible assets with an indefinite life, goodwill and trademarks, and substantial amounts of property and equipment. We make certain estimates and projections in connection with impairment analyses for these long lived assets, in accordance with FASB ASC 360, “Property, Plant and Equipment (“ASC 360”), and ASC 350, “Intangibles—Goodwill and Other” (“ASC 350”). We also review the carrying value of these assets for impairment whenever events or changes in circumstances indicate that the carrying value of the asset may not be recoverable in accordance with ASC 360 or ASC 350. We will record an impairment loss when the carrying value of the underlying asset, asset group or reporting unit exceeds its fair value. These calculations require us to make a number of estimates and projections of future results. If these estimates or projections change, we may be required to record additional impairment charges on certain of these assets. If these impairment charges are significant, our results of operations would be adversely affected. In that regard, we recorded a $2.1 million impairment charge on long-lived assets of certain underperforming stores in fiscal 2010, and we recorded charges amounting to $3.2 million related to retail store closures in fiscal 2011.
Risks Related to this Offering and Ownership of Our Common Stock
Our common stock price may be volatile or may decline regardless of our operating performance, and you may not be able to resell your shares at or above the initial public offering price.
After this offering, the market price for our common stock is likely to be volatile, in part because our shares have not been traded publicly. In addition, as a retailer, our results are significantly affected by factors outside our control, particularly consumer spending and consumer confidence, which can significantly affect our stock
34
Table of Contents
price. In addition, the market price of our common stock may fluctuate significantly in response to a number of other factors, including those described elsewhere in this “Risk Factors” section and this prospectus, as well as the following:
| • | quarterly variations in our operating results compared to market expectations; |
| • | changes in preferences of our customers; |
| • | announcements of new products or significant price reductions by us or our competitors; |
| • | size of the public float; |
| • | stock price performance of our competitors; |
| • | fluctuations in stock market prices and volumes; |
| • | default on our indebtedness; |
| • | actions by competitors or other shopping center tenants; |
| • | changes in senior management or key personnel; |
| • | changes in financial estimates by securities analysts or failure to meet their expectations; |
| • | actual or anticipated negative earnings or other announcements by us or other retail companies; |
| • | downgrades in our credit ratings or the credit ratings of our competitors; |
| • | natural disasters or other similar events; |
| • | issuances or expected issuances of capital stock; and |
| • | global economic, legal and regulatory changes unrelated to our performance. |
The initial public offering price of our common stock will be determined by negotiations between us and the underwriters based upon a number of factors and may not be indicative of prices that will prevail following the consummation of this offering. Volatility in the market price of our common stock may prevent investors from being able to sell their common stock at or above the initial public offering price. As a result, you may suffer a loss on your investment.
In addition, stock markets have experienced extreme price and volume fluctuations that have affected and continue to affect the market prices of equity securities of many retail companies. In the past, stockholders have instituted securities class action litigation following periods of market volatility. If we were involved in securities litigation, we could incur substantial costs and our resources and the attention of management could be diverted from our business.
Our filings and public disclosures have attracted the attention of a hedge fund manager whose investment strategies we believe include making investments that increase in value when stock prices decline. The fund manager has informed us of the fund’s negative view of our Company and business and has threatened to publicize those views. There can be no assurance that this fund manager will not attempt to influence the broader investment community or otherwise attempt to disparage our Company or our brand, which could negatively affect our stock price.
Substantial future sales of our common stock, or the perception in the public markets that these sales may occur, may depress our stock price.
Sales of substantial amounts of our common stock in the public market after this offering, or the perception that these sales could occur, could adversely affect the price of our common stock and could impair our ability to raise capital through the sale of additional shares. Upon completion of this offering, we will have million
35
Table of Contents
shares of common stock outstanding. The shares of common stock offered in this offering will be freely tradable without restriction under the Securities Act of 1933, as amended (the “Securities Act”), except for any shares of our common stock that may be held or acquired by our directors, executive officers and other affiliates, as that term is defined in the Securities Act, which will be restricted securities under the Securities Act. Restricted securities may not be sold in the public market unless the sale is registered under the Securities Act or an exemption from registration is available. Moreover, under a registration rights agreement, Home Holdings and the other Principal Equity Holders will have registration rights whereby, at any time following our initial public offering, Home Holdings or the other Principal Equity Holders can require us to register under the Securities Act any shares owned by Home Holdings or the other Principal Equity Holders as of the date of this prospectus and not sold in this offering. See “Certain Relationships and Related Party Transactions—Registration Rights Agreement” for a more detailed description of the stockholders agreement. If our existing stockholders sell substantial amounts of our common stock in the public market, or if the public perceives that such sales could occur, this could have an adverse impact on the market price of our common stock, even if there is no relationship between such sales and the performance of our business.
We, our executive officers and directors, the selling stockholders and our other existing security holders have agreed, subject to certain exceptions, not to sell or transfer any common stock, or securities convertible into, exchangeable for, exercisable for or repayable with common stock, for 180 days after the date of this prospectus, without first obtaining written consent of Merrill Lynch, Pierce, Fenner & Smith Incorporated and Goldman, Sachs & Co., representatives of the underwriters. See “Underwriting.”
All of our shares of common stock outstanding as of the date of this prospectus may be sold in the public market by existing stockholders 180 days after the date of this prospectus, subject to applicable limitations imposed under federal securities laws. See “Shares Eligible for Future Sale” for a more detailed description of the restrictions on selling shares of our common stock after this offering.
In the future, we may also issue our securities in connection with a capital raise or acquisitions. The amount of shares of our common stock issued in connection with a capital raise or acquisition could constitute a material portion of our then-outstanding shares of our common stock, which would result in dilution.
Anti-takeover provisions in our charter documents and Delaware law might discourage or delay acquisition attempts for us that you might consider favorable.
Our certificate of incorporation and bylaws, as each will be in effect upon completion of this offering, will contain provisions that may make the acquisition of our Company more difficult without the approval of our board of directors. These provisions:
| • | establish a classified board of directors so that not all members of our board of directors are elected at one time; |
| • | authorize the issuance of undesignated preferred stock, the terms of which may be established and the shares of which may be issued without stockholder approval, and which may include super voting, special approval, dividend or other rights or preferences superior to the rights of the holders of common stock; |
| • | after the date on which Home Holdings no longer holds at least shares of our common stock, prohibit stockholder action by written consent, which requires all stockholder actions to be taken at a meeting of our stockholders; |
| • | provide that our board of directors is expressly authorized to make, alter or repeal our bylaws; and |
| • | establish advance notice requirements for nominations for elections to our board of directors or for proposing matters that can be acted upon by stockholders at stockholder meetings. |
36
Table of Contents
Our certificate of incorporation will also contain a provision that provides us with protections similar to Section 203 of the Delaware General Corporation Law (“DGCL”), and will prevent us from engaging in a business combination with a person who acquires at least 15% of our common stock for a period of three years from the date such person acquired such common stock unless board or stockholder approval is obtained prior to the acquisition, except that our Principal Equity Holders and any persons to whom our Principal Equity Holders sell their common stock will be deemed to have been approved by our board of directors, and thereby not subject to these restrictions. These anti-takeover provisions and other provisions under Delaware law could discourage, delay or prevent a transaction involving a change in control of our Company, even if doing so would benefit our stockholders. These provisions could also discourage proxy contests and make it more difficult for you and other stockholders to elect directors of your choosing and to cause us to take other corporate actions you desire.
If you purchase shares of common stock sold in this offering, you will incur immediate and substantial dilution.
If you purchase shares of common stock in this offering, you will incur immediate and substantial dilution in the amount of $ per share based upon an assumed initial public offering price of $ per share (the midpoint of the estimated price range set forth on the cover of this prospectus), which is substantially higher than the pro forma net tangible book value per share of our outstanding common stock. In addition, you may also experience additional dilution, or potential dilution, upon future equity issuances to investors or to our employees, consultants and directors under our stock option and equity incentive plans. See “Dilution.”
We do not expect to pay any cash dividends for the foreseeable future.
We do not anticipate that we will pay any cash dividends on shares of our common stock for the foreseeable future. Any determination to pay dividends in the future will be at the discretion of our board of directors and will depend upon results of operations, financial condition, contractual restrictions, restrictions imposed by applicable law and other factors our board of directors deems relevant. Accordingly, if you purchase shares in this offering, realization of a gain on your investment will depend on the appreciation of the price of our common stock, which may never occur. Investors seeking cash dividends in the foreseeable future should not purchase our common stock.
We may apply the proceeds of this offering to uses that do not improve our operating results or increase the value of your investment.
We intend to use a portion of the net proceeds from the sale of common stock in this offering to repay a portion of the outstanding amounts under the Restoration Hardware, Inc. revolving line of credit and term loan and to pay fees and expenses incurred in connection with this offering of approximately $ , including management fees of $ to affiliates of Catterton, Tower Three and Glenhill pursuant to the terms of the management services agreement we entered into with them. We may also use a portion of our net proceeds to acquire or invest in other businesses or products. However, we do not have more specific plans for the net proceeds from this offering and will have broad discretion in how we use the net proceeds of this offering. These proceeds could be applied in ways that do not improve our operating results or increase the value of your investment.
Home Holdings, Catterton, Tower Three, and Glenhill will continue to have significant influence over us after this offering, including over decisions that require the approval of stockholders, and their interests in our business may be different from yours.
Upon completion of this offering, Home Holdings will own approximately shares, or %, of our outstanding common stock. Of that amount, Catterton will beneficially own approximately shares, or % of our outstanding common stock, Tower Three will beneficially own approximately shares, or %
37
Table of Contents
of our outstanding common stock, and Glenhill will beneficially own approximately shares, or % of our outstanding common stock.
Home Holdings, and through Home Holdings, Catterton, Tower Three and Glenhill, will have significant influence over our reporting and corporate management and affairs and will be able to control certain matters requiring stockholder approval after this offering. It is possible that the interests of our Principal Equity Holders may in some circumstances conflict with the interests of our other stockholders, including you. We intend to enter into a stockholders agreement with Home Holdings that will provide for certain approval rights for Home Holdings and designation of directors by Home Holdings. In addition, the stockholders agreement will provide that, for so long as Home Holdings owns shares of our common stock, Home Holdings shall appoint two members to the board of directors and that no action may be taken or vote approved by our board of directors or any committee thereof (other than the audit committee) without the affirmative vote of both directors nominated by Home Holdings. The stockholder agreement also will provide for a waiver of the corporate opportunity doctrine with respect to Home Holdings and its affiliates, including the Principal Equity Holders. See “Certain Relationships and Related Party Transactions—Stockholders Agreement.”
Our Principal Equity Holders are also in the business of making investments in companies and may from time to time acquire and hold interests in businesses that compete directly or indirectly with us. Our Principal Equity Holders may also pursue acquisition opportunities that are complementary to our business and, as a result, those acquisition opportunities may not be available to us. So long as Home Holdings or our Principal Equity Holders, or other funds controlled by or associated with our Principal Equity Holders, continue to indirectly own a significant amount of our outstanding common stock, even if such amount represents less than 50%, Home Holdings and our Principal Equity Holders will continue to be able to strongly influence our decisions. The concentration of ownership in the hands of our Principal Equity Holders may have the effect of delaying, preventing or deterring a change of control of our Company, could deprive stockholders of an opportunity to receive a premium for their common stock as part of a sale of our Company and might ultimately affect the market price of our common stock.
We are a “controlled company” within the meaning of the NYSE listing requirements and, as a result, will qualify for, and intend to rely on, exemptions from certain corporate governance requirements. You will not have the same protections afforded to stockholders of companies that are subject to such corporate governance requirements.
Because of the aggregate voting power over our Company held by Home Holdings, we are considered a “controlled company” for the purposes of the NYSE listing requirements. As such, we are exempt from the corporate governance requirements that our board of directors, our compensation committee and our nominating and corporate governance committee meet the standard of independence established by those corporate governance requirements. The independence standards are intended to ensure that directors who meet the independence standard are free of any conflicting interest that could influence their actions as directors.
Following this offering, we intend to utilize these exemptions afforded to a “controlled company.” Accordingly, you will not have the same protections afforded to stockholders of companies that are subject to all of the corporate governance requirements of the NYSE.
Compliance with Section 404 of the Sarbanes-Oxley Act of 2002 may require significant expenditures and effort by management, and if our independent registered public accounting firm is unable to provide an unqualified attestation report on our internal controls, our stock price could be adversely affected.
Until June 2008, Restoration Hardware, Inc. was a public company and was required to comply with Section 404 of the Sarbanes-Oxley Act of 2002 (the “Sarbanes-Oxley Act”) and related rules and regulations. Following the completion of this offering and beginning with our Annual Report on Form 10-K for the year ending February 1, 2014, our management again will be required to report on, and we expect that our
38
Table of Contents
independent registered public accounting firm will have to attest to, the effectiveness of our internal control over financial reporting. We are currently in the process of reviewing, documenting and testing our internal control over financial reporting. We may encounter problems or delays in completing the implementation of any changes necessary to make a favorable assessment of our internal control over financial reporting. In addition, in connection with the attestation process by our independent registered public accounting firm, we may encounter problems or delays in completing the implementation of any requested improvements and receiving a favorable attestation.
In 2008, we reported a material weakness that resulted in us incorrectly reporting the amount of indirect costs capitalized into inventory for the first three quarters of fiscal 2007. As a result, we restated our unaudited quarterly financial information for three quarters in fiscal 2007. Under rules of the Securities and Exchange Commission (the “SEC”), a material weakness is defined as a deficiency, or a combination of deficiencies, in internal control over financial reporting such that there is a reasonable possibility that a material misstatement of a company’s annual or interim financial statements will not be prevented or detected on a timely basis. We cannot assure you that other material weaknesses will not be identified in the future.
If other material weaknesses or other deficiencies occur in the future, or if we fail to fully maintain effective internal controls in the future, it could result in a material misstatement of our financial statements that would not be prevented or detected on a timely basis, which could require a restatement, cause investors to lose confidence in our financial information or cause our stock price to decline.
We will incur new costs as a result of becoming a public company, and such costs may increase when and if we cease to be an “emerging growth company.”
As a public company, we will incur significant legal, accounting, insurance and other expenses that we have not incurred as a private company, including costs associated with public company reporting requirements. The expenses incurred by public companies generally for reporting and corporate governance purposes have been increasing. We expect compliance with these public reporting requirements and associated rules and regulations to increase our legal and financial costs, particularly after we are no longer an “emerging growth company” as defined in the Jumpstart Our Business Startups Act of 2012 (the “JOBS Act”), and to make some activities more time-consuming and costly, although we are currently unable to estimate these costs with any degree of certainty. These laws and regulations could also make it more difficult or costly for us to obtain certain types of insurance, including director and officer liability insurance, and we may be forced to accept reduced policy limits and coverage or incur substantially higher costs to obtain the same or similar coverage. These laws and regulations could also make it more difficult for us to attract and retain qualified persons to serve on our board of directors, our board committees or as our executive officers. Further, if we are unable to satisfy our obligations as a public company, we could be subject to delisting of our common stock, fines, sanctions and other regulatory action and, potentially, civil litigation.
The recently enacted JOBS Act reduces certain disclosure requirements for “emerging growth companies,” thereby decreasing related regulatory compliance costs. We qualify as an “emerging growth company” as of the date of this offering. However, we will cease to be an emerging growth company if we have net revenues of $1.0 billion or more in a fiscal year. We had net revenues of $958.1 million in fiscal 2011 and, if our net revenues exceed $1.0 billion in fiscal 2012, we would no longer qualify as an “emerging growth company” after the end of fiscal 2012, after which time we would not be able to take advantage of the reduced regulatory requirements and any associated cost savings.
As an “emerging growth company,” we cannot be certain whether taking advantage of the reduced disclosure requirements applicable to “emerging growth companies” will make our common stock less attractive to investors.
The JOBS Act provides that, so long as a company qualifies as an “emerging growth company,” it will, among other things, be exempt from the provisions of Section 404(b) of the Sarbanes-Oxley Act requiring that its
39
Table of Contents
independent registered public accounting firm provide an attestation report on the effectiveness of its internal control over financial reporting, be exempt from the “say on pay” and “say on golden parachute” advisory vote requirements of the Dodd-Frank Wall Street Reform and Customer Protection Act (the “Dodd-Frank Act”) and certain disclosure requirements of the Dodd-Frank Act relating to compensation of its chief executive officer and be permitted to omit the detailed compensation discussion and analysis from proxy statements and reports filed under the Securities Exchange Act of 1934, as amended (the “Exchange Act”), and instead provide a reduced level of disclosure concerning executive compensation and be exempt from any rules that may be adopted by the Public Company Accounting Oversight Board requiring mandatory audit firm rotations or a supplement to the auditor’s report on the financial statements.
Although we are still evaluating the JOBS Act, we currently intend to take advantage of the reduced disclosure requirements regarding executive compensation. We have irrevocably elected not to take advantage of the extension of time to comply with new or revised financial accounting standards available under Section 107(b) of the JOBS Act. If we remain an “emerging growth company” after fiscal 2012, we may take advantage of other exemptions, including the exemptions from the advisory vote requirements and executive compensation disclosures under the Dodd-Frank Act and the exemption from the provisions of Section 404(b) of the Sarbanes-Oxley Act. We cannot predict if investors will find our common stock less attractive if we rely on these exemptions, or if taking advantage of these exemptions would result in less active trading or more volatility in the price of our common stock. Also, as a result of our intention to take advantage of some or all of the reduced regulatory and reporting requirements that will be available to us as long as we qualify as an “emerging growth company,” our financial statements may not be comparable to companies that fully comply with regulatory and reporting requirements upon the public company effective dates.
40
Table of Contents
FORWARD-LOOKING STATEMENTS AND MARKET DATA
This prospectus contains forward-looking statements that are subject to risks and uncertainties. Forward-looking statements give our current expectations and projections relating to our financial condition, results of operations, plans, objectives, future performance and business. You can identify forward-looking statements by the fact that they do not relate strictly to historical or current facts. These statements may include words such as “anticipate,” “estimate,” “expect,” “project,” “plan,” “intend,” “believe,” “may,” “will,” “should,” “likely” and other words and terms of similar meaning in connection with any discussion of the timing or nature of future operating or financial performance or other events. For example, forward-looking statements include statements we make relating to:
| • | anticipated demand in given markets, market growth projections and our expected increased market share, store sales and brand awareness; |
| • | our real estate platform transformation, including planned store openings, closings, relocations, remodelings, anticipated store demand, square footage, sales per square foot and occupancy costs, and expected inventory investments, opening expenses and initial investment payback periods for new stores; |
| • | plans and expectations regarding merchandise assortments, product designs, product category introductions and increased merchandise margins; |
| • | plans and expectations relating to growing our direct business through our Source Book catalog circulation strategy and by implementing our digital and social marketing initiative and increased advertising and public relations efforts; |
| • | our intention to expand customer services, such as by offering consultations and customization, and to explore and test new complementary business opportunities, such as an Art & Culture category and a café or restaurant adjacent to, or inside of, select full line Design Galleries; |
| • | our plan to strategically expand our business in select countries outside of the United States and Canada and our belief that we will have strong international appeal; |
| • | other plans and objectives for future operations, growth, initiatives or strategies, including anticipated personnel hiring and planned investments in capital; |
| • | our intention to continue to strengthen our supply chain operations and enhance our technology systems; |
| • | our belief that our vendors have, or will have, adequate capacity to meet our anticipated demand; |
| • | our expectations regarding consumer spending, the housing market and the North American economy; and |
| • | estimated and projected costs, expenditures, cash flows, growth rates, operating margins and financial results. |
These and other forward-looking statements are subject to risk and uncertainties that may cause actual results to differ materially from those that we expected. We derive many of our forward-looking statements from our operating budgets and forecasts, which are based upon many detailed assumptions. While we believe that our assumptions are reasonable, we caution that it is very difficult to predict the impact of known factors and it is impossible for us to anticipate all factors that could affect our actual results. Important factors that could cause actual results to differ materially from our expectations, or cautionary statements, are disclosed under the sections entitled “Risk Factors” and “Management’s Discussion and Analysis of Financial Condition and Results of Operations” in this prospectus. All forward-looking statements attributable to us, or persons acting on our behalf, are expressly qualified in their entirety by these cautionary statements, as well as other cautionary
41
Table of Contents
statements. You should evaluate all forward-looking statements made in this prospectus in the context of these risks and uncertainties.
We caution you that the important factors referenced above may not contain all of the factors that are important to you. In addition, we cannot assure you that we will realize the results or developments we expect or anticipate or, even if substantially realized, that they will result in the consequences or affect us or our operations in the way we expect. The forward-looking statements included in this prospectus are made only as of the date hereof. We undertake no obligation to publicly update or revise any forward-looking statement as a result of new information, future events or otherwise, except as otherwise required by law.
We obtained the industry, market and competitive position data throughout this prospectus from (i) our own internal estimates and research, (ii) industry and general publications and research or (iii) studies and surveys conducted by third parties. Industry publications, research, studies and surveys generally do not guarantee the accuracy or completeness of such information. While we believe that the information included in this prospectus from such publications, research, studies and surveys is reliable, we have not independently verified data from these third-party sources. While we believe our internal estimates and research are reliable and the definitions of our market and industry are appropriate, neither such estimates and research nor such definitions have been verified by any independent source.
42
Table of Contents
We estimate that the net proceeds to us from this offering, after deducting the underwriting discount and estimated offering expenses, will be approximately $ million, assuming the shares are offered at $ per share (the midpoint of the estimated price range set forth on the cover of this prospectus). We will not receive any proceeds from the sale of shares by the selling stockholders.
Each $1.00 increase or decrease in the assumed initial public offering price of $ per share (the midpoint of the estimated price range set forth on the cover of this prospectus) would increase or decrease, as applicable, the net proceeds we receive from this offering by approximately $ million, assuming the number of shares offered by us, as set forth on the cover of this prospectus, remains the same and after deducting the underwriting discount and estimated offering expenses.
We intend to use a portion of the net proceeds from the sale of common stock by us in this offering to repay a portion of the outstanding amounts under the Restoration Hardware, Inc. revolving line of credit and term loan and approximately $ of the net proceeds to pay fees and expenses incurred in connection with this offering, including management fees of $ to affiliates of Catterton, Tower Three and Glenhill pursuant to the terms of the management services agreement we entered into with them.
The total outstanding amounts under the Restoration Hardware, Inc. revolving line of credit was $129.6 million as of July 28, 2012. The maturity date of the revolving line of credit is August 3, 2016. Borrowings under the revolving line of credit bear interest at a rate equal to either the bank’s reference rate or the London Interbank Offered Rate as published by Reuters, referred to as “LIBOR,” plus an applicable margin rate. See “Description of Certain Indebtedness.”
The total outstanding amounts under the Restoration Hardware, Inc. term loan was $14.8 million, net of $0.2 million of unamortized debt issuance costs, as of July 28, 2012. The term loan bears interest at a rate of LIBOR plus 5.0%. Restoration Hardware, Inc. is required to make quarterly payments of $1.25 million beginning October 2012 with the final payment in April 2015. See “Description of Certain Indebtedness.”
Pending use of the net proceeds from this offering described above, we intend to invest the net proceeds in short- and intermediate-term interest-bearing obligations, investment-grade instruments, certificates of deposit or direct or guaranteed obligations of the United States government.
Bank of America, N.A. is a lender under the Restoration Hardware, Inc. revolving line of credit and term loan and an affiliate of Merrill Lynch, Pierce, Fenner & Smith Incorporated, an underwriter in this offering, and may receive more than five percent of the net proceeds of this offering. Thus, Merrill Lynch, Pierce, Fenner & Smith Incorporated may be deemed to have a “conflict of interest” under the applicable provisions of Rule 5121 of the Conduct Rules of FINRA. Accordingly, this offering will be made in compliance with the applicable provisions of Rules 5110 and 5121 of the Conduct Rules regarding the underwriting of securities of a company with a member that has a conflict of interest within the meaning of those rules. Goldman, Sachs & Co. has agreed to serve as a “qualified independent underwriter” as defined by FINRA and performed due diligence investigations and reviewed and participated in the preparation of the registration statement of which this prospectus forms a part. No underwriter with a conflict of interest will execute sales in discretionary accounts without the prior written specific approval of the customers. For more information, see “Underwriting—Conflicts of Interest.”
43
Table of Contents
We currently intend to retain all available funds and any future earnings for use in the operation of our business, and therefore we do not anticipate paying any cash dividends in the foreseeable future. Any future determination to pay dividends will be at the discretion of our board of directors and will depend upon our results of operations, financial condition, capital requirements and other factors that our board of directors deems relevant. We are a holding company, and substantially all of our operations are carried out by our subsidiary, Restoration Hardware, Inc., and its subsidiaries. Restoration Hardware, Inc.’s ability to pay dividends to us is limited by the terms of its credit agreement, which may in turn limit our ability to pay dividends on our common stock. Our ability to pay dividends may also be restricted by the terms of any future credit agreement or any future debt or preferred securities of ours or of our subsidiaries.
44
Table of Contents
The following table sets forth Restoration Hardware, Inc.’s consolidated cash and cash equivalents and capitalization as of July 28, 2012:
| • | on an actual basis; and |
| • | on a pro forma as adjusted basis to give effect to the following: |
| • | the Reorganization as described under the section entitled “Prospectus Summary—Reorganization” as if it had occurred on July 28, 2012; |
| • | the sale of shares of our common stock in this offering by us at an assumed initial public offering price of $ per share (the midpoint of the estimated price range set forth on the cover of this prospectus) after deducting the underwriting discount and estimated offering expenses; |
| • | the use of $ million of the estimated net proceeds of this offering from the sale of common stock by us in this offering to repay a portion of the outstanding amounts under the Restoration Hardware, Inc. revolving line of credit and term loan; and |
| • | the use of $ million of the estimated net proceeds of this offering to pay other fees and expenses incurred in connection with this offering, including management fees of $ to affiliates of Catterton, Tower Three and Glenhill pursuant to the terms of the management services agreement we entered into with them. |
You should read the following table in conjunction with the sections entitled “Use of Proceeds,” “Selected Historical Consolidated Financial and Operating Data” and “Management’s Discussion and Analysis of Financial Condition and Results of Operations” and our consolidated financial statements and related notes included elsewhere in this prospectus.
| As of July 28, 2012 | ||||||||
| Actual | Pro Forma as Adjusted (1) |
|||||||
| (dollars in thousands, except per share data) |
||||||||
| Cash and cash equivalents |
$ | 10,102 | $ | |||||
|
|
|
|
|
|||||
| Debt, including current portion: |
||||||||
| Long-term liabilities: |
||||||||
| Revolving line of credit |
$ | 129,637 | $ | |||||
| Term loan |
14,815 | |||||||
|
|
|
|
|
|||||
| Total long term debt (including current portion) |
144,452 | |||||||
| Stockholders’ equity: |
||||||||
| Common stock, $0.01 par value per share, 1,000 shares authorized, 100 issued and outstanding, actual; $0.0001 par value per share, shares authorized, shares issued and outstanding, pro forma as adjusted |
— | — | ||||||
| Additional paid-in capital |
293,917 | |||||||
| Accumulated other comprehensive income |
1,185 | |||||||
| Accumulated deficit |
(29,979 | ) | (2) | |||||
|
|
|
|
|
|||||
| Total stockholders’ equity |
265,123 | |||||||
|
|
|
|
|
|||||
| Total capitalization |
$ | 409,575 | $ | |||||
|
|
|
|
|
|||||
| (1) | A $1.00 increase (decrease) in the assumed initial public offering price of $ per share, the midpoint of the estimated price range set forth on the cover of this prospectus, would increase (decrease) the pro forma as adjusted amount of cash and cash equivalents by $ million, total assets by $ million, revolving |
45
Table of Contents
| line of credit by $ million, term loan by $ million, total debt (including current portion) by $ million and total stockholders’ equity by $ million, assuming the number of shares offered by us, as set forth on the cover of this prospectus, remains the same and after deducting the underwriting discount and estimated offering expenses. |
| (2) | Reflects (i) the $ impact to accumulated deficit for the shares of unvested common stock that will vest upon this offering after the conversion of outstanding units under the Team Resto Ownership Plan into shares of common stock and (ii) the $ impact to accumulated deficit for the shares of common stock underlying options granted to Mr. Alberini and Mr. Friedman in connection with this offering, based on an assumed initial public offering price of $ per share (the midpoint of the estimated price range set forth on the cover of this prospectus), plus a total of $2.2 million to former employees that are due as a result of the initial public offering. Such payments relate to prior periods of service of certain former employees of our Company. |
The information set forth above excludes:
| • | options to purchase shares of our common stock, with an exercise price equal to the initial public offering price, that we expect to grant in connection with this offering under the 2012 Plan (the amount of unrecognized compensation expense related to these options is $ ); |
| • | options to purchase shares of our common stock, with an exercise price equal to $ per share, that we expect to grant in connection with this offering to our Chief Executive Officer, Carlos Alberini and shares of our common stock, with an exercise price equal to $ per share, that we expect to grant in connection with this offering to Gary Friedman, who serves as our Creator and Curator on an advisory basis; and |
| • | additional shares of common stock reserved for future grants under the 2012 Plan. |
46
Table of Contents
Our pro forma net tangible book value as of July 28, 2012, before giving effect to the sale by us of million shares of common stock offered in this offering, but after giving effect to the Reorganization as if it had occurred on July 28, 2012, was $ million, or $ per share. Pro forma net tangible book value per share represents the amount of our total tangible assets less the amount of our total liabilities, divided by the total number of shares of common stock that would have been outstanding at July 28, 2012, after giving effect to the Reorganization as if it had occurred on July 28, 2012. Dilution in pro forma net tangible book value per share represents the difference between the amount per share paid by investors in this offering and the net tangible book value per share of our common stock outstanding immediately after this offering.
After giving further effect to (i) the sale of shares of our common stock in this offering by us at an assumed initial public offering price of $ per share (the midpoint of the estimated price range set forth on the cover of this prospectus) after deducting the underwriting discount and estimated offering expenses; (ii) the use of $ million of the estimated net proceeds to us in this offering from the sale of million shares to repay a portion of the outstanding amounts under the Restoration Hardware, Inc. revolving line of credit and term loan; and (iii) the use of $ million of the estimated net proceeds to pay other fees and expenses incurred in connection with this offering, including management fees of $ million to affiliates of Catterton, Tower Three and Glenhill pursuant to the terms of the management services agreement we entered into with them, our pro forma as adjusted net tangible book value as of July 28, 2012, would have been $ million, or $ per share of common stock. This represents an immediate increase in pro forma net tangible book value of $ per share and immediate dilution of $ per share to new investors purchasing shares of common stock in this offering at the initial public offering price.
The following table illustrates this dilution to new investors:
| Assumed initial public offering price per share |
$ | |||||||
| Pro forma net tangible book value per share as of July 28, 2012 (after giving effect to the Reorganization) |
$ | |||||||
| Decrease in pro forma net tangible book value per share attributable to fees and other expenses discussed above |
||||||||
| Increase in pro forma tangible book value per share attributable to this offering |
||||||||
|
|
|
|||||||
| Pro forma as adjusted net tangible book value per share as of July 28, 2012 |
||||||||
|
|
|
|||||||
| Pro forma as adjusted dilution per share to new investors |
$ | |||||||
|
|
|
Each $1.00 increase (decrease) in the assumed initial public offering price of $ per share (the midpoint of the estimated price range set forth on the cover of this prospectus) would increase (decrease) our pro forma as adjusted net tangible book value by $ million, or $ per share, and the pro forma as adjusted dilution to investors in this offering by $ per share, assuming that the number of shares offered by us, as set forth on the cover of this prospectus, remains the same and after deducting the underwriting discount and estimated offering expenses. This pro forma information is illustrative only, and following the completion of this offering, will be adjusted based on the actual initial public offering price and other terms of this offering determined at pricing.
47
Table of Contents
The following table summarizes, as of July 28, 2012, on a pro forma as adjusted basis, the number of shares of our common stock purchased from us, the aggregate cash consideration paid to us and the average price per share paid by our existing stockholder in connection with the Acquisition. The table is based on the initial public offering price of $ per share (the midpoint of the estimated price range set forth on the cover of this prospectus), after deducting the underwriting discount and estimated offering expenses in connection with this offering:
| Shares Purchased | Total Consideration | Average Price Per Share |
||||||||||||||||
| Number | Percentage | Amount | Percentage | |||||||||||||||
| Existing stockholder before this offering |
$ | $ | ||||||||||||||||
| New investors participating in this offering |
||||||||||||||||||
|
|
|
|
|
|
|
|
||||||||||||
| Total |
100 | % | 100 | % | ||||||||||||||
|
|
|
|
|
|
|
|
||||||||||||
A $1.00 increase (decrease) in the assumed initial public offering price of $ per share (the midpoint of the estimated price range set forth on the cover of this prospectus) would increase (decrease) the total consideration paid by investors participating in this offering by $ million, or increase (decrease) the percent of total consideration paid by investors participating in this offering by %, assuming that the number of shares offered by us and the selling stockholders, as set forth on the cover of this prospectus, remains the same and after deducting the underwriting discount and estimated offering expenses.
Except as otherwise indicated, the discussion and tables above assume no exercise of the underwriters’ option to purchase additional shares, no exercise of any outstanding options to purchase our common stock and no sale of common stock by the selling stockholders. The sale of million shares of common stock to be sold by the selling stockholders in this offering will reduce the number of shares of common stock held by such stockholders to million, or % of the total shares outstanding, and will increase the number of shares held by investors participating in this offering to million, or % of the total shares outstanding. In addition, if the underwriters’ option to purchase additional shares is exercised in full, the number of shares of common stock held by our existing stockholders will be further reduced to million, or % of the total number of shares of common stock to be outstanding upon the closing of this offering, and the number of shares of common stock held by investors participating in this offering will be further increased to million shares or % of the total number of shares of common stock to be outstanding upon the closing of this offering.
The tables and calculations above exclude:
| • | options to purchase shares of our common stock, each with an exercise price equal to the initial public offering price, that we expect to grant in connection with this offering under the 2012 Plan; |
| • | options to purchase shares of our common stock, with an exercise price equal to $ per share, that we expect to grant in connection with this offering to our Chief Executive Officer, Carlos Alberini, and shares of our common stock, with an exercise price equal to $ per share, that we expect to grant in connection with this offering to Gary Friedman, who serves as our Creator and Curator on an advisory basis; and |
| • | additional shares of common stock reserved for future grants under the 2012 Plan. |
To the extent that any options or other equity awards are granted in the future and those options or other equity awards are exercised or become vested, new investors will experience further dilution.
48
Table of Contents
SELECTED HISTORICAL CONSOLIDATED FINANCIAL AND OPERATING DATA
The following tables present Restoration Hardware, Inc.’s consolidated financial and operating data as of the dates and for the periods indicated. Restoration Hardware Holdings was formed as a Delaware corporation on August 18, 2011. Restoration Hardware Holdings will acquire all of the outstanding shares of capital stock of Restoration Hardware, Inc. prior to the effectiveness of this offering in connection with the Reorganization, and will therefore control Restoration Hardware, Inc. Restoration Hardware Holdings has not engaged in any business or other activities except in connection with its formation and the Reorganization. Accordingly, all financial and other information herein relating to periods prior to the completion of the Reorganization is that of Restoration Hardware, Inc.
All of the outstanding capital stock of Restoration Hardware, Inc. was acquired on June 16, 2008, by Home Holdings, which we refer to in this prospectus as the “Acquisition.” As a result of the Acquisition, a new basis of accounting was created beginning June 17, 2008. In this prospectus, the periods prior to the Acquisition are referred to as the “Predecessor” periods and the periods after the Acquisition are referred to as the “Successor” periods. The Predecessor periods presented in this prospectus include the period from February 3, 2008 through June 16, 2008, reflecting approximately 19 weeks of operations, and the Successor periods presented in this prospectus include the period from June 17, 2008 through January 31, 2009, reflecting approximately 33 weeks of operations. Due to the Acquisition, the financial statements for the Successor periods are not comparable to those of the Predecessor periods presented in this prospectus.
The selected consolidated financial data as of and for the year ended February 2, 2008, and the periods ended June 16, 2008 and January 31, 2009 and as of January 31, 2009 and January 30, 2010, were derived from Restoration Hardware, Inc.’s consolidated financial statements for such years not included herein. The selected consolidated financial data as of January 29, 2011 and January 28, 2012 and for the fiscal years ended January 30, 2010, January 29, 2011 and January 28, 2012 were derived from Restoration Hardware, Inc.’s consolidated financial statements included elsewhere in this prospectus.
The selected consolidated financial data for the six months ended July 30, 2011, and July 28, 2012, and as of July 28, 2012, were derived from Restoration Hardware, Inc.’s unaudited consolidated interim financial statements included elsewhere in this prospectus. The unaudited consolidated interim financial statements were prepared on a basis consistent with that used in preparing our audited consolidated financial statements and include all adjustments, consisting of normal and recurring items, that we consider necessary for a fair presentation of our financial position and results of operations for the unaudited periods. The unaudited financial information for the twelve months ended July 30, 2011, has been derived by adding our financial information for the year ended January 29, 2011, to the financial information for the six months ended July 30, 2011, and subtracting the financial information for the six months ended July 31, 2010. The unaudited financial information for the twelve months ended July 28, 2012, has been derived by adding our financial information for the year ended January 28, 2012, to the financial information for the six months ended July 28, 2012, and subtracting the financial information for the six months ended July 30, 2011. We believe that presentation of unaudited financial information for these twelve-month periods is useful to investors because it presents information about how our business has performed in the twelve-month period immediately preceding the date of our most recent interim financial statements, which allows investors to review our current performance trends over a full year period, and presenting results for four consecutive quarters compensates for seasonal factors that might influence results in a particular quarter within the year.
Restoration Hardware, Inc.’s historical results are not necessarily indicative of future operating results, and interim results for the six months ended July 28, 2012 are not projections for the results to be expected for the fiscal year ending February 2, 2013. The selected historical consolidated data presented below should be read in conjunction with the sections entitled “Risk Factors” and “Management’s Discussion and Analysis of Financial Condition and Results of Operations” and the consolidated financial statements and the related notes thereto and other financial data included elsewhere in this prospectus.
49
Table of Contents
| Predecessor | Successor | |||||||||||||||||||||||||||||||||||||||||
| Year Ended February 2, 2008 |
Period
from February 3, 2008 Through June 16, 2008 |
Period from June 17, 2008 Through January 31, 2009 |
Year Ended | Six Months Ended |
Last Twelve Months Ended (1) |
|||||||||||||||||||||||||||||||||||||
| January
30, 2010 |
January
29, 2011 |
January
28, 2012 |
July 30, 2011 |
July 28, 2012 |
July 30, 2011 |
July 28, 2012 |
||||||||||||||||||||||||||||||||||||
| (dollars in thousands, excluding per share and per square foot data) | ||||||||||||||||||||||||||||||||||||||||||
| Statement of Operations Data: |
||||||||||||||||||||||||||||||||||||||||||
| Net revenues |
$ | 722,243 | $ | 195,437 | $ | 498,581 | $ | 625,685 | $ | 772,752 | $ | 958,084 | $ | 420,383 | $ | 510,820 | $ | 862,281 | $ | 1,048,521 | ||||||||||||||||||||||
| Cost of goods sold |
490,935 | 140,088 | 308,448 | 412,629 | 501,132 | 601,735 | 265,953 | 321,425 | 553,001 | 657,207 | ||||||||||||||||||||||||||||||||
|
|
|
|
|
|
|
|
|
|
|
|
|
|
|
|
|
|
|
|
|
|||||||||||||||||||||||
| Gross profit |
231,308 | 55,349 | 190,133 | 213,056 | 271,620 | 356,349 | 154,430 | 189,395 | 309,280 | 391,314 | ||||||||||||||||||||||||||||||||
| Selling, general and administrative expenses |
274,454 | 75,396 | 213,011 | 238,889 | 275,859 | 329,753 | 150,619 | 171,729 | 300,025 | 350,863 | ||||||||||||||||||||||||||||||||
|
|
|
|
|
|
|
|
|
|
|
|
|
|
|
|
|
|
|
|
|
|||||||||||||||||||||||
| Income (loss) from operations |
(43,146 | ) | (20,047 | ) | (22,878 | ) | (25,833 | ) | (4,239 | ) | 26,596 | 3,811 | 17,666 | 9,255 | 40,451 | |||||||||||||||||||||||||||
| Interest expense |
(8,663 | ) | (2,731 | ) | (4,907 | ) | (3,241 | ) | (3,150 | ) | (5,134 | ) | (1,888 | ) | (3,054 | ) | (3,459 | ) | (6,300 | ) | ||||||||||||||||||||||
|
|
|
|
|
|
|
|
|
|
|
|
|
|
|
|
|
|
|
|
|
|||||||||||||||||||||||
| Income (loss) before income taxes |
(51,809 | ) | (22,778 | ) | (27,785 | ) | (29,074 | ) | (7,389 | ) | 21,462 | 1,923 | 14,612 | 5,796 | 34,151 | |||||||||||||||||||||||||||
| Income tax expense (benefit) |
127 | 508 | (201 | ) | (423 | ) | 685 | 1,121 | 783 | 623 | 1,427 | 961 | ||||||||||||||||||||||||||||||
|
|
|
|
|
|
|
|
|
|
|
|
|
|
|
|
|
|
|
|
|
|||||||||||||||||||||||
| Net income (loss) |
$ | (51,936 | ) | $ | (23,286 | ) | $ | (27,584 | ) | $ | (28,651 | ) | $ | (8,074 | ) | $ | 20,341 | $ | 1,140 | $ | 13,989 | $ | 4,369 | $ | 33,190 | |||||||||||||||||
|
|
|
|
|
|
|
|
|
|
|
|
|
|
|
|
|
|
|
|
|
|||||||||||||||||||||||
| Net income (loss) per share: |
||||||||||||||||||||||||||||||||||||||||||
| Basic |
$ | (1.34 | ) | $ | (0.60 | ) | $ | (275,840 | ) | $ | (286,510 | ) | $ | (80,740 | ) | $ | 203,410 | $ | 11,400 | $ | 139,890 | $ | 43,690 | $ | 331,900 | |||||||||||||||||
| Diluted |
$ | (1.34 | ) | $ | (0.60 | ) | $ | (275,840 | ) | $ | (286,510 | ) | $ | (80,740 | ) | $ | 203,410 | $ | 11,400 | $ | 139,890 | $ | 43,690 | $ | 331,900 | |||||||||||||||||
| Average number of shares outstanding: |
||||||||||||||||||||||||||||||||||||||||||
| Basic |
38,831,000 | 38,969,000 | 100 | 100 | 100 | 100 | 100 | 100 | 100 | 100 | ||||||||||||||||||||||||||||||||
| Diluted |
38,831,000 | 38,969,000 | 100 | 100 | 100 | 100 | 100 | 100 | 100 | 100 | ||||||||||||||||||||||||||||||||
| Pro forma net income per |
||||||||||||||||||||||||||||||||||||||||||
| Basic |
$ | $ | ||||||||||||||||||||||||||||||||||||||||
| Diluted |
$ | $ | ||||||||||||||||||||||||||||||||||||||||
| Pro forma average number of shares outstanding (2): |
||||||||||||||||||||||||||||||||||||||||||
| Basic |
||||||||||||||||||||||||||||||||||||||||||
| Diluted |
||||||||||||||||||||||||||||||||||||||||||
| Other Financial and Operating Data: |
||||||||||||||||||||||||||||||||||||||||||
| Growth in net revenues: |
(10 | )% | — | — | (6 | )% | 15 | % | 22 | % | 21 | % | 19 | % | 17 | % | 21 | % | ||||||||||||||||||||||||
| Direct |
28 | % | — | — | (15 | )% | 37 | % | 27 | % | 36 | % | 25 | % | 38 | % | 23 | % | ||||||||||||||||||||||||
| Total |
1 | % | — | — | (10 | )% | 24 | % | 24 | % | 27 | % | 22 | % | 26 | % | 22 | % | ||||||||||||||||||||||||
| Retail (4): |
||||||||||||||||||||||||||||||||||||||||||
| Comparable store sales change (5) |
(10 | )% | (12 | )% | (8 | )% | (7 | )% | 19 | % | 25 | % | 20 | % | 29 | % | 17 | % | 29 | % | ||||||||||||||||||||||
| Retail stores open at end of period |
102 | 100 | 99 | 95 | 91 | 74 | 87 | 73 | 87 | 73 | ||||||||||||||||||||||||||||||||
| Average gross square footage (in thousands) (6) |
1,084 | 1,072 | 1,060 | 1,042 | 1,014 | 913 | 946 | 801 | 977 | 841 | ||||||||||||||||||||||||||||||||
| Average selling square footage |
685 | 677 | 671 | 660 | 641 | 580 | 599 | 519 | 619 | 540 | ||||||||||||||||||||||||||||||||
| Retail sales per selling square foot (7) |
$ | 600 | $ | 147 | $ | 406 | $ | 525 | $ | 635 | $ | 846 | $ | 351 | $ | 481 | $ | 710 | $ | 981 | ||||||||||||||||||||||
| Direct: |
||||||||||||||||||||||||||||||||||||||||||
| Catalogs circulated |
57,501 | 13,771 | 26,831 | 31,336 | 46,507 | 26,052 | 12,723 | 15,131 | 40,355 | 28,460 | ||||||||||||||||||||||||||||||||
| Catalog pages circulated (in millions) (8) |
8,636 | 2,168 | 3,507 | 4,418 | 6,260 | 8,848 | 3,289 | 7,417 | 6,726 | 12,975 | ||||||||||||||||||||||||||||||||
| Direct as a percentage of net revenues (9) |
38 | % | 43 | % | 41 | % | 39 | % | 43 | % | 44 | % | 45 | % | 46 | % | 45 | % | 45 | % | ||||||||||||||||||||||
| Capital expenditures |
$ | 13,282 | $ | 3,821 | $ | 13,428 | $ | 2,024 | $ | 39,907 | $ | 25,593 | $ | 12,168 | $ | 13,517 | $ | 37,894 | $ | 26,942 | ||||||||||||||||||||||
| Adjusted EBITDA (10) |
$ | (4,033 | ) | $ | (8,219 | ) | $ | 4,386 | $ | 17,596 | $ | 41,097 | $ | 80,154 | $ | 27,747 | $ | 34,897 | $ | 59,850 | $ | 87,304 | ||||||||||||||||||||
50
Table of Contents
| Predecessor | Successor | |||||||||||||||||||||||||
| February 2, 2008 |
January 31, 2009 |
January 30, 2010 |
January 29, 2011 |
January 28, 2012 |
July 28, 2012 |
|||||||||||||||||||||
| (in thousands) | ||||||||||||||||||||||||||
| Balance Sheet Data: |
||||||||||||||||||||||||||
| Cash and cash equivalents |
$ | 1,229 | $ | 8,603 | $ | 13,186 | $ | 13,364 | $ | 8,511 | $ | 10,102 | ||||||||||||||
| Working capital (excluding cash and cash equivalents) (11) |
103,734 | 102,850 | 57,058 | 103,894 | 156,505 | 192,252 | ||||||||||||||||||||
| Total assets |
342,546 | 494,773 | 431,528 | 501,991 | 586,809 | 650,874 | ||||||||||||||||||||
| Line of credit |
78,367 | 110,696 | 57,442 | 111,837 | 107,502 | 129,637 | ||||||||||||||||||||
| Term loan |
— | — | — | — | 14,798 | 14,815 | ||||||||||||||||||||
| Total debt (including current portion) (12) |
110,774 | 117,515 | 61,652 | 116,995 | 131,040 | 151,089 | ||||||||||||||||||||
| Total stockholders’ equity |
43,830 | 238,670 | 221,079 | 215,804 | 250,462 | 265,123 | ||||||||||||||||||||
| (1) | The unaudited financial information for the twelve months ended July 30, 2011, has been derived by adding our financial information for the year ended January 29, 2011, to the financial information for the six months ended July 30, 2011, and subtracting the financial information for the six months ended July 31, 2010. The unaudited financial information for the twelve months ended July 28, 2012, has been derived by adding our financial information for the year ended January 28, 2012, to the financial information for the six months ended July 28, 2012, and subtracting the financial information for the six months ended July 30, 2011. |
| (2) | Pro forma net income (loss) per share gives effect to (i) the Reorganization, (ii) the issuance of shares of common stock in this offering and (iii) the application of $ million of the estimated net proceeds from the sale of common stock by us in this offering to repay a portion of the outstanding amounts under Restoration Hardware, Inc.’s revolving line of credit and term loan as if the offering and those transactions had occurred on January 30, 2011. This assumes net proceeds of this offering of $ million, assuming the shares are offered at $ per share, the midpoint of the estimated price range set forth on the cover of this prospectus, after deducting the underwriting discount and estimated offering expenses. |
| (3) | Store data represent retail stores plus outlet stores. |
| (4) | Retail data have been calculated based upon retail stores, including our Baby & Child stores, and exclude outlet stores. |
| (5) | Comparable store sales have been calculated based upon retail stores that were open at least fourteen full months as of the end of the reporting period and did not change square footage by more than 20% between periods. Comparable store net revenues exclude revenues from outlet stores. |
| (6) | Average square footage (gross or selling, as applicable) is calculated for each quarter by taking the total applicable square footage at the beginning of the quarter plus the total applicable square footage at the end of the quarter and dividing by two. Average square footage for periods of six, nine and twelve months is calculated by averaging the average square footage for the quarters within such periods. |
| Average square footage (gross or selling, as applicable) for the 2008 Predecessor period is calculated by adding the average applicable square footage for the first quarter of the year ended January 31, 2009, and for the period May 4, 2008, through June 16, 2008, and dividing by two. Average square footage (gross or selling, as applicable) for the period May 4, 2008, through June 16, 2008, is calculated by taking the total applicable square footage at the beginning of the period plus the total applicable square footage at the end of the period and dividing by two. |
| Average square footage (gross or selling, as applicable) for the 2008 Successor period is calculated by adding the average square footage for three periods, being the period June 17, 2008, through August 2, 2008, the third quarter of the year ending January 31, 2009, and the fourth quarter of the year ended January 31, 2009, and dividing by three. Average square footage (gross or selling, as applicable) for the period June 17, 2008, through August 2, 2008, is calculated by taking the total applicable square footage at the beginning of the period plus the total applicable square footage at the end of the period and dividing by two. |
| (7) | Retail sales per selling square foot is calculated by dividing total net revenues for all retail stores, comparable and non-comparable, by the average selling square footage for the period. |
51
Table of Contents
| (8) | The catalogs and catalog pages circulated from period to period do not take into account different page sizes per catalog distributed. Page sizes and page counts vary for different catalog mailings and we sometimes mail different versions of a catalog at the same time. Accordingly, period to period comparisons of catalogs circulated and catalog pages circulated do not take these variations into account. In fiscal 2010, we mailed a larger number of catalogs that contained fewer pages and in some cases significantly smaller page sizes than in prior periods. In fiscal 2011, we mailed fewer catalogs that contained a significant increase in number of pages as compared to fiscal 2010. |
| (9) | Direct revenues include sales through our catalogs and websites. |
| (10) | EBITDA and Adjusted EBITDA have been presented in this prospectus and are supplemental measures of financial performance that are not required by, or presented in accordance with, GAAP. We define EBITDA as consolidated net income (loss) before depreciation and amortization, interest expense and provision for income taxes. Adjusted EBITDA is calculated in accordance with and is the basis of our Management Incentive Program (or “MIP”), which is our cash based-incentive compensation program designed to motivate and reward annual performance for eligible employees, and reflects further adjustments to EBITDA to eliminate the impact of certain items, including non-cash or other items that we do not consider representative of our ongoing operating performance as discussed further below. |
| EBITDA and Adjusted EBITDA are included in this prospectus because they are key metrics used by management, our board of directors, and our Principal Equity Holders to assess our financial performance, and Adjusted EBITDA is used in connection with determining incentive compensation under our MIP. Additionally, EBITDA is frequently used by analysts, investors and other interested parties to evaluate companies in our industry. We use EBITDA and Adjusted EBITDA, alongside other GAAP measures such as gross profit, operating income (loss) and net income (loss), to measure profitability, as a key profitability target in our annual and other budgets, and to compare our performance against that of peer companies. We believe that Adjusted EBITDA provides useful information facilitating operating performance comparisons from period to period and company to company. |
| EBITDA and Adjusted EBITDA are not GAAP measures of our financial performance or liquidity and should not be considered as alternatives to net income (loss) as a measure of financial performance, cash flows from operating activities as a measure of liquidity, or any other performance measure derived in accordance with GAAP and they should not be construed as an inference that our future results will be unaffected by unusual or non-recurring items. Additionally, EBITDA and Adjusted EBITDA are not intended to be measures of free cash flow for management’s discretionary use, as they do not consider certain cash requirements such as tax payments and debt service requirements and certain other cash costs that may recur in the future. EBITDA and Adjusted EBITDA contain certain other limitations, including the failure to reflect our cash expenditures, cash requirements for working capital needs and cash costs to replace assets being depreciated and amortized, and exclude certain unusual charges that are not expected to recur in the future. In evaluating Adjusted EBITDA, you should be aware that in the future we may incur expenses that are the same as or similar to some of the adjustments in this presentation. Our presentation of Adjusted EBITDA should not be construed to imply that our future results will be unaffected by any such adjustments. Management compensates for these limitations by relying primarily on our GAAP results and by using EBITDA and Adjusted EBITDA only supplementally. Our measures of EBITDA and Adjusted EBITDA are not necessarily comparable to other similarly titled captions of other companies due to different methods of calculation. |
52
Table of Contents
A reconciliation of net income (loss) to EBITDA and Adjusted EBITDA is set forth below:
| Predecessor (a) | Successor | |||||||||||||||||||||||||||||||||||||||||
| Year Ended February 2, 2008 |
Period from February 3, 2008 Through June 16, 2008 |
Period from June 17, 2008 Through January 31, 2009 |
Year Ended | Six Months Ended |
Last
Twelve Months Ended |
|||||||||||||||||||||||||||||||||||||
| January
30, 2010 |
January
29, 2011 |
January
28, 2012 |
July
30, 2011 |
July
28, 2012 |
July
30, 2011 |
July
28, 2012 |
||||||||||||||||||||||||||||||||||||
| (in thousands) | ||||||||||||||||||||||||||||||||||||||||||
| Net income (loss) |
$ | (51,936 | ) | $ | (23,286 | ) | $ | (27,584 | ) | $ | (28,651 | ) | $ | (8,074 | ) | $ | 20,341 | $ | 1,140 | $ | 13,989 | $ | 4,369 | $ | 33,190 | |||||||||||||||||
| Depreciation and amortization |
23,120 | 7,934 | 50,222 | 43,065 | 31,263 | 29,186 | 14,983 | 12,892 | 32,499 | 27,095 | ||||||||||||||||||||||||||||||||
| Interest expense |
8,663 | 2,731 | 4,907 | 3,241 | 3,150 | 5,134 | 1,888 | 3,054 | 3,459 | 6,300 | ||||||||||||||||||||||||||||||||
| Income tax expense (benefit) |
127 | 508 | (201 | ) | (423 | ) | 685 | 1,121 | 783 | 623 | 1,427 | 961 | ||||||||||||||||||||||||||||||
|
|
|
|
|
|
|
|
|
|
|
|
|
|
|
|
|
|
|
|
|
|||||||||||||||||||||||
| EBITDA |
(20,026 | ) | (12,113 | ) | 27,344 | 17,232 | 27,024 | 55,782 | 18,794 | 30,558 | 41,754 | 67,456 | ||||||||||||||||||||||||||||||
| Management and board fees (b) |
517 | 91 | 1,985 | 4,620 | 4,793 | 10,715 | 2,396 | 2,087 | 4,715 | 10,406 | ||||||||||||||||||||||||||||||||
| Non-cash compensation (c) |
2,706 | 2,319 | — | 592 | 2,142 | 8,154 | 1,100 | 637 | 1,987 | 7,691 | ||||||||||||||||||||||||||||||||
| Terminated operations (d) |
6,800 | 884 | 3,821 | 2,604 | 352 | 1,580 | 1,666 | — | 1,599 | (86 | ) | |||||||||||||||||||||||||||||||
| Severance and other transaction |
886 | 600 | 368 | 1,521 | 1,797 | 621 | 28 | — | 1,324 | 593 | ||||||||||||||||||||||||||||||||
| Impairment of long-lived |
5,084 | — | 3,868 | 2,304 | 2,115 | — | — | — | 2,115 | — | ||||||||||||||||||||||||||||||||
| Lease termination costs (g) |
— | — | — | — | — | 3,110 | 3,571 | (386 | ) | 3,571 | (847 | ) | ||||||||||||||||||||||||||||||
| Amortization of inventory fair value adjustment (h) |
— | — | (35,075 | ) | (12,780 | ) | — | — | — | — | — | — | ||||||||||||||||||||||||||||||
| Non-capitalized IPO costs (i) |
— | — | — | — | 2,351 | — | — | — | 2,351 | — | ||||||||||||||||||||||||||||||||
| Special committee investigation and remediation (j) |
— | — | — | — | — | — | — | 1,989 | — | 1,989 | ||||||||||||||||||||||||||||||||
| Other adjustments allowable under our agreements with our stockholders (k) |
— | — | 2,075 | 1,503 | 523 | 192 | 192 | 12 | 434 | 12 | ||||||||||||||||||||||||||||||||
|
|
|
|
|
|
|
|
|
|
|
|
|
|
|
|
|
|
|
|
|
|||||||||||||||||||||||
| Adjusted EBITDA |
$ | (4,033 | ) | $ | (8,219 | ) | $ | 4,386 | $ | 17,596 | $ | 41,097 | $ | 80,154 | $ | 27,747 | $ | 34,897 | $ | 59,850 | $ | 87,304 | ||||||||||||||||||||
|
|
|
|
|
|
|
|
|
|
|
|
|
|
|
|
|
|
|
|
|
|||||||||||||||||||||||
| (a) | We have presented Adjusted EBITDA for the Predecessor periods consistently with the Successor periods to present information on a comparable basis for those periods. |
| (b) | Includes fees paid in accordance with our management services agreement with Home Holdings in the Successor periods, as well as fees and expense reimbursements paid to our board of directors in both the Predecessor and Successor periods. |
| (c) | Represents non-cash charges related to stock-based compensation programs. Fiscal 2011 includes a $6.4 million compensation charge related to the repayment of loans owed to Home Holdings by Gary Friedman, through the reclassification by Home Holdings of Mr. Friedman’s Class A and Class A-1 ownership units into an equal number of Class A Prime and Class A-1 Prime ownership units. Mr. Friedman served as our Chairman and Co-Chief Executive Officer at the time of such loan repayment. |
| (d) | Includes the impact of divesting our Brocade Home brand, closing four temporary clearance centers operated from October 2008 to March 2010, costs related to closing of The Michaels Furniture Company and costs related to the restructuring of our Shanghai office location. |
| (e) | Amounts in the 2008 Predecessor period and the 2008 Successor period include severance costs, and transaction costs associated with our Acquisition by Home Holdings. Amounts in fiscal 2009, fiscal 2010, and fiscal 2011 generally include executive severance and other related costs. |
| (f) | Includes costs related to impairment of long-lived assets related to our retail store operations. |
| (g) | Includes lease termination costs for retail stores that were closed prior to their respective lease termination dates. The amount in the first six months of fiscal 2012 relates to changes in estimates regarding liabilities for future lease payments for closed stores. |
| (h) | Represents non-cash impact of amortizing the net fair value adjustment to inventory recorded in connection with the purchase price allocation for the Acquisition over the period of the inventory turn. |
| (i) | Represents costs related to our efforts to pursue an initial public offering. |
| (j) | Represents legal and other professional fees, incurred in connection with the investigation conducted by the special committee of the board of directors (as described in “Risk Factors —Our former Chairman and Co-Chief Executive Officer, Gary Friedman, resigned from these positions and as a director of the Company effective as of , 2012. There can be no assurance that these developments will not have an adverse impact on us.”), and our subsequent remedial actions. |
| (k) | Represents items which management believes are not indicative of our ongoing operating performance. The 2008 Successor period includes consulting fees related to organizational matters following the Acquisition. Fiscal 2009 includes one-time start-up costs associated with Baby & Child and occupancy costs for corporate office space exited by us as part of the Acquisition. Fiscal 2010 and fiscal 2011 include consulting fees related to organizational matters and state franchise tax amounts. All periods include foreign exchange gains and losses. |
| (11) | Working capital is defined as current assets, excluding cash and cash equivalents, less current liabilities, excluding the current portion of long-term debt. |
| (12) | Total debt (including current portion) includes the revolving line of credit, term loan, and capital lease obligations. |
53
Table of Contents
MANAGEMENT’S DISCUSSION AND ANALYSIS OF
FINANCIAL CONDITION AND RESULTS OF OPERATIONS
Overview
We believe RH is one of the fastest growing and most innovative luxury brands in the home furnishings marketplace. Our collections of timeless, updated classics and reproductions are presented consistently across our sales channels in sophisticated and unique lifestyle settings that we believe are on par with world-class interior designers. We offer dominant merchandise assortments across a growing number of categories, including furniture, lighting, textiles, bathware, décor, outdoor, garden, and baby and child products. Our business is fully integrated across our multiple channels of distribution, consisting of our stores, catalogs and websites. We position our stores as showrooms for our brand, while our catalogs and websites act as virtual extensions of our stores. As of July 28, 2012, we operated 71 Galleries, 2 full line Design Galleries and 10 outlet stores throughout the United States and Canada. In fiscal 2011, we distributed approximately 26.1 million catalogs, and our websites logged over 14.3 million unique visits.
In 2001, we began to reposition Restoration Hardware from a nostalgic, discovery-items business to a leading home furnishings brand. In 2008, we were taken private by investment funds affiliated with Catterton, Tower Three and Glenhill. As a private company, we were able to accelerate the transformation of our business and brand and the development of our multi-channel business model and infrastructure. Over the last eleven years, we have built a new company as we:
| • | Elevated our brand positioning; |
| • | Enhanced our product development process; |
| • | Refined our go-to-market strategy; |
| • | Reconceptualized our stores and developed our full line Design Gallery format; |
| • | Built a new supply chain and systems infrastructure; and |
| • | Strengthened our management team. |
Over the last several years, we achieved strong growth in sales and profitability, as illustrated by the following:
| • | From fiscal 2009 to fiscal 2011, we increased our net revenues 53% to $958.1 million, our Adjusted EBITDA 356% to $80.2 million and our Adjusted EBITDA margin by 555 basis points to 8.4%. Over the same time period, we increased our net income by $49.0 million from a net loss of $28.7 million to net income of $20.3 million; and |
| • | We achieved ten consecutive quarters of double-digit net revenue growth through our fiscal quarter ended July 28, 2012. We achieved this growth as we contracted our store base from 95 retail locations as of January 30, 2010, to 73 locations as of July 28, 2012. |
Factors Affecting Our Operating Results
Various factors affected our results for the periods presented in this “Management’s Discussion and Analysis of Financial Condition and Results of Operations” including the following:
Overall Economic Trends. The industry in which we operate is cyclical, and consequently our revenues are affected by general economic conditions. For example, reduced consumer confidence and lower availability and higher cost of consumer credit reduces demand for our products and limits our ability to increase prices or sustain price increases. We expect that some of the economic factors that have been in place for the last several years, including the continuing economic uncertainty (particularly in the housing market in the United States) may
54
Table of Contents
continue in future periods. Based on our research, we believe that the domestic housewares and home furnishings market is anticipated to grow at a compound annual growth rate of 3 – 4% between 2011 and 2015. However, there can be no assurance that the market will grow at this rate. The growth rate of the market could be affected by macroeconomic conditions in the United States. Although we believe our annual net revenues currently represent less than 1% of the domestic housewares and home furnishings market and therefore we have opportunities to grow market share in future periods, slower rates of growth could negatively impact our results. For more information, see “Risk Factors—Changes in consumer spending or the housing market may significantly harm our revenue and results of operations.”
Our Strategic Initiatives. We are in the process of implementing a number of significant business initiatives that have had and will continue to have an impact on our results of operations, including the development of new larger full line Design Galleries in a number of new locations, the optimization of our store sizes to better fit anticipated demand in a given market, the expansion of our product categories and services and changes in the ways in which we market with our catalogs. Although these initiatives are designed to create growth in our business and continuing improvement in our operating results, the timing of expenditures related to these initiatives, as well as the achievement of returns on our investments, may affect our results of operation in future periods, and we may not achieve the desired benefits. Opening full line Design Galleries will require significant capital expenditures, and retail store closures may lead to charges including lease termination and other exit costs. These changes could affect our results of operation in future periods. In addition, the investments required to continue our strategic initiatives may have a negative impact on cash flows in future periods and could create pressure on our liquidity if we do not achieve the desired results from these initiatives in a timely manner. We expect that we will continue to incur significant capital expenditures as part of our initiative to open more full line Design Galleries over the next several years, and that these expenditures will have an impact on our cash flows during this time. For fiscal 2011, we incurred total capital expenditures of $25.6 million and we anticipate our capital expenditure requirements to be approximately $65 million for fiscal 2012, of which $13.5 million was spent during the first six months of fiscal 2012.
Consumer Preferences and Demand. Our ability to maintain our appeal to existing customers and attract new customers depends on our ability to originate, develop and offer a compelling product assortment responsive to customer preferences and design trends. We have successfully introduced a large number of new products during recent periods, which we believe has been a contributing factor in our sales and operating results. Periods in which our products have achieved strong customer acceptance generally have had more favorable results. If we misjudge the market for our products, we may be faced with excess inventories for some products and may be required to become more promotional in our selling activities, which would impact our net revenues and gross profit.
Our Ability to Source and Distribute Products Effectively. Our net revenue and gross profits are affected by our ability to purchase our merchandise in sufficient quantities at competitive prices. While we believe our vendors have adequate capacity to meet our current and anticipated demand, our level of net revenues have been adversely affected in prior periods by constraints in our supply chain, including the inability of our vendors to produce sufficient quantities of some merchandise in a manner that was able to match market demand from our customers, leading to higher levels of customer back orders and lost sales.
Seasonality. Our business is seasonal. As a result, our net revenues fluctuate from quarter to quarter, which often affects the comparability of our results between periods. Net revenues are historically higher in the second and fourth fiscal quarters due primarily to the impact of the outdoor selling season and the holiday selling season, respectively. Cash requirements are typically higher in the first and third quarters due to inventory-related working capital requirements for the outdoor and holiday selling periods. See “Risk Factors—Our operating results are subject to quarterly and seasonal fluctuations, and results for any quarter may not necessarily be indicative of the results that may be achieved for the full fiscal year.”
How We Assess the Performance of Our Business
In assessing the performance of our business, we consider a variety of financial and operating measures that affect our operating results. The key measure for determining how our business is performing is Adjusted
55
Table of Contents
EBITDA. Additionally, we review other important metrics such as net revenues, gross profit, gross margin, net income (loss), comparable store sales, selling, general and administrative expenses, catalogs circulated and circulated catalog pages.
Adjusted EBITDA. We believe that Adjusted EBITDA is a superior measure of operating performance, as it provides a clearer picture of operating results by eliminating expenses that are not reflective of underlying business performance. We use Adjusted EBITDA to facilitate a comparison of our operating performance on a consistent basis from period-to-period and to provide for a more complete understanding of factors and trends affecting our business. We also use Adjusted EBITDA as one of the primary methods for planning and forecasting overall expected performance and for evaluating on a quarterly and annual basis actual results against such expectations, and as the basis of our Management Incentive Program (or “MIP”).
We define Adjusted EBITDA as consolidated net income (loss) before depreciation and amortization, interest expense and provision for income taxes, adjusted for the impact of certain items, including non-cash and other items we do not consider representative of our ongoing operating performance such as unusual charges that are not expected to recur in the future. Because Adjusted EBITDA omits non-cash items, we feel that it is less susceptible to variances in actual performance resulting from depreciation, amortization and other non-cash charges and is more reflective of other factors that affect our operating performance. Because it omits the other items, we believe Adjusted EBITDA is also more reflective of our on-going operating performance.
Net Revenues. Net revenues reflect our sale of merchandise plus shipping and handling revenue collected from our customers, less returns and discounts. Revenues are recognized upon receipt of product by our customers.
Comparable Store Sales. Comparable store sales have been calculated based upon retail stores that were open at least fourteen full months as of the end of the reporting period. A store is not considered a part of the comparable store sales base if the square footage of the store changed by more than 20% between periods due to remodeling or relocation activities. If a store is closed for seven days during a month, that month will be excluded from comparable store sales. Outlet stores are not included in calculations of comparable store sales.
Comparable store sales allow us to evaluate how our retail store base is performing by measuring the change in period-over-period net revenues in stores that have been open for fourteen months or more. While we review comparable store sales as one measure of our performance, this measure is less relevant to us than it may be to other retailers due to our fully integrated, multi-channel, go-to-market strategy, which makes measures that analyze one of our channels in isolation less indicative of the performance of our business than it might be for other companies that operate their distribution channels as separate businesses. In addition to comparable store sales, we also review retail sales per selling square foot, among other metrics, to evaluate the performance of individual stores.
Selling Square Footage. Selling square footage is retail space at our stores used to sell our products. Selling square footage excludes backrooms at retail stores used for storage, office space or similar matters. Selling square footage may include exterior sales space located outside a store, such as courtyards, gardens and rooftops.
Retail Sales Per Selling Square Foot. Retail sales per selling square foot is calculated by dividing total net revenues for all retail stores, comparable and non-comparable, by the average selling square footage for the period. Sales per square foot for interior sales space may be significantly higher than sales per square foot for exterior sales space, as products are generally presented more densely within our stores.
Gross Profit. Gross profit is equal to our net revenues less cost of goods sold. Gross profit as a percentage of our net revenues is referred to as gross margin. Cost of goods sold include the direct cost of purchased merchandise; inventory shrinkage; inventory adjustments due to obsolescence, including excess and slow-moving inventory and lower of cost or market reserves; inbound freight; all freight costs to get merchandise to
56
Table of Contents
our stores; design, buying and allocation costs; occupancy costs related to store operations, such as rent and common area maintenance; depreciation and amortization of leasehold improvements, equipment and other assets in our stores and distribution centers; and all logistics costs associated with shipping product to our customers, which are only partially offset by shipping income collected from customers. We expect gross profit to increase to the extent that we successfully grow our net revenues and leverage the fixed portion of cost of goods sold.
Our gross profit can be favorably impacted by sales volume increases, as occupancy and certain other costs that are largely fixed do not necessarily increase proportionally with volume increases. Changes in the mix of our products may also impact our gross profit. We review our inventory levels on an ongoing basis in order to identify slow-moving merchandise and use product markdowns and our outlet stores to efficiently sell these products. The timing and level of markdowns are driven primarily by customer acceptance of our merchandise. The primary drivers of the costs of individual goods are raw materials costs, which fluctuate based on a number of factors beyond our control, including commodity prices, changes in supply and demand, general economic conditions, competition, import duties, tariffs and government regulation, logistics costs (which may increase in the event of, for example, interruptions in the operation of our distribution centers, furniture home delivery hubs and customer care center or damage or interruption to our information systems) and labor costs in the countries where we source our merchandise. We place orders with merchandise vendors primarily in United States dollars and, as a result, are not exposed to significant foreign currency exchange risk.
Our gross profit may not be comparable to other specialty retailers, as some companies may not include all or a portion of the costs related to their distribution network and store occupancy in calculating gross profit as we and many other retailers do, but instead may include them in selling, general and administrative expenses.
Selling, General and Administrative Expenses. Selling, general and administrative expenses include all operating costs not included in cost of goods sold. These expenses include all payroll and payroll-related expenses, store expenses other than occupancy and expenses related to many of our operations at our headquarters, including utilities, depreciation and amortization and marketing expense, which primarily includes catalog production, mailing and print advertising costs. Selling, general and administrative expenses as a percentage of net revenues is usually higher in lower-volume quarters and lower in higher-volume quarters because a significant portion of the costs are relatively fixed.
Our recent revenue growth has been accompanied by increased selling, general and administrative expenses. The most significant components of these increases are marketing and payroll costs. We expect these expenses to continue to increase as we continue to open new stores, develop new product categories and otherwise grow our business.
Other Factors Affecting Our Results
Other important factors that affected our results for the periods presented in this “Management’s Discussion and Analysis of Financial Condition and Results of Operations” are as follows:
Purchase Accounting Impact of the Acquisition. All of the outstanding capital stock of Restoration Hardware, Inc. was acquired on June 16, 2008, by Home Holdings (which we refer to as the Acquisition) through a transaction that was accounted for under Statement of Financial Accounting Standards 141, “Business Combinations.” The purchase price was allocated to state our assets and liabilities at fair value, which took into account work performed by an independent third-party valuation firm. The allocation of the purchase price had the net effect of reducing the carrying amount of inventory by $47.9 million, increasing property and equipment by $17.6 million and increasing amortizable intangible assets by $55.7 million. The $47.9 million decrease in inventory value was due to the prevailing adverse economic situation at the date of the Acquisition and the application of a market participant approach to the valuation of inventory on hand. Such decrease was amortized to cost of goods sold over approximately nine months and resulted in increased gross profit during fiscal 2009.
57
Table of Contents
We are depreciating the $17.6 million increase in property and equipment over the useful life of each asset, which has had the effect of reducing gross profit and increasing selling, general and administrative expenses subsequent to the Acquisition. The $55.7 million increase in amortizable intangible assets is being amortized over the remaining life of each asset and has had the effect of reducing gross profit and increasing selling, general and administrative expenses subsequent to the Acquisition. We also recorded intangible assets with an indefinite life, which consisted of goodwill and trademarks, at their fair values of $122.3 million and $47.1 million, respectively.
The following table summarizes the financial impact of purchase accounting adjustments on gross profit and selling, general and administrative expenses in dollars, and as a percentage of net revenues, in fiscal 2009, fiscal 2010 and fiscal 2011, and in the first six months of fiscal 2011 and fiscal 2012:
| Year Ended | Six Months Ended | |||||||||||||||||||||||||||||||||||||||
| January 30, 2010 |
January 29, 2011 |
January 28, 2012 |
July 30, 2011 |
July 28, 2012 |
||||||||||||||||||||||||||||||||||||
| (dollars in thousands) | ||||||||||||||||||||||||||||||||||||||||
| Net revenues |
$ | 625,685 | 100 | % | $ | 772,752 | 100 | % | $ | 958,084 | 100 | % | $ | 420,383 | 100 | % | $ | 510,820 | 100 | % | ||||||||||||||||||||
|
|
|
|
|
|
|
|
|
|
|
|
|
|
|
|
|
|
|
|
|
|||||||||||||||||||||
| Gross profit increase (decrease) |
||||||||||||||||||||||||||||||||||||||||
| Amortization of inventory fair value adjustment |
$ | 12,780 | 2.0 | % | $ | — | — | % | $ | — | — | % | $ | — | — | % | $ | — | — | % | ||||||||||||||||||||
| Depreciation related to step up of property and equipment |
(5,427 | ) | (0.9 | )% | (3,076 | ) | (0.4 | )% | (1,783 | ) | (0.2 | )% | (984 | ) | (0.2 | )% | (628 | ) | (0.1 | )% | ||||||||||||||||||||
| Amortization of intangible related to net fair value of leases |
(2,899 | ) | (0.3 | )% | (1,975 | ) | (0.3 | )% | (1,507 | ) | (0.1 | )% | (857 | ) | (0.2 | )% | (454 | ) | (0.1 | )% | ||||||||||||||||||||
|
|
|
|
|
|
|
|
|
|
|
|
|
|
|
|
|
|
|
|
|
|||||||||||||||||||||
| $ | 4,454 | 0.8 | % | $ | (5,051 | ) | (0.7 | )% | $ | (3,290 | ) | (0.3 | )% | $ | (1,841 | ) | (0.4 | )% | $ | (1,082 | ) | (0.2 | )% | |||||||||||||||||
|
|
|
|
|
|
|
|
|
|
|
|
|
|
|
|
|
|
|
|
|
|||||||||||||||||||||
| Selling general and administrative increase (decrease) |
||||||||||||||||||||||||||||||||||||||||
| Amortization of intangible related to customer relationships |
$ | 12,500 | 2.0 | % | $ | — | — | % | $ | — | — | % | $ | — | — | % | $ | — | — | % | ||||||||||||||||||||
| Amortization of intangible related to core technologies |
1,316 | 0.2 | % | 1,316 | 0.2 | % | 1,316 | 0.1 | % | 658 | 0.2 | % | 658 | 0.1 | % | |||||||||||||||||||||||||
| Depreciation related to step up of property and equipment |
451 | 0.1 | % | 150 | — | % | — | — | % | — | — | % | — | — | % | |||||||||||||||||||||||||
| Amortization of intangible related to net fair value of leases |
465 | 0.1 | % | 140 | — | % | (21 | ) | — | % | (11 | ) | — | % | (9 | ) | — | % | ||||||||||||||||||||||
|
|
|
|
|
|
|
|
|
|
|
|
|
|
|
|
|
|
|
|
|
|||||||||||||||||||||
| $ | 14,732 | 2.4 | % | $ | 1,606 | 0.2 | % | $ | 1,295 | 0.1 | % | $ | 647 | 0.2 | % | $ | 649 | 0.1 | % | |||||||||||||||||||||
|
|
|
|
|
|
|
|
|
|
|
|
|
|
|
|
|
|
|
|
|
|||||||||||||||||||||
Public Company Costs. In connection with our initial public offering, we will incur additional legal, accounting and other expenses that we did not incur as a private company, including costs associated with public company reporting and corporate governance requirements. These requirements include compliance with the Sarbanes-Oxley Act and other rules implemented by the SEC, and applicable stock exchange rules. We expect these rules and regulations to substantially increase our legal and financial compliance costs and to make certain financial reporting and other activities more time-consuming and costly, although we are currently unable to estimate these costs with any degree of certainty.
58
Table of Contents
Basis of Presentation and Results of Operations
The following discussion contains references to fiscal years 2009, 2010 and 2011, which represent our fiscal years ended January 30, 2010, January 29, 2011, and January 28, 2012, respectively. Our fiscal year ends on the Saturday closest to January 31. Fiscal years 2009, 2010 and 2011 were 52-week periods. The first six months of fiscal 2011 and fiscal 2012 were 26-week periods.
Prior to the completion of this offering, all of the outstanding shares of capital stock of Restoration Hardware, Inc., will be contributed by Home Holdings to Restoration Hardware Holdings, Inc. as a capital contribution. Outstanding units under the Team Resto Ownership Plan will be converted in connection with this offering into shares of common stock.
| Year Ended | Six Months Ended | |||||||||||||||||||
| January 30, 2010 |
January 29, 2011 |
January 28, 2012 |
July 30, 2011 |
July 28, 2012 |
||||||||||||||||
| (dollars in thousands, excluding per square foot store data) | ||||||||||||||||||||
| Statement of Operations Data: |
||||||||||||||||||||
| Net revenues |
$ | 625,685 | $ | 772,752 | $ | 958,084 | $ | 420,383 | $ | 510,820 | ||||||||||
| Cost of goods sold |
412,629 | 501,132 | 601,735 | 265,953 | 321,425 | |||||||||||||||
|
|
|
|
|
|
|
|
|
|
|
|||||||||||
| Gross profit |
213,056 | 271,620 | 356,349 | 154,430 | 189,395 | |||||||||||||||
| Selling, general and administrative expenses |
238,889 | 275,859 | 329,753 | 150,619 | 171,729 | |||||||||||||||
|
|
|
|
|
|
|
|
|
|
|
|||||||||||
| Income (loss) from operations |
(25,833 | ) | (4,239 | ) | 26,596 | 3,811 | 17,666 | |||||||||||||
| Interest expense |
(3,241 | ) | (3,150 | ) | (5,134 | ) | (1,888 | ) | (3,054 | ) | ||||||||||
|
|
|
|
|
|
|
|
|
|
|
|||||||||||
| Income (loss) before income taxes |
(29,074 | ) | (7,389 | ) | 21,462 | 1,923 | 14,612 | |||||||||||||
| Income tax expense (benefit) |
(423 | ) | 685 | 1,121 | 783 | 623 | ||||||||||||||
|
|
|
|
|
|
|
|
|
|
|
|||||||||||
| Net income (loss) |
$ | (28,651 | ) | $ | (8,074 | ) | $ | 20,341 | $ | 1,140 | $ | 13,989 | ||||||||
|
|
|
|
|
|
|
|
|
|
|
|||||||||||
| Other Financial and Operating Data: |
||||||||||||||||||||
| Growth in net revenues: |
||||||||||||||||||||
| Stores (1) |
(6 | )% | 15 | % | 22 | % | 21 | % | 19 | % | ||||||||||
| Direct |
(15 | )% | 37 | % | 27 | % | 36 | % | 25 | % | ||||||||||
| Total |
(10 | )% | 24 | % | 24 | % | 27 | % | 22 | % | ||||||||||
| Retail (2): |
||||||||||||||||||||
| Comparable store sales change (3) |
(7 | )% | 19 | % | 25 | % | 20 | % | 29 | % | ||||||||||
| Retail stores open at beginning of period |
99 | 95 | 91 | 91 | 74 | |||||||||||||||
| Stores opened |
— | 4 | 5 | 3 | 2 | |||||||||||||||
| Stores closed |
4 | 8 | 22 | 7 | 3 | |||||||||||||||
| Retail stores open at end of period |
95 | 91 | 74 | 87 | 73 | |||||||||||||||
| Average gross square footage (in thousands) (4) |
1,042 | 1,014 | 913 | 946 | 801 | |||||||||||||||
| Average selling square footage (in thousands) (4) |
660 | 641 | 580 | 599 | 519 | |||||||||||||||
| Retail sales per selling square foot (5) |
$ | 525 | $ | 635 | $ | 846 | $ | 351 | $ | 481 | ||||||||||
| Direct: |
||||||||||||||||||||
| Catalogs circulated (in thousands) (6) |
31,336 | 46,507 | 26,052 | 12,723 | 15,131 | |||||||||||||||
| Catalog pages circulated (in millions) (6) |
4,418 | 6,260 | 8,848 | 3,289 | 7,417 | |||||||||||||||
| Direct as a percentage of net revenues (7) |
39 | % | 43 | % | 44 | % | 45 | % | 46 | % | ||||||||||
| Capital expenditures |
$ | 2,024 | $ | 39,907 | $ | 25,593 | $ | 12,168 | $ | 13,517 | ||||||||||
| (1) | Store data represent retail stores plus outlet stores. Net revenues for outlet stores were $34.7 million in fiscal 2009, $31.2 million in fiscal 2010 and $43.9 million in fiscal 2011. In the first six months of fiscal 2011 and 2012, net revenues for outlet stores were $20.5 million and $24.3 million, respectively. |
59
Table of Contents
| (2) | Retail data have been calculated based upon retail stores, including our Baby & Child stores, and exclude outlet stores. |
| (3) | Comparable store sales have been calculated based upon retail stores that were open at least fourteen full months as of the end of the reporting period and did not change square footage by more than 20% between periods. Comparable store net revenues exclude revenues from outlet stores. |
| (4) | Average square footage (gross or selling, as applicable) is calculated for each quarter by taking the total applicable square footage at the beginning of the quarter plus the total applicable square footage at the end of the quarter and dividing by two. Average square footage for periods of six, nine and twelve months is calculated by averaging the average square footage for the quarters within such periods. |
| (5) | Retail sales per selling square foot is calculated by dividing total net revenues for all retail stores, comparable and non-comparable, by the average selling square footage for the period. |
| (6) | The catalogs and catalog pages circulated from period to period do not take into account different page sizes per catalog distributed. Page sizes and page counts vary for different catalog mailings and we sometimes mail different versions of a catalog at the same time. Accordingly, period to period comparisons of catalogs circulated and catalog pages circulated do not take these variations into account. In fiscal 2010, we mailed a larger number of catalogs that contained fewer pages and in some cases significantly smaller page sizes than in prior periods. In fiscal 2011 and in the first six months of fiscal 2012, we mailed fewer catalogs that contained a significant increase in number of pages as compared to fiscal 2010. |
| (7) | Direct revenues include sales through our catalogs and websites. |
The following table sets forth, for the periods presented, our consolidated statement of operations data as a percentage of total revenues.
| Year Ended | Six Months Ended | |||||||||||||||||||
| January 30, 2010 |
January 29, 2011 |
January 28, 2012 |
July 30, 2011 |
July 28, 2012 |
||||||||||||||||
| Statement of Operations Data: |
||||||||||||||||||||
| Net revenues |
100.0 | % | 100.0 | % | 100.0 | % | 100.0 | % | 100.0 | % | ||||||||||
| Cost of goods sold |
65.9 | 64.9 | 62.8 | 63.3 | 62.9 | |||||||||||||||
|
|
|
|
|
|
|
|
|
|
|
|||||||||||
| Gross margin |
34.1 | 35.1 | 37.2 | 36.7 | 37.1 | |||||||||||||||
| Selling, general and administrative expenses |
38.2 | 35.7 | 34.4 | 35.8 | 33.6 | |||||||||||||||
|
|
|
|
|
|
|
|
|
|
|
|||||||||||
| Income (loss) from operations |
(4.1 | ) | (0.6 | ) | 2.8 | 0.9 | 3.5 | |||||||||||||
| Interest expense |
(0.6 | ) | (0.4 | ) | (0.6 | ) | (0.4 | ) | (0.6 | ) | ||||||||||
|
|
|
|
|
|
|
|
|
|
|
|||||||||||
| Income (loss) before income taxes |
(4.7 | ) | (1.0 | ) | 2.2 | 0.5 | 2.9 | |||||||||||||
| Income tax expense (benefit) |
(0.1 | ) | — | 0.1 | 0.2 | 0.2 | ||||||||||||||
|
|
|
|
|
|
|
|
|
|
|
|||||||||||
| Net income (loss) |
(4.6 | )% | (1.0 | )% | 2.1 | % | 0.3 | % | 2.7 | % | ||||||||||
|
|
|
|
|
|
|
|
|
|
|
|||||||||||
We operate a fully integrated distribution model through our stores, catalogs and websites. The following table shows a summary of our Stores revenues, which include all sales for orders placed in retail stores as well as sales through outlet stores, and our Direct revenues which include sales through our catalogs and websites:
| Year Ended | Six Months Ended | |||||||||||||||||||
| January 30, 2010 |
January 29, 2011 |
January 28, 2012 |
July 30, 2011 |
July 28, 2012 |
||||||||||||||||
| (in thousands) | ||||||||||||||||||||
| Stores |
$ | 380,854 | $ | 438,463 | $ | 534,411 | $ | 230,722 | $ | 273,928 | ||||||||||
| Direct |
244,831 | 334,289 | 423,673 | 189,661 | 236,892 | |||||||||||||||
|
|
|
|
|
|
|
|
|
|
|
|||||||||||
| Net revenues |
$ | 625,685 | $ | 772,752 | $ | 958,084 | $ | 420,383 | $ | 510,820 | ||||||||||
|
|
|
|
|
|
|
|
|
|
|
|||||||||||
60
Table of Contents
First Six Months of Fiscal 2012 Compared to First Six Months of Fiscal 2011
The following table summarizes the financial impact of purchase accounting adjustments on gross profit in dollars, and as a percentage of net revenues, for the first six months of fiscal 2012 and the first six months of fiscal 2011:
| Six Months Ended | Increase | |||||||||||||||||||||||
| July 30, 2011 | July 28, 2012 | |||||||||||||||||||||||
| (dollars in thousands) | ||||||||||||||||||||||||
| Net revenues |
$ | 420,383 | 100.0 | % | $ | 510,820 | 100.0 | % | $ | 90,437 | ||||||||||||||
|
|
|
|
|
|
|
|
|
|
|
|||||||||||||||
| Gross profit excluding purchase accounting adjustments |
$ | 156,271 | 37.2 | % | $ | 190,477 | 37.3 | % | $ | 34,206 | 0.1 | % | ||||||||||||
| Decrease in gross profit from purchase accounting adjustments |
(1,841 | ) | (0.5 | )% | (1,082 | ) | (0.2 | )% | 759 | 0.3 | % | |||||||||||||
|
|
|
|
|
|
|
|
|
|
|
|
|
|||||||||||||
| Gross profit |
$ | 154,430 | 36.7 | % | $ | 189,395 | 37.1 | % | $ | 34,965 | 0.4 | % | ||||||||||||
|
|
|
|
|
|
|
|
|
|
|
|
|
|||||||||||||
Net revenues
Net revenues increased $90.4 million, or 21.5%, to $510.8 million in the first six months of fiscal 2012 compared to $420.4 million in the first six months of fiscal 2011. We had 73 and 87 retail stores open at July 28, 2012 and July 30, 2011, respectively. In the first six months of fiscal 2012, we opened two stores and closed three stores. Of the three closed stores, two were closed at the lease expiration date and one was closed prior to the lease expiration date. There were no charges associated with the early closure as the related lease allowed for early termination without charge. Stores sales increased $43.2 million, or 18.7%, to $273.9 million in the first six months of fiscal 2012 compared to $230.7 million in the first six months of fiscal 2011 due in large part to our comparable store sales increase of 29% in the first six months of fiscal 2012 compared to fiscal 2011, partially offset by having fewer stores open during the first six months of fiscal 2012 compared to the first six months of fiscal 2011. Direct sales increased $47.2 million, or 24.9%, to $237.0 million in the first six months of fiscal 2012 compared to $189.7 million in the first six months of fiscal 2011. We believe that the increase in both comparable store and direct sales was due primarily to our customers’ favorable reaction to our merchandise assortment, including new product categories, expansions of existing product categories, and an increase in circulated catalog pages.
Gross profit
Gross profit increased $35.0 million, or 22.6%, to $189.4 million in the first six months of fiscal 2012 from $154.4 million in the first six months of fiscal 2011. As a percentage of net revenues, gross margin increased 0.4%, to 37.1% of net revenues in the first six months of fiscal 2012 from 36.7% of net revenues in the first six months of fiscal 2011. Gross profit in the first six months of fiscal 2012 included $1.1 million of unfavorable gross profit impact due to purchase accounting compared to $1.8 million of unfavorable gross profit impact due to purchase accounting in the first six months of fiscal 2011.
Excluding the impact of purchase accounting, gross margin increased 0.1% as a percentage of net revenues. This increase was primarily driven by a 240 basis point improvement in occupancy costs achieved due to improved leverage on the fixed portion of our store and distribution center occupancy costs. This increase was partially offset by a decrease in gross margin of 160 basis points due to increased promotional activity in the first six months of fiscal 2012 and a decrease in gross margin of 70 basis points due to increased freight costs as a result of a higher percentage of furniture sales during such period, which incur greater shipping costs than our other products.
61
Table of Contents
Selling, general and administrative expenses
Selling, general and administrative expenses increased $21.1 million, or 14.0%, to $171.7 million in the first six months of fiscal 2012 compared to $150.6 million in the first six months of fiscal 2011. The increase in selling, general and administrative expenses of $21.1 million was primarily related to an increase of $15.7 million in advertising and marketing costs associated with increased catalog circulation, as well as an increase of $1.9 million in credit cards fees due to the growth in revenues. Selling, general and administrative expenses in the first six months of fiscal 2012 also increased due to $2.0 million of legal and other professional fees incurred in connection with the investigation conducted by the special committee of the board of directors (see “Risk Factors—Our former Chairman and Co-Chief Executive Officer, Gary Friedman, resigned from these positions and as a director of the Company effective as of , 2012. There can be no assurance that these developments will not have an adverse impact on us.”), partially offset by a benefit of $0.4 million related to a change in estimates of liabilities related to closed stores. We expect to incur additional legal and other professional fees in connection with subsequent remedial actions, including reviews of certain policies and procedures and documentation of Mr. Friedman’s advisory services agreement and related agreements. These net increases were partially offset by the $3.6 million charge associated with the early lease termination of four store locations and the $1.6 million restructuring charge associated with our Shanghai office, both of which were recorded in the first six months of fiscal 2011.
Interest expense
Interest expense increased $1.2 million to $3.1 million in the first six months of fiscal 2012 compared to $1.9 million in the first six months of fiscal 2011. This increase was due to the higher interest rate under the modified revolving line of credit agreement entered into in August 2011, as well as an increase in the amount of borrowings under the revolving line of credit in the first six months of fiscal 2012 as compared to the first six months of fiscal 2011 primarily due to increased inventory levels.
Income tax expense
Income tax expense decreased $0.2 million to $0.6 million in the first six months of fiscal 2012 compared to $0.8 million in the first six months of fiscal 2011. Our effective tax rate was 4.26% in the first six months of fiscal 2012 compared to 40.7% in the first six months of fiscal 2011. The decrease in our tax expense was primarily due to our ability to utilize California net operating losses to fully offset California tax in the first six months of fiscal 2012, partially offset by additional tax expense in other states.
Net income
Net income increased $12.9 million to $14.0 million in the first six months of fiscal 2012 compared to $1.1 million in the first six months of fiscal 2011. This increase was due to an increase in gross profit of $35.0 million and a decrease of income tax expense of $0.2 million, partially offset by an increase in selling, general and administrative expenses of $21.1 million and an increase in interest expense of $1.2 million, as discussed in more detail above.
62
Table of Contents
Fiscal 2011 Compared to Fiscal 2010
The following table summarizes the financial impact of purchase accounting adjustments on gross profit and selling, general and administrative expenses in dollars, and as a percentage of net revenues, for fiscal 2011 and fiscal 2010:
| Fiscal Year Ended | Increase (Decrease) | |||||||||||||||||||||||
| January 29, 2011 | January 28, 2012 | |||||||||||||||||||||||
| (dollars in thousands) | ||||||||||||||||||||||||
| Net revenues |
$ | 772,752 | 100.0 | % | $ | 958,084 | 100.0 | % | $ | 185,332 | ||||||||||||||
|
|
|
|
|
|
|
|
|
|
|
|||||||||||||||
| Gross profit excluding purchase accounting adjustments |
$ | 276,671 | 35.8 | % | $ | 359,639 | 37.5 | % | $ | 82,968 | 1.7 | % | ||||||||||||
| Decrease in gross profit from purchase accounting adjustments |
(5,051 | ) | (0.7 | )% | (3,290 | ) | (0.3 | )% | 1,761 | 0.4 | % | |||||||||||||
|
|
|
|
|
|
|
|
|
|
|
|
|
|||||||||||||
| Gross profit |
$ | 271,620 | 35.1 | % | $ | 356,349 | 37.2 | % | $ | 84,729 | 2.1 | % | ||||||||||||
|
|
|
|
|
|
|
|
|
|
|
|
|
|||||||||||||
| Selling, general and administrative expenses excluding purchase accounting adjustments |
$ | 274,253 | 35.5 | % | $ | 328,458 | 34.3 | % | $ | 54,205 | (1.2 | )% | ||||||||||||
| Increase in selling, general and administrative expenses from purchase accounting adjustments |
1,606 | 0.2 | % | 1,295 | 0.1 | % | (311 | ) | (0.1 | )% | ||||||||||||||
|
|
|
|
|
|
|
|
|
|
|
|
|
|||||||||||||
| Selling, general and administrative expenses |
$ | 275,859 | 35.7 | % | $ | 329,753 | 34.4 | % | $ | 53,894 | (1.3 | )% | ||||||||||||
|
|
|
|
|
|
|
|
|
|
|
|
|
|||||||||||||
Net revenues
Net revenues increased $185.3 million, or 24.0%, to $958.1 million in fiscal 2011 compared to $772.8 million in fiscal 2010. We had 74 and 91 retail stores open at January 28, 2012, and January 29, 2011, respectively. This decrease in the number of retail stores was part of our strategy to consolidate stores in markets where we open new full line Design Galleries and to close stores that do not meet our profitability objectives. In fiscal 2011, we opened five stores and closed 22 stores. Of the 22 closed stores, 16 were closed at the expiration of the lease, while six were closed prior to the expiration of the lease. We incurred charges of $3.1 million related to the early closures. Stores sales increased $95.9 million, or 21.9%, to $534.4 million in fiscal 2011 compared to $438.5 million in fiscal 2010 due in large part to our comparable store sales increase of 25% in fiscal 2011 compared to fiscal 2010. Direct sales increased $89.4 million, or 26.7%, to $423.7 million in fiscal 2011 compared to $334.3 million in fiscal 2010. We believe that the increase in both comparable store and direct sales was due primarily to our customers’ favorable reaction to our merchandise assortment, including expansions of existing product categories and new product categories, an increase in circulated catalog pages and positive customer reaction to our new Design Gallery format.
Gross profit
Gross profit increased $84.7 million, or 31.2%, to $356.3 million in fiscal 2011 from $271.6 million in fiscal 2010. As a percentage of net revenues, gross margin increased 2.1%, to 37.2% of net revenues in fiscal 2011 from 35.1% of net revenues in fiscal 2010. Gross profit in fiscal 2011 included $3.3 million of unfavorable gross profit impact due to purchase accounting compared to $5.1 million of unfavorable gross profit impact due to purchase accounting in fiscal 2010.
Excluding the impact of purchase accounting, gross margin increased 1.7%. This increase was primarily driven by a 290 basis point improvement in occupancy costs achieved due to improved leverage on the fixed portion of our store and distribution center occupancy costs, partially offset by 20 basis points of one-time costs associated with the opening of a new distribution center during fiscal 2011. The overall increase in gross margin was also offset by higher freight costs of 90 basis points due to a change in shipping rates charged to customers as we moved to flat rate shipping fees and experienced a higher percentage of furniture sales, which incurs
63
Table of Contents
greater shipping costs than our other products. Furthermore, increased promotional activity contributed to a 20 basis point decrease in gross margin in fiscal 2011.
Selling, general and administrative expenses
Selling, general and administrative expenses increased $53.9 million, or 19.5%, to $329.8 million in fiscal 2011 compared to $275.9 million in fiscal 2010. Selling, general and administrative expenses in fiscal 2011 included $1.3 million of unfavorable impact due to purchase accounting compared to $1.6 million of unfavorable impact due to purchase accounting in fiscal 2010. The increase in selling, general and administrative expenses of $54.2 million excluding the effect of purchase accounting adjustments was primarily related to an increase in employment costs of $15.2 million associated with the growth of our operations, a $6.4 million compensation charge related to the repayment of loans between Mr. Friedman and Home Holdings via the reclassification by Home Holdings of Mr. Friedman’s ownership units, an increase of $10.8 million in advertising and marketing costs associated with increased circulated catalog pages, an increase of $6.0 million in management fees to Catterton, Tower Three and Glenhill and an increase of $4.4 million in credit cards fees due to the growth in sales revenues. During fiscal 2011, we closed four retail store locations in advance of the related lease termination dates resulting in a charge of $3.2 million. In addition, in fiscal 2011 we recorded a $1.6 million restructuring charge associated with our Shanghai office, increased travel-related expenses of $2.2 million, and an increase in retail store pre-opening expenses of $0.9 million.
Selling, general and administrative expenses were 34.4% of net revenues in fiscal 2011 compared to 35.7% of net revenues in fiscal 2010. Selling, general and administrative expenses as a percentage of net revenues included 0.1% of unfavorable impact of purchase accounting in fiscal 2011 compared to 0.2% of unfavorable impact of purchase accounting in fiscal 2010. The improvement in selling, general and administrative expenses of 1.2% of net revenues excluding the effect of purchase accounting adjustments was driven largely by increased net revenues during fiscal 2011 compared to fiscal 2010, which resulted in a 120 basis point reduction in employment costs, a 30 basis point reduction in advertising and marketing costs, as well as a 10 basis point reduction in professional fees, in each case as a percentage of net revenues. These reductions were partially offset by a 30 basis point increase in costs as a percentage of net revenues related to corporate office costs, due in part to the restructuring charge associated with our Shanghai office and pre-opening expenses related to new retail store locations we opened in fiscal 2011, as well as a 10 basis point increase in occupancy expense as a percentage of net revenues primarily related to the closure of four retail store locations prior to the related lease termination dates.
Interest expense
Interest expense increased $1.9 million to $5.1 million in fiscal 2011 compared to $3.2 million in fiscal 2010. This increase was primarily due to the higher interest rate under the modified revolving line of credit agreement entered into in August 2011, as well as an increase in the amount of borrowings under the revolving line of credit in fiscal 2011 as compared to fiscal 2010 primarily due to increased inventory levels.
Income tax expense
Income tax expense increased $0.4 million to $1.1 million in fiscal 2011 compared to $0.7 million in fiscal 2010. Our effective tax rate was 5.2% for fiscal 2011 compared to (9.3)% for fiscal 2010. The increase in our tax expense was primarily due to an increase in taxable income for state and foreign jurisdictions. The state taxable income was primarily generated as a result of certain states disallowing the utilization of net operating loss carryovers.
Net income (loss)
Net income increased $28.4 million to $20.3 million in fiscal 2011 compared to a net loss of $8.1 million in fiscal 2010. This increase was due to an increase in gross profit of $84.7 million, partially offset by increases in
64
Table of Contents
selling, general and administrative expenses of $53.9 million, interest expense of $1.9 million and income tax expense of $0.4 million, as discussed in more detail above.
Fiscal 2010 Compared to Fiscal 2009
The following table summarizes the financial impact of purchase accounting adjustments on gross profit and selling, general and administrative expenses in dollars, and as a percentage of net revenues, for fiscal 2010 and fiscal 2009:
| Fiscal Year Ended | Increase (Decrease) | |||||||||||||||||||||||
| January 30, 2010 | January 29, 2011 | |||||||||||||||||||||||
| (dollars in thousands) | ||||||||||||||||||||||||
| Net revenues |
$ | 625,685 | 100.0 | % | $ | 772,752 | 100.0 | % | $ | 147,067 | ||||||||||||||
|
|
|
|
|
|
|
|
|
|
|
|||||||||||||||
| Gross profit excluding purchase accounting adjustments |
$ | 208,602 | 33.3 | % | $ | 276,671 | 35.8 | % | $ | 68,069 | 2.5 | % | ||||||||||||
| Increase (decrease) in gross profit from accounting adjustments |
4,454 | 0.8 | % | (5,051 | ) | (0.7 | )% | (9,505 | ) | (1.5 | )% | |||||||||||||
|
|
|
|
|
|
|
|
|
|
|
|
|
|||||||||||||
| Gross profit |
$ | 213,056 | 34.1 | % | $ | 271,620 | 35.1 | % | $ | 58,564 | 1.0 | % | ||||||||||||
|
|
|
|
|
|
|
|
|
|
|
|
|
|||||||||||||
| Selling, general and administrative expenses excluding purchase accounting adjustments |
$ | 224,157 | 35.8 | % | $ | 274,253 | 35.5 | % | $ | 50,096 | (0.3 | )% | ||||||||||||
| Increase in selling, general and administrative expenses from purchase adjustments |
14,732 | 2.4 | % | 1,606 | 0.2 | % | (13,126 | ) | (2.2 | )% | ||||||||||||||
|
|
|
|
|
|
|
|
|
|
|
|
|
|||||||||||||
| Selling, general and administrative expenses |
$ | 238,889 | 38.2 | % | $ | 275,859 | 35.7 | % | $ | 36,970 | (2.5 | )% | ||||||||||||
|
|
|
|
|
|
|
|
|
|
|
|
|
|||||||||||||
Net revenues
Net revenues increased $147.1 million, or 23.5%, to $772.8 million in fiscal 2010 compared to $625.7 million in fiscal 2009. We had 91 and 95 retail stores open at January 29, 2011 and January 30, 2010, respectively. In fiscal 2010, we opened 4 stores and closed 8 stores. Of the 8 closed stores, 6 were closed at the expiration of the lease, while 2 were closed prior to the expiration of the lease. There were no charges associated with the early closures as the related leases allowed termination without charge. Stores sales increased $57.6 million, or 15.1%, to $438.5 million in fiscal 2010 compared to $380.9 million in fiscal 2009. This increase was due in large part to our comparable store sales increase of 19% in fiscal 2010 compared to fiscal 2009, partially offset by a lower number of retail stores and lower revenues in our outlet stores. Direct sales increased $89.5 million, or 36.5%, to $334.3 million in fiscal 2010 compared to $244.8 million in fiscal 2009. We believe that this increase was due primarily to our customers’ favorable reaction to our assortment of products, including extensions of existing product categories and new product categories, as well as an increase in circulated catalogs of 48.4% and of circulated pages by 41.7%.
Gross profit
Gross profit increased $58.6 million, or 27.5%, to $271.6 million in fiscal 2010 from $213.1 million in fiscal 2009. As a percentage of net revenues, gross margin increased 1.0%, to 35.1% of net revenues in fiscal 2010 from 34.1% of net revenues in fiscal 2009. Gross profit in fiscal 2010 included $5.1 million of unfavorable gross profit impact due to purchase accounting compared to $4.5 million of favorable gross profit impact due to purchase accounting in fiscal 2009.
Excluding the impact of purchase accounting, gross margin increased 2.5%. This increase was primarily driven by a 260 basis point improvement in occupancy costs achieved due to improved leverage on the fixed portion of our store and distribution center occupancy costs, partially offset by 140 basis points of higher freight
65
Table of Contents
costs as a percentage of net revenues due to a higher percentage of furniture sales. Furthermore, reduced promotional activity and improved product sourcing contributed to a 130 basis point increase in gross margin in fiscal 2010.
Selling, general and administrative expenses
Selling, general and administrative expenses increased $37.0 million, or 15.5%, to $275.9 million for fiscal 2010 compared to $238.9 million for fiscal 2009. Selling, general and administrative expenses in fiscal 2010 included $1.6 million of unfavorable impact due to purchase accounting compared to $14.7 million of unfavorable impact due to purchase accounting in fiscal 2009. The increase in selling, general and administrative expenses of $50.1 million excluding the effect of purchase accounting adjustments was primarily related to an increase in employment costs of $15.6 million associated with the growth of our operations, as well as an increase in advertising and marketing costs of $12.4 million associated with a 41.7% increase in circulated catalog pages. Professional fees increased $10.2 million in fiscal 2010 as compared to fiscal 2009 primarily due to an increase in legal and other fees of $3.0 million related to our expansion into Asia, executive personnel matters and real estate activity, an increase of $2.4 million in information technology consulting costs in connection with new business intelligence software and database consulting and the incurrence of $2.4 million in preparation for our initial public offering. In addition, there was an increase in credit card fees and related expenses associated with the growth in sales revenue of $8.2 million and an increase in travel-related expenses of $2.6 million.
Selling, general and administrative expenses were 35.7% of net revenues in fiscal 2010 compared to 38.2% of net revenues in fiscal 2009. Selling, general and administrative expenses as a percentage of net revenues included 0.2% of unfavorable impact of purchase accounting in fiscal 2010 compared to 2.4% of unfavorable impact of purchase accounting in fiscal 2009. The improvement in selling, general and administrative expenses of 0.3% of net revenues, excluding the effect of purchase accounting adjustments was driven largely by increased net revenues, which resulted in a 170 basis point reduction in employment costs as a percentage of net revenues, as well as a 40 basis point reduction in occupancy costs as a percentage of net revenues. This overall improvement was partially offset by 20 basis points of increased volume-related costs as a percentage of net revenues as a result of changes in our product mix, 30 basis points of higher advertising and marketing costs as a percentage of net revenues and 130 basis points associated with increased corporate office costs as a percentage of net revenues, due in part to increased professional fees in fiscal 2010 in connection with the preparation for an initial public offering.
Interest expense
Interest expense decreased $0.1 million, or 2.8%, to $3.1 million in fiscal 2010 compared to $3.2 million in fiscal 2009. This decrease resulted primarily from lower borrowings under the revolving line of credit.
Income tax expense
Income tax expense was $0.7 million for fiscal 2010 compared to an income tax benefit of $0.4 million for fiscal 2009, an increase in tax expense of $1.1 million. Our effective tax rate was (9.3)% for fiscal 2010 compared to 1.7% for fiscal 2009. The increase in our tax expense was primarily due to an increase in taxable income for state and foreign jurisdictions.
Net loss
Net loss decreased $20.6 million, or 71.8%, to $8.1 million in fiscal 2010 compared to $28.7 million in fiscal 2009. This decrease was due to an increase in gross profit of $58.6 million and a decrease in interest expense of $0.1 million, partially offset by an increase in selling, general and administrative expenses of $37.0 million and an increase in income tax of $1.1 million, as discussed in more detail above.
66
Table of Contents
Quarterly Results and Seasonality
The following table sets forth our historical quarterly consolidated statements of income for each of the last eight fiscal quarters ended through July 28, 2012. This quarterly information has been prepared on the same basis as our annual audited financial statements appearing elsewhere in this prospectus and includes all adjustments that we consider necessary to present fairly the financial information for the fiscal quarters presented. The quarterly data should be read in conjunction with our consolidated financial statements and the related notes appearing elsewhere in this prospectus.
Our business is seasonal and we have historically realized a higher portion of our net revenues and net income in the second and fourth fiscal quarters due primarily to the outdoor selling season in the second fiscal quarter and the holiday selling season in the fourth fiscal quarter. Working capital requirements are typically higher in the first and third fiscal quarters due to inventory-related working capital requirements in advance of the outdoor selling season and the holiday selling season. During these peak periods we have historically increased our borrowings under the Restoration Hardware, Inc. revolving line of credit. As such, results of a period shorter than a full year may not be indicative of results expected for the entire year. Furthermore, the seasonal nature of our business may affect comparisons between periods.
| Fiscal 2010 | Fiscal 2011 | Fiscal 2012 | ||||||||||||||||||||||||||||||
| Third Quarter |
Fourth Quarter |
First Quarter |
Second Quarter |
Third Quarter |
Fourth Quarter |
First Quarter |
Second Quarter |
|||||||||||||||||||||||||
| (in thousands) | ||||||||||||||||||||||||||||||||
| Net revenues |
$ | 186,021 | $ | 255,877 | $ | 184,760 | $ | 235,623 | $ | 232,459 | $ | 305,242 | $ | 217,914 | $ | 292,906 | ||||||||||||||||
| Cost of goods sold |
127,098 | 159,950 | 121,576 | 144,377 | 148,066 | 187,716 | 142,646 | 178,779 | ||||||||||||||||||||||||
|
|
|
|
|
|
|
|
|
|
|
|
|
|
|
|
|
|||||||||||||||||
| Gross profit |
58,923 | 95,927 | 63,184 | 91,246 | 84,393 | 117,526 | 75,268 | 114,127 | ||||||||||||||||||||||||
| Selling, general, and administrative expenses |
70,841 | 78,565 | 68,816 | 81,803 | 88,523 | 90,611 | 77,401 | 94,328 | ||||||||||||||||||||||||
|
|
|
|
|
|
|
|
|
|
|
|
|
|
|
|
|
|||||||||||||||||
| Income (loss) from operations |
(11,918 | ) | 17,362 | (5,632 | ) | 9,443 | (4,130 | ) | 26,915 | (2,133 | ) | 19,799 | ||||||||||||||||||||
| Interest expense |
(847 | ) | (724 | ) | (899 | ) | (989 | ) | (1,598 | ) | (1,648 | ) | (1,575 | ) | (1,479 | ) | ||||||||||||||||
|
|
|
|
|
|
|
|
|
|
|
|
|
|
|
|
|
|||||||||||||||||
| Income (loss) before income taxes |
(12,765 | ) | 16,638 | (6,531 | ) | 8,454 | (5,728 | ) | 25,267 | (3,708 | ) | 18,320 | ||||||||||||||||||||
| Income tax expense (benefit) |
(201 | ) | 845 | (204 | ) | 987 | (871 | ) | 1,209 | 56 | 567 | |||||||||||||||||||||
|
|
|
|
|
|
|
|
|
|
|
|
|
|
|
|
|
|||||||||||||||||
| Net income (loss) |
$ | (12,564 | ) | $ | 15,793 | $ | (6,327 | ) | $ | 7,467 | $ | (4,857 | ) | $ | 24,058 | $ | (3,764 | ) | $ | 17,753 | ||||||||||||
|
|
|
|
|
|
|
|
|
|
|
|
|
|
|
|
|
|||||||||||||||||
| Adjusted EBITDA (1) |
$ | (352 | ) | $ | 32,455 | $ | 5,333 | $ | 22,414 | $ | 11,102 | $ | 41,305 | $ | 6,159 | $ | 28,738 | |||||||||||||||
| Comparable store sales (2) |
16 | % | 13 | % | 25 | % | 17 | % | 36 | % | 22 | % | 26 | % | 31 | % | ||||||||||||||||
| (1) | The following table presents a reconciliation of net income (loss), the most directly comparable GAAP financial measure, to EBITDA and Adjusted EBITDA for the periods indicated below. For further discussion of the use of EBITDA and Adjusted EBITDA, see footnote 10 to the table included in “Selected Historical Consolidated Financial and Operating Data.” |
67
Table of Contents
| Fiscal 2010 | Fiscal 2011 | Fiscal 2012 | ||||||||||||||||||||||||||||||
| Third Quarter |
Fourth Quarter |
First Quarter |
Second Quarter |
Third Quarter |
Fourth Quarter |
First Quarter |
Second Quarter |
|||||||||||||||||||||||||
| (in thousands) | ||||||||||||||||||||||||||||||||
| Net income (loss) |
$ | (12,564 | ) | $ | 15,793 | $ | (6,327 | ) | $ | 7,467 | $ | (4,857 | ) | $ | 24,058 | $ | (3,764 | ) | $ | 17,753 | ||||||||||||
| Depreciation and amortization |
9,656 | 7,860 | 7,386 | 7,597 | 7,373 | 6,830 | 6,424 | 6,468 | ||||||||||||||||||||||||
| Interest expense |
847 | 724 | 899 | 989 | 1,598 | 1,648 | 1,575 | 1,479 | ||||||||||||||||||||||||
| Income tax expense (benefit) |
(201 | ) | 845 | (204 | ) | 987 | (871 | ) | 1,209 | 56 | 567 | |||||||||||||||||||||
|
|
|
|
|
|
|
|
|
|
|
|
|
|
|
|
|
|||||||||||||||||
| EBITDA |
(2,262 | ) | 25,222 | 1,754 | 17,040 | 3,243 | 33,745 | 4,291 | 26,267 | |||||||||||||||||||||||
| Management and board fees (a) |
1,119 | 1,200 | 1,198 | 1,198 | 1,149 | 7,170 | 889 | 1,198 | ||||||||||||||||||||||||
| Non-cash compensation (b) |
507 | 380 | 498 | 602 | 6,714 | 340 | 423 | 214 | ||||||||||||||||||||||||
| Terminated operations (c) |
— | (67 | ) | 1,666 | — | 14 | (100 | ) | — | — | ||||||||||||||||||||||
| Severance and other related costs (d) |
46 | 1,250 | 28 | — | 443 | 150 | — | — | ||||||||||||||||||||||||
| Impairment of long-lived assets (e) |
— | 2,115 | — | — | — | — | — | — | ||||||||||||||||||||||||
| Lease termination costs (f) |
— | — | — | 3,571 | (461 | ) | — | 575 | (961 | ) | ||||||||||||||||||||||
| Non-capitalized IPO costs (g) |
162 | 2,189 | — | — | — | — | — | — | ||||||||||||||||||||||||
| Special committee investigation (h) |
— | — | — | — | — | — | — | 1,989 | ||||||||||||||||||||||||
| Other adjustments allowable under our agreements with our stockholders (i) |
76 | 166 | 189 | 3 | — | — | (19 | ) | 31 | |||||||||||||||||||||||
|
|
|
|
|
|
|
|
|
|
|
|
|
|
|
|
|
|||||||||||||||||
| Adjusted EBITDA |
$ | (352 | ) | $ | 32,455 | $ | 5,333 | $ | 22,414 | $ | 11,102 | $ | 41,305 | $ | 6,159 | $ | 28,738 | |||||||||||||||
|
|
|
|
|
|
|
|
|
|
|
|
|
|
|
|
|
|||||||||||||||||
| (a) | Includes fees paid in accordance with our management services agreement with Home Holdings, as well as fees and expense reimbursements paid to our board of directors. |
| (b) | Represents non-cash charges related to stock-based compensation programs. The third quarter of fiscal 2011 includes a $6.4 million compensation charge related to the repayment of loans owed to Home Holdings by Gary Friedman through the reclassification by Home Holdings of Mr. Friedman’s Class A and Class A-1 ownership units into an equal number of Class A Prime and Class A-1 Prime ownership units. Mr. Friedman served as our Chairman and Co-Chief Executive Officer at the time of such repayment. |
| (c) | Fiscal 2010 includes the impact of closing four temporary clearance centers operated from October 2008 to March 2010 and fiscal 2011 includes costs related to the restructuring of our Shanghai office location. |
| (d) | Generally includes executive severance and other related costs. |
| (e) | Includes costs related to impairment of long-lived assets related to our retail store operations. |
| (f) | Includes lease termination costs for retail stores that were closed prior to their respective lease termination dates. The lease termination amounts in the third quarter of fiscal 2011 and the first and second quarters of fiscal 2012 include changes in estimates regarding liabilities for future lease payments for closed stores. |
| (g) | Represents costs related to our efforts to pursue an initial public offering. |
| (h) | Represents legal and other professional fees incurred in connection with the investigation conducted by the special committee of the board of directors (as described in “Risk Factors—Our former Chairman and Co-Chief Executive Officer, Gary Friedman, resigned from these positions and as a director of the Company effective as of , 2012. There can be no assurance that these developments will not have an adverse impact on us.”) and our subsequent remedial actions. |
| (i) | Represents items which management believes are not indicative of our ongoing operating performance. The second quarter of fiscal 2011 include consulting fees related to organizational matters. The fourth quarter of fiscal 2010 and the first quarter of fiscal 2011 include state franchise tax amounts. All periods include foreign exchange gains and losses. |
68
Table of Contents
| (2) | Comparable store sales have been calculated based upon retail stores that were open at least fourteen full months as of the end of the reporting period and did not change square footage by more than 20% between periods. Comparable store net revenues exclude revenues from outlet stores. |
Liquidity and Capital Resources
General
Our business relies on cash flows from operations and the revolving line of credit and term loan as our primary sources of liquidity. Our primary cash needs are for merchandise inventories, payroll, store rent, capital expenditures associated with opening new stores and updating existing stores, as well as infrastructure and information technology. The most significant components of our working capital are cash and cash equivalents, merchandise inventories, accounts receivable, accounts payable and other current liabilities. Our working capital is seasonal as a result of our building inventory for the key selling seasons, and as a result our borrowings are generally higher during these periods when compared to the rest of our fiscal year. Our borrowings generally increase in our first fiscal quarter as we prepare for the outdoor selling season, which is in our second fiscal quarter, and our borrowings generally increase in the third fiscal quarter as we prepare for the holiday selling season, which is in our fourth fiscal quarter. We believe that cash expected to be generated from operations, and the availability of borrowings under the revolving line of credit or other financing arrangements, will be sufficient to meet working capital requirements, anticipated capital expenditures and payments due under our revolving line of credit and term loan for at least the next 12 – 24 months. Our investments in capital for the full fiscal year 2012 are planned at approximately $65 million of which $13.5 million was spent during the first six months of fiscal 2012. The planned investments in capital are approximately $39 million for construction of new stores and approximately $26 million for our infrastructure, including supply chain, information technology and our corporate headquarters. As we develop new stores in future years, we may explore new funding models, which could include joint ventures or other forms of equity ownership in the real estate interests associated with new sites and buildings. These approaches might require additional capital investment.
Cash Flow Analysis
A summary of operating, investing, and financing activities is shown in the following table:
| Year Ended | Six Months Ended | |||||||||||||||||||
| January 30, 2010 |
January 29, 2011 |
January 28, 2012 |
July 30, 2011 |
July 28, 2012 |
||||||||||||||||
| (in thousands) | ||||||||||||||||||||
| Provided by (used in) operating activities |
$ | 57,068 | $ | (11,810 | ) | $ | 17,121 | $ | (14,827 | ) | $ | (4,632 | ) | |||||||
| Used in investing activities |
(2,024 | ) | (39,907 | ) | (25,593 | ) | (12,168 | ) | (13,821 | ) | ||||||||||
| Provided by (used in) financing activities |
(51,055 | ) | 51,601 | 3,370 | 22,649 | 20,031 | ||||||||||||||
| Increase (decrease) in cash and cash equivalents |
4,583 | 178 | (4,853 | ) | (4,225 | ) | 1,591 | |||||||||||||
| Cash and cash equivalents at end of period |
13,186 | 13,364 | 8,511 | 9,139 | 10,102 | |||||||||||||||
Net Cash Provided By (Used In) Operating Activities
Cash from operating activities consists primarily of net income adjusted for non-cash items including depreciation and amortization, impairment of property and equipment, stock-based compensation and non-cash interest expense and the effect of changes in working capital and other activities.
For the first six months of fiscal 2012, net cash used in operating activities was $4.6 million and consisted of net income of $14.0 million and an increase in working capital and other activities of $32.4 million, offset by non-cash items of $13.8 million. Working capital and other activities consisted primarily of increases in inventory of $29.6 million in anticipation of future demand and as a result of the increased capacity available due to opening a new distribution center at the end of fiscal 2011, prepaid expenses of $24.5 million primarily due to
69
Table of Contents
an increase in catalog costs associated with the Source Book strategy, and accounts receivable of $5.7 million due to timing of payments received related to our credit card receivables. These uses of cash from working capital components were partially offset by sources of cash from increases in deferred revenue and customer deposits of $13.2 million due to the timing of shipments made at fiscal quarter end, increases in accrued liabilities and accounts payable of $8.9 million primarily due to timing of payments and increases in deferred rent and lease incentives of $5.3 million due to construction on our new Boston location.
For the first six months of fiscal 2011, net cash used in operating activities was $14.8 million and consisted of an increase in working capital and other activities of $32.8 million, partially offset by net income of $1.1 million and non-cash items of $16.9 million. Working capital and other activities consisted primarily of increases in inventory of $36.7 million in anticipation of the outdoor furniture season, prepaid expenses of $19.3 million primarily due to an increase in catalog costs associated with the spring Source Book and accounts receivable of $7.7 million due to timing of payments received related to our credit card receivables. These uses of cash from working capital were partially offset by increases in accrued liabilities and accounts payable of $18.9 million primarily due to timing of payments, deferred revenue and customer deposits of $9.1 million due to the timing of shipments made at period end and other current liabilities of $2.9 million primarily due to an increase in gift certificate related liabilities.
For fiscal 2011, net cash provided by operating activities was $17.1 million and consisted of net income of $20.3 million and non-cash items of $48.9 million, offset by an increase in working capital and other activities of $52.1 million. Non-cash items of $48.9 million include expenses of $6.4 million related to the repayment of the executive loan by Mr. Friedman and $6.0 million for the management fee to the Principal Equity Holders, both incurred by Home Holdings on our behalf and reflected as capital contributions. Working capital and other activities consisted primarily of increases in inventory of $39.5 million in anticipation of future demand and as a result of the increased capacity available due to opening a new distribution center in fiscal 2011, prepaid expenses of $36.4 million primarily due to an increase in catalog costs associated with the Source Book strategy and accounts receivable of $7.3 million due to timing of payments received related to our credit card receivables. These uses of cash from working capital components were offset by sources of cash from increases in accrued liabilities and accounts payable of $14.4 million primarily due to timing of payments, increases in deferred revenue and customer deposits of $11.4 million due to the timing of shipments made at fiscal year end, as well as increases in other current liabilities of $3.9 million primarily due to an increase in gift certificate-related liabilities.
For fiscal 2010, net cash used in operating activities was $11.8 million and consisted of an increase in working capital and other activities of $39.0 million, and a net loss of $8.1 million partially offset by non-cash expenses included in the net loss of $35.3 million. Working capital and other activities consisted primarily of increases in inventory of $57.1 million, partially offset by increases in deferred rent and lease incentives of $8.6 million, accrued liabilities and accounts payable of $5.5 million primarily due to timing of payments, other current liabilities of $3.4 million primarily due to an increase in gift certificate related liabilities and deferred revenue and customer deposits of $2.5 million primarily due to an increase in special orders as well as timing of shipments made at period end.
For fiscal 2009, net cash provided by operating activities was $57.1 million and consisted of net loss of $28.7 million, offset by non-cash expenses included in the net loss of $37.1 million and a decrease in working capital and other activities of $48.6 million. Working capital and other activities consisted primarily of a decrease in inventory of $35.0 million, a decrease in accounts receivable of $3.8 million due to timing of payments related to our credit card receivables and an increase in accrued liabilities and accounts payable of $8.2 million.
Net Cash Used In Investing Activities
Investing activities consist primarily of investment in supply chain and systems infrastructure and capital expenditures related to new store openings and improvements, including conversions.
70
Table of Contents
For the first six months of fiscal 2012, net cash used in investing activities was $13.8 million as a result of investments in new stores of $7.4 million, investment in supply chain and systems infrastructure of $6.1 million and the purchase of a new domain name for $0.3 million.
For the first six months of fiscal 2011, capital expenditures were $12.2 million as a result of investments in new stores of $7.9 million and investment in supply chain and systems infrastructure of $4.3 million.
For fiscal 2011, capital expenditures were $25.6 million as a result of investments in new stores of $15.7 million and investment in supply chain and systems infrastructure of $9.9 million.
For fiscal 2010, capital expenditures were $39.9 million as a result of investments in approximately 80 Gallery store conversions of $21.2 million, new stores of $11.0 million and investment in supply chain and systems infrastructure of $7.7 million.
For fiscal 2009, capital expenditures were $2.0 million as a result of investments in new stores of $0.7 million and investment in supply chain and systems infrastructure of $1.3 million.
Net Cash Provided By (Used In) Financing Activities
Financing activities consist primarily of borrowings and repayments related to the revolving line of credit, term loan and capital contributions.
For the first six months of fiscal 2012, net cash provided by financing activities was $20.0 million primarily due to an increase in net borrowing under the revolving line of credit of $22.1 million resulting from an increase in inventory purchases made during the period. This overall increase in cash provided by financing activities was partially offset by payments on capital lease obligations of $2.1 million.
For the first six months of fiscal 2011, net cash provided by financing activities was $22.6 million primarily due to an increase in net borrowing under the revolving line of credit of $24.6 million resulting from an increase in inventory purchases made by us during the period. This overall increase in cash provided by financing activities was partially offset by payments on capital lease obligations of $2.0 million.
For fiscal 2011, net cash provided by financing activities was $3.4 million primarily due to entering into an amendment to Restoration Hardware, Inc.’s credit agreement, for the purpose of incorporating a term loan facility for $15.0 million in January 2012. This increase is offset by net repayments under the revolving line of credit of $4.6 million, debt issuance costs related to the amended credit agreement and term loan of $2.8 million, as well as payments on capital lease obligations of $4.2 million.
For fiscal 2010, net cash provided by financing activities was $51.6 million primarily due to an increase in net borrowing under the revolving line of credit of $54.2 million resulting from an increase in inventory purchases made during the period. This overall increase in cash provided by financing activities was partially offset by payments on capital lease obligations of $2.6 million.
For fiscal 2009, net cash used in financing activities was $51.1 million primarily due to net payments made under the revolving line of credit of $53.5 million resulting from the sale of inventory during the period. In addition, we made payments on capital lease obligations of $2.6 million. These uses were partially offset by capital contributions from Home Holdings of $5.0 million.
71
Table of Contents
Revolving Line of Credit and Term Loan
In August 2011, Restoration Hardware, Inc., along with its Canadian subsidiary, Restoration Hardware Canada, Inc., entered into a credit agreement with Bank of America, N.A., as administrative agent, and certain other lenders. This amended credit agreement modified a previous facility in which Restoration Hardware, Inc. had a revolving line of credit for up to $190.0 million, as of July 30, 2011. As a result of the modification, the unamortized deferred financing fees related to the previous line of credit on the date of the modification of $0.2 million will be amortized over the life of the new revolving line of credit, which has a maturity date of August 3, 2016. Under the credit agreement (which was further amended in January 2012 to add thereto a term loan facility), Restoration Hardware, Inc. has (i) a revolving line of credit available of up to $317.5 million, of which $10.0 million is available to Restoration Hardware Canada, Inc., and (ii) a $15.0 million term loan with a maturity date of July 6, 2015.
Under the terms of the amended credit agreement, Restoration Hardware, Inc. may increase the amount of the revolving line of credit by up to an additional $100.0 million, provided that, among other things, the lenders agree to participate in the increased loan commitments under the revolving line of credit, no default under the credit agreement then exists or would result from such increase and sufficient borrowing base collateral is available to support increased loan amounts.
The availability of credit at any given time under the revolving line of credit is limited by reference to a borrowing base formula based upon numerous factors, including the value of eligible inventory, eligible accounts receivable, eligible real estate, and, in the case of the term loan, registered trade names and reserves established by the administrative agent. As a result of the borrowing base formula, the actual borrowing availability under the revolving line of credit could be less than the stated amount of the revolving line of credit (as reduced by the actual borrowings and outstanding letters of credit under the revolving line of credit). All obligations under the credit agreement are secured by substantially all of Restoration Hardware, Inc.’s assets, including accounts receivable, inventory, intangible assets, property, equipment, goods and fixtures.
Borrowings under the revolving line of credit are subject to interest, at borrowers’ option, at either the bank’s reference rate or LIBOR (or the BA Rate or the Canadian Prime Rate, as such terms are defined in the credit agreement, in the case of Canadian borrowings denominated in Canadian dollars or the United States Index Rate or LIBOR for Canadian borrowings denominated in United States dollars) plus an applicable margin rate, in each case. The weighted-average interest rate for the revolving line of credit was 2.7% as of July 28, 2012. The term loan bears interest at a rate of LIBOR plus 5.0%, and the interest rate for the term loan was 5.3% as of July 28, 2012.
As of July 28, 2012, $129.6 million was outstanding under the revolving line of credit, and the outstanding principal amount of the term loan was $14.8 million, net of $0.2 million of unamortized debt issuance costs. As of July 28, 2012, Restoration Hardware, Inc.’s undrawn borrowing availability under the revolving line of credit was $86.2 million and there were $11.5 million in outstanding letters of credit.
Restoration Hardware, Inc. is required to repay the term loan in quarterly installments of $1.25 million beginning October 2012 with the final payment in April 2015. In addition, the term loan must be repaid with the net proceeds of any disposition of any registered trade name.
The credit agreement contains various restrictive covenants, including, among others, limitations on the ability to incur liens, make loans or other investments, incur additional debt, issue additional equity, merge or consolidate with or into another person, sell assets, pay dividends or make other distributions or enter into transactions with affiliates, along with other restrictions and limitations typical to credit agreements of this type and size. The credit agreement does not contain any significant financial or coverage ratio covenants unless the availability under the revolving line of credit is less than the greater of (i) $17.5 million and (ii) 10% of the lesser of (A) the aggregate maximum commitments under the revolving line of credit and (B) the domestic borrowing
72
Table of Contents
base. If the availability under the revolving line of credit is less than the foregoing amount, then Restoration Hardware, Inc. is required to maintain a consolidated fixed charge coverage ratio of at least one to one. Such ratio is approximately the ratio on the last day of each month on a trailing twelve-month basis of (a) (i) consolidated EBITDA (as defined in the agreement) minus (ii) capital expenditures, minus (iii) the income taxes paid in cash to (b) the sum of (i) debt service charges plus (ii) certain dividends and distributions paid. As of July 28, 2012, Restoration Hardware, Inc. was in compliance with all covenants, and if the availability under the revolving line of credit were less than the amount described above, Restoration Hardware, Inc. would have been in compliance with the consolidated fixed charge coverage ratio described in the previous sentence. The credit agreement requires a daily sweep of cash to prepay the loans under the credit agreement while (i) an event of default exists or (ii) the availability under the revolving line of credit for extensions of credit to Restoration Hardware, Inc. is less than the greater of (A) $20.0 million and (B) 15% of the lesser of the aggregate maximum commitments and the domestic borrowing base.
Contractual Obligations
We enter into long term contractual obligations and commitments, primarily debt obligations and non-cancelable operating leases, in the normal course of business. As of January 28, 2012, our contractual cash obligations over the next several periods were as follows:
| Payments Due by Period | ||||||||||||||||||||
| Total | 2012 | 2013–2014 | 2015–2016 | Thereafter | ||||||||||||||||
| (in thousands) | ||||||||||||||||||||
| Revolving line of credit (1) |
$ | 107,502 | $ | — | $ | — | $ | 107,502 | $ | — | ||||||||||
| Term loan (1) |
15,000 | 2,500 | 10,000 | 2,500 | — | |||||||||||||||
| Other long term obligations (2) |
9,261 | 4,445 | 4,560 | 256 | — | |||||||||||||||
| Operating leases (3) |
478,190 | 54,398 | 109,438 | 81,665 | 232,689 | |||||||||||||||
| Letters of credit |
6,852 | 6,852 | — | — | — | |||||||||||||||
|
|
|
|
|
|
|
|
|
|
|
|||||||||||
| Total |
$ | 616,805 | $ | 68,195 | $ | 123,998 | $ | 191,923 | $ | 232,689 | ||||||||||
|
|
|
|
|
|
|
|
|
|
|
|||||||||||
| (1) | Excludes estimated interest under the revolving line of credit and term loan of $41.5 million. Interest costs for the revolving line of credit and term loan have been estimated based on interest rates in effect for our indebtedness as of January 28, 2012, as well as estimated borrowing levels in the future based upon planned inventory purchases. Actual borrowing levels and interest costs may differ. The revolving line of credit has a maturity date of August 3, 2016. The term loan has a maturity date of July 6, 2015. |
| (2) | Other long-term obligations consist primarily of capital lease obligations. |
| (3) | We enter into operating leases in the normal course of business. Most lease arrangements provide us with the option to renew the leases at defined terms. The future operating lease obligations would change if we were to exercise these options, or if we were to enter into additional new operating leases. Amounts above do not include estimated contingent rent due under operating leases of $1.3 million at January 28, 2012. |
The liability of $2.5 million as of January 28, 2012, for unrecognized tax benefits associated with uncertain tax positions (see Note 9—Income Taxes to Restoration Hardware, Inc.’s audited consolidated financial statements) has not been included in the contractual obligations table above because we are not able to reasonably estimate when cash payments for these liabilities will occur or the amount by which these liabilities will increase or decrease over time.
Off Balance Sheet Arrangements
We have no material off balance sheet arrangements as of July 28, 2012. We have obligations to make payments in connection with the successful completion of this offering for management fees of $ to affiliates of Catterton, Tower Three and Glenhill pursuant to the terms of the management services agreement
73
Table of Contents
with them. See “Certain Relationships and Related Party Transactions.” In addition, certain former executives are entitled to cash payments of $2.2 million as a result of the successful completion of this offering.
Critical Accounting Policies and Estimates
The preparation of financial statements in accordance with accounting principles generally accepted in the United States requires management to make estimates and assumptions that affect amounts reported in our consolidated financial statements and related notes, as well as the related disclosure of contingent assets and liabilities at the date of the financial statements and the reported amounts of revenues and expenses during the reporting period. Management evaluates its accounting policies, estimates, and judgments on an on-going basis. Management bases its estimates and judgments on historical experience and various other factors that are believed to be reasonable under the circumstances. Actual results may differ from these estimates under different assumptions and conditions and such differences could be material to the consolidated financial statements.
Management evaluated the development and selection of its critical accounting policies and estimates and believes that the following involve a higher degree of judgment or complexity and are most significant to reporting our results of operations and financial position, and are therefore discussed as critical. The following critical accounting policies reflect the significant estimates and judgments used in the preparation of our consolidated financial statements. With respect to critical accounting policies, even a relatively minor variance between actual and expected experience can potentially have a materially favorable or unfavorable impact on subsequent results of operations. However, our historical results for the periods presented in the consolidated financial statements have not been materially impacted by such variances. More information on all of our significant accounting policies can be found in Note 3—Significant Accounting Policies to Restoration Hardware, Inc.’s audited consolidated financial statements.
Revenue Recognition
We recognize revenues and the related cost of goods sold when merchandise is received by our customers, which reflects an estimate of non-furniture shipments through common carriers that have not yet been received by the customer. This estimate is based on contractual shipping terms with our contracted carrier which approximates our actual, historical delivery times.
We recognize shipping and handling fees as revenue when the merchandise is shipped to the customer. Costs of shipping and handling are included in cost of goods sold.
Sales tax collected is not recognized as revenue as it is ultimately remitted to governmental authorities.
We reserve for projected merchandise returns based on actual, historical experience and various other assumptions that we believe to be reasonable. Actual merchandise returns are monitored regularly and have not been materially different from the estimates recorded. Merchandise returns are granted for various reasons, including delays in product delivery, product quality issues and other similar matters. Product returned often represents merchandise that can be resold. Amounts refunded to customers are generally made by issuing the same payment tender as used in the original purchase. Merchandise exchanges of the same product and price are not considered merchandise returns and, therefore, are excluded when calculating the sales returns reserve.
Gift Certificates and Merchandise Credits
We sell gift certificates and issue merchandise credits to our customers in our stores and through our websites and product catalogs. Such gift certificates and merchandise credits do not have expiration dates. Revenue associated with gift certificates and merchandise credits is deferred until either (i) redemption of the gift certificate and merchandise credits or (ii) when the likelihood of redemption is remote and there exists no legal obligation to remit the value of unredeemed gift certificates or merchandise credits to the relevant jurisdictions
74
Table of Contents
(breakage). The breakage rate is based on monitoring of certificates issued, actual certificate redemptions and our analysis of when we believe it is remote that redemptions will occur.
Redeemed gift certificates and merchandise credits are recorded in net revenues. The liability for unredeemed gift certificates and merchandise credits is reversed to selling, general and administrative expenses when it is determined that certificates will not be redeemed.
Merchandise Inventories
Our merchandise inventories are composed of finished goods and are carried at the lower of cost or market, with cost determined on a weighted-average cost method and market determined based on the estimated net realizable value. To determine if the value of inventory should be marked down below original cost, we consider current and anticipated demand, customer preference and the merchandise age. The inventory value is adjusted periodically to reflect current market conditions, which requires management judgments that may significantly affect the ending inventory valuation, as well as gross margin. The significant estimates used in inventory valuation are obsolescence (including excess and slow-moving inventory and lower of cost or market reserves) and estimates of inventory shrinkage. We adjust our inventory for obsolescence based on historical trends, aging reports, specific identification and our estimates of future retail sales prices.
Reserves for shrinkage are estimated and recorded throughout the period as a percentage of net sales based on historical shrinkage results and current inventory levels. Actual shrinkage is recorded throughout the year based upon periodic cycle counts and the results of our annual physical inventory count. Actual inventory shrinkage and obsolescence can vary from estimates due to factors including the mix of our inventory (which ranges from large furniture to decorative accessories) and execution against loss prevention initiatives in our stores, distribution centers, off-site storage locations and with third-party transportation providers.
Due to these factors, our obsolescence and shrinkage reserves contain uncertainties. Both estimates have calculations that require management to make assumptions and to apply judgment regarding a number of factors, including market conditions, the selling environment, historical results and current inventory trends. If actual observed obsolescence or periodic updates of our shrinkage estimates differ from our original estimates, we adjust our inventory reserves accordingly throughout the period. Management does not believe that changes in the assumptions used in these estimates would have a significant effect on our net income or inventory balances. We have not made any material changes to our assumptions included in the calculations of the obsolescence and shrinkage reserves during the periods presented or recorded significant adjustments related to the physical inventory process.
Impairment of Goodwill and Long-Lived Assets
Goodwill
We evaluate goodwill annually to determine whether it is impaired. Goodwill is also tested between annual impairment tests if an event occurs or circumstances change that would indicate that the fair value of a reporting unit is less than its carrying amount. Conditions that may indicate impairment include, but are not limited to, a significant adverse change in customer demand or business climate that could affect the value of an asset; general economic conditions, such as increasing Treasury rates or unexpected changes in gross domestic product growth; a change in our market share; budget-to-actual performance and consistency of operating margins and capital expenditures; a product recall or an adverse action or assessment by a regulator; or changes in management or key personnel. If an impairment indicator exists, we test the intangible asset for recoverability. We have identified only one single reporting unit. We selected the fourth fiscal quarter to perform our annual goodwill impairment testing.
In fiscal 2011, we elected to early adopt the option to qualitatively assess goodwill impairment to determine whether it is more likely than not that the fair value of a reporting unit is less than its carrying amount. The fair
75
Table of Contents
value of our reporting unit used for this assessment was derived from our January 29, 2011 goodwill impairment assessment. Accordingly, we performed a qualitative analysis examining key events and circumstances affecting fair value and determined it is more likely than not that the reporting unit’s fair value is greater than its carrying amount. As such, no further analysis was required for purposes of testing of our goodwill for impairment.
For goodwill not qualitatively assessed, a two-step quantitative approach is used. In the first step, we compare the fair value of the reporting unit, generally defined as the same level as or one level below an operating segment, to its carrying value. If the fair value of the reporting unit exceeds the carrying value of the net assets assigned to that unit, goodwill is considered not impaired and we are not required to perform further testing. If the carrying value of the net assets assigned to the reporting unit exceeds the fair value of the reporting unit, then we must perform the second step of the impairment test in order to determine the implied fair value of the reporting unit’s goodwill. If the carrying value of a reporting unit’s goodwill exceeds its implied fair value, then we would record an impairment loss equal to the difference. The assumptions used in such valuations are subject to volatility and may differ from actual results.
The fair value of our reporting unit as of January 29, 2011 was determined using a combination of the discounted cash flow method of the income approach, as well as the guideline company method and subject transaction method of the market approach. The determination of fair value pursuant to those methods and approaches requires assumptions and estimates of many critical factors, including, among others, the nature and history of our Company, financial and economic conditions affecting us, our industry and the general economy, past results, our current operations and future prospects, sales of similar businesses or capital stock of publicly held similar businesses, as well as prices, terms and conditions affecting past sales of similar businesses. Forecasts of future operations are based, in part, on operating results and management’s expectations as to future market conditions. These types of analyses contain uncertainties because they require management to make assumptions and to apply judgments to estimate industry economic factors and the profitability of future business strategies. However, if actual results are not consistent with our estimates and assumptions, we may be exposed to future impairment losses that could be material.
In performing the income approach, we utilized the discounted cash flow method to determine the free operating cash flow attributable to the business enterprise for the projection period ending January 31, 2017 and the residual period subsequent to January 31, 2017. The projected financial results were created from management’s critical assumptions and estimates. Annual revenue growth was primarily driven by management’s revenue growth projections based upon current and historical financial information as well as expected market conditions. The primary business variables driving our discounted cash flow model include revenue growth and product gross margin. Management also projected EBITDA, which together with assumptions for working capital, depreciation and capital expenditures was used to calculate the cash flow generated by the business. The discount rate of 15% utilized in the income approach was based on a weighted average cost of capital utilizing market and other empirical inputs.
In performing the market approach, we utilized the guideline company method by reviewing the market values of public companies of similar size, type of business, financial performance and investment characteristics. We computed revenue, EBITDA and EBIT multiples in order to determine the indicated enterprise value of each of the guideline companies. We then compared our Company’s characteristics to the guideline companies to determine the most appropriate enterprise value to assign to our Company. We also utilized the subject company transaction method by computing the implied multiples arising from the Acquisition multiplied by projected revenue and EBITDA of our Company.
We weighted the results of the three different methods utilized under the income approach and market approach in order to arrive at the business enterprise value. We assigned the most significant weight to the discounted cash flow method, because this method uses historical company data and management estimates of future operations, and the least weight to the subject transaction method. All three methods yielded business enterprise values that exceeded the carrying value of net assets as of January 29, 2011, in the range from 50% to
76
Table of Contents
150%. The weighted business enterprise value determined during our goodwill impairment test as of January 29, 2011, exceeds the carrying value of our net assets by more than 60%. No impairment of goodwill has been recorded in any period.
Based on the carrying value of our goodwill as of January 28, 2012, relative to its estimated fair value as of January 29, 2011, we do not anticipate any material impairment charges in the near term.
Long-Lived Assets
Long-lived assets, such as property and equipment and intangible assets subject to amortization, are reviewed for impairment whenever events or changes in circumstances indicate that the carrying amount of an asset may not be recoverable. Conditions that may indicate impairment include, but are not limited to, a significant adverse change in customer demand or business climate that could affect the value of an asset, a product recall or an adverse action or assessment by a regulator. If the sum of the estimated undiscounted future cash flows related to the asset are less than the carrying value, we recognize a loss equal to the difference between the carrying value and the fair value, usually determined by the estimated discounted cash flow analysis of the asset.
We evaluate long-lived tangible assets at an individual store level, which is the lowest level at which independent cash flows can be identified. We evaluate corporate assets or other long-lived assets that are not store-specific at the consolidated level.
Since there is typically no active market for our long-lived tangible assets, we estimate fair values based on the expected future cash flows. We estimate future cash flows based on store-level historical results, current trends, and operating and cash flow projections. Our estimates are subject to uncertainty and may be affected by a number of factors outside our control, including general economic conditions and the competitive environment. While we believe our estimates and judgments about future cash flows are reasonable, future impairment charges may be required if the expected cash flow estimates, as projected, do not occur or if events change requiring us to revise our estimates.
Stock-Based Compensation
We account for stock-based compensation in accordance with Financial Accounting Standards Board Accounting Standards Codification (“ASC”) No. 718, Compensation-Stock Compensation, which requires the fair value of stock-based payments to be recognized in the consolidated financial statements as compensation expense over the requisite service period. Compensation expense based upon the fair value of awards is recognized on a graded basis, net of forfeitures, over the requisite service period for awards that actually vest. Stock-based compensation expense is recorded in selling, general and administrative expenses.
Home Holdings has granted performance-based units that vest and become deliverable upon achievement or satisfaction of performance conditions specified in the performance agreement or upon the return on investment attained by certain of the equity investors in Home Holdings at defined liquidity events, including an initial public offering or certain sale or merger transactions. We estimate the fair value of performance-based units awarded to employees at the grant date based on the fair value of our Company on such date. We also consider the probability of achieving the established performance targets in determining our stock-based compensation with respect to these awards. We recognize compensation cost over the performance period. When the performance is related to a specific event occurring in the future, we recognize the full expense at the time of the event. Prior to the consummation of the offering, Home Holdings will exchange these performance-based units for shares of our common stock with substantially similar terms and conditions.
We estimate the fair value of each grant on the date of grant based upon a lattice model that incorporates a Monte Carlo Simulation (the “Monte Carlo method”). The Monte Carlo method requires various significant
77
Table of Contents
judgment assumptions in order to derive a final fair value determination for each type of award including:
| • | Total Equity Value—The total equity value of Home Holdings (whose sole investment has been its acquisition of 100% of the equity ownership interests in Restoration Hardware, Inc.) is determined as described further below based upon a range of factors including independent third-party valuation studies of net equity value as well as an assessment of future financial projections and the stage of development and financial position of the business enterprise. |
| • | Expected Unit Life—The Monte-Carlo method analysis included an estimate of the expected unit life from grant date which represents the period that the units are anticipated to be outstanding after initial grant until expiration or settlement based upon various factors including expectations concerning a potential liquidity event, the contractual terms of the equity-based awards and vesting schedules. |
| • | Expected Equity Returns and Volatility—The Monte-Carlo method incorporates both expectations concerning equity returns in the future and an expected volatility in terms of the possible range of returns units based upon historical volatility data from a group of comparable companies prior to the valuation date and expectations of future volatility over a timeframe consistent with the expected life of the awards. |
| • | Risk Free Interest Rate—The Monte-Carlo method incorporates an assumed risk-free interest rate which is based on the United States Treasury yield curve rates in effect at the time of the grant using the term most consistent with the expected life of the award. |
| • | Discount for Lack of Marketability—Fair value of the units is adjusted to take into account the lack of marketability associated with the absence of any public trading market for the equity. |
Significant Factors Used in Determining Fair Value of Net Equity
To determine the total net equity value of Home Holdings underlying the unit awards, a determination is made of the value of the business enterprise and then this value is reduced by the amount of interest-bearing debt of Restoration Hardware, Inc. as of the valuation date. The determination of business enterprise value takes into consideration work performed by an independent third-party valuation firm with expertise in the valuation of businesses. Third-party valuation reports were performed as of April 4, 2010, January 31, 2011, and September 8, 2011, using generally accepted valuation methodologies.
In performing the valuation analysis, we engaged in discussions with the valuation firm and management, we analyzed historical and forecasted financial results, and information concerning selected comparable guideline companies, and we reviewed relevant governing documents and other records including the distribution priorities of different classes of units of Home Holdings based upon an assumed liquidation event such as a sale of the business.
The business enterprise valuation methodology used by us and the valuation firm incorporates two principal approaches: the income and market approaches. The income approach is based upon a calculation of the expected present value of future cash generated by the enterprise based upon a discounted cash flow analysis that incorporates expected future cash flows using forecasted growth in the business enterprise. The market approach is an estimate of value based upon actual stock prices or transaction prices using comparable guideline companies: (i) in the guideline transaction method to the market approach, the acquisition of Restoration Hardware, Inc. by Home Holdings was used as a representative transaction; and (ii) in the guideline company method a number of selected public company comparable companies were examined. Once calculated, the different valuations yielded by the income approach and market approach are weighted to determine a composite valuation. Over time, greater weight was given to the income approach and lesser weight was given to the market approach’s reference to the acquisition of Restoration Hardware, Inc. by Home Holdings, as that transaction has become a further reference point in time.
As of each grant date with respect to units granted by Home Holdings as compensation awards, the board of directors or compensation committee of Home Holdings reached conclusions about the fair market value of the
78
Table of Contents
class of units being granted by Home Holdings based upon assumptions concerning the underlying net equity value of Restoration Hardware, Inc. stock held by Home Holdings and the resulting “waterfall” distribution applicable to the different classes of units of Home Holdings that would be applicable upon a liquidity event, such as a sale of our business. The terms of the awards were determined based upon the net equity value of Home Holdings on the date of the award in such a manner as to have zero net value at date of grant for purposes of the foregoing liquidation analysis. In making its determinations, the board of directors or compensation committee of Home Holdings considered information from management, independent reports prepared by a third-party valuation firm which addressed the net equity value of Home Holdings, as well as a number of other factors.
The board of directors or compensation committee of Home Holdings determines the fair value of units awarded as compensation, as well as the underlying net equity value of Home Holdings, by considering a number of objective and subjective factors in accordance with guidance in the AICPA Technical Practice Aid, Valuation of Privately-Held-Company Equity Securities Issued as Compensation. These objective and subjective factors include:
| • | the distribution priorities of the different classes of units granted by Home Holdings; |
| • | our operating and financial performance; |
| • | the hiring of key personnel; |
| • | the introduction of new products; |
| • | the risks inherent in the development and expansion of our products; |
| • | industry information such as market growth and volume; |
| • | the fact that grants involve illiquid securities in a private company; |
| • | the likelihood of achieving a liquidity event, such as an initial public offering or sale of our Company; and |
| • | assumptions about anticipated financial performance, including assumptions based upon expectations regarding our EBITDA and Adjusted EBITDA. |
The following table summarizes, by grant date, the number of units granted since January 1, 2011, through the date of this prospectus, and the associated intrinsic value for each unit based upon an analysis of the value that would have been paid to holders of such units on the respective grant dates assuming a sale of the business enterprise for consideration equal to net equity value at the grant date:
| Total Number of Units Granted |
Estimated Intrinsic Value Per Unit |
|||||||
| Grant Date—Time-based Units (1)(2) |
||||||||
| January 1, 2011 |
50,000 | — | ||||||
| May 9, 2011 |
300,000 | — | ||||||
| May 20, 2011 |
741,000 | — | ||||||
| September 8, 2011 |
585,000 | — | ||||||
| Grant Date—2X—3X Performance-based Units (1) |
||||||||
| May 20, 2011 |
194,000 | — | ||||||
| Grant Date—Other Performance-based Units (1) |
||||||||
| May 9, 2011 |
550,000 | — | ||||||
| (1) | See “Executive Compensation—Employee Benefit and Stock Plans—Team Resto Ownership Plan” herein for a discussion of time-based units, 2X—3X Performance-based Units and 3X—5X Performance-based Units. Such units are Class B units under Home Holdings’ limited liability company agreement. |
79
Table of Contents
| (2) | 100,000 units granted on May 9, 2011 and 225,000 units granted on May 20, 2011 were originally awarded as 3X—5X Performance-based Units and the vesting schedules of such awards were modified on September 8, 2011 to a five year vesting schedule of 20% vesting each year from the original grant date. |
Based upon an initial public offering price of $ , the midpoint of the estimated price range set forth on the cover of this prospectus, the intrinsic value of the unit awards outstanding at , 2012, was approximately $ million, of which approximately $ million related to the unit awards that were vested (including those assumed to vest as a result of the initial public offering) and approximately $ million related to the unit awards that were not vested.
Income Taxes
We account for income taxes under an asset and liability approach that requires the recognition of deferred tax assets and liabilities for the expected future tax consequences of events that have been recognized in our consolidated financial statements or tax returns. In estimating future tax consequences, we generally take into account all expected future events then known to us, other than changes in the tax law or rates which have not yet been enacted and which are not permitted to be considered. Accordingly, we may record a valuation allowance to reduce our net deferred tax assets to the amount that is more-likely-than-not to be realized. The determination as to whether a deferred tax asset will be realized is made on a jurisdictional basis and is based upon management’s best estimate of the recoverability of our net deferred tax assets. Future taxable income and ongoing prudent and feasible tax planning are considered in determining the amount of the valuation allowance, and the amount of the allowance is subject to adjustment in the future. Specifically, in the event we are to determine that we are not more-likely-than-not able to realize our net deferred tax assets in the future, an adjustment to the valuation allowance would decrease income in the period such determination is made. This allowance does not alter our ability to utilize the underlying tax net operating loss and credit carryforwards in the future, the utilization of which is limited to achieving future taxable income.
In assessing the need for a valuation allowance, we consider both positive and negative evidence related to the likelihood of realization of the deferred tax assets. If, based on the weight of available evidence, it is more-likely-than-not the deferred tax assets will not be realized, we record a valuation allowance. The weight given to the positive and negative evidence is commensurate with the extent to which the evidence may be objectively verified. As such, it is generally difficult for positive evidence regarding projected future taxable income exclusive of reversing taxable temporary differences to outweigh objective negative evidence of recent financial
reporting losses. United States GAAP states that cumulative losses in recent years are a significant piece of negative evidence that is difficult to overcome in determining that a valuation allowance is not needed against deferred tax assets.
Due to the historical losses incurred, we have recorded a full valuation allowance against the U.S. net deferred tax assets, excluding deferred tax liabilities related to indefinite lived intangibles, as well as against the net deferred tax assets in Shanghai.
A sustained period of profitability in our operations is required before we would change our judgment regarding the need for a full valuation allowance against our net deferred tax assets. Accordingly, although we were profitable in fiscal 2011, we continue to record a full valuation allowance against the net deferred tax assets in the United States and Shanghai. Although the weight of negative evidence related to cumulative losses is decreasing, we believe that this objectively measured negative evidence outweighs the subjectively determined positive evidence, and accordingly, we have not changed our judgment regarding the need for a full valuation allowance in fiscal 2011. We continue to assess the need for a valuation allowance and any changes in our assessment could result in a material impact to income tax expense.
The accounting standard for uncertainty in income taxes prescribes a recognition threshold that a tax position is required to meet before being recognized in the financial statements and provides guidance on
80
Table of Contents
derecognition, measurement, classification, interest and penalties, accounting in interim periods, disclosure and transition issues. Differences between tax positions taken in a tax return and amounts recognized in the financial statements generally result in an increase in a liability for income taxes payable or a reduction of an income tax refund receivable, or a reduction in a deferred tax asset or an increase in a deferred tax liability, or both. We recognize interest and penalties related to unrecognized tax benefits in tax expense.
Recently Issued Accounting Pronouncements
Disclosures Regarding Fair Value Measurements
In May 2011, the Financial Accounting Standards Board (“FASB”) issued guidance to amend the fair value measurement and disclosure requirements. The guidance requires the disclosure of quantitative information about unobservable inputs used, a description of the valuation processes used, and a qualitative discussion around the sensitivity of the measurements. The guidance is effective during interim and annual periods beginning after December 15, 2011 and is to be applied prospectively. We adopted this guidance on January 29, 2012 and such adoption did not have a material impact on the disclosures in the notes to our consolidated financial statements.
Other Comprehensive Income Presentation
In June 2011, the FASB issued guidance that revises the manner in which entities present comprehensive income in their financial statements. The guidance requires entities to report the components of comprehensive income in either a single, continuous statement or two separate but consecutive statements. In December 2011, the FASB issued guidance which defers certain requirements set forth in June 2011. These amendments are being made to allow the FASB time to redeliberate whether to present on the face of the financial statements the effects of reclassifications out of accumulated other comprehensive income on the components of net income and other comprehensive income in all periods presented. Both sets of guidance are effective for fiscal years, and interim periods within those years, beginning after December 15, 2011, and are to be applied retrospectively. We adopted this guidance on January 29, 2012 and such adoption only resulted in a change in how we present the components of comprehensive income, which was previously presented within our consolidated statements of stockholders’ equity.
Indefinite-Lived Intangible Assets
In July 2012, the FASB issued guidance that revises the requirements around how entities test indefinite-lived intangible assets other than goodwill for impairment. Similar to the guidance issued in September 2011 related to the testing of goodwill for impairment, this guidance allows companies to perform a qualitative assessment before calculating the fair value of the indefinite-lived intangible asset. If entities determine, on the basis of qualitative factors, that the fair value of the indefinite-lived intangible asset is more likely than not greater than the carrying amount, a quantitative calculation would not be needed. We will adopt this guidance effective for our fiscal 2012 annual indefinite-lived intangible assets impairment test. The adoption of this guidance will result in a change in how we perform our indefinite-lived intangible assets impairment assessment; however, we do not expect it to have a material impact on our consolidated financial statements.
Jumpstart Our Business Startups Act of 2012
The JOBS Act permits us, as an “emerging growth company,” to take advantage of an extended transition period to comply with new or revised accounting standards applicable to public companies. We are choosing to “opt out” of this provision and, as a result, we will comply with new or revised accounting standards as required when they are adopted. This decision to opt out of the extended transition period under the JOBS Act is irrevocable.
81
Table of Contents
Quantitative and Qualitative Disclosure of Market Risks
Interest Rate Risk
We are subject to interest rate risk in connection with borrowings under our revolving line of credit and term loan, which bear interest at variable rates. At July 28, 2012, $129.6 million was outstanding under the revolving line of credit and $14.8 million was outstanding under the term loan, net of $0.2 million of unamortized debt issuance costs. As of July 28, 2012, the undrawn borrowing availability under the revolving line of credit was $86.2 million, and there were $11.5 million in outstanding letters of credit. We currently do not engage in any interest rate hedging activity and currently have no intention to do so in the foreseeable future. Based on the average interest rate on the revolving line of credit during the first six months of fiscal 2012, and to the extent that borrowings were outstanding, we do not believe that a 10% change in the interest rate would have a material effect on our consolidated results of operations or financial condition.
Impact of Inflation
Our results of operations and financial condition are presented based on historical cost. While it is difficult to accurately measure the impact of inflation due to the imprecise nature of the estimates required, we believe the effects of inflation, if any, on our results of operations and financial condition have been immaterial.
Internal Control Over Financial Reporting
The process of improving our internal controls has required and will continue to require us to expend significant resources to design, implement and maintain a system of internal controls that is adequate to satisfy our reporting obligations as a public company. There can be no assurance that any actions we take will be completely successful. We will continue to evaluate the effectiveness of our disclosure controls and procedures and internal control over financial reporting on an ongoing basis.
We have not begun testing or documenting our internal control procedures in order to comply with the requirements of Section 404 of the Sarbanes-Oxley Act. Section 404 requires annual management assessments of the effectiveness of our internal control over financial reporting and a report by our independent auditors addressing these assessments. We will be required to comply with Section 404 at the time we file our annual report for fiscal 2013 with the SEC, assuming we cease to qualify as an “emerging growth company” under the JOBS Act. As part of this process, we may identify specific internal controls as being deficient. We anticipate retaining additional personnel to assist us in complying with our Section 404 obligations. We are currently evaluating whether such personnel will be retained as consultants or as employees.
82
Table of Contents
Our Company
We believe RH is one of the most innovative and fastest growing luxury brands in the home furnishings marketplace. We believe our brand stands alone and is redefining this highly fragmented and growing market, contributing to our superior sales growth and market share gains over the past several years as compared to industry growth rates. Our ability to innovate, curate and integrate products, categories, services and businesses with a completely authentic and distinctive point of view, then rapidly scale them across our fully integrated multi-channel infrastructure is a powerful platform for continued long-term growth. We evolved our brand to become RH, positioning our Company to curate a lifestyle beyond the four walls of the home. Our unique product development, go-to-market and supply chain capabilities, together with our significant scale, enable us to offer a compelling combination of design, quality and value that we believe is unparalleled in the marketplace.
Our business is fully integrated across our multiple channels of distribution, consisting of our stores, catalogs and websites. We position our stores as showrooms for our brand, while our catalogs and websites act as virtual extensions of our stores. We are transforming our real estate platform from a mall-based retail footprint to a portfolio focused on full line Design Galleries. As of July 28, 2012, we operated a total of 73 retail stores, consisting of 71 Galleries and 2 full line Design Galleries, and 10 outlet stores throughout the United States and Canada. In fiscal 2011, we distributed approximately 26.1 million catalogs, and our websites logged over 14.3 million unique visits.
Over the last several years, we achieved strong growth in sales and profitability, as illustrated by the following:
| • | From fiscal 2009 to fiscal 2011, we increased our net revenues 53% to $958.1 million, our Adjusted EBITDA 356% to $80.2 million and our Adjusted EBITDA margin by 555 basis points to 8.4%. Over the same time period we increased our net income by $49.0 million from a net loss of $28.7 million to net income of $20.3 million; and |
| • | We achieved ten consecutive quarters of double-digit net revenue growth through our fiscal quarter ended July 28, 2012. We achieved this growth as we reduced our store base from 95 retail locations as of January 30, 2010 to 73 locations as of July 28, 2012. |
| Net revenues |
Adjusted EBITDA |
Net income (loss) | ||
| (dollars in millions) | ||||
|
|
|
|
See “Selected Historical Consolidated Financial and Operating Data” for a discussion of Adjusted EBITDA and a reconciliation of the differences between Adjusted EBITDA and net income (loss).
Our Competitive Strengths
We attribute our success to the following competitive strengths:
Our Market-Redefining Luxury Brand. We believe RH stands alone as a leading luxury brand of inspired design, and is redefining the highly fragmented home furnishings market. We provide dominant merchandise
83
Table of Contents
assortments across a growing number of categories and feature a highly differentiated style, presentation and customer experience. We believe that offering a compelling combination of design, quality and value enables us to remain relevant with our target customer and expand our reach. We believe we are changing the home furnishings landscape by attracting affluent consumers from designer showrooms and high-end boutiques with our compelling value proposition, as well as aspirational consumers trading up to our more sophisticated aesthetic relative to what can be found in department stores and other home furnishings retailers. We believe this has led to our superior sales growth and market share gains over the past several years as compared to industry growth rates. In a market characterized by smaller, independent competitors, we believe our luxury positioning, superior quality and significant scale enable us to grow our market share.
Our Unique Development Model. We believe our unique approach to the development of new products, categories and services enables us to gain market share, adapt our business to emerging trends, stay relevant with our customers and enter into new businesses that leverage our strengths. The foundation of our unique development model is:
| • | Innovation. We are dedicated to offering products and services that push established boundaries. We are driven to look beyond current business paradigms and best practices to create new paradigms and next practices. The scope of our innovation is demonstrated in every aspect of our organization, including in our products and services, our stores and presentation, our channel-agnostic go-to-market strategy and our fully integrated supply chain and systems infrastructure. |
| • | Curation. At our core we are not designers, rather we are curators and composers of inspired design and experiences. We travel the world in search of people, ideas, items, experiences and inspiration, and then create a composition that is unique and entirely our own. Through this journey of searching, discovering, re-imagining, curating and composing the ideas, items and experiences that we love, we create a completely unique and authentic expression in the marketplace. |
| • | Integration. Everything we curate and compose must be beautifully and intelligently integrated, enhancing the appeal of our offering and experience. This process involves both “art and science” as we integrate new products that enhance existing products, new categories that enhance existing categories and new services and businesses that enhance existing services and businesses, and as our supporting functions and infrastructure are integrated to achieve our goals. |
Our ability to innovate, curate and integrate products, categories, services and businesses, then rapidly scale them across our fully integrated multi-channel infrastructure is a powerful platform for continued long-term growth.
Our Superior Capabilities. Our product development and multi-channel go-to-market capabilities together with our fully integrated infrastructure and significant scale, enable us to offer a compelling combination of design, quality and value that we believe is unparalleled in the marketplace.
| • | Highly Differentiated Product Development Capabilities. We have architected a proprietary product development platform that is fully integrated from product ideation to presentation. We have established a cross-functional organization centered on product leadership, with teams that collaborate across our product development, sourcing, merchandising, inventory and creative functions. Our product development facility, the Restoration Hardware Center of Innovation & Product Leadership, supports and streamlines the entire product development process. We work closely with our network of artisan partners who possess specialized design and manufacturing capabilities and who we consider an extension of our product development team. Our product development platform and significant scale have enabled us to introduce an increasing number of new products with each collection and dramatically shorten our product lead times from 12 – 18 months to 3 – 9 months and reduce product costs, which allow us to offer greater value to our customers. |
| • | Multi-Channel Go-To-Market Ability. We pursue a market-based rather than a channel-based sales strategy and allocate resources by market to maximize our return on invested capital. Our strategy is to |
84
Table of Contents
| size our product assortments to the potential of the market and to size our stores to the potential of the geographic area that each location serves. We leverage our direct channels to maximize reach, increase brand awareness and allow customers to access our complete product offering. Our channels are fully integrated and complement each other, with our stores acting as showrooms for our brand while our Source Books and our websites act as virtual extensions of our stores. Our stores allow our customers to experience our product collections in lifestyle settings and to consult with our highly qualified sales associates and interior designers to develop design solutions for their homes. We complement our stores with targeted catalog mailings, emails and catalog apps for Apple’s iPad and iPhone. In our stores, our sales associates use iPads and other devices to allow customers to shop our entire merchandise assortment while in the store. We believe that by offering a seamless experience across our stores and direct channels, we present a consistent brand image and inspire our customers to shop with us more often. This approach is designed to enhance our customer experience, generate greater sales, increase our market share and deliver higher returns on invested capital. |
| • | Fully Integrated Infrastructure. Our infrastructure is integrated across our multiple channels, providing three key advantages. First, we have strong direct sourcing capabilities and direct vendor relationships that contribute to shortened product lead times and reduced merchandise costs. Second, our inventory is centrally managed across our channels to drive working capital efficiency and optimize product availability. Third, our reconfigured distribution network and new order management, warehouse management and point-of-sale systems contribute to improved customer service levels, including shorter delivery times. Our systems platform has business intelligence reporting capabilities that provide multi-channel information which enable us to make timely and informed decisions across all aspects of our business. We believe our infrastructure provides us with a sophisticated operating platform and significant capabilities to support our future growth. |
Our High-Performance Culture and Team. We have built a high-performance organization driven by a company-wide commitment to our core values of People, Quality, Service and Innovation. The leadership team led by our Chief Executive Officer, Carlos Alberini, has significant expertise across all of our core functions, including brand management, product development, sourcing, supply chain, merchandising, finance and operations. Mr. Alberini is a highly respected financial and operational leader in the retail sector, having most recently served as President and Chief Operating Officer of Guess? from 2000 to 2010. Mr. Alberini is widely recognized in the industry for his role in helping to build Guess? into a leading global brand and business. We also benefit from the vision and advice of Gary Friedman, who serves as our Creator and Curator on an advisory basis. With over 24 years of experience in executive roles in the specialty home industry, Mr. Friedman is recognized as a creative force and design leader. We believe our high-performance culture and team are key drivers of our success and position us well to execute our long-term growth strategy.
Our Growth Strategy
Key elements of our growth strategy are to:
Transform Our Real Estate Platform. We believe we have an opportunity to significantly increase our sales by transforming our real estate platform from a mall-based retail footprint to a portfolio focused on full line Design Galleries. With a target size of approximately 21,500 square feet of selling space, our full line Design Galleries have approximately three times the selling square footage of our current average Gallery and allow consumers to experience a broader merchandise assortment in a highly differentiated retail setting. We have found that we experience higher sales across all of our channels when we showcase more of our assortment. We have identified approximately 50 key metropolitan markets where we can open new full line Design Galleries in iconic or high profile locations that are representative of our luxury brand positioning. We believe, based on our analysis of the market, that we have the opportunity to double our current selling square footage in the United States and Canada over the next 7 to 10 years as we transform our real estate platform by opening full line Design Galleries in these 50 identified markets.
85
Table of Contents
We opened our first two full line Design Galleries in Los Angeles in June 2011 and Houston in November 2011 where we consolidated demand by closing existing retail stores in each market. By offering a greater product assortment and raising the profile of our brand, in the Los Angeles market, we have increased store demand by over 90% and direct demand by over 30% in the first full year of operation of our new full line Design Gallery. In the Houston market, in the first 9 months of operation of the new full line Design Gallery, we have increased store demand by over 60% and direct demand by over 50%. Over the next 24 months, we plan to open full line Design Galleries in iconic or high profile locations in Scottsdale, Boston, Greenwich (Connecticut) and Atlanta. We are also actively exploring opening Design Galleries in other key markets such as New York City, Miami, Dallas and Chicago. We have opened two Galleries in 2012 and plan to open one Gallery in 2013.
Expand Our Offering and Increase Our Market Share. We participate in the domestic housewares and home furnishings market, that based on our research we believe represented $143 billion in sales in 2010. Our annual net revenues currently represent less than 1% of this market, and we believe we have a significant opportunity to increase our market share as more customers are exposed to our growing merchandise assortment and as introductions of new products and services inspire current and new customers to add to their collections. We believe our dominant assortments and continued expansion of product categories enable us to change the highly fragmented luxury home furnishings landscape and grow our market share. We apply our unique design aesthetic and superior product development capabilities to bring a fresh and differentiated perspective to existing and new product categories, new services and new businesses:
| • | Increase Product Categories and Assortments. Over the past few years we have successfully expanded our offering across our categories. We are continuing this strong level of innovation with a number of initiatives in 2012, including in: (i) indoor and outdoor furniture, where we continue to broaden our assortments in upholstery, dining and occasional; (ii) smaller home furnishings products, which we call our Big Style, small spaces collection; (iii) rugs, where we continue to significantly enhance our collection developed by Ben Soleimani of Mansour Rug, a 4th generation, family rug business known for its innovative designs; and (iv) baby and child products, where we will continue to expand our assortments in furniture, textiles and décor. We have a successful record of new category introductions, including Outdoor in Spring 2006, Baby & Child in Spring 2008, Garden in Spring 2010 and Big Style, small spaces in Spring 2012. We plan to continue introducing select new product categories, such as hard window coverings in Fall 2012 and Tabletop in 2013, where we can offer a dominant merchandise assortment consistent with our brand positioning in other product categories. |
| • | Expand Services. We plan to provide our customers with a growing range of services designed to enhance the customer experience and optimize sales. We are developing and will be introducing in select locations our interior design services that provide our customers with complimentary in-store and in-home design consultation. Based on the results achieved to date with several tests in our full line Design Galleries, we believe that our interior design team will contribute to increased sales as they assist, inspire and influence customers in the manner in which they envision their homes. In addition, an expanded portion of our product offering can be customized to meet individual preferences, including different choices of materials, fabrics and finishes. We are also enhancing our existing registry services and believe that a significant opportunity exists to expand and improve our bridal and gift registry businesses with the expansion of our Baby & Child offering and our planned introduction of Tabletop products. |
| • | Enter New Businesses. We believe we have the ability to leverage our defining strengths of taste, style and innovation across multiple businesses, which can enhance brand awareness, reinforce our lifestyle positioning and enrich the customer experience. We plan to explore and test from time to time new business opportunities complementary to our core business which can capitalize on our unique development model, such as an Art & Culture category, which could include works of art by independent artists. We believe we can scale new businesses rapidly, leveraging our fully integrated multi-channel infrastructure and providing a powerful platform for continued long-term growth. |
86
Table of Contents
Increase Brand Awareness. We will continue to increase our brand awareness and customer loyalty through our real estate transformation, our circulation strategy, our digital and social media marketing initiatives and our increased advertising and public relations efforts.
| • | Real Estate Positioning. Our stores are a critical branding vehicle, as approximately 55% of new customers are acquired through our stores. We believe the transformation of our real estate platform from a mall-based retail footprint to a portfolio focused on full line Design Galleries will contribute to increased brand awareness as our customers experience an enhanced expression of our luxury brand positioning. |
| • | Circulation Strategy. Our catalogs are also an important branding and advertising vehicle. We plan to continue expanding and optimizing our catalog page count and circulation, as well as mailing new households. We have found that when we display a greater merchandise assortment in our catalogs, we experience increased sales across all of our channels. Since Spring 2011, we have pursued our Source Book strategy, whereby we distribute to a higher number of households dominant catalogs that feature expanded page counts and present over 85% of our product assortment at the time of publication. This strategy contributed to a 41% increase in the number of catalog pages circulated and a 27% increase in net revenues for our direct business in fiscal 2011. We plan to increase the number of catalog pages circulated in fiscal 2012 by more than 75%. |
| • | Digital and Social Media Initiatives. We are investing in enhanced marketing initiatives for our e-commerce business, which we believe will result in greater website traffic and sales. Our websites display our most comprehensive product assortment and serve as critical tools for introducing and testing new products. We are continually enhancing the navigation and presentation features of our websites, which enable our customers to develop design solutions for themselves. In order to increase traffic to our websites, we have increased our email marketing efforts and have developed catalog apps for Apple’s iPad and iPhone, which provide an additional means for our customers to view and purchase our growing product assortment. |
| • | Advertising and Public Relations Efforts. We proactively market our brand through public relations and print advertisements in brand relevant publications such as Architectural Digest, Vanity Fair, Elle Décor, House Beautiful, Veranda and Town and Country. In addition, we plan to continue to host in-store events related to new store openings and product launches. We believe that increased brand awareness will drive higher sales in our stores and our direct business over time. |
Pursue International Expansion. We plan to strategically expand our business into select countries outside of the United States and Canada over the next several years. We believe that our luxury brand positioning and unique aesthetic will have strong international appeal. We expanded into the Canadian market in 1998 and successfully built our presence into a multi-channel business featuring five retail locations and in-market catalog and online capabilities. We intend to leverage this experience as we expand our business internationally.
Increase Operating Margins. We have the opportunity to continue to improve our operating margins by leveraging our fixed occupancy costs and scalable infrastructure, and by expanding our merchandise margins. We believe that our real estate transformation will allow us to better leverage our fixed occupancy costs by consolidating multiple Galleries into single full line Design Galleries, opening locations outside of malls that tend to have lower lease costs per square foot, reducing non-selling backroom space and closing unproductive stores. Our full line Design Galleries are architected to offer more compelling unit economics by increasing the selling square footage devoted to our retail assortment and utilizing non-traditional selling space such as rooftops and garden courtyards, which carry much lower occupancy costs than the typical retail space. We have a well-developed, scalable infrastructure that is positioned to support our revenue growth without a proportionate increase in operating expenses. We believe we can further increase our merchandise margins by: (i) continuing to benefit from our direct sourcing initiatives, whereby we eliminated most buying agents and generally procure merchandise directly from our vendors; (ii) optimizing product pricing and utilizing more targeted promotions
87
Table of Contents
through improved data analysis; and (iii) using new merchandise planning systems to manage inventory more efficiently across all of our channels.
Our High-Performance Culture
We believe that to know our Company, you have to know our culture and our values. We are a team of people who believe we can change the world. We believe in our ability to create an endless reflection of hope, inspiration, passion and love that will ignite the human spirit and transcend our existence.
Our culture is driven by our management team, which instills a company-wide commitment to our core values. Every leader in our Company participates in a training program annually and signs our Leadership Contract, a commitment to model and teach our values. We believe our distinct corporate culture allows us to attract highly talented team members who are passionate and driven and who share our vision. Our Company’s core values are:
| • | People—We believe the “right” people are our greatest asset. We value people with high energy, who possess the ability to energize others. People who are smart, creative and have a point of view. People who see the answer in every problem, versus those who see the problem in every answer. People who are driven, determined and won’t take “no” for an answer. We value team players, people who are more concerned with what is right, rather than who is right. |
| • | Quality—Quality starts with our people and should be visible in every aspect of our Company. From our people to our products, to our service and our standards, from the way we communicate to our commitment to educate. From the accuracy and efficiency in our distribution facilities, to the marketing and presentation of our products in our stores, catalogs and websites. Being committed to quality means being able to see it in every detail of our organization. |
| • | Service—We believe that service starts inside the organization and embrace a concept called “People First.” Simply put, it means “if we expect our people to deliver first class service to our customers, we must first deliver first class service to our people.” It is everyone’s responsibility to remove the obstacles and provide support so our associates throughout the organization are empowered to “Do the right thing.” Our people smile when we smile, our people serve our customers when we serve our people. |
| • | Innovation—We value innovation, taking risks and boldly going where no company has gone before. We believe you’re either striving to get better, or allowing yourself to get worse, there is no such thing as staying the same. The power of innovation comes from leveraging the creative minds and spirit of all our people at all levels of the organization. We strive to build an environment that encourages people to challenge, ask “why?” and “why not?” We embrace those people who have the courage to put forth new ideas and breathe new life into our Company. Innovation is at the core of what we do. |
Evolution of Our Business
In 2001, we began to reposition Restoration Hardware from a nostalgic, discovery-items business to a leading home furnishings brand. In 2008, we were taken private by investment funds affiliated with Catterton, Tower Three and Glenhill. Our strategic plan at the time of the going private transaction required significant investments in infrastructure to develop our distribution center in West Jefferson, Ohio and other initiatives to improve our merchandise delivery capabilities. As part of the going private process, we received access to additional equity capital from our investors and as a result we were able to accelerate the transformation of our business and brand and the development of our multi-channel business model and infrastructure. Over the last eleven years, we have built a new company through the following initiatives:
| • | Elevated Our Brand Positioning—We significantly enhanced the quality and design of our merchandise, elevating our brand to a luxury positioning. We believe this strategy, along with our |
88
Table of Contents
| compelling combination of design, quality and value, have allowed us to change the highly fragmented home furnishings landscape and position us to grow our market share. |
| • | Enhanced Our Product Development Process—We established a collaborative organization with cross-functional teams in product development, sourcing, merchandising, inventory and creative, all focused on product leadership. We built the Restoration Hardware Center of Innovation & Product Leadership, a facility which supports and streamlines the entire product development process. In addition, we have developed direct sourcing relationships with our artisan partners. The transformation of our creative process has dramatically shortened our typical product lead times, reduced our product costs and enhanced our ability to successfully introduce new categories. |
| • | Refined Our Go-To-Market Strategy—We aligned our organization and the way in which we approach the consumer to pursue a market-based rather than channel-based sales strategy across our stores and direct channels. Our strategy is to size our product assortments to the potential of the market and to size our stores to the potential of the geographic area that each location serves. We believe this approach enables us to strategically deploy our resources by market to maximize return on invested capital. In order to expose more customers to a broader product assortment we use our Source Books and websites as virtual extensions of our stores. We introduced our new Source Book large catalog format that displays a greater percentage of our product assortment, which we believe is continuing to increase sales across all of our channels because customers respond to the assortments that we emphasize and feature prominently both in our catalogs and in our stores. |
| • | Reconceptualized Our Stores and Developed Full Line Design Gallery Format—In 2009 and 2010, we remodeled substantially all of our existing retail stores into our Gallery format that reconceptualizes the store experience by presenting our products in sophisticated lifestyle settings. We experienced enhanced productivity and profitability as a result of our Gallery conversions. In 2011, we developed our full line Design Gallery format, which offers approximately three times the selling square footage of an average Gallery. This format is architected to offer more compelling unit economics by increasing the selling square footage devoted to our retail assortment and utilizing non-traditional selling space such as rooftops and garden courtyards, which carry much lower occupancy costs than the typical retail space. |
| • | Built a New Supply Chain and Systems Infrastructure—We invested over $60 million from fiscal 2006 to fiscal 2010 in our supply chain and systems infrastructure, including: (i) reconfiguring and adding to our distribution network; (ii) implementing new point-of-sale, warehouse management, order management and customer service systems; and (iii) enhancing our direct sourcing capabilities. |
| • | Strengthened Our Management Team—We strengthened our management team by adding Mr. Alberini to our team as well as other senior leaders in merchandising, product development, finance, information technology and inventory planning who bring extensive experience in their respective fields. |
89
Table of Contents
We believe these initiatives have contributed to our recent strong performance and increased profitability, and position us for sustained growth and profitability. The following chart illustrates some of the principal aspects of the transformation of the old Restoration Hardware to the new RH:
| Old Restoration Hardware |
New RH | |||
| Merchandise Strategy |
Nostalgic, discovery items | Category dominance, integrated lifestyle presentation | ||
| Product Development |
Internally designed and developed (12 – 18 months lead time) | Externally discovered and curated (3 – 9 months lead time) | ||
| Go-to-Market Strategy |
Conventional channel-focused marketing | Fully integrated market-based, multi-channel strategy | ||
| Retail Strategy |
Multiple small locations in a given market showcasing narrow and redundant assortment | Consolidated markets, generally featuring larger locations showcasing broader assortment | ||
| Direct Strategy |
84-page catalog; limited mailing list; nascent e-commerce platform | Over 1,100 pages across Home, Outdoor & Garden and Baby & Child catalogs; broader mailing list; established e-commerce platform | ||
| Sourcing |
Traditional agent buying structure | Highly collaborative direct vendor relationships | ||
| Supply Chain & Systems |
Channel specific architecture | Fully integrated multi-channel platform | ||
Our Market
We participate in the large and growing domestic housewares and home furnishings market. Based on our research, we believe this market generated $143 billion in retail sales in 2010 and is projected to grow at a compound annual growth rate of 3% – 4% between 2011 and 2015. Our annual net revenues currently represent less than 1% of this market, providing us with a substantial opportunity to gain market share. We believe the seven major categories in the housewares and home furnishings market are the following: indoor furniture, textiles, dishes and flatware, bath, lighting, outdoor furniture, and carpets and floor coverings. Based on our research, we believe that indoor furniture represented the largest percentage of the market in 2010 at 43%, or $62 billion in total sales, and textiles represented the second largest segment. We believe that our dominant merchandise assortments and differentiated product designs in these key categories will enable us to increase our market share.
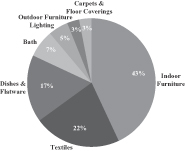
According to Euromonitor International, a market research and analysis firm, the U.S. housewares and home furnishings market is highly fragmented. The top 20 companies comprised only 20% of the total market in 2008, with the largest player representing less than 3% of the total market. As a result of the weakening housing market
90
Table of Contents
and economic downturn in 2007, many home furnishings retailers were forced to close stores, dramatically scale back operations or lower prices. Companies such as Bombay Company, Smith & Hawken, Linens ‘n Things, Z Gallerie and Levitz declared bankruptcy or liquidated, while many others were weakened. While our sales results were also adversely affected during this period, this disruption also created an opportunity for us to differentiate our brand in the marketplace. We believe we are well positioned to gain market share in the current competitive environment as a result of our compelling combination of design, quality and value.
We target households with incomes of $200,000 and higher, which we believe drive a disproportionate share of spending in the home furnishings market. We believe that these consumers are highly attractive as they tend to be less impacted by an economic downturn and return to spending more quickly in an economic recovery.
Our Products
We are merchants of luxury home furnishings offering collections of timeless, updated classics and reproductions. We operate as a curator of products that we regard as the finest historical design. Our luxury products embody our design aesthetic and reflect inspiration from across the centuries and around the globe. Our objective is to position Restoration Hardware as a lifestyle brand and design authority by offering dominant merchandise assortments across a growing number of categories, including furniture, lighting, textiles, bathware, décor, outdoor, garden, and baby and child products.
91
Table of Contents
The following is a description of our primary product categories:
| Category |
Select Products Offered |
Select Product Highlights | ||
| Furniture |
• Bedroom • Dining • Upholstery • Home Office • Media • Cabinets |
Our bedroom collections reflect classical 18th and 19th century designs with handcrafted artisan details and fine English construction in styles such as the St. James, French Empire, Warner and Vienne. Our dining room collections use architecturally inspired new and salvaged wood in both classic and contemporary designs and include the Russian Oak, Trestle and Farmhouse collections. Our home office products include vintage and industrial-inspired desks, seating and storage solutions reconceived for the home office, including the Aviator Wing Desk, inspired by World War II fighter planes and the Mayfair Steamer Secretary Trunk, created in collaboration with antiques dealer and furniture maker Timothy Oulton of London, England. In Fall 2012, we added coffee and ebony finishes to many of our wooden furnishings. | ||
| Lighting |
• Ceiling • Table • Floor • Wall • Outdoor |
Our lighting designs and reproductions draw from architectural and historical pieces. In Fall 2012, we introduced an industrial forged iron chandelier designed by blacksmith Jon Sarriugarte and the 1920s Odeon glass fringe chandelier. We carry a comprehensive assortment of floor, table wall and ceiling lighting. | ||
| Textiles |
• Bed Linens • Bath Linens • Drapery • Rugs • Pillows & Throws |
We offer fine Italian bedding, which includes our signature Italian hotel collection, designed in close partnership with Carlo Bertelli, a proprietor of a Florentine atelier recognized for luxurious Italian linen. Our bath linens use fine 100% Turkish cotton terry cloth with meticulous hand sewn detail, and are sourced in partnership with Haluk Eke of Turkey. Our drapes are made of high quality fabrics that include Libeco Ligae Belgian linen, Thai Silk and vintage velvet. We have further expanded our rug collections in Fall 2012 based on the successful introduction in Fall 2011 of rugs designed by Ben Soleimani of Mansour Rug. In Fall 2012, we introduced an exclusive line of roman shades and wood blinds with our partners from The Shade Store and the bespoke garment-dyed bed linen assortment designed by Matthew Lenoci. | ||
| Bathware |
• Faucets • Hardware • Furniture • Sinks |
Our bath faucets are made from drop forged brass and available in several finishes. Our fittings are German-made and feature drip-free valves. Our furniture and sink collections reflect classic designs and are made of fine materials. In Fall 2012, we added coffee and ebony finishes to many of our wood bath collections. | ||
| Décor |
• Decorative Accessories • Home Accessories • Wall Art • Gifts |
Our décor assortment is centered around beautiful accents for the home in objects, frames, candlelight and wall art. Our holiday assortment features an assortment of vintage inspired ornaments and carefully curated gifts. We plan to introduce Tabletop into our assortment, complete with dinnerware, flatware and table linens, in 2013. | ||
| Outdoor & Garden |
• Furniture • Textiles • Lighting • Accessories • Fire • Shade |
We carry 24 collections of outdoor furniture that feature teak, metal and all-weather wicker available in custom finishes. We partner with Perennials and Sunbrella to create a collection of outdoor fabrics for our cushions and umbrellas. Our Garden collection is focused on completing the outdoor space with statuary, fire tables, garden structure, containers and lanterns. | ||
| Baby & Child |
• Furniture • Bedding • Window Coverings • Flooring • Lighting • Décor |
We developed Baby & Child as an extension of our brand, offering the same level of quality and design for children’s furnishings as we offer for the rest of the home. We offer core categories for both nurseries and children’s rooms. Our furniture collections are inspired by 18th and 19th century European designs, vintage industrial styles and French antiques, all built with the same level of quality as our home brand. Within textiles, we offer European bedding, Turkish towels, high-quality lined drapery, roman shades, and wool rugs. Our accessories include wall décor, storage solutions and playroom accents, inspired by vintage finds, industrial design and classic style and function. | ||
92
Table of Contents
We are in the process of expanding the following existing categories: (i) indoor and outdoor furniture, where we continue to broaden our assortments in upholstery, dining and occasional; (ii) smaller home furnishings products, which we call our Big Style, small spaces collection; (iii) rugs, where we continue to significantly enhance our collection developed by Ben Soleimani of Mansour Rug, a 4th generation, family rug business known for its innovative designs; and (iv) baby and child products, where we will expand our assortments in furniture, textiles and décor. We plan to continue introducing select new product categories, such as hard window coverings in Fall 2012 and Tabletop in 2013, where we can offer a dominant merchandise assortment consistent with our brand positioning in other product categories.
We have a successful record in introducing complementary product categories, including Outdoor in Spring 2006, Baby & Child in Spring 2008, Garden in Spring 2010 and Big Style, small spaces in Spring 2012. Each of these new product categories was introduced as a new, standalone catalog. Historically, once a category is tested and proven in our direct business, we selectively roll out an edited collection of the products in our stores. We believe this approach allows us to efficiently launch categories in a disciplined, expeditious and cost-effective manner. For example, our Garden collection took seven months from concept to introduction, with minimal additional resources required to launch.
Product Development
Over the past several years we have architected a proprietary product development platform that is fully integrated from ideation to presentation. We have streamlined our product development organization and process to shorten product lead times and enhance our ability to introduce more new products with each collection. We believe that our new product development organization, process and facility allow us to deliver home furnishings with a compelling combination of design, quality and value. Key aspects are:
| • | Organization—We have established a collaborative, cross-functional organization centered on product leadership and coordinated across our product development, sourcing, merchandising, inventory and creative teams. Our product teams are focused on maximizing the sales potential of each product category across all channels, which eliminates the channel conflicts and functional redundancies often found in other retail organizations. |
| • | Process—For many of our products, we work closely with our network of artisan partners who possess specialized product development and manufacturing capabilities and who we consider an extension of our product development team. We collaborate with our global network of specialty vendors and manufacturers to produce artisanal pieces on a large scale with a high level of quality and value, including both distinctive original designs and reinterpretations of antiques. |
| • | Facility—We have built the Restoration Hardware Center of Innovation and Product Leadership, a facility which supports the entire product development process, from product ideation to presentation for all channels. |
As a result of our proprietary organization, process and facility, we have shortened our typical product lead times from 12 – 18 months to 3 – 9 months and enhanced our ability to introduce more new products with each collection. In addition, our product development platform, sourcing capabilities and significant scale have enabled us to reduce our product costs, which allows us to offer greater value to our customers.
Sales Channels
We distribute our products through a fully integrated sales platform comprised of our stores, catalogs and websites. We believe the level of integration among all of our channels and our approach to the market distinguishes us from most other retailers. For fiscal 2011, sales of products originating in our stores represented 56% of our net revenues, while sales from our direct business represented 44% of our net revenues. We believe our channels complement each other and our customers’ buying decisions are influenced by their experiences across more than one of our sales channels. We encourage our customers to shop across our channels and have
93
Table of Contents
aligned our business and internal organization to be channel agnostic. Our integrated distribution and product delivery network serves all of our channels.
We believe the key advantage of our multiple sales channels is our ability to leverage the unique attributes of each channel in our approach to the market. Our catalog mailings serve as a key driver of sales through both our websites and retail stores. Through our Source Book strategy, we have expanded the page count and circulation of our catalogs to expose more customers to a broader product assortment. Our customers respond to the Source Books across all of our channels, with sales trends closely correlating to the assortments that we emphasize and feature prominently both in our Source Books and in our stores. Our retail stores reinforce our luxury brand aesthetic and showcase product collections in lifestyle settings consistent with the presentation in our direct channels. In addition, our store associates use Apple iPads and other devices to allow customers to shop our entire merchandise assortment while in the store.
We maintain a database of customer information, which include sales patterns, detailed purchasing information, certain demographic information, geographic locations and email addresses of our customers. As of July 28, 2012, our customer database contained 13.6 million names. This database supports our ability to analyze our customers’ buying behaviors across sales channels and facilitates the development of targeted marketing strategies. We segment our customer files based on multiple variables, and we tailor our catalog mailings and emails in response to the purchasing patterns and product needs of our customers. We focus on continually improving the segmentation of customer files and the expansion of our customer database.
In addition to our core channels, we are also expanding into professional services channels, including Trade and Contract. In the Trade channel, we work directly with independent interior designers purchasing for their businesses. Separately, we sell directly to customers who make purchases with the assistance of their own interior designers or decorators, which we refer to as “designer-assisted sales.” We are also expanding our Contract business, which services hospitality, real estate development, and other business clients. These channels offer additional avenues for reaching new customers, including both businesses and individuals. For fiscal 2011, our Trade and Contract businesses generated combined net revenues of $17.3 million, which amount does not include designer-assisted sales. We believe there is substantial opportunity for us to grow these businesses.
Stores
Retail Stores
As of July 28, 2012, we operated a total of 73 retail stores throughout the United States and Canada, consisting of 71 Galleries and 2 full line Design Galleries. Our retail stores are located primarily in upscale malls and street locations. We believe situating our stores in desirable locations with high visibility is critical to the success of our business, and we identify store locations based on several store specific aspects including geographic location, demographics, and proximity to other high-end specialty retail stores. We pursue a market based sales strategy, whereby we assess each market’s overall sales potential and how best to approach the market across all of our channels. We customize square footage and catalog circulation to maximize each market’s sales potential and increase our return on invested capital.
We operate three distinct store types: (1) our full line Design Gallery format, typically between 22,000 and 28,000 gross square feet, (2) our existing Gallery format of approximately 7,000 – 15,000 gross square feet, and (3) our Baby & Child Gallery format of approximately 2,000 – 3,000 gross square feet. Substantially all of our existing stores are Galleries. We are transforming our real estate portfolio from a mall-based retail footprint to a portfolio based on full line Design Galleries, which are sized to maximize the potential of each market. In key metropolitan markets, we will continue to open full line Design Galleries and in small to mid-sized markets, we expect to continue to open and operate Galleries. We have two stand-alone Baby & Child Galleries, one in Corte Madera, California and the other in Houston, Texas. We will evaluate potential opportunities for additional Baby & Child Galleries either as stand-alone locations or within our full line Design Galleries.
94
Table of Contents
Our store formats convey a design aesthetic and shopping environment that is highly differentiated from other home furnishings retailers. We have reconceptualized the customer experience by showcasing products in a sophisticated lifestyle setting that we believe is on par with world-class interior designers, consistent with the imagery and product presentation featured in our catalogs and on our websites. Products in our stores are presented in fully appointed rooms, emphasizing collections over individual pieces. This encourages a higher average order value as customers are inspired to purchase a full collection of products to replicate the design aesthetic found in our stores. We have optimized our selling space to display a greater number of products, resulting in higher sales productivity and profitability.
On average, our Gallery stores display less than 25% of our current assortment due to their space constraints. Based on our historical performance, when a product is presented on the selling floor, we experience a significant increase in sales for that product across all of our channels. We have designed a new store model, the full line Design Gallery, which significantly enhances our merchandise presentation and customer experience, to capitalize on this opportunity for sales growth.
Full line Design Galleries are shopping destinations in iconic or high profile locations with high customer visibility that enhance the Restoration Hardware brand. In general, they are planned with approximately 15,000-20,000 square feet of interior selling space and 4,000 – 7,000 square feet of outdoor selling space, including courtyards and rooftop terraces that feature outdoor and garden products. These locations will offer an average of three times the selling square footage of our current average Galleries and will display a much greater percentage of our current product assortment. In addition, we may introduce new complementary brand-enhancing businesses in our full line Design Galleries, such as a Hospitality business, which could include a café or restaurant adjacent to, or inside of, select full line Design Galleries.
We expect that our full line Design Galleries will capture demand from larger market areas and allow us to close select existing locations, thereby eliminating unnecessary duplication of our assortment, optimizing our working capital investment and reducing occupancy costs and other expenses. We have identified approximately 50 markets in which we plan to execute this strategy, which began in Los Angeles in June 2011 and Houston in November 2011. By offering a greater assortment and raising the profile of our brand, in the Los Angeles market, we have increased store demand by over 90% and direct demand by over 30% in the first full year of operation of our new full line Design Gallery. In the Houston market, in the first 9 months of operation of the new full line Design Gallery we have increased store demand by over 60% and direct demand by over 50%. Over the next 24 months, we plan to open full line Design Galleries in iconic or high profile locations in Scottsdale, Boston, Greenwich (Connecticut) and Atlanta. We are also actively exploring opening full line Design Galleries in other key markets such as New York City, Miami, Dallas and Chicago. We believe this strategy will enhance our sales, profitability and return on invested capital in key markets while making a powerful brand statement, as our full line Design Galleries heighten the visibility of our brand with customers and underscore our position as a destination for luxury home furnishings.
For full line Design Galleries, we target locations with approximately 25,000 gross square feet, including approximately 21,500 selling square feet. Our capital investment to open a target full line Design Gallery is approximately $250 per gross square foot, net of landlord contributions of approximately $25 per gross square foot. Our expected initial inventory investment is approximately $1,375,000, which includes store inventory and working capital to support projected sales volumes. Our expected pre-opening expenses are approximately $500,000. We target annual sales per selling square foot of approximately $850, and a store level cash contribution margin of approximately 27% of sales. We target an average payback period of approximately 20 months on our initial investment.
Our Galleries are generally located in premium shopping malls and street locations. Our Galleries have an average of approximately 10,800 gross square feet and 6,800 selling square feet. However, we target new locations to have approximately 12,000 gross square feet and 9,500 selling square feet. Our capital investment to open a Gallery is approximately $115 per gross square foot, net of landlord contributions of approximately $100
95
Table of Contents
per gross square foot. Our expected initial inventory investment is approximately $650,000, which includes store inventory, as well as working capital to support projected sales volumes, and our expected pre-opening expenses are approximately $200,000. We target annual sales per selling square foot of approximately $550, and a store level a store level cash contribution margin of approximately 20% of sales, which is higher than our historical store level cash contribution margin. We target an average payback period of approximately 25 months on our initial investment. We have opened two Galleries in 2012 and plan to open one additional Gallery in 2013.
The table below highlights certain information regarding our retail stores open during the three years ended January 28, 2012, and through July 28, 2012.
| Fiscal Year | Six Months Ended July 28, 2012 |
|||||||||||||||
| 2009 | 2010 | 2011 | ||||||||||||||
| Stores open at beginning of period |
99 | 95 | 91 | 74 | ||||||||||||
| Stores opened |
— | 4 | 5 | 2 | ||||||||||||
| Stores closed |
(4 | ) | (8 | ) | (22 | ) | (3 | ) | ||||||||
|
|
|
|
|
|
|
|
|
|||||||||
| Stores open at end of period |
95 | 91 | 74 | 73 | ||||||||||||
|
|
|
|
|
|
|
|
|
|||||||||
We continually analyze opportunities to selectively close stores which have been under-performing, will be consolidated in connection with openings of our full line Design Galleries or are no longer consistent with our brand positioning. We closed three stores in the first six months of fiscal 2012, and anticipate that we will close an additional four stores by the end of fiscal 2012. In many cases, we operated the store until lease expiration in order to effect the closure in a cost-efficient manner. In fiscal 2011, we recorded a charge of approximately $3.2 million, relating primarily to closing stores prior to lease expiration.
The following list shows the number of retail stores operated in each state and each province in Canada as of July 28, 2012:
| Location |
Store | Location |
Store | Location |
Store | |||||||||||
| Alabama |
1 | Massachusetts | 2 | Rhode Island | 1 | |||||||||||
| Arizona |
1 | Michigan | 1 | Tennessee | 1 | |||||||||||
| California |
16 | Minnesota | 1 | Texas | 6 | |||||||||||
| Colorado |
1 | Missouri | 2 | Utah | 1 | |||||||||||
| Connecticut |
3 | New Jersey | 2 | Virginia | 2 | |||||||||||
| Florida |
4 | New York | 3 | Washington | 1 | |||||||||||
| Georgia |
1 | North Carolina | 2 | Wisconsin | 1 | |||||||||||
| Illinois |
4 | Ohio | 3 | District of Columbia | 1 | |||||||||||
| Indiana |
1 | Oklahoma | 1 | Alberta | 2 | |||||||||||
| Louisiana |
1 | Oregon | 1 | British Columbia | 1 | |||||||||||
| Maryland |
1 | Pennsylvania | 2 | Ontario | 2 | |||||||||||
|
|
|
|||||||||||||||
| Total | 73 | |||||||||||||||
|
|
|
|||||||||||||||
Outlet Stores
As of July 28, 2012, we operated 10 outlet stores in 9 states. Our outlet stores are branded as Restoration Hardware Outlet and located primarily in large outlet-malls. Our outlet stores serve as an efficient means to sell discontinued or irregular inventory outside of our core sales channels.
Source Books
We produce a series of catalogs to showcase our merchandise assortment, including our Home, Outdoor & Garden and Baby & Child catalogs. Our catalogs are one of our primary branding and advertising vehicles. We
96
Table of Contents
have been expanding the page counts of our catalogs which allows us to showcase nearly our entire product assortment. We refer to these larger catalogs as Source Books. For example, our Fall 2012 Source Books present over 85% of our product assortment at the time of publication. As in our retail stores, our catalogs present our merchandise in lifestyle settings that represent our unique design aesthetic. Our Source Books also feature profiles of select artisan vendors and other compelling editorial content regarding home décor. All creative work on our catalogs is coordinated by our in-house personnel in our Restoration Hardware Center of Innovation & Product Leadership, providing us greater control over the brand image presented to our customers while also reducing our catalog production costs.
We use our catalogs to drive sales across all of our channels, and we generally experience increased sales of the products featured in our catalogs. We mail our catalogs to addresses from our proprietary customer database, as well as to addresses provided to us by third parties. We also use customer data that we collect to determine which prospective customers are most likely to respond to our catalogs.
Our catalogs, in concert with our e-commerce channel, are a cost-effective means of testing new products, and allow us to launch categories in a disciplined, expeditious and cost-effective manner. For example, our Garden launch took seven months from conception to introduction, with minimal additional resources required.
E-Commerce
Our primary websites, located at www.restorationhardware.com and www.rh.com, provide our customers with the ability to purchase our merchandise online. In May 2008, we launched www.rhbabyandchild.com, an e-commerce enabled website devoted to our baby and child category. In May 2011, we launched catalog apps for Apple’s iPad and iPhone that enable customers to view and purchase our growing product assortment.
Our e-commerce platform provides simplicity and ease of use while allowing customers to experience the Restoration Hardware lifestyle reflected in our catalogs and throughout our stores. We update our website on a regular basis to reflect product availability and special offers. In fiscal 2011, our websites logged over 14.3 million unique visits, an increase of 18% over fiscal 2010.
We display substantially all of our current product assortment on our websites. The websites also offer a room-based navigation, which allows the customer to envision and shop items by room or by product, expanding on the richness of the online experience. For example, customers can search our website for products by size or color, browse through our extensive product categories and see detailed information about each item and collection, such as dimensions, materials and care instructions. Additionally, customers can select color swatches and view merchandise displayed with different color and fabric options.
Marketing and Advertising
We employ a variety of marketing and advertising vehicles to drive customer traffic across all our channels, strengthen and reinforce our brand image and acquire new customers. These include targeted catalog circulation, promotional mailings, email communications, online and print advertisements and public relations activities. We maintain a database of 13.6 million customers, which includes sales patterns, detailed purchasing information, demographic data, geographic locations and postal and email addresses. We use this information to tailor our programs and increase productivity of our marketing and promotion initiatives. We leverage our marketing and advertising expenses across all our channels as we seek to optimize the efficiency of our investment.
Our stores and our catalogs are the primary branding and advertising vehicles for the Restoration Hardware brand. The highly-differentiated design aesthetic and shopping environment of our stores drive customer traffic not only to our stores but also to our direct channels. Approximately 55% of new customers are acquired through our stores, where we collect customer addresses and emails. Our catalogs and targeted emails further reinforce the Restoration Hardware brand image and drive sales across all of our sales channels. We also engage in a wide
97
Table of Contents
range of other marketing, promotional and public relations activities to promote our brand. These campaigns include media coverage in design, lifestyle, culture/society and specialty publications, as well as in-store events related to new store openings and product launches. We also engage print advertising in brand-relevant publications such as Architectural Digest, Vanity Fair, Elle Décor, Veranda, House Beautiful, Town and Country and others, and from time to time have also engaged in online advertising. We believe that these efforts will drive increased brand awareness, leading to higher sales in our stores and our direct business over time.
Sourcing
We do not own or operate any manufacturing facilities; instead, we contract with third-party vendors for the manufacture of our merchandise. Our sourcing strategy focuses on identifying and using vendors that can provide the quality materials and fine craftsmanship that our customers expect of our brand. To ensure that our high standards of quality and timely delivery of merchandise are met, we work closely with vendors and manufacturers. We seek to ensure the consistent quality of our manufacturers’ products by selectively inspecting pre-production samples, conducting periodic site visits to certain of our vendors’ production facilities and by selectively inspecting inbound shipments at our distribution facilities. In fiscal 2011, we sourced approximately 75% of our purchase dollar volume from approximately 40 vendors and no vendor accounted for more than 15% of our purchase dollar volume. Based on total dollar volume of purchases for fiscal 2011, approximately 77% of our products were sourced in Asia, the majority of which originated from China, 16% from the United States, 6% from Europe and the remainder from other regions.
We have a limited number of long-term merchandise supply contracts but we believe that we generally have strong relationships with our product vendors. Although we transact business primarily on an order by order basis, we typically work with many of our vendors over extended periods of time, and many vendors are making long term capacity investments to serve our increasing demands. We are currently engaged in a sourcing initiative to develop closer relationships with our vendors in order to achieve better efficiencies and further improve our product development process. Over the last several years, we have eliminated the use of most third party purchasing agents in favor of a model in which we directly manage our vendors. We have achieved significant cost savings and other efficiencies from this initiative.
Distribution and Delivery
We manage the distribution and delivery of our products through six facilities, each of which serves all of our sales channels:
| • | Our West Jefferson, Ohio facility, which we opened in 2008, is approximately 805,000 square feet with the capacity to expand an additional 400,000 square feet. It serves as our distribution center for all of our small package direct-to-customer orders and retail store replenishment, as well as a furniture home delivery hub for surrounding areas including metropolitan areas in Ohio, Kentucky and Indiana. |
| • | Our Baltimore, Maryland facility is approximately 508,000 square feet. It serves as a furniture distribution center for the Eastern and Central regions of the United States and Canada, as well as a furniture home delivery hub for the greater Washington, D.C. metropolitan area and the greater New York/New Jersey metropolitan area. |
| • | Our North East, Maryland facility, which we opened in February 2012, is approximately 600,000 square feet and is located near our Baltimore facility. It serves as a second furniture distribution center for the Eastern and Central regions of the United States and Canada. We plan on expanding this site to 1,200,000 square feet by the end of 2012. |
| • | Our Mira Loma, California facility, which we opened in 2011, is approximately 886,000 square feet. It serves as our furniture distribution center for the Western regions of the United States and Canada, as well as a furniture home delivery hub for the greater Los Angeles metropolitan area. |
| • | Our Tracy, California facility is approximately 151,000 square feet. It serves as a furniture home delivery hub for the San Francisco Bay Area market. In December 2011, we leased approximately |
98
Table of Contents
| 133,000 additional square feet of short-term, temporary storage within the same facility to also serve our furniture distribution network. |
| • | Our Avenel, New Jersey facility, which we opened in January 2012, is approximately 114,000 square feet. It serves as a furniture delivery hub for the greater New York/New Jersey metropolitan area. |
We offer a white glove home delivery service for larger furniture items and items delivered with multiple components, where our delivery personnel assist our customers by properly installing and assembling the product. We have recently increased our in-sourced home delivery operations in several key markets, while managing deliveries in other markets through third-party vendors. We plan to continue this trend of in-sourcing these services in additional markets over time to further leverage operating costs and improve our customers’ service experience, while reducing returns and damage to our products.
Through expansions and upgrades to our inventory warehousing, distribution and delivery operations over the last four years, we have improved our supply chain and distribution operations, and have built a scalable infrastructure with significant capabilities to support our future growth. We believe our enhanced supply chain and fulfillment operations allow us to manage customer orders and distribute merchandise to stores and customers in an efficient and cost-effective manner. We also believe that these upgrades have improved customer satisfaction by reducing delivery times, reducing damage to merchandise and improving the customer’s overall buying experience.
We intend to continue to strengthen our supply chain operations through a number of key initiatives in 2012 designed to improve our delivery logistics, reduce store replenish cycle times and achieve greater efficiencies in the management of our inventories.
Management and Information Technology
We use industry-standard information technology systems to provide customer service, business process support, and business intelligence across our sales channels. Over the past four years, our technology team has systematically upgraded several of our core systems, including:
| • | Implementing new order management and warehouse management systems to improve efficiencies, accuracy and service levels; |
| • | Implementing a platform upgrade to our e-commerce and search software products in support of our marketing strategy and customer ordering preferences; |
| • | Rolling out new point of sale systems, and in store iPads, with associated ordering tools, in all of our stores to support secure, in store purchasing; |
| • | Deploying a new business intelligence and data warehouse system that equips management with more timely analysis of the current business trends, results, and comparisons to our historical performance; and |
| • | Delivering a variety of supply chain enhancements to several key software systems that increase the efficiencies of operations, and enable our associates to deliver quality services. |
We believe these substantial upgrades to our information technology systems provide management with the ability to drive ongoing improvement in our operating model, focus on efficiency opportunities, and increase management control. New access to results through our technology tools also equips management to more timely identify, analyze and respond to business trends.
Over the next three years, we intend to further enhance our technology systems through a number of key initiatives as follows:
| • | Further upgrading our multi-channel ordering, supply chain and inventory management systems to maximize operating efficiencies; |
99
Table of Contents
| • | Enhancing our e-commerce websites’ capabilities to optimize the customer shopping experience; |
| • | Continuing our expansion of business intelligence capabilities and data warehouse management to optimize information for timely decision making; and |
| • | Utilizing state-of-the-art technology and tools to provide a unique and differentiated customer experience in our store. |
We are committed to a high level of integration in technology across our business. We believe our approach to technology demonstrates an appropriate balance of strategic planning and innovation to support both today’s business and tomorrow’s growth.
Competition
The home furnishings industry is highly competitive. We primarily compete against a large number of independent retailers that provide unique items and custom-designed product offerings at high price points, including antique dealers and home furnishings retailers who market to the interior design community. We also compete with national and regional home furnishings retailers and department stores. We also compete with mail order catalogs focused on home furnishings.
We believe we compete primarily on the basis of design, quality, value and customer service. We believe our distinct combination of design, quality and value allows us to compete effectively and we believe we differentiate ourselves from competitors based on the strength of our brand, products and our fully integrated multi-channel business model. We compete with the interior design trade and specialty merchants by providing a broader product assortment at an exceptional value based both upon the price and quality of our products. We compete against certain other home furnishings retailers primarily by offering what we believe is superior quality, highly distinctive design styles and a sophisticated lifestyle presentation in our product offering.
We also believe that our success depends in substantial part on our ability to originate and define product trends, as well as to timely anticipate, gauge and react to changing consumer demands. Certain of our competitors are larger and have greater financial, marketing and other resources than us. However, many smaller specialty retailers may lack the financial resources, infrastructure, scale and national brand identity necessary to compete effectively with us.
Employees
As of July 28, 2012, we had approximately 2,900 employees, of which approximately 1,000 were part-time employees. As of that date, approximately 1,700 of our employees were based in our stores. None of our employees is represented by a union, and we have had no labor-related work stoppages. We believe our relations with our employees are good.
Intellectual Property
The “Restoration Hardware” trademark and certain variations thereon, such as the Restoration Hardware logo, the Baby & Child logo and many trademarks used for our product lines are registered or are the subject of pending trademark applications with the U.S. Patent and Trademark Office and with the trademark registries of many foreign countries. In addition, we own many domain names, including “restorationhardware.com,” “rh.com,” “rhbabyandchild.com” and others that include our trademarks. We also have pending patent applications for some of our proprietary product designs and own copyrights in our catalogs and websites. We believe that our trademarks, product designs and copyrighted works have significant value and we vigorously protect them against infringement.
100
Table of Contents
Seasonality
Our business is seasonal, and we have historically realized a higher portion of our net sales, net income and operating cash flows in the fourth fiscal quarter, attributable to the impact of the holiday selling season. In addition, some of our product offerings such as outdoor furniture and garden products are seasonal in nature and experience higher sales during our second fiscal quarter. As a result of these factors, our working capital requirements and demands on our product distribution and delivery network fluctuate during the year in response to seasonal trends in our business, and are greatest in the first and third fiscal quarters as we ramp up for the outdoor selling season and the holiday season, respectively.
Properties
We currently lease approximately 170,000 square feet for use as our corporate headquarters in Corte Madera, California, including approximately 15,000 square feet of warehouse space. We lease an additional 13,000 square feet of warehouse space in San Rafael, California. The leases for these spaces expire between January 2013 and May 2021, other than certain small storage space leases that are leased on a month-to-month basis.
We lease four separate distribution facilities and two standalone furniture delivery hubs, described above under “—Distribution and Delivery.” Our West Jefferson, Ohio facility lease expires in May 2023. Our Baltimore, Maryland facility lease expires in June 2014. Our North East, Maryland facility lease expires in 2027. Our Mira Loma, California facility lease expires in June 2020. Our Tracy, California facility lease expires in September 2016. Our Avenel, New Jersey facility lease expires in November 2016.
As of July 28, 2012, we lease approximately 900,000 gross square feet for our 71 Galleries, 2 full line Design Galleries and 10 outlet stores. The initial lease term of our retail stores is generally 10 – 15 years. Certain leases contain renewal options for up to 15 years. Most leases for our retail stores provide for a minimum rent, typically including escalating rent increases, plus a percentage rent based upon sales after certain minimum thresholds are achieved. The leases generally require us to pay insurance, utilities, real estate taxes and repair and maintenance expenses. We also lease approximately 39,000 square feet for offsite storage.
We currently own one store, our approximately 8,000 square foot Gallery in San Francisco’s Design District.
We believe that our current offices and facilities are in good condition, are being used productively and are adequate to meet our requirements for the foreseeable future.
Regulation and Legislation
We are subject to labor and employment laws, laws governing truth-in-advertising, privacy laws, safety regulations and other laws, including consumer protection regulations that regulate retailers and govern the promotion and sale of merchandise and the operation of stores and warehouse facilities. We monitor changes in these laws and believe that we are in material compliance with applicable laws.
Legal Proceedings
From time to time we are involved in litigation, claims and other proceedings relating to the conduct of our business, including but not limited to consumer protection class action litigation, claims related to our business, including claims related to our collection of reproductions or employment practices, and claims of intellectual property infringement. In addition, from time to time, we are subject to product liability and personal injury claims for the products that we sell and the stores we operate. Subject to certain exceptions, our purchase orders generally require the vendor to indemnify us against any product liability claims; however, if the vendor does not have insurance or becomes
101
Table of Contents
insolvent, we may not be indemnified. In addition, we could face a wide variety of employee claims against us, including general discrimination, privacy, labor and employment, ERISA and disability claims. Any claims could also result in litigation against us and could also result in regulatory proceedings being brought against us by various federal and state agencies that regulate our business, including the U.S. Equal Employment Opportunity Commission. Often these cases raise complex factual and legal issues, which are subject to risks and uncertainties and which could require significant management time. Litigation and other claims and regulatory proceedings against us could result in unexpected expenses and liability and could also materially adversely affect our operations and our reputation.
102
Table of Contents
Below is a list of the names and ages, as of , 2012, of our directors, director designees and executive officers and a description of the business experience of each of them.
| Name |
Age | Position | ||||
| Carlos Alberini |
57 | Chief Executive Officer and Director | ||||
| Karen Boone |
38 | Chief Financial Officer | ||||
| Ken Dunaj |
46 | Chief Operating Officer | ||||
| J. Michael Chu |
54 | Director | ||||
| Scott Dahnke |
47 | Director | ||||
| Mark Demilio |
56 | Director | ||||
| William Forrest |
51 | Director | ||||
| Glenn Krevlin |
52 | Director | ||||
| Marc Magliacano |
37 | Director | ||||
| Frederick Wilson |
66 | Director | ||||
Executive Officers
Carlos Alberini joined us as a Co-Chief Executive Officer in June 2010 and was appointed as the sole Chief Executive Officer in 2012. He has also been a director since June 2010. Prior to joining us, he was President and Chief Operating Officer of Guess?, Inc., a publicly traded specialty retailer of apparel and accessories, from December 2000 to June 2010. From May 2006 to July 2006, Mr. Alberini served as Interim Chief Financial Officer of Guess?, Inc. Mr. Alberini served as a member of the board of directors of Guess?, Inc. from December 2000 to September 2011. From October 1996 to December 2000, Mr. Alberini served as Senior Vice President and Chief Financial Officer of Footstar, Inc., a retailer of footwear. From May 1995 to October 1996, Mr. Alberini served as Vice President of Finance and Acting Chief Financial Officer of the Melville Corporation, a retail holding corporation. From 1987 to 1995, Mr. Alberini was with The Bon-Ton Stores, Inc., an operator of department stores, in various capacities, including Corporate Controller, Senior Vice President, Chief Financial Officer and Treasurer. Prior to that, Mr. Alberini served in various positions at PricewaterhouseCoopers LLP, an audit firm. Mr. Alberini was selected to our board of directors because he possesses particular knowledge and experience in retail and merchandising, branded consumer goods, accounting, financing and capital finance, board practices of other large retail companies and leadership of complex organizations. Mr. Alberini’s employment agreement provides that he will serve as our Chief Executive Officer and as a member of our board of directors.
Karen Boone joined us as our Chief Financial Officer in June 2012. From December 1996 to June 2012, Ms. Boone worked for Deloitte & Touche LLP, an accounting and consulting firm, where she most recently served as an audit partner. Before becoming an audit partner in 2010, she served as a senior manager in Deloitte’s audit practice from 2005 to 2010 and as a manager from 2002 to 2005. Her entire career at Deloitte was spent specializing in service to retail and consumer products companies.
Ken Dunaj has served as our Chief Operating Officer since May 2006. From August 2005 to May 2006, Mr. Dunaj served as Senior Vice President, Global Logistics, for Williams-Sonoma, a specialty retailer of products for the home. From September 2000 to August 2005, Mr. Dunaj held various other positions at Williams-Sonoma, Inc., including Vice President, Distribution. Prior to joining Williams-Sonoma, Mr. Dunaj held various positions at Toys “R” Us, Inc., Genesis Direct, Inc., Reebok International Ltd. and NIKE, Inc.
Directors
We believe our board of directors should be composed of individuals with sophistication and experience in many substantive areas that impact our business. We believe experience, qualifications, or skills in the following
103
Table of Contents
areas are most important: retail merchandising; marketing and advertising; furniture and consumer goods; sales and distribution; accounting, finance, and capital structure; strategic planning and leadership of complex organizations; legal/regulatory and government affairs; people management; and board practices of other major corporations. We believe that all our current board members possess the professional and personal qualifications necessary for board service, and have highlighted particularly noteworthy attributes for each board member in the individual biographies below, or above in the case of our Chief Executive Officer.
J. Michael Chu was appointed to our board of directors in June 2008. Mr. Chu serves as a Managing Partner of Catterton Partners, a private equity firm he co-founded in 1989. Prior to forming Catterton Partners, Mr. Chu held a variety of senior management positions with The First Pacific Company and its various subsidiaries, including as Vice President and Corporate Treasurer of First Pacific in Hong Kong, and as Chief Financial Officer and Chief Operating Officer of various operating companies owned or controlled by First Pacific in both the United States and Europe. First Pacific is a Hong Kong publicly listed investment and management company where he was employed from 1983 to 1989. Prior to First Pacific he was Assistant Treasurer at Allied Bank International from 1980 to 1983. Mr. Chu was selected to our board because he possesses particular knowledge and experience both in the United States and globally, in supporting high-growth consumer businesses.
Scott Dahnke has served as a member of our board of directors since June 2008. Mr. Dahnke has served as a Managing Partner of Catterton Partners, a private equity firm, since February 2003. Mr. Dahnke has a broad range of business experience in private equity, consulting, management and finance. During 2002, he was a Managing Director at Deutsche Bank Capital Partners, a private equity firm, and from 1998 to 2002, he was a Managing Director at AEA Investors, a private equity firm, where he led its consumer products investing efforts. From 1997 to 1998, Mr. Dahnke was the Chief Executive Officer of infoUSA (now infogroup), a provider of business and consumer marketing products and services. Prior to joining infoUSA, Mr. Dahnke served clients on an array of strategic and operational issues as a Partner at McKinsey & Company. His early career also included experience in the Merger Department of Goldman, Sachs & Co. and with General Motors. Mr. Dahnke was selected to our board of directors because of his broad consumer marketing and direct marketing experience, his financial experience as a private equity investor and his service on the boards of directors of a range of other consumer companies.
Mark Demilio has served as a member of our board of directors since September 2009. Mr. Demilio has been a member of the board of directors of Cosi, Inc., a publicly traded national restaurant chain, since April 2004. He served as Chairman of the board of directors of Cosi from March 2010 to December 2011 and served as interim Chief Executive Officer of Cosi from September 2011 to December 2011. From April 2004 until he was named Chairman of the board of directors of Cosi, Mr. Demilio served as Chairman of the company’s audit committee. From December 2000 until his retirement in October 2008, Mr. Demilio served as the Chief Financial Officer of Magellan Health Services, Inc., a publicly traded managed specialty healthcare company that manages the delivery of behavioral healthcare treatment services, specialty pharmaceuticals and radiology services. Mr. Demilio has also been the Chief Financial Officer of Youth Services International, Inc., a financial analyst for CareFirst BlueCross BlueShield of Maryland and a certified public accountant with Arthur Andersen LLP. He was a principal officer of Magellan Health Services, Inc. and 88 of its affiliates, which commenced a case on March 11, 2003, under Chapter 11 of Title 11 of the U.S. Bankruptcy Code in the U.S. Bankruptcy Court for the Southern District of New York. These companies emerged from Chapter 11 on January 5, 2004. Mr. Demilio was selected to our board of directors because he possesses particular knowledge and experience in accounting, finance and capital structure, strategic planning and leadership of complex organizations and board practices of other major corporations.
William Forrest was first appointed to our board of directors in June 2008. Since November 2007, he has been the Founder and Managing Partner of Tower Three Partners, LLC, a private equity firm. He served as the Non-Executive Chairman of Cosi, Inc., a publicly traded national restaurant chain, from December 2006 through November 2007. He served as the Executive Chairman of Cosi from May 2003 until December 2006. Prior to joining Cosi, Mr. Forrest was a Managing Director leading the restructuring group and serving on the
104
Table of Contents
management committee at Gleacher & Co., an investment bank, from 2001 until 2004. Throughout his career, he has served in executive management, investment banking and investor roles with organizations in a variety of industries including healthcare, manufacturing and food services. Mr. Forrest was selected to our board of directors because he possesses particular knowledge and experience in accounting, finance and capital structure, strategic planning and leadership of complex organizations, retail businesses and board practices of other major corporations.
Glenn Krevlin has served as one of our directors since March 2001. Since 2001, Mr. Krevlin has been Principal and Portfolio Manager of Glenhill Capital, a New York based investment manager he founded in 2001. Glenhill Capital manages assets for Glenhill Capital LP, a Delaware limited partnership, Glenhill Capital Overseas Master Fund, LP, a Cayman Islands exempted limited partnership and Glenhill Concentrated Long Master Fund, LLC, a Delaware limited liability company. Mr. Krevlin is the Managing Member and Director of the General Partner for each of the Glenhill Funds. From August 2009 to the present, Mr. Krevlin has served as Chairman of the board of directors of Design Within Reach, Inc., a publicly traded specialty retailer of products for the home. Mr. Krevlin was selected to our board of directors because he possesses particular knowledge and experience in accounting, finance, capital structure, strategic planning, retail businesses and investment.
Marc Magliacano was first appointed to our board of directors in June 2008. Mr. Magliacano has been a senior investment professional at Catterton Partners, a private equity firm, since May 2006 and has served as Partner since August 2010. Prior to joining Catterton Partners, from 1999 to 2006, Mr. Magliacano was a Principal at North Castle Partners, a private equity firm focused on making consumer investments that benefit from healthy living and aging trends. While at North Castle, he originated and executed investments in the consumer health and wellness sectors. Prior to joining North Castle, Mr. Magliacano worked at NMS Capital, the merchant bank of NationsBanc Montgomery Securities, making growth investments in early stage consumer and retail businesses. As a result of these and other professional experiences, Mr. Magliacano was selected to our board of directors because of his experience in successfully developing strategies for growing branded consumer businesses.
Frederick Wilson has served as a member of our board of directors since June 2009. Mr. Wilson has been President and Chief Executive Officer of Saks Fifth Avenue Enterprises (SFAE) from December 2003 to February 2006 and was named Chairman and Chief Executive Officer of SFAE in March 2004. Mr. Wilson is responsible for leading SFAE’s Saks Fifth Avenue luxury department stores, Off 5th outlet stores and saks.com. Mr. Wilson served as Chairman, President and Chief Executive Officer of the Donna Karan Company, a division of Louis Vuitton Moet Hennessy (LVMH), from February 2002 to November 2003, as well as Chairman and Chief Executive Officer of Eluxury.com, the LVMH e-tailing arm based in San Francisco, from February 2002 to November 2003. Mr. Wilson held the posts of Chief Executive Officer for the LVMH Fashion Group for the Americas from February 2000 to February 2002 and Chief Executive Officer for the LVMH Speciality Store Retail division from February 1997 to February 2000. Prior to joining LVMH, he spent 17 years with Duty Free Stores, serving as President and Chief Merchant of that company. As a result of these and other professional experiences, Mr. Wilson was selected to our board of directors because he possesses particular knowledge and experience in retail business, branded consumer goods, accounting, finance and capital structure, strategic planning and leadership of complex organizations and board practices of other major corporations.
Selection Arrangements
Upon completion of this offering Home Holdings will continue to control a majority of the voting power of our common stock and as a result, we expect that Home Holdings will control the election of our directors.
Corporate Governance
Composition of our Board of Directors
Initially, our board of directors will consist of directors, including our Chief Executive Officer. Our certificate of incorporation, as will be in effect prior to the completion of this offering, will provide that, subject
105
Table of Contents
to any rights applicable to any then outstanding preferred stock and the terms of our stockholders agreement, our board of directors shall consist of such number of directors as determined from time to time by resolution adopted by a majority of the total number of authorized directors whether or not there exists any vacancies in previously authorized directorships. Subject to any rights applicable to any then-outstanding preferred stock and the terms of the stockholders agreement, any additional directorships resulting from an increase in the number of directors may only be filled by the directors then in office unless otherwise required by law or by a resolution passed by our board of directors. The term of office for each director will be until his or her successor is elected at our annual meeting or his or her death, resignation or removal, whichever is earliest to occur.
Gary Friedman, our former Chairman and Co-Chief Executive Officer, who serves as our Creator and Curator on an advisory basis, will be a board observer and advisor, with the honorary title of Chairman Emeritus.
Our board of directors will be divided into three classes, with each director serving a three-year term, and one class being elected at each year’s annual meeting of stockholders. , and will serve as Class I directors with an initial term expiring in 2013. , and will serve as Class II directors with an initial term expiring in 2014. , and will serve as Class III directors with an initial term expiring in 2015. Any additional directorships resulting from an increase in the number of directors will be distributed among the three classes so that, as nearly as possible, each class will consist of one-third of the total number of directors.
Upon completion of this offering, Home Holdings will continue to control a majority of the voting power of our outstanding common stock. As a result, we will be a “controlled company” under the NYSE corporate governance standards. As a controlled company, exemptions under the NYSE standards will mean that we are not required to comply with certain corporate governance requirements, including the requirements:
| • | that a majority of our board of directors consists of “independent directors,” as defined under the rules of the NYSE; |
| • | that we have a nominating and corporate governance committee that is composed entirely of independent directors with a written charter addressing the committee’s purpose and responsibilities; |
| • | that we have a compensation committee that is composed entirely of independent directors with a written charter addressing the committee’s purpose and responsibilities; and |
| • | that we conduct an annual performance evaluation of the nominating and governance committee and compensation committee. |
These exemptions do not modify the independence requirements for our audit committee, and we intend to comply with the applicable requirements of the Sarbanes-Oxley Act and rules with respect to our audit committee within the applicable time frame.
Director Independence
In 2012, our board of directors undertook a review of the independence of our directors and considered whether any director has a material relationship with us that could compromise that director’s ability to exercise independent judgment in carrying out that director’s responsibilities. Our board of directors has affirmatively determined that , and are each an “independent director,” as defined under the rules of the NYSE.
Director Voting
Our certificate of incorporation and stockholders agreement will provide that no action may be taken or vote approved by our board of directors or any committee thereof (other than the audit committee or any other committee of directors that may be created with the approval of Home Holdings) without the affirmative vote of both directors nominated by Home Holdings. Accordingly, Home Holdings will be able to control the decisions
106
Table of Contents
by our board of directors and its committees, other than the audit committee or any such other committee whose creation is approved by Home Holdings. Home Holdings will cease to have these veto rights when it ceases to own at least shares of our common stock and in certain other circumstances.
Board Leadership Structure
Upon completion of this offering, our board of directors will have four standing committees: the audit committee, the compensation committee, the nominating and corporate governance committee and the stock option committee. Each of these committees reports to our board of directors as it deems appropriate and as our board of directors may request.
With respect to the roles of Chairman of the Board and Chief Executive Officer, our Corporate Governance Guidelines, as will be in effect prior to the completion of this offering, will provide that the roles may be separated or combined, and our board of directors exercises its discretion in combining or separating these positions as it deems appropriate in light of prevailing circumstances. Our board of directors believes that the combination or separation of these positions should continue to be considered as part of our succession planning process. As of the date of this offering, the roles are separated, with Mr. Alberini serving as Chief Executive Officer and Mr. Chu serving as Chairman of the Board. Our Corporate Governance Guidelines will provide the flexibility for our board of directors to modify our leadership structure in the future as appropriate. We believe that Restoration Hardware, like many United States companies, is well served by this flexible leadership structure.
Board Committees
Our board of directors currently has an audit committee and a compensation committee. Prior to the completion of this offering, our board of directors will establish a new audit committee and a new compensation committee, which will replace our current committees, and our board of directors will establish a nominating and corporate governance committee and a stock option committee. In the future, our board of directors may establish other committees, as it deems appropriate, to assist it with its responsibilities. The composition, duties and responsibilities of our committees is as set forth below.
Audit Committee
The audit committee will be responsible for, among other matters: (1) appointing, compensating, retaining, evaluating, terminating and overseeing our independent registered public accounting firm; (2) discussing with our independent registered public accounting firm the independence of its members from its management; (3) reviewing with our independent registered public accounting firm the scope and results of their audit; (4) approving all audit and permissible non-audit services to be performed by our independent registered public accounting firm; (5) overseeing the financial reporting process and discussing with management and our independent registered public accounting firm the interim and annual financial statements that we file with the Securities and Exchange Commission; (6) reviewing and monitoring our accounting principles, accounting policies, financial and accounting controls and compliance with legal and regulatory requirements; (7) establishing procedures for the confidential anonymous submission of concerns regarding questionable accounting, internal controls or auditing matters; and (8) reviewing and approving related-person transactions.
Upon completion of this offering, our audit committee will consist of and . Rule 10A-3 of the Exchange Act and rules require us to have one independent audit committee member upon the listing of our common stock on the NYSE, a majority of independent directors within 90 days of the date of this prospectus and all independent audit committee members within one year of the date of this prospectus. Our board of directors has affirmatively determined that meets the definition of “independent director” for purposes of serving on an audit committee under Rule 10A-3 and NYSE rules, and we intend to comply with the other independence requirements within the time periods specified. In addition, our board of directors has determined
107
Table of Contents
that will qualify as an “audit committee financial expert,” as such term is defined in Item 407(d)(5) of Regulation S-K. Our board of directors will adopt a new written charter for the audit committee, which will be available on our investor relations website, accessible through our principal corporate websites at www.restorationhardware.com and www.rh.com prior to the completion of this offering.
Compensation Committee
The compensation committee will be responsible for, among other matters: (1) reviewing key employee compensation goals, policies, plans and programs; (2) reviewing and approving the compensation of our directors, Chief Executive Officer and other executive officers; (3) reviewing and approving employment agreements and other similar arrangements between us and our executive officers; and (4) appointing and overseeing any compensation consultants.
Upon completion of this offering, our compensation committee will consist of and . As a controlled company, we will rely upon the exemption from the requirement that we have a separate compensation committee composed entirely of independent directors. Our board of directors will adopt a new written charter for the compensation committee, which will be available on our investor relations website, accessible through our principal corporate websites at www.restorationhardware.com and www.rh.com prior to the completion of this offering.
Nominating and Corporate Governance Committee
The nominating and corporate governance committee will be responsible for, among other matters: (1) identifying individuals qualified to become members of our board of directors, consistent with criteria approved by our board of directors; (2) overseeing the organization of our board of directors to discharge the board’s duties and responsibilities properly and efficiently; (3) recommending corporate governance principles; and (4) developing and recommending to our board of directors a set of corporate governance guidelines and principles.
Upon completion of this offering, our nominating and corporate governance committee will consist of and . As a controlled company, we will rely upon the exemption from the requirement that we have a separate nominating and corporate governance committee composed entirely of independent directors. Our board of directors will adopt a new written charter for the nominating and corporate governance committee, which will be available on our investor relations website, accessible through our principal corporate websites at www.restorationhardware.com and www.rh.com prior to the completion of this offering.
Stock Option Committee
The stock option committee has the authority to grant all awards under the 2012 Plan. Upon completion of this offering, our compensation committee will consist of and . Each member of the stock option committee is a “non-employee director” as defined in Rule 16b-3 under the Exchange Act and is an “outside director” as defined in Section 162(m) of the Code.
Risk Oversight
Our board of directors is responsible for overseeing our risk management process. Our board of directors focuses on our general risk management strategy, the most significant risks facing us, and oversees the implementation of risk mitigation strategies by management. Our board of directors is also apprised of particular risk management matters in connection with its general oversight and approval of corporate matters and significant transactions.
Risk Considerations in Our Compensation Program
We conducted an assessment of our compensation policies and practices for our employees and concluded that these policies and practices are not reasonably likely to have a material adverse effect on our Company.
108
Table of Contents
Director Compensation
None of our directors serving on Home Holdings’ board of managers received compensation as a manager during fiscal 2011, other than Fred Wilson and Mark Demilio, who each were paid an annual retainer of $150,000. Our board of directors has affirmatively determined that Mr. Wilson and Mr. Demilio are each an “independent director,” as defined under the rules of the NYSE.
Our board of directors intends to adopt a compensation policy that, effective upon the completion of this offering, will be applicable to all of our non-employee directors. All directors receive reimbursement for reasonable out-of-pocket expenses incurred in connection with meetings of our board of directors.
Compensation Committee Interlocks and Insider Participation
For fiscal 2011, the members of the compensation committee of our board of directors were Mr. Chu and Mr. Forrest. Neither Mr. Chu nor Mr. Forrest is an officer or employee, or former officer or employee, of us or any of our subsidiaries. Mr. Chu is a managing partner of Catterton, and Mr. Forrest is the managing partner of Tower Three. Catterton and Tower Three are two of our Principal Equity Holders, and certain of their respective affiliates provide advisory and consulting services to us. See “Certain Relationships and Related Transactions—2008 Acquisition-Related Agreements—Management Services Agreement.”
No interlocking relationships exist between the members of our board of directors or compensation committee and the board of directors or compensation committee of any other company.
Code of Ethics
We have adopted a code of business conduct and ethics applicable to our principal executive, financial and accounting officers and all persons performing similar functions. A copy of that code will be available on our investor relations website, accessible through our principal corporate websites at www.restorationhardware.com and www.rh.com prior to completion of this offering. We expect that any amendments to the code, or any waivers of its requirements, will be disclosed on our website or as required by applicable law or NYSE listing requirements.
109
Table of Contents
Compensation Tables
Summary Compensation Table
The following table shows the compensation earned by our named executive officers during fiscal 2011 and fiscal 2010.
| Name and Principal Position |
Fiscal Year |
Salary | Bonus | Stock Awards (1) |
Option Awards |
Non-Equity Incentive Plan Compensation (2) |
All Other Compensation (3) |
Total | ||||||||||||||||||||||||
| Carlos Alberini |
2011 | $ | 908,462 | — | — | — | $ | 1,145,195 | $ | 352,272 | $ | 2,405,929 | ||||||||||||||||||||
| Chief Executive Officer |
2010 | $ | 507,692 | — | $ | 1,922,627 | — | $ | 531,200 | (4) | $ | 250,406 | $ | 3,211,925 | ||||||||||||||||||
| Ken Dunaj |
2011 | $ | 535,000 | — | — | — | $ | 337,050 | $ | 6,000 | $ | 878,050 | ||||||||||||||||||||
| Chief Operating Officer |
2010 | $ | 526,923 | — | — | — | $ | 218,673 | $ | 6,000 | $ | 751,596 | ||||||||||||||||||||
| Gary Friedman (5) |
2011 | $ | 995,769 | — | — | — | $ | 1,249,519 | $ | 11,400 | $ | 2,256,688 | ||||||||||||||||||||
| Former Chairman and Co-Chief Executive Officer |
2010 | $ | 900,000 | — | — | — | $ | 747,000 | $ | 11,400 | $ | 1,658,400 | ||||||||||||||||||||
| James Stewart (6) |
2011 | $ | 310,577 | $ | 150,000 | (7) | $ | 504,000 | — | — | $ | 4,375 | $ | 968,952 | ||||||||||||||||||
| Former Senior Vice President, Finance and Principal Accounting Officer |
||||||||||||||||||||||||||||||||
| (1) | Reflects the aggregate grant date fair value of the grants of performance-based Class B, Class B-1 and Class B-2 awards made to Mr. Alberini in fiscal 2010 and time-based Class B units made to Mr. Stewart in fiscal 2011, computed in accordance with Financial Accounting Standards Board Accounting Standards Codification Topic 718 (“FASB ASC 718”). See Note 11—Stock-Based Compensation to Restoration Hardware, Inc.’s audited consolidated financial statements. Does not include grants of performance-based awards that have a grant date fair value of zero based on the probable outcome of the performance conditions as assessed on the grant date, calculated in accordance with FASB ASC 718. With respect to Mr. Stewart’s performance-based awards in fiscal 2011, if the performance-based awards were valued based on the maximum outcome of performance-based conditions, then such awards would be valued on grant date as $56,000. |
| (2) | Reflect the cash awards that our named executive officers received under our MIP for fiscal 2011 and fiscal 2010 performance, as applicable. The MIP is a cash based-incentive compensation program designed to motivate and reward annual performance for eligible employees, including our named executive officers. The MIP includes various incentive levels based on the participant’s position. |
| (3) | Reflects perquisites to the named executive officers in the form of car allowances. For Mr. Alberini this amount also includes relocation benefits. For fiscal 2011, the relocation benefits provided to Mr. Alberini were in the aggregate amount of $340,872, which includes $120,000 as a housing stipend, $198,247 in moving-related expenses and a tax adjustment “gross up” payment of $22,625. For fiscal 2010, the relocation benefits were in the aggregate amount of $243,756, which includes $120,000 as a housing stipend, $51,653 in moving-related expenses and a tax adjustment “gross up” payment of $72,103. |
| (4) | Mr. Alberini’s employment with our Company commenced June 14, 2010, and his bonus amount for fiscal 2010 reflects a prorated portion equal to 80% of what he would have earned had he been employed with us for all of fiscal 2010. |
| (5) | Mr. Friedman’s employment with our Company commenced in March 2001 and on , 2012, Mr. Friedman’s employment agreement was terminated and he entered into an advisory agreement, effective as of , 2012. |
| (6) | Mr. Stewart’s employment with our Company commenced May 9, 2011 and Mr. Stewart left our Company effective as of January 27, 2012. |
| (7) | Reflects a transition bonus related to the timing of Mr. Stewart’s separation from our Company. |
110
Table of Contents
Outstanding Equity Awards at Fiscal Year-End
The table below sets forth certain information regarding the outstanding equity awards held by our named executive officers as of January 28, 2012.
| Stock Awards | ||||||||||||||||||||
| Name |
Grant Date |
Number of Shares or Units of Stock That Have Not Vested (1) |
Market Value of Shares or Units of Stock That Have Not Vested (2) |
Equity Incentive Plan Awards: Number of Unearned Shares, Units or Other Rights That Have Not Vested |
Equity Incentive Plan Awards: Market or Payout Value of Unearned Shares, Units or Other Rights That Have Not Vested (3) |
|||||||||||||||
| Carlos Alberini (4) |
5/12/2010 | 1,795,860 | $ | 5,010,449 | — | — | ||||||||||||||
| 5/12/2010 | — | — | 704,259 | (5) | — | |||||||||||||||
| 5/12/2010 | — | — | 1,408,518 | (6) | — | |||||||||||||||
| Ken Dunaj |
5/19/2009 | 380,000 | $ | 923,400 | — | — | ||||||||||||||
| 5/19/2009 | — | — | 505,000 | (5) | — | |||||||||||||||
| 5/19/2009 | — | — | 545,000 | (7) | — | |||||||||||||||
| Gary Friedman |
5/19/2009 | 1,690,221 | $ | 4,715,777 | — | — | ||||||||||||||
| 5/19/2009 | — | — | 1,267,666 | (5) | — | |||||||||||||||
| 5/19/2009 | — | — | 2,535,332 | (6) | — | |||||||||||||||
| (1) | Time-based units granted on May 19, 2009, under the Team Resto Ownership Plan vest incrementally as follows: 15% on June 17, 2009, 15% on June 17, 2010, 20% on June 17, 2011, 25% on June 17, 2012, and the remaining 25% on June 17, 2013. Time-based units granted after May 19, 2009, under the Team Resto Ownership Plan vest incrementally as follows: 15% on the first anniversary of the grant date, 15% on the second anniversary of the grant date, 20% on the third anniversary of the grant date, 25% on the fourth anniversary of the grant date and the remaining 25% on the first anniversary of the grant date. |
| (2) | Represents the liquidation value per unit for these time-based profit interest units at January 28, 2012, multiplied by the number of outstanding, unvested units on such date. |
| (3) | The liquidation value per unit for these performance-based profit interest units at January 28, 2012 was zero. |
| (4) | In addition to the grants set forth in this table, Mr. Alberini was also granted one Class B-2 unit which represents the right to receive upon the occurrence of certain transactions constituting a sale of our Company a one-time payment (the “Contingent Payment”) equal to the amount, if any, by which $15,000,000 exceeds the cumulative equity value received with respect to Mr. Alberini’s Class B-1 units up to and including the transaction involving a sale of our Company. If such cumulative equity value of the Class B-1 units exceeds $15,000,000, then no Contingent Payment is payable to Mr. Alberini. Cumulative “equity value” is the value of all cash, property and securities that have been distributed or paid in respect of the Class B-1 units up to and including the transaction involving a sale of our Company. |
| (5) | These performance-based units have a minimum requirement for vesting of two times return on equity investment as described in “Executive Compensation—Employee Benefit and Stock Plans—Team Resto Ownership Plan” below. |
| (6) | These performance-based units have a minimum requirement for vesting of three times return on equity investment as described in “Executive Compensation—Employee Benefit and Stock Plans—Team Resto Ownership Plan” below. For a period of 36 months after the offering, such officer may elect, in such officer’s discretion, vesting of performance-based units in whole or in part based upon the cumulative return on equity investment to our investors, which in turn is based upon the price at which our common stock trades in the market after this offering. |
| (7) | These performance-based units have a minimum requirement for vesting of three times return on equity investment as described in “Executive Compensation—Employee Benefit and Stock Plans—Team Resto Ownership Plan” below. |
111
Table of Contents
Options Exercised and Stock Vested
None of our named executive officers held stock options to purchase shares of our common stock during fiscal 2011. The following table provides information relating to the time-based units awarded under the Team Resto Ownership Plan that vested during fiscal 2011.
| Stock Awards | ||||||||
| Name |
Number of Shares Acquired on Vesting |
Value Realized on Vesting (1) |
||||||
| Carlos Alberini |
316,917 | $ | 928,567 | |||||
| Ken Dunaj |
152,000 | $ | 445,360 | |||||
| Gary Friedman |
676,089 | $ | 1,980,941 | |||||
| James Stewart |
— | — | ||||||
| (1) | Represents the fair market value per unit for these units as of the date the units vested. |
Equity Grants in Conjunction with this Offering
Stock Option Grants to Carlos Alberini and Gary Friedman
In conjunction with this offering, we intend to grant new stock options to Mr. Alberini to purchase shares of our common stock and to Mr. Friedman to purchase shares of our common stock, each at an exercise price of $ per share. We expect to recognize $ in compensation expense in connection with these option grants.
Other Stock Option Grants in Conjunction with this Offering
In conjunction with this offering, we intend to grant stock options under the 2012 Plan to purchase an aggregate of shares of common stock at an exercise price per share equal to the initial public offering price per share to certain employees, including members of our management team. These options are being granted in order to continue to provide these employees with incentive to build shareholder value over the long-term. We intend that options to purchase of the shares so granted will vest annually in equal 25% installments over four years, commencing on the first anniversary of the date of grant, and that options to purchase of the shares so granted will vest upon the satisfaction of certain performance-based metrics.
Employment and Other Agreements
The following is a description of the terms of the employment agreements with each of our named executive officers.
Carlos Alberini
Prior to consummation of this offering, we plan to enter into an amended and restated employment agreement with Mr. Alberini, our Chief Executive Officer. Mr. Alberini’s employment agreement will provide for an annual base salary of at least $1.1 million. Mr. Alberini is eligible for annual bonus compensation targeted at between 85% and 125% of his annual base salary, although his actual annual bonus range has varied from year to year.
If Mr. Alberini’s employment is terminated by us without cause (as defined in the agreement), or by Mr. Alberini for good reason (as defined in the agreement), he is entitled to (a) all accrued salary and vacation pay through the termination date, (b) any earned and unpaid portion of his annual bonus, (c) severance payments totaling $ million, less withholdings, paid on our regular payroll schedule over the 24 months following the termination date, (d) a pro-rata amount (based on the number of days Mr. Alberini was employed during the fiscal year through the termination date) of Mr. Alberini’s target bonus for the applicable fiscal year in which termination of employment occurs, (e) subject to his timely election under COBRA, continuation of medical
112
Table of Contents
benefits for 24 months following the termination date, subject to Mr. Alberini’s payment of applicable premiums at the same rate that would have been applied had he remained an executive officer of our Company, paid for by us to the same extent that we paid for his health insurance prior to termination. In addition, Mr. Alberini’s shares and options that are still subject to selling restrictions or are otherwise unvested will be subject to repurchase by us after two years at the then fair market value.
Mr. Alberini will agree that, during his employment with us, he will not directly or indirectly work for or engage or invest in any competitor. Mr. Alberini will also agree that, during his employment with us and during any severance period, he will not solicit, directly or through any third party any business from any of our material customers or suppliers or encourage any of our customers to reduce their business or contractual relationship with us.
Ken Dunaj
Effective May 5, 2006, we entered into an employment agreement with Mr. Dunaj, our Chief Operating Officer. Mr. Dunaj’s employment agreement provides that if his employment is terminated by us other than for cause (as defined in the agreement), he will receive salary continuation for a period of one year from such termination date. The agreement provides that the receipt of this severance is conditioned on Mr. Dunaj’s execution of a release of claims and his compliance with his proprietary information agreements with us and certain other conditions. In the event of a change of control, certain of Mr. Dunaj’s time-based units would accelerate under the terms of this employment agreement.
Gary Friedman
We have entered into an advisory services agreement and certain other agreements with Mr. Friedman. See “Certain Relationships and Related Party Transactions—Advisory Services Agreement with Gary Friedman.”
James Stewart
We entered into a transition agreement with Mr. Stewart, effective as of December 21, 2011, confirming our mutual agreement concerning Mr. Stewart’s transition from employment with our Company. Under the transition agreement, Mr. Stewart’s employment terminated on January 27, 2012, as of which time he received payments in respect of unpaid salary, accrued but unused vacation time and a transition bonus payment of $150,000 related to Mr. Stewart’s separation from our Company.
Employee Benefit and Stock Plans
Team Resto Ownership Plan
In early 2009, Home Holdings implemented the 2008 Team Resto Ownership Plan, or “Team Resto Ownership Plan,” to provide certain of our employees, including the named executive officers, the opportunity to participate in the equity appreciation of our business. The compensation committee of Home Holdings generally administered and made awards under the Team Resto Ownership Plan, although the board of managers of Home Holdings, in certain cases, approved awards under the Team Resto Ownership Plan. The composition of the compensation committee of Home Holdings is identical to the composition of the Restoration Hardware, Inc. compensation committee prior to our initial public offering. Through , 2012, units were issued and outstanding under the Team Resto Ownership Plan.
Participants in the Team Resto Ownership Plan were granted Class B units, Class B-1 units or Class B Prime units that represented membership interests in Home Holdings, which prior to this offering owned 100% of our equity interests. Holders of such units generally were entitled to receive a percentage of distributions made
113
Table of Contents
by Home Holdings after the initial investors in Home Holdings, including Catterton and Tower Three, received distributions equal to their invested capital.
Awards under the Team Resto Ownership Plan were made up of the following types of units: (1) time-based units with units vesting in annual installments over a specified period; (2) performance-based units with vesting based on a return on equity investment to our investors of between two times and three times such investment, with the exact range varying by individual award (the “2X—3X Performance-based Units”); (3) performance-based units with vesting based on a return on equity investment to our investors between three times and five times such investment, with the exact range varying by individual award (the “3X—5X Performance-based Units”); and (4) performance-based units with vesting tied to specific metrics relating to a return on equity investment amount to our investors or other performance objectives as specified in the individual award.
2012 Equity Replacement Plan
We anticipate that prior to the completion of this offering, our board of directors will adopt the Restoration Hardware 2012 Equity Replacement Plan, which we refer to as the Replacement Plan, and outstanding units under the Team Resto Ownership Plan will be converted into common stock under the Replacement Plan, in some cases subject to selling restrictions.
Aside from the awards of restricted stock in connection with the conversion of Team Resto Ownership Plan units, no other awards will be granted under the Replacement Plan.
2012 Stock Incentive Plan
We anticipate that prior to the completion of this offering, our board of directors will adopt the Restoration Hardware 2012 Stock Incentive Plan, which we refer to as the 2012 Plan. The 2012 Plan will become effective on the date of the completion of this offering. The 2012 Plan will provide for the grant of incentive stock options, within the meaning of Section 422 of the Code to our employees and any parent and subsidiary corporations’ employees, and for the grant of non-qualified stock options, stock appreciation rights, restricted stock, restricted stock units and dividend equivalent rights to our employees, directors and consultants and our parent and subsidiary corporations’ employees, directors and consultants.
Share Reserve
We will reserve a total of shares of our common stock for issuance pursuant to the 2012 Plan. In addition, the 2012 Plan will provide for annual increases in the number of shares available for issuance thereunder on the first business day of each fiscal year, beginning with our fiscal year following the year of this offering, equal to the lowest of (x) shares; (y) percent of the number of shares of our common stock outstanding as of such date; or (z) a lower number of shares determined by the administrator.
Administration
Our board of directors or a committee of our board of directors will administer the 2012 Plan. In the case of awards intended to qualify as “performance-based compensation” within the meaning of Section 162(m) of the Code, the committee will consist of two or more “outside directors” within the meaning of Section 162(m) of the Code. The administrator will have the power to determine and interpret the terms and conditions of the awards, including the employees, directors and consultants who will receive awards, the exercise price, the number of shares subject to each such award, the vesting schedule and exercisability of the awards, the restrictions on transferability of awards and the form of consideration payable upon exercise. The administrator also will have the authority to institute an exchange program whereby the exercise prices of outstanding awards may be reduced or outstanding awards may be surrendered or cancelled in exchange for other awards of the same type (which may have higher or lower exercise prices) or awards of a different type.
114
Table of Contents
Stock Options
The 2012 Plan will allow for the grant of incentive stock options that qualify under Section 422 of the Code only to our employees and employees of any parent or subsidiary of ours. Non-qualified stock options may be granted to our employees, directors, and consultants and those of any parent or subsidiary of ours. The exercise price of all options granted under the 2012 Plan must at least be equal to the fair market value of our common stock on the date of grant. The term of an incentive stock option may not exceed ten years, except that with respect to any employee who owns more than 10% of the voting power of all classes of our outstanding stock or any parent or subsidiary corporation as of the grant date, the term must not exceed five years, and the exercise price must equal at least 110% of the fair market value on the grant date.
After the continuous service of an employee, director or consultant terminates, he or she may exercise his or her option, to the extent vested, for the period of time specified in the option agreement. However, an option may not be exercised later than the expiration of its term.
Stock Appreciation Rights
The 2012 Plan will allow for the grant of stock appreciation rights. Stock appreciation rights allow the recipient to receive the appreciation in the fair market value of our common stock between the date of grant and the exercise date. The administrator will determine the terms of stock appreciation rights, including when such rights become exercisable and whether to pay the increased appreciation in cash or with shares of our common stock, or a combination thereof, except that the base appreciation amount for the cash or shares to be issued pursuant to the exercise of a stock appreciation right will be no less than 100% of the fair market value per share on the date of grant. After the continuous service of an employee, director or consultant terminates, he or she may exercise his or her stock appreciation right, to the extent vested, only to the extent provided in the stock appreciation right agreement.
Restricted Stock Awards
The 2012 Plan will allow for the grant of restricted stock. Restricted stock awards are shares of our common stock that vest in accordance with terms and conditions established by the administrator. The administrator will determine the number of shares of restricted stock granted to any employee, director or consultant. The administrator may impose whatever conditions on vesting it determines to be appropriate. For example, the administrator may set restrictions based on the achievement of specific performance goals. Shares of restricted stock that do not vest are subject to our right of repurchase or forfeiture.
Restricted Stock Units
The 2012 Plan will allow for the grant of restricted stock units. Restricted stock units are awards that will result in payment to a recipient at the end of a specified period only if the vesting criteria established by the administrator are achieved or the award otherwise vests. The administrator may impose whatever conditions to vesting, or restrictions and conditions to payment that it determines to be appropriate. The administrator may set restrictions based on the achievement of specific performance goals or on the continuation of service or employment. Payments of earned restricted stock units may be made, in the administrator’s discretion, in cash, with shares of our common stock or other securities, or a combination thereof.
Transferability of Awards
The 2012 Plan will allow for the transfer of awards under the 2012 Plan only (i) by will, (ii) by the laws of descent and distribution and (iii) for awards other than incentive stock options, to the extent authorized by the administrator. Only the recipient of an incentive stock option may exercise such award during his or her lifetime.
115
Table of Contents
Certain Adjustments
In the event of certain changes in our capitalization, to prevent diminution or enlargement of the benefits or potential benefits available under the 2012 Plan, the administrator will make adjustments to one or more of the number or class of shares that are covered by outstanding awards, the exercise or purchase price of outstanding awards, the numerical share limits contained in the 2012 Plan, and any other terms that the administrator determines require adjustment. In the event of our complete liquidation or dissolution, all outstanding awards will terminate immediately upon the consummation of such transaction.
Corporate Transactions and Changes in Control
The 2012 Plan will provide that in the event of a corporate transaction, as defined in the 2012 Plan, each outstanding award will terminate upon the consummation of the corporate transaction to the extent that such awards are not assumed by the acquiring or succeeding corporation. Prior to or upon the consummation of a corporate transaction or a change in control, as defined in the 2012 Plan, an outstanding award may vest, in whole or in part, to the extent provided in the award agreement or as determined by the administrator in its discretion. The administrator may condition the vesting of an award upon the subsequent termination of the recipient’s service or employment within a specified period of time following the consummation of a corporate transaction or change in control. The administrator will not be required to treat all awards similarly in the event of a corporate transaction or change in control.
Plan Amendments and Termination
The 2012 Plan will automatically terminate ten years following the date it becomes effective, unless we terminate it sooner. In addition, our board of directors has the authority to amend, suspend or terminate the 2012 Plan provided such action does not impair the rights under any outstanding award unless mutually agreed to in writing by the recipient and us.
Other Equity Issuances
Mr. Alberini and Mr. Friedman also have purchased certain units of Home Holdings. In particular, Mr. Friedman has purchased (i) 1,118,064 units, with each such unit consisting of both one Class A-1 unit and one Class A-2 unit at a price of $4.50 for each pair of units, and (ii) 215,269 Class A units at a price of $4.50 per unit, for an aggregate purchase price of $6,000,000. Mr. Friedman purchased such units through loans from Home Holdings, which loans were repaid in their entirety on September 8, 2011, as described further in “Certain Relationships and Related Party Transactions” below. In addition, Mr. Friedman also purchased 1,000,000 Class A units at the time of the Acquisition on June 17, 2008 by means of a rollover transaction involving 1,000,000 shares of the common stock of Restoration Hardware, Inc. previously owned by Mr. Friedman at the time of the Acquisition.
Mr. Alberini purchased 888,889 units, with each unit consisting of both one Class A-1 unit and one Class A-2 unit at a price of $4.50 for each pair of securities, for an aggregate purchase price of $4,000,000. Mr. Alberini purchased the units through a loan from Home Holdings. The outstanding principal on the loan, together with accrued interest thereon, was repaid in full by Mr. Alberini on August 25, 2010. The Class A-1 units and Class A-2 units sold to Mr. Alberini are subject to transfer and other restrictions, including vesting and certain repurchase rights as set forth in a restricted unit purchase agreement. See “Certain Relationships and Related Party Transactions—Loans to Certain Directors and Executive Officers.”
Mr. Alberini was also granted one Class B-2 unit outside the terms of the Team Resto Ownership Plan as described above.
116
Table of Contents
401(k) Plan
We maintain a 401(k) retirement savings plan. Each participant who is a United States employee may contribute to the 401(k) plan, through payroll deductions, up to 50% of his or her salary limited to the maximum allowed by the Internal Revenue Service regulations. All amounts contributed by employee participants and earnings on these contributions are fully vested at all times and are not taxable to participants until withdrawn. Employee participants may elect to invest their contributions in various established funds. We may make contributions to the accounts of plan participants.
117
Table of Contents
PRINCIPAL AND SELLING STOCKHOLDERS
The following table sets forth information as of , 2012 regarding the beneficial ownership of our common stock immediately prior to this offering and as adjusted to give effect to this offering, by:
| • | each person or group who is known by us to own beneficially more than 5% of our outstanding shares of our common stock; |
| • | each of our named executive officers; |
| • | each of our directors and our director designees; |
| • | each of our selling stockholders; and |
| • | all of our current executive officers, directors and director designees as a group. |
For further information regarding material transactions between us and our stockholders or their affiliates, see “Certain Relationships and Related Party Transactions.”
Beneficial ownership for the purposes of the following table is determined in accordance with the rules and regulations of the SEC. These rules generally provide that a person is the beneficial owner of securities if such person has or shares the power to vote or direct the voting thereof, or to dispose or direct the disposition thereof or has the right to acquire such powers within 60 days. Common stock subject to options that are currently exercisable or exercisable within 60 days of , 2012 are deemed to be outstanding and beneficially owned by the person holding the options. These shares, however, are not deemed outstanding for the purposes of computing the percentage ownership of any other person. Percentage of beneficial ownership is based on million shares of common stock to be outstanding after the completion of this offering after giving effect to the Reorganization, assuming no exercise of the underwriters’ option to purchase additional shares, or million shares of common stock, assuming full exercise of the underwriters’ option to purchase additional shares. Except as disclosed in the footnotes to this table and subject to applicable community property laws, we believe that each stockholder identified in the table possesses sole voting and investment power over all shares of common stock shown as beneficially owned by the stockholder. Unless otherwise indicated in the table or footnotes below, the address for each beneficial owner is c/o Restoration Hardware, Inc., 15 Koch Road, Suite J, Corte Madera, CA 94925.
118
Table of Contents
| Shares Beneficially Owned Prior to This Offering (1) |
Shares To Be Sold in This Offering (1) |
Shares Beneficially Owned After This Offering Assuming No Option to Purchase Additional Shares (1) |
Shares Beneficially Owned After This Offering Assuming Full Exercise of Option to Purchase Additional Shares (1) | |||||||||||||
| Name | Number |
Percent | Number | Number | Percent | Number | Percent | |||||||||
| 5% Stockholders: |
||||||||||||||||
| Home Holdings, LLC (2) |
100 | % | ||||||||||||||
| Catterton (2)(3) |
||||||||||||||||
| Tower Three (2)(4) |
||||||||||||||||
| Glenhill (2)(5) |
||||||||||||||||
| Gary Friedman |
||||||||||||||||
| Executive Officers, Directors and Director Designees |
||||||||||||||||
| Carlos Alberini |
||||||||||||||||
| Ken Dunaj |
||||||||||||||||
| James Stewart |
||||||||||||||||
| J. Michael Chu (3) |
||||||||||||||||
| Scott Dahnke (3) |
||||||||||||||||
| Mark Demilio |
||||||||||||||||
| William Forrest (4) |
||||||||||||||||
| Glenn Krevlin (5) |
||||||||||||||||
| Marc Magliacano |
||||||||||||||||
| Frederick Wilson |
||||||||||||||||
| All current executive officers, directors and director designees as a group (12 persons) |
||||||||||||||||
| Other Selling Stockholders: |
||||||||||||||||
| * | Represents beneficial ownership of less than 1% of our outstanding common stock. |
| (1) | Prior to the completion of the offering, all of our common stock is held directly by Home Holdings. All holdings set forth in this table with respect to any holder other than Home Holdings reflects indirect holdings of such shares through ownership of outstanding membership interests in Home Holdings. |
| (2) | CP Home Holdings, LLC beneficially owns % of the outstanding membership interests of Home Holdings, Tower Three Home LLC beneficially owns % of the outstanding membership interests of Home Holdings and funds affiliated with Glenhill Capital Management LLC, beneficially own % of the outstanding membership interests of Home Holdings. |
| (3) | Mr. Chu and Mr. Dahnke share voting control and investment power over the shares held by CP Home Holdings, LLC, but disclaim beneficial ownership of such shares except to the extent of their pecuniary interest therein. |
| (4) | Mr. Forrest has voting control and investment power over the shares held by Tower Three Home LLC, but disclaims beneficial ownership of such shares except to the extent of his pecuniary interest therein. |
| (5) | Includes shares beneficially owned by Glenhill Capital Overseas Master Fund, LP, shares beneficially owned by Glenn J. Krevlin, Trustee of the Glenn J. Krevlin Revocable Trust and shares beneficially owned by Krevlin 2005 Gift Trust. Mr. Krevlin has voting control and investment power over the shares held by the entities affiliated with Glenhill, but disclaims beneficial ownership of such shares except to the extent of his pecuniary interest therein and except with respect to the shares held by the Glenn J. Krevlin Revocable Trust. |
119
Table of Contents
CERTAIN RELATIONSHIPS AND RELATED PARTY TRANSACTIONS
2008 Acquisition-Related Agreements
In connection with the Acquisition in June 2008, the following agreements were entered into:
| • | an agreement and plan of merger, as amended by the first amendment thereto, was entered into by and between Restoration Hardware, Inc., Home Holdings and Home Merger Sub, Inc. (“Merger Sub” and a wholly owned subsidiary of Home Holdings), pursuant to which Merger Sub was merged with and into Restoration Hardware, Inc. and Restoration Hardware, Inc. became Home Holdings’ wholly owned subsidiary; |
| • | rollover agreements were entered into between Home Holdings and certain of Restoration Hardware, Inc.’s stockholders prior to the Acquisition, including Gary Friedman (collectively, the “Rollover Participants”), pursuant to which each of the Rollover Participants agreed to contribute to us a portion of his or its shares of Restoration Hardware, Inc.; |
| • | stockholder voting agreements were entered into by and between each of the Rollover Participants and Restoration Hardware, Inc. pursuant to which the Rollover Participants agreed to vote for and support the Acquisition; |
| • | limited guarantees were provided to Restoration Hardware, Inc. by Catterton Partners VI Offshore, L.P., a fund affiliated with Catterton, to guaranty our obligations and Merger Sub’s obligations under the agreement and plan of merger; |
| • | unsecured promissory notes in the aggregate amount of $25.0 million were issued by Restoration Hardware, Inc. to funds controlled by Catterton in exchange for aggregate gross proceeds of $25.0 million received from such funds; |
| • | a management services agreement was entered into by and between Restoration Hardware, Inc., Home Holdings, Catterton Management Company, LLC, an affiliate of Catterton, Tower Three Partners LLC, an affiliate of Tower Three, and GJK Capital Advisors, LLC, an affiliate of Glenhill, pursuant to which Catterton Management Company, LLC, Tower Three LLC and GJK Capital Advisors, LLC provided certain management services to Restoration Hardware, Inc.; and |
| • | a limited liability company agreement was entered into between Catterton, Tower Three and the Rollover Participants. |
Certain of the above agreements have been amended, replaced or terminated, and we currently are party to the following agreements with Catterton, Tower Three and GJK Capital Advisors, LLC:
| • | the management services agreement discussed above, which will be terminated upon completion of this offering; and |
| • | the limited liability company agreement discussed above, which will be amended in connection with this offering. |
All of the foregoing agreements and arrangements are described in further detail below.
Merger Agreement
Pursuant to the agreement and plan of merger, Merger Sub was merged with and into Restoration Hardware, Inc., with Restoration Hardware, Inc. as the surviving corporation and becoming Home Holdings’ direct, wholly owned subsidiary. At the effective time of the merger, each share of Restoration Hardware, Inc. common stock issued and outstanding immediately prior to the effective time of the merger was cancelled and converted into the right to receive $4.50 in cash, other than with respect to those shares contributed by the Rollover Participants (as described below).
120
Table of Contents
Home Holdings was formed by Catterton VI, L.P. and Catterton VI Offshore, L.P., investment funds managed by Catterton Management Company, LLC in anticipation of the Acquisition. At the time of the Acquisition, Tower Three made an investment in us in an amount that was approximately equal to the investment made by Catterton in us at the time of the closing, which investments were made to fund the merger consideration at closing.
The Acquisition was a “going-private” transaction, and Restoration Hardware, Inc.’s common stock no longer traded on the NASDAQ Global Market as of June 16, 2008, the effective time of the merger.
Rollover Agreements
Each of the Rollover Participants entered into a rollover agreement with Home Holdings pursuant to which the Rollover Participants agreed to contribute, immediately prior to the effective time of the merger, a portion of his or its shares of Restoration Hardware, Inc.’s common stock in exchange for a pro rata equity interest in Home Holdings. The Rollover Participants were Mr. Friedman, certain funds affiliated with Glenhill (Mr. Krevlin, our director, has sole voting power and control with respect to investments made by such funds) and certain funds affiliated with Palo Alto Investors, LLC.
Voting Agreements
Each of the Rollover Participants also entered into separate stockholder voting agreements with Restoration Hardware, Inc. in connection with the Acquisition. The voting agreements provided that each Rollover Participant would vote for and support the Acquisition.
Promissory Notes
In connection with the execution of the first amendment to the agreement and plan of merger in January 2008, Restoration Hardware, Inc. received aggregate gross proceeds of $25.0 million from certain funds controlled by Catterton, in exchange for the issuance of unsecured promissory notes in the aggregate original principal amount of $25.0 million. Each of the notes accrued interest at a rate of 8% per annum through and including December 31, 2008. Interest on the notes was payable in kind. The maturity date of the notes was December 30, 2012. Restoration Hardware, Inc. was obligated to pay an arrangement fee of $625,000 to Catterton on July 1, 2008 or earlier upon repayment.
Notwithstanding the foregoing, in lieu of repayment of the notes, Home Holdings agreed with the funds affiliated with Catterton to exchange the notes upon the closing of the merger for a pro rata (in kind and amount) share of Home Holdings’ common equity based upon the unpaid principal balance of the notes plus all accrued but unpaid interest through the date of the closing and the arrangement fee relating to the notes to the extent not previously paid.
Guarantees
Pursuant to certain limited guarantees, funds controlled by Catterton agreed to guaranty Home Holdings’ obligations and Merger Sub’s obligations under the agreement and plan of merger for up to the amount of $10,680,000 with respect to certain termination fees that may have been payable by Home Holdings under the agreement and plan of merger.
Management Services Agreement
Restoration Hardware, Inc. and Home Holdings entered into a management services agreement as of June 17, 2008, with Catterton Management Company, LLC, Tower Three Partners LLC and GJK Capital Advisors, LLC, which agreement was amended and restated in June 2009. Under this agreement, Catterton
121
Table of Contents
Management Company, LLC, Tower Three Partners LLC and GJK Capital Advisors, LLC provide management and advisory service to Restoration Hardware, Inc. and its affiliates, including general management consulting services, support and analysis with respect to financing alternatives and strategic planning functions. The fees payable under the management services agreement may be paid either by Restoration Hardware, Inc. or Home Holdings. The aggregate fees paid to Catterton Management Company, LLC under the agreement were $0.88 million for the 2008 Successor period and $1.83 million, $1.83 million and $4.65 million for fiscal years 2009, 2010 and 2011, respectively; the fees paid to Tower Three Partners LLC under the agreement were $0.79 million for the 2008 Successor period and $1.73 million, $1.73 million and $4.39 million for fiscal 2009, 2010 and 2011, respectively; and the fees paid to GJK Capital Advisors, LLC were $0.21 million for the 2008 Successor period and $0.34 million, $0.34 million and $0.85 million for fiscal 2009, 2010 and 2011, respectively. The management services agreement provides that it shall terminate upon the consummation of this initial public offering and that a fee shall be payable in connection with an initial public offering. In connection with this offering, we plan to pay Catterton Management Company, LLC, Tower Three Partners LLC and GJK Capital Advisors, LLC fees in the amount of $ , $ and $ , respectively. See “Use of Proceeds.”
Registration Rights Agreement
We intend to enter into a registration rights agreement with Home Holdings, our Principal Equity Holders, Mr. Alberini, Mr. Friedman and certain other stockholders in connection with the offering. The registration rights agreement will provide that Home Holdings and the Principal Equity Holders will have registration rights whereby, at any time following our initial public offering, Home Holdings or the Principal Equity Holders can require us to register under the Securities Act any shares in our Company owned by Home Holdings or the Principal Equity Holders as of the date of this prospectus and not sold in this offering. The registration rights agreement will also provide for piggyback registration rights for all stockholders that are parties to the agreement.
Stockholders Agreement
We intend to enter into a stockholders agreement with Home Holdings in connection with the offering. The stockholders agreement provides for a waiver of the corporate opportunity doctrine with respect to Home Holdings and its affiliates, including the Principal Equity Holders. In addition, the stockholders agreement will provide that no action may be taken or vote approved by our board of directors or any committee thereof (other than the audit committee) without the affirmative vote of both directors nominated by Home Holdings. This agreement will provide that certain actions may not be taken without the prior approval of Home Holdings, including:
| • | a change of control or the merger or consolidation of us or any of our subsidiaries; |
| • | entering into any contract relating to a joint venture, investment, recapitalization, or reorganization with any other person or the acquisition of any securities or assets of another person (other than inventory acquired in the ordinary course of business); |
| • | any transfer of a material amount of assets of us or any of our subsidiaries, other than inventory sold in the ordinary course of business; |
| • | the issuance of any capital stock of us or any of our subsidiaries, other than certain issuances upon the grant of equity awards; |
| • | the filing of any registration statement by the us or any of our subsidiaries, or the commencement of any public offering by us or any of our subsidiaries, other than in respect of certain equity awards; |
| • | the guarantee, assumption, incurrence or refinancing of indebtedness for borrowed money by the Company or any of its subsidiaries other than our existing; |
| • | entering into related party transactions; |
122
Table of Contents
| • | the adoption of a “poison pill” or other material defensive mechanisms not in place as of the consummation of this offering; |
| • | the payment of dividends or distributions on our capital stock; |
| • | redemptions or repurchases of our capital stock (other than repurchases of shares from employees upon termination of employment pursuant to terms of equity grants); |
| • | any amendment of our certificate of incorporation or the terms of the common stock; |
| • | the creation any new class or series of shares of having rights, preferences or privileges senior to or on a parity with the common stock; |
| • | the creation of any committees of our board of directors or the board of any of our subsidiaries, or delegation of authority to a committee, except as set forth in committee charters adopted as of the consummation of this offering; |
| • | certain actions in respect of liquidation, dissolution or bankruptcy; and |
| • | the entering into of any agreement to do any of the foregoing. |
The approval rights of the directors nominated by Home Holdings will lapse when Home Holdings ceases to own at least shares of common stock and the approval rights of Home Holdings will lapse when Home Holdings ceases to own at least shares of common stock.
Arrangements with Hierarchy
In connection with the closing of this offering, Home Holdings has a commitment to invest $5 million, directly or indirectly, in a newly formed entity named Hierarchy. Gary Friedman, who serves as our Creator and Curator on an advisory basis, will have a controlling interest in Hierarchy. We will have the right to acquire Home Holdings’ interest in Hierarchy at any time after the second anniversary of the offering, at the then fair market value, or at the time of a sale of Hierarchy. Home Holdings will have a right of first refusal with respect to a purchase of Hierarchy or any of its business lines, which it will assign to us prior to the completion of this offering. We will transfer to Hierarchy our minimal apparel-related assets for fair market value. We expect to enter into an agreement with Hierarchy pursuant to which we will provide Hierarchy with back office, logistics, supply chain and administrative support, with pricing determined based on the fair market value of such services. For so long as any transaction with Hierarchy would be deemed a related party transaction under applicable SEC rules, all transactions between us and Hierarchy will be reviewed and subject to approval or disapproval by our audit committee, none of the members of which are affiliated with Home Holdings.
Loans to Certain Directors and Executive Officers
Home Holdings entered into loan agreements with Mr. Alberini, Mr. Dunaj and Mr. Friedman. All of such loans have been repaid.
Mr. Alberini entered into a loan agreement with Home Holdings in May 2010 in the principal amount of approximately $4 million in connection with his purchase of 888,889 units, with each unit consisting of both one Class A-1 unit and one Class A-2 unit at a price of $4.50 for each pair of securities. The unpaid principal balance under the loan accrued interest at the rate of 5% per annum. The outstanding principal on the loan, together with accrued interest thereon, was repaid in full by Mr. Alberini on August 25, 2010, in the amount of $4,057,535. No prior payments of principal or interest were made by Mr. Alberini under the loan agreement.
Mr. Dunaj entered into a loan agreement with Home Holdings in April 2011 in the principal amount of $600,000. The unpaid principal balance under the loan accrued interest at the rate of 5% per annum. On
123
Table of Contents
September 8, 2011, Mr. Dunaj repaid the entire unpaid principal amount of the loan and accrued interest thereon through the reclassification of Mr. Dunaj’s Class B units of Home Holdings into Class B Prime units of Home Holdings that are entitled to a lower distribution amount than Class B units, commensurate with the amount of all previously outstanding principal and interest on his loan. On the date of such repayment, the total principal amount of the loan, including all accrued interest thereon, was $620,712. No prior payments of principal or interest were made by Mr. Dunaj under the loan agreement.
Mr. Friedman entered into a loan agreement with Home Holdings in December 2008 in the principal amount of $968,712 in connection with his purchase of 215,269 Class A units of Home Holdings. The unpaid principal balance under the loan accrued interest at the rate of 8% per annum. In connection with Mr. Friedman’s purchase in May 2010 of 1,118,064 units, with each such unit consisting of both one Class A-1 unit and one Class A-2 unit at a price of $4.50 for each pair of units, Mr. Friedman entered into an amendment to the loan agreement which, among other things, increased the principal amount of the loan to $6 million in the aggregate and changed the interest rate to 5% per annum, effective as of the date of the original $968,712 loan received in December 2008. On September 8, 2011, Mr. Friedman repaid the entire unpaid principal amount of the loan and accrued interest thereon through the reclassification by Home Holdings of Mr. Friedman’s Class A units and Class A-1 units into an equal number of Class A Prime units and Class A-1 Prime units, respectively. We incurred a $6.4 million compensation charge in connection with this transaction. The Class A Prime units and Class A-1 Prime units do not entitle Mr. Friedman to distributions from Home Holdings until after certain amounts have been distributed to the holders of Class A units, commensurate with the amount of all previously outstanding principal and interest on his loans. On the date of such repayment, the total principal amount of the loan, including all accrued interest thereon, was $6,559,877. No prior payments of principal or interest were made by Mr. Friedman under the loan agreement.
Employment Agreements
We have entered into employment agreements with our executive officers. For more information regarding these agreements, see “Executive Compensation—Employment and Other Agreements.”
Advisory Services Agreement with Gary Friedman
Prior to the completion of this offering, we expect to enter into an advisory services agreement with Mr. Friedman, pursuant to which he will devote approximately 80% of his business time to providing services to us as assigned by our chief executive officer in the areas of design, products, store development and merchandising and display. Mr. Friedman will have the title of Creator and Curator, and will report to our chief executive officer. Mr. Friedman will also serve as an advisor to our board of directors, have board observer rights and have the honorary title of Chairman Emeritus. The agreement has a five-year term and is renewable for an additional five-year period. Non-renewal of the agreement following the first five-year term is deemed a termination without cause (unless such non-renewal constitutes a termination for cause).
The advisory services agreement provides for a fee for services paid at a rate of $1.1 million annually. Mr. Friedman will be eligible to earn a minimum annual bonus of $500,000, assuming achievement of annual performance goals and criteria established by our chief executive officer in good faith following consultation with Mr. Friedman and approved by our compensation committee.
If Mr. Friedman’s services are terminated by us without cause (as defined in the agreement) or by Mr. Friedman for good reason (as defined in the agreement), he is entitled to (a) all accrued advisory fees and benefits through the termination date, (b) termination pay in the amount of $4 million to be paid in 24 equal monthly cash installments, (c) any earned but unpaid portion of his annual bonus and (d) his shares and options that are still subject to selling restrictions or are otherwise unvested will be subject to repurchase by us after one year at the then fair market value.
124
Table of Contents
Mr. Friedman will agree that, during the term of his advisory services agreement, he will not directly or indirectly work for or engage or invest in any competitor. In addition, Mr. Friedman has agreed that, during the term of his advisory services agreement and for the two year period thereafter, he will not (a) solicit, directly or through any third party, any employee of ours or (b) use our proprietary information to solicit the business of any of our material customers or suppliers, or encourage any of our customers to reduce their business or contractual relationship with us. The agreement will also contain a mutual non-disparagement clause.
The agreement will provide for indemnification of Mr. Friedman for claims relating to the service performed by Mr. Friedman within his authority under and the scope of the service contemplated by the agreement.
Equity Unit Grants
We have made certain unit grants to members of our senior management and certain members of our board of directors. For more information regarding these grants, see “Executive Compensation—Employee Benefit and Stock Plans—Team Resto Ownership Plan.”
The table below sets forth certain information regarding the outstanding equity awards held by each of our named executive officers under the Team Resto Ownership Plan, and by each of the members of our board of directors who holds any equity awards under the Team Resto Ownership Plan, as well as how such awards will be converted into shares of our common stock in connection with this offering, based on equity awards vested as of , 2012:
| Name |
Number of Vested Units (#) (1) |
Number of Unvested Units (#) (2) |
Shares of Vested Common Stock (#) (3) |
Shares of Unvested Restricted Common Stock ($) (4) | ||||
| Carlos Alberini |
||||||||
| Ken Dunaj |
||||||||
| Gary Friedman |
||||||||
| James Stewart |
||||||||
| Fred Wilson |
||||||||
| Mark Demilio |
| (1) | Represents that portion of vested time-based units awarded under the Team Resto Ownership Plan as of , 2012 and those performance-based units that vest as a result of this offering. |
| (2) | Represents the unvested potion of unvested time-based awards as of , 2012 and certain 3X—5X performance-based units that are subject to continued vesting after the completion this offering. |
| (3) | Vested shares of common stock under the Replacement Plan are subject to certain additional restrictions on transfer after this offering as described in “Executive Compensation—Employee Benefit and Stock Plans—Team Resto Ownership Plan” above. |
| (4) | Represents shares of restricted common stock under the Replacement Plan that are subject to performance-based vesting after the completion of this offering based upon a deemed 3X—5X return on equity investment that will be measured based upon the price at which our stock price trades during the three year period after the date of this offering. In the event that our common stock trades at or above a price per share of $ for a twenty trading day measurement period, then such shares of restricted common stock would vest in full. |
Director and Officer Indemnification and Limitation of Liability
Our bylaws, as will be in effect prior to the completion of this offering, provide that we will indemnify our directors and officers to the fullest extent permitted by the DGCL. In addition, our certificate of incorporation, as will be in effect prior to the completion of this offering, will provide that our directors will not be liable for monetary damages for breach of fiduciary duty.
125
Table of Contents
Prior to the completion of this offering, we will enter into indemnification agreements with each of our executive officers and directors. The indemnification agreements will provide the executive officers and directors with contractual rights to indemnification, expense advancement and reimbursement, to the fullest extent permitted under the DGCL.
There is no pending litigation or proceeding naming any of our directors or officers to which indemnification is being sought, and we are not aware of any pending litigation that may result in claims for indemnification by any director or officer.
Our Policy Regarding Related Party Transactions
In connection with this offering, we will adopt a written policy with respect to related party transactions. Under our related party transaction policies and procedures, a “Related Party Transaction” is any financial transaction, arrangement or relationship (or series of similar transactions, arrangements or relationships) in which we or any of our subsidiaries is a participant and in which a Related Party has or will have a direct or indirect interest, other than any transactions, arrangements or relationships in which the aggregate amount involved will not or may not be expected to exceed $120,000 in any calendar year, subject to certain exceptions. A “Related Party” is any of our executive officers, directors or director nominees, any stockholder directly or indirectly beneficially owning in excess of 5% of our stock or securities exchangeable for our stock and any immediate family member of any of the foregoing persons.
Pursuant to our related person transaction policies and procedures, any Related Party Transaction must be reviewed by the audit committee of our board of directors. In connection with its review of a Related Party Transaction, the audit committee may take into account, among other factors it deems appropriate, whether the Related Party Transaction is on terms no less favorable than terms generally available to an unaffiliated third-party under the same or similar circumstances and the extent of the related party’s interest in the Related Party Transaction. Management shall present to the audit committee the following information, to the extent relevant, with respect to actual or potential Related Party Transactions:
| 1. | A general description of the transaction(s), including the material terms and conditions; |
| 2. | The name of the related party and the basis on which such person or entity is a related party; |
| 3. | The related party’s interest in the transaction(s), including the related party’s position or relationship with, or ownership of, any entity that is a party to or has an interest in the transaction(s); |
| 4. | The approximate dollar value of the transaction(s), and the approximate dollar value of the related party’s interest in the transaction(s) without regard to amount of profit or loss; |
| 5. | In the case of a lease or other transaction providing for periodic payments or installments, the aggregate amount of all periodic payments or installments expected to be made; |
| 6. | In the case of indebtedness, the aggregate amount of principal to be outstanding and the rate or amount of interest to be payable on such indebtedness; and |
| 7. | Any other material information regarding the transaction(s) or the related party’s interest in the transaction(s). |
Other than compensation agreements and other arrangements which are described under “Executive Compensation,” and the transactions described above, since February 1, 2009, there has not been, and there is not currently proposed, any transaction or series of similar transactions to which we were or will be a party in which the amount involved exceeded or will exceed $120,000 and in which any of our directors, executive officers, holders of more than 5% of any class of our voting securities or any member of the immediate family of the foregoing persons had or will have a direct or indirect material interest.
126
Table of Contents
DESCRIPTION OF CERTAIN INDEBTEDNESS
The following is a summary of the material terms of the Restoration Hardware, Inc. revolving line of credit and term loan. This summary is qualified in its entirety by reference to the agreements which are filed as exhibits to the registration statement, of which this prospectus forms a part.
In August 2011, Restoration Hardware, Inc., along with its Canadian subsidiary, Restoration Hardware Canada, Inc., entered into a credit agreement with Bank of America, N.A., as administrative agent, and certain other lenders. This amended credit agreement modified a previous facility in which Restoration Hardware, Inc. had a revolving line of credit for up to $190.0 million, as of July 30, 2011. As a result of the modification, the unamortized deferred financing fees related to the previous line of credit on the date of the modification of $0.2 million will be amortized over the life of the new revolving line of credit, which has a maturity date of August 3, 2016. Under the credit agreement (which was further amended in January 2012 to add thereto a term loan facility), Restoration Hardware, Inc. has (i) a revolving line of credit available of up to $317.5 million, of which $10.0 million is available to Restoration Hardware Canada, Inc., and (ii) a $15.0 million term loan with a maturity date of July 6, 2015.
The revolving line of credit is available to be used for working capital, the financing of capital expenditures and other general corporate purposes. The revolving line of credit allows for swing line advances to us of up to $30.0 million and the issuance of letters of credit to us of up to $50.0 million. The revolving line of credit allows for up to $10.0 million of loans to, or letters of credit for, Restoration Hardware Canada, Inc. Restoration Hardware, Inc. may increase the amount of the revolving line of credit by up to an additional $100.0 million, provided that, among other things, the lenders agree to participate in the increased loan commitments under the revolving line of credit, no default under the credit agreement then exists or would result from such increase and sufficient borrowing base collateral is available to support increased loan amounts. The term loan was fully funded in January 2012 and amounts thereof may not be redrawn once repaid.
The availability of credit at any given time under the revolving line of credit is limited by reference to a borrowing base formula based upon numerous factors, including the value of eligible inventory, eligible accounts receivable, eligible real estate, and, in the case of the term loan, registered trade names, and reserves established by the administrative agent. As a result of the borrowing base formula, the actual borrowing availability under the revolving line of credit could be less than the stated amount of the revolving line of credit (as reduced by the actual borrowings and outstanding letters of credit under the revolving line of credit).
Borrowings under the revolving line of credit are subject to interest, at borrowers’ option, at either the bank’s reference rate or LIBOR (or the BA Rate or the Canadian Prime Rate, as such terms are defined in the credit agreement, in the case of Canadian borrowings denominated in Canadian dollars or the United States Index Rate or LIBOR for Canadian borrowings denominated in United States dollars), plus an applicable margin rate, in each case. The margin rate is determined quarterly based on the average daily domestic availability under the revolving line of credit over the preceding fiscal quarter. The weighted-average interest rate for the revolving line of credit was 2.7% as of July 28, 2012. The term loan bears interest at a rate of LIBOR plus 5.0%, and the interest rate for the term loan was 5.3% as of July 28, 2012.
As of July 28, 2012, $129.6 million was outstanding under the revolving line of credit, and the outstanding principal amount of the term loan was $14.8 million, net of $0.2 million of unamortized debt issuance costs. As of July 28, 2012, Restoration Hardware, Inc.’s undrawn borrowing availability under the revolving line of credit was $86.2 million, and there were $11.5 million in outstanding letters of credit.
Restoration Hardware, Inc. is required to repay the term loan in quarterly installments of $1.25 million beginning October 2012 with the final payment in April 2015. In addition, the term loan must be repaid with the net proceeds of any disposition of any registered trade name.
127
Table of Contents
A letter of credit fee accrues on the face amount of all letters of credit, and is payable quarterly in arrears. A commitment fee accrues on the amount of the revolving line of credit not utilized in the form of borrowings or letters of credit, and is payable quarterly in arrears. Certain other customary fees are payable in connection with the credit agreement.
Interest on borrowings is payable monthly in arrears, in the case of interest accruing at the bank’s reference rate, and every one, two or three months, as applicable, in arrears, in the case of interest accruing based on LIBOR. Voluntary prepayments are permitted in whole or in part without premium or penalty (subject to customary breakage costs).
Borrowings under the credit agreement are subject to, among other conditions, the material accuracy of representations and warranties, the absence of any material adverse change and the absence of events of default.
The credit agreement contains various restrictive covenants, including, among others, limitations on the ability to incur liens, make loans or other investments, incur additional debt, issue additional equity, merge or consolidate with or into another person, sell assets, pay dividends or make other distributions or enter into transactions with affiliates, along with other restrictions and limitations typical to credit agreements of this type and size.
The credit agreement does not contain any significant financial or coverage ratio covenants unless the availability under the revolving line of credit is less than the greater of (i) $17.5 million and (ii) 10% of the lesser of (A) the aggregate maximum commitments under the revolving line of credit and (B) the domestic borrowing base. If the availability under the revolving line of credit is less than the foregoing amount, then Restoration Hardware, Inc. is required to maintain a consolidated fixed charge coverage ratio of at least one to one. Such ratio is approximately the ratio on the last day of each month on a trailing twelve month basis of (a) (i) consolidated EBITDA (as defined in the agreement) minus (ii) capital expenditures, minus (iii) the income taxes paid in cash to (b) the sum of (i) debt service charges plus (ii) certain dividends and distributions paid. As of July 28, 2012, Restoration Hardware, Inc. was in compliance with all covenants, and if the availability under the revolving line of credit were less than the amount described above, Restoration Hardware, Inc. would have been in compliance with the consolidated fixed charge coverage ratio described in the previous sentence. The credit agreement requires a daily sweep of cash to prepay the loans under the credit agreement while (i) an event of default exists or (ii) the availability under the revolving line of credit for extensions of credit to Restoration Hardware, Inc. is less than the greater of (A) $20.0 million and (B) 15% of the lesser of the aggregate maximum commitments and the domestic borrowing base.
Events of default under the credit agreement include, but are not limited to: (i) nonpayment of principal, interest, fees or other amounts; (ii) failure to perform or observe covenants; (iii) certain cross-default to indebtedness; (iv) bankruptcy or insolvency of borrowers, guarantors or subsidiaries; (v) inability of the borrowers, guarantors, or their material subsidiaries to pay debts; (vi) certain monetary judgments against borrowers, guarantors or their material subsidiaries and material non-monetary judgments; and (vii) failure of subordination, in each case, subject to certain exceptions and qualifications.
All obligations under the credit agreement are secured by a first-priority lien on substantially all of borrowers’ assets, including accounts receivable, inventory, intangible assets, property, equipment, goods and fixtures. All of Restoration Hardware, Inc.’s material domestic subsidiaries, if any, must become either borrowers or guarantors of the obligations under the credit agreement and pledge substantially all of their respective assets as security therefor.
128
Table of Contents
The following is a description of the material terms and provisions of our common stock and preferred stock, our certificate of incorporation and bylaws, as they will be in effect upon completion of this offering, and of the DGCL. For more complete information, you should read our certificate of incorporation and bylaws, copies of which are or will be filed with the SEC as exhibits to the registration statement, of which this prospectus is a part.
Authorized Capitalization
Upon completion of this offering, our authorized capital stock will consist of million shares of common stock, par value $0.0001 per share, and million shares of preferred stock, par value $0.0001 per share. As of , 2012, we had outstanding 1,000 shares of common stock, held of record by stockholders. Based upon (i) million shares of our common stock that will be outstanding after giving effect to the Reorganization and (ii) the issuance of million shares of common stock in this offering to be sold by us, there will be million shares of our common stock outstanding upon completion of this offering, and no shares of preferred stock will be outstanding. In addition, as of 2012, there were shares of our common stock that were issuable pursuant to the exercise of outstanding options.
Common Stock
Voting Rights
Each share of common stock entitles the holder to one vote with respect to each matter presented to our stockholders on which the holders of common stock are entitled to vote. Subject to any rights that may be applicable to any then outstanding preferred stock, our common stock votes as a single class on all matters relating to the election and removal of directors on our board of directors and as provided by law. Holders of our common stock will not have cumulative voting rights. Except in respect of matters relating to the election of and removal of directors on our board of directors and as otherwise provided in our certificate of incorporation or required by law, all matters to be voted on by our stockholders must be approved by a majority of the shares present in person or by proxy at the meeting and entitled to vote on the subject matter. In the case of election of directors, all matters to be voted on by our stockholders must be approved by a plurality of the votes entitled to be cast by all shares of common stock. In the case of removal of directors, all matters to be voted on by our stockholders must be approved by an affirmative vote of 66 2/3% of our common stock, except as set forth in the following sentence. For so long as Home Holdings and our other Principal Equity Holders own more than shares of our common stock, directors may be removed, with or without cause, by the affirmative vote of a majority of our outstanding shares.
Dividend Rights
Subject to preferences that may be applicable to any then-outstanding shares of our preferred stock, the holders of our outstanding shares of common stock are entitled to receive dividends, if any, as may be declared from time to time by our board of directors out of legally available funds. It is our present intention not to pay cash dividends on our common stock for the foreseeable future. We are a holding company and substantially all of our operations are carried out by our subsidiary, Restoration Hardware, Inc., and its subsidiaries. Restoration Hardware, Inc.’s ability to pay dividends to us is limited by the terms of its credit agreement, which in turn may limit our ability to pay dividends on our common stock. See “Dividend Policy.”
Liquidation Rights
In the event of any voluntary or involuntary liquidation, dissolution or winding up of our affairs, holders of our common stock would be entitled to share ratably in our assets that are legally available for distribution to our
129
Table of Contents
common stockholders after payment of our debts and other liabilities. If we have any preferred stock outstanding at such time, holders of the preferred stock may be entitled to distribution or liquidation preferences. In either such case, we must pay the applicable distribution to the holders of our preferred stock before we may pay distributions to the holders of our common stock.
Other Rights
Our stockholders have no preemptive, conversion or other rights to subscribe for additional shares. The rights, preferences and privileges of the holders of our common stock are subject to, and may be adversely affected by, the rights of the holders of shares of any series of our preferred stock that we may designate and issue in the future.
Preferred Stock
Our certificate of incorporation authorizes our board of directors to provide for the issuance of up to shares of preferred stock in one or more series and to fix the preferences, powers and relative, participating, optional or other special rights, and qualifications, limitations or restrictions thereof, including the dividend rate, conversion rights, voting rights, redemption rights and liquidation preference and to fix the number of shares to be included in any such series without any further vote or action by our stockholders. Any preferred stock so issued may rank senior to our common stock with respect to the payment of dividends or amounts upon liquidation, dissolution or winding up, or both. The issuance of preferred stock may have the effect of delaying, deferring or preventing a change in control of our Company without further action by the stockholders and may adversely affect the voting and other rights of the holders of common stock. The issuance of preferred stock with voting and conversion rights may adversely affect the voting power of the holders of common stock, including the loss of voting control to others. At present, we have no plans to issue any shares of preferred stock.
Corporate Opportunity
As permitted under the DGCL, in our certificate of incorporation, as it will be in effect upon completion of this offering, we will renounce any interest or expectancy in, or any offer of an opportunity to participate in, specified business opportunities that are presented to us or one or more of our officers, directors or stockholders.
Director Voting
Our certificate of incorporation and stockholders agreement will provide that no action may be taken or vote approved by our board of directors or any committee thereof (other than the audit committee or any other committee of directors that may be created with the approval of Home Holdings) without the affirmative vote of both directors nominated by Home Holdings. Accordingly, Home Holdings will be able to control the decisions of our board of directors and its committees, other than the audit committee or any such other committee whose creation is approved by Home Holdings. Home Holdings will cease to have these veto rights when it ceases to own at least shares of our common stock.
Exclusive Venue
Unless we consent otherwise, the Court of Chancery in the State of Delaware shall be the sole and exclusive forum for stockholder actions against us.
Antitakeover Effects of Delaware Law and Our Certificate of Incorporation and Bylaws
Our certificate of incorporation and bylaws, as they will be in effect upon completion of this offering, also contain provisions that may delay, defer or discourage another party from acquiring control of us. We expect that these provisions, which are summarized below, will discourage coercive takeover practices or inadequate
130
Table of Contents
takeover bids. These provisions are also designed to encourage persons seeking to acquire control of us to first negotiate with our board of directors, which we believe may result in an improvement of the terms of any such acquisition in favor of our stockholders. However, they also give our board of directors the power to discourage acquisitions that some stockholders may favor.
Undesignated Preferred Stock
The authorization of undesignated preferred stock in our certificate of incorporation will make it possible for our board of directors to issue preferred stock with super voting, special approval, dividend or other rights or preferences on a discriminatory basis that could impede the success of any attempt to acquire us. These and other provisions may have the effect of deferring, delaying or discouraging hostile takeovers, or changes in control or management of our Company.
Classified Board of Directors
Our certificate of incorporation will provide that our board of directors will be divided into three classes, with each class serving three-year staggered terms. In addition, our certificate of incorporation will provide that directors may only be removed from our board of directors with cause and by an affirmative vote of 66 2/3% of our common stock except as set forth in the following sentence. For so long as Home Holdings and our other Principal Equity Holders own more than shares of our common stock, directors may be removed, with or without cause, by the affirmative vote of a majority of our outstanding shares. These provisions may have the effect of deferring, delaying or discouraging hostile takeovers, or changes in control or management of our Company.
Requirements for Advance Notification of Stockholder Meetings, Nominations and Proposals
Our certificate of incorporation will provide that, upon completion of this offering, special meetings of the stockholders may be called only by a resolution adopted by the affirmative vote of the majority of the directors then in office. Our bylaws will prohibit the conduct of any business at a special meeting other than as specified in the notice for such meeting. In addition, any stockholder who wishes to bring business before an annual meeting or nominate directors must comply with the requirements set forth in our bylaws. These provisions may have the effect of deferring, delaying or discouraging hostile takeovers or changes in control or management of our Company.
Stockholder Action by Written Consent
Pursuant to Section 228 of the DGCL, any action required to be taken at any annual or special meeting of the stockholders may be taken without a meeting, without prior notice and without a vote if a consent or consents in writing, setting forth the action so taken, is signed by the holders of outstanding stock having not less than the minimum number of votes that would be necessary to authorize or take such action at a meeting at which all shares of our stock entitled to vote thereon were present and voted, unless our Company’s certificate of incorporation provides otherwise. Our certificate of incorporation will provide that, after the date on which Home Holdings no longer holds at least shares of our common stock, any action required or permitted to be taken by our stockholders may be effected at a duly called annual or special meeting of our stockholders and may not be effected by consent in writing by such stockholders.
Business Combinations with Interested Stockholders
We will elect in our certificate of incorporation not to be subject to Section 203 of the DGCL, an anti-takeover law. In general, Section 203 prohibits a publicly held Delaware corporation from engaging in a business combination, such as a merger, with a person or group owning 15% or more of the corporation’s voting stock for a period of three years following the date the person became an interested stockholder, unless (with certain
131
Table of Contents
exceptions) the business combination or the transaction in which the person became an interested stockholder is approved in a prescribed manner. Accordingly, we will not be subject to any anti-takeover effects of Section 203. However, our certificate of incorporation will contain provisions that have the same effect as Section 203, except that they will provide that our Principal Equity Holders and any persons to whom our Principal Equity Holders sell their common stock will be deemed to have been approved by our board of directors, and thereby not subject to the restrictions set forth in these provisions.
Amendments
Any amendments to the foregoing provisions of our certificate of incorporation (except related to preferred stock) and any amendments to our bylaws will require the affirmative vote of at least of the voting power of all shares of our common stock then outstanding.
Listing
We will apply to list our common stock on the NYSE under the symbol “RH.”
Transfer Agent and Registrar
The transfer agent and registrar for our common stock will be Computershare Trust Company, N.A.
132
Table of Contents
SHARES ELIGIBLE FOR FUTURE SALE
Since June 2008 and prior to this offering, there has been no public market for our common stock. Future sales of substantial amounts of our common stock in the public market, or the perception that such sales may occur, could adversely affect the prevailing market price of our common stock. No prediction can be made as to the effect, if any, future sales of shares, or the availability of shares for future sales, will have on the market price of our common stock prevailing from time to time. The sale of substantial amounts of our common stock in the public market, or the perception that such sales could occur, could harm the prevailing market price of our common stock.
Sale of Restricted Shares
Upon completion of this offering, we will have shares of common stock outstanding. Of these shares of common stock, the shares of common stock being sold in this offering, plus any shares sold by the selling stockholders upon exercise of the underwriters’ option to purchase additional shares, will be freely tradable without restriction under the Securities Act, except for any such shares which may be held or acquired by an “affiliate” of ours, as that term is defined in Rule 144 promulgated under the Securities Act, which shares will be subject to the volume limitations and other restrictions of Rule 144 as described below. The remaining shares of common stock held by our existing stockholders upon completion of this offering will be “restricted securities,” as that phrase is defined in Rule 144, and may be resold only after registration under the Securities Act or pursuant to an exemption from such registration, including, among others, the exemptions provided by Rule 144 and 701 under the Securities Act, which rules are summarized below. These remaining shares of common stock held by our existing stockholders upon completion of this offering will be available for sale in the public market after the expiration of the lock-up agreements described in “Underwriting,” taking into account the provisions of Rules 144 and 701 under the Securities Act.
Rule 144
Under Rule 144, persons who became the beneficial owner of shares of our common stock prior to the completion of this offering may not sell their shares until the earlier of (1) the expiration of a six-month holding period, if we have been subject to the reporting requirements of the Exchange Act and have filed all required reports for at least 90 days prior to the date of the sale, or (2) a one-year holding period.
At the expiration of the six-month holding period, a person who was not one of our affiliates at any time during the three months preceding a sale would be entitled to sell an unlimited number of shares of our common stock provided current public information about us is available, and a person who was one of our affiliates at any time during the three months preceding a sale would be entitled to sell within any three-month period only a number of shares of common stock that does not exceed the greater of either of the following:
| • | 1% of the number of shares of our common stock then outstanding, which will equal approximately shares immediately after this offering, based on the number of shares of our common stock outstanding after completion of this offering; or |
| • | the average weekly trading volume of our common stock on the NYSE during the four calendar weeks preceding the filing of a notice on Form 144 with respect to the sale. |
At the expiration of the one-year holding period, a person who was not one of our affiliates at any time during the three months preceding a sale would be entitled to sell an unlimited number of shares of our common stock without restriction. A person who was one of our affiliates at any time during the three months preceding a sale would remain subject to the volume restrictions described above.
Sales under Rule 144 by our affiliates are also subject to manner of sale provisions and notice requirements and to the availability of current public information about us.
133
Table of Contents
Rule 701
In general, under Rule 701, any of our employees, directors, officers, consultants or advisors who acquired shares from us in connection with a compensatory stock or option plan or other written agreement in compliance with Rule 701 before the effective date of the registration statement of which this prospectus is a part, are eligible to resell such shares in reliance upon Rule 144 beginning 90 days after the date of this prospectus, subject to the terms at any applicable lock-up restrictions as discussed below. If such person is not an affiliate, the sale may be made without complying with the minimum holding period or public information requirements of Rule 144. If such a person is an affiliate, the sale may be made under Rule 144 without compliance with its one-year minimum holding period, but subject to the other Rule 144 restrictions.
Stock Plans
We intend to file one or more registration statements on Form S-8 under the Securities Act to register shares of our common stock issued or reserved for issuance under the Replacement Plan and the 2012 Plan. The first such registration statement is expected to be filed soon after the date of this prospectus and will automatically become effective upon filing with the SEC. Accordingly, shares registered under such registration statement will be available for sale in the open market following the effective date, unless such shares are subject to vesting restrictions with us, Rule 144 restrictions applicable to our affiliates or the lock-up restrictions described below.
Lock-Up Agreements
We, our executive officers and directors, the selling stockholders and other existing security holders have agreed, subject to certain limited exceptions, not to sell or transfer any common stock or securities convertible into, exchangeable for, exercisable for, or repayable with common stock, for 180 days after the date of this prospectus without first obtaining the written consent of Merrill Lynch, Pierce, Fenner & Smith Incorporated and Goldman, Sachs & Co. See “Underwriting.”
134
Table of Contents
MATERIAL U.S. FEDERAL INCOME TAX CONSIDERATIONS TO NON-U.S. HOLDERS
The following is a summary of the material U.S. federal income tax consequences applicable to non-U.S. holders (as defined below) with respect to the acquisition, ownership and disposition of shares of our common stock, but does not purport to be a complete analysis of all potential tax considerations related thereto. This summary is based on current provisions of the Internal Revenue Code of 1986, as amended (the “Code”), final, temporary or proposed Treasury regulations promulgated thereunder, administrative rulings and judicial opinions, all of which are subject to change, possibly with retroactive effect. We have not sought any ruling from the U.S. Internal Revenue Service, or the IRS, with respect to the statements made and the conclusions reached in the following summary, and there can be no assurance that the IRS will agree with such statements and conclusions.
This summary is limited to non-U.S. holders who purchase shares of our common stock issued pursuant to this offering and who hold such shares of our common stock as capital assets (within the meaning of Section 1221 of the Code).
This discussion does not address all aspects of U.S. federal income taxation that may be important to a particular non-U.S. holder in light of that non-U.S. holder’s individual circumstances, nor does it address any aspects of U.S. federal estate or gift tax laws or tax considerations arising under the laws of any non-U.S., state or local jurisdiction. This discussion also does not address tax considerations applicable to a non-U.S. holder subject to special treatment under the U.S. federal income tax laws, including without limitation:
| • | banks, insurance companies or other financial institutions; |
| • | partnerships or other pass-through entities; |
| • | tax-exempt organizations; |
| • | tax-qualified retirement plans; |
| • | dealers in securities or currencies; |
| • | traders in securities that elect to use a mark-to-market method of accounting for their securities holdings; |
| • | U.S. expatriates and certain former citizens or long-term residents of the United States; |
| • | controlled foreign corporations; |
| • | passive foreign investment companies; |
| • | persons that own, or have owned, actually or constructively, more than 5% of our common stock; and |
| • | persons that will hold common stock as a position in a hedging transaction, “straddle” or “conversion transaction” for tax purposes. |
Accordingly, we urge prospective investors to consult with their own tax advisors regarding the U.S. federal, state, local and non-U.S. income and other tax considerations of acquiring, holding and disposing of shares of our common stock.
If a partnership (or other entity or arrangement classified as a partnership for U.S. federal income tax purposes) is a beneficial owner of shares of our common stock, the tax treatment of a partner in the partnership (or member in such other entity) will generally depend upon the status of the partner and the activities of the partnership. Any partner in a partnership holding shares of our common stock (and such partnership) should consult their own tax advisors.
PROSPECTIVE INVESTORS ARE URGED TO CONSULT THEIR TAX ADVISORS WITH RESPECT TO THE APPLICATION OF THE U.S. FEDERAL INCOME TAX LAWS TO THEIR PARTICULAR
135
Table of Contents
SITUATIONS AS WELL AS ANY TAX CONSEQUENCES OF THE PURCHASE, OWNERSHIP AND DISPOSITION OF SHARES OF OUR COMMON STOCK ARISING UNDER THE U.S. FEDERAL ESTATE OR GIFT TAX RULES OR UNDER THE LAWS OF ANY STATE, LOCAL, NON-U.S. OR OTHER TAXING JURISDICTION OR UNDER ANY APPLICABLE TAX TREATY.
Definition of Non-U.S. Holder
In general, a “non-U.S. holder” is any beneficial owner of shares of our common stock (other than a partnership or other entity or arrangement treated as a partnership for U.S. federal income tax purposes) that is not a U.S. person. A “U.S. person” is any of the following:
| • | an individual citizen or resident of the United States; |
| • | a corporation created or organized in or under the laws of the United States, any state thereof or the District of Columbia (or other entity treated as such for U.S. federal income tax purposes); |
| • | an estate, the income of which is includible in gross income for U.S. federal income tax purposes regardless of its source; or |
| • | a trust if (a) a court within the United States is able to exercise primary supervision over the administration of the trust and one or more U.S. persons have the authority to control all substantial decisions of the trust or (b) it has a valid election in effect under applicable Treasury regulations to be treated as a U.S. person. |
Distributions on Our Common Stock
As described in the section titled “Dividend Policy,” we currently do not anticipate paying dividends on shares of our common stock in the foreseeable future. If, however, we make cash or other property distributions on shares of our common stock (other than certain pro rata distributions of shares of our common stock), such distributions will constitute dividends for U.S. federal income tax purposes to the extent paid from our current earnings and profits for that taxable year or accumulated earnings and profits, as determined under U.S. federal income tax principles. Amounts not treated as dividends for U.S. federal income tax purposes will constitute a return of capital and will first be applied against and reduce a non-U.S. holder’s adjusted tax basis in the shares of our common stock, but not below zero. Any excess will be treated as gain realized on the sale or other disposition of shares of our common stock and will be treated as described under the section titled “—Gain on Sale or Other Disposition of Shares of Our Common Stock” below.
Dividends paid to a non-U.S. holder of shares of our common stock generally will be subject to U.S. federal withholding tax at a rate of 30% of the gross amount of the dividends, or such lower rate specified by an applicable income tax treaty. To receive the benefit of a reduced treaty rate, a non-U.S. holder must furnish to us or our paying agent a valid IRS Form W-8BEN (or other applicable form) certifying, under penalties of perjury, such non-U.S. holder’s qualification for the reduced rate. This certification must be provided to us or our paying agent prior to the payment of dividends and must be updated periodically.
If a non-U.S. holder holds shares of our common stock in connection with the conduct of a trade or business in the United States, and dividends paid on shares of our common stock are effectively connected with such non-U.S. holder’s U.S. trade or business (and, if required by an applicable income tax treaty, are attributable to a permanent establishment maintained by the non-U.S. holder in the United States), the non-U.S. holder will be exempt from the aforementioned U.S. federal withholding tax. To claim the exemption, the non-U.S. holder must furnish to us or our paying agent a properly executed IRS Form W-8ECI (or applicable successor form).
Such effectively connected dividends generally will be subject to U.S. federal income tax on a net income basis at the regular graduated U.S. federal income tax rates in the same manner as if such non-U.S. holder were a resident of the United States. A non-U.S. holder that is a non-U.S. corporation also may be subject to an
136
Table of Contents
additional branch profits tax equal to 30% (or such lower rate specified by an applicable income tax treaty) of a portion of its effectively connected earnings and profits for the taxable year. Non-U.S. holders should consult any applicable income tax treaties that may provide for different rules.
A non-U.S. holder that claims exemption from withholding or the benefit of an applicable income tax treaty generally will be required to satisfy applicable certification and other requirements prior to the distribution date. Non-U.S. holders that do not timely provide us or our paying agent with the required certification, may obtain a refund of any excess amounts withheld by timely filing an appropriate claim for refund with the IRS. Non-U.S. holders should consult their tax advisors regarding their entitlement to benefits under a relevant income tax treaty or applicability of other exemptions from withholding.
Gain on Sale or Other Disposition of Shares of Our Common Stock
Subject to the discussion below regarding backup withholding, a non-U.S. holder generally will not be subject to U.S. federal income tax on any gain realized upon the sale or other disposition of shares of our common stock, unless:
| • | the gain is effectively connected with a trade or business carried on by the non-U.S. holder in the United States and, if required by an applicable income tax treaty, the gain is attributable to a permanent establishment of the non-U.S. holder maintained in the United States; |
| • | the non-U.S. holder is an individual present in the United States for 183 days or more in the taxable year of disposition and certain other requirements are met; or |
| • | we are or have been a U.S. real property holding corporation, or a USRPHC, for U.S. federal income tax purposes at any time within the shorter of the five-year period preceding the disposition and the non-U.S. holder’s holding period for the shares of our common stock, and our common stock has ceased to be traded on an established securities market prior to the beginning of the calendar year in which the sale or other disposition occurs. The determination of whether we are a USRPHC depends on the fair market value of our U.S. real property interests relative to the fair market value of our other trade or business assets and our foreign real property interests. |
We believe we currently are not, and we do not anticipate becoming, a USRPHC for U.S. federal income tax purposes.
Gain described in the first bullet point above will be subject to U.S. federal income tax on a net income basis at regular graduated U.S. federal income tax rates generally in the same manner as if such non-U.S. holder were a resident of the United States. A non-U.S. holder that is a non-U.S. corporation also may be subject to an additional branch profits tax equal to 30% (or such lower rate specified by an applicable income tax treaty) of a portion of its effectively connected earnings and profits for the taxable year. Non-U.S. holders should consult any applicable income tax treaties that may provide for different rules.
Gain described in the second bullet point above will be subject to U.S. federal income tax at a flat 30% rate (or such lower rate specified by an applicable income tax treaty) but may be offset by U.S. source capital losses (even though the individual is not considered a resident of the United States), provided that the non-U.S. holder has timely filed U.S. federal income tax returns with respect to such losses. Non-U.S. holders should consult any applicable income tax treaties that may provide for different rules.
Backup Withholding and Information Reporting
Generally, we must report annually to the IRS and to each non-U.S. holder the amount of dividends paid to, and the tax withheld with respect to, each non-U.S. holder. This information also may be made available under a specific treaty or agreement with the tax authorities in the country in which the non-U.S. holder resides or is
137
Table of Contents
established. Backup withholding generally will not apply to distributions to a non-U.S. holder of shares of our common stock provided the non-U.S. holder furnishes to us or our paying agent the required certification as to its non-U.S. status, such as by providing a valid IRS Form W-8BEN or IRS Form W-8ECI, or certain other requirements are met. Notwithstanding the foregoing, backup withholding may apply if either we or our paying agent has actual knowledge, or reason to know, that the holder is a U.S. person that is not an exempt recipient.
Backup withholding is not an additional tax. Any amounts withheld under the backup withholding rules may be allowed as a refund or a credit against a non-U.S. holder’s U.S. federal income tax liability, provided the required information is timely furnished to the IRS.
New Legislation Relating to Foreign Accounts
Newly enacted legislation may impose withholding taxes on certain types of payments made to “foreign financial institutions,” as specially defined under such rules, and certain other non-U.S. entities. The legislation imposes a 30% withholding tax on dividends on, or gross proceeds from the sale or other disposition of, shares of our common stock paid to a foreign financial institution unless the foreign financial institution enters into an agreement with the U.S. Treasury to, among other things, undertake to identify accounts held by certain U.S. persons or U.S.-owned foreign entities, annually report certain information about such accounts, and withhold 30% on payments to account holders whose actions prevent it from complying with these reporting and other requirements. In addition, the legislation imposes a 30% withholding tax on the same types of payments to a foreign non-financial entity unless the entity certifies that it does not have any substantial U.S. owners or furnishes identifying information regarding each substantial U.S. owner. Pursuant to a recently issued IRS notice and proposed Treasury regulations, these rules generally would apply to payments of dividends made after December 31, 2013, and to gross proceeds from the sale or other disposition of shares of our common stock after December 31, 2014. Prospective investors should consult their tax advisors regarding this legislation.
138
Table of Contents
Subject to the terms and conditions set forth in a purchase agreement among us, the selling stockholders and the underwriters, we and the selling stockholders have agreed to sell to the underwriters, and each of the underwriters has agreed, severally and not jointly, to purchase from us and the selling stockholders, the number of shares of common stock set forth opposite its name below. Merrill Lynch, Pierce, Fenner & Smith Incorporated and Goldman, Sachs & Co. are acting as representatives of each of the underwriters listed below.
| Underwriter | Number of Shares | |
| Merrill Lynch, Pierce, Fenner & Smith Incorporated |
||
| Goldman, Sachs & Co. |
||
| Robert W. Baird & Co. Incorporated |
||
| William Blair & Company, L.L.C. |
||
| Piper Jaffray & Co. |
||
| Stifel, Nicolaus & Company, Incorporated |
||
|
| ||
| Total |
||
|
|
Subject to the terms and conditions set forth in the purchase agreement, the underwriters have agreed, severally and not jointly, to purchase all of the shares sold under the purchase agreement if any of these shares are purchased. If an underwriter defaults, the purchase agreement provides that the purchase commitments of the nondefaulting underwriters may be increased or the purchase agreement may be terminated.
We and the selling stockholders have agreed to indemnify the several underwriters against certain liabilities, including liabilities under the Securities Act, or to contribute to payments the underwriters may be required to make in respect of those liabilities.
The underwriters are offering the shares, subject to prior sale, when, as and if issued to and accepted by them, subject to approval of legal matters by their counsel, including the validity of the shares, and other conditions contained in the purchase agreement, such as the receipt by the underwriters of officer’s certificates and legal opinions. The underwriters reserve the right to withdraw, cancel or modify offers to the public and to reject orders in whole or in part.
Commissions and Discounts
The representatives have advised us that the underwriters propose initially to offer the shares to the public at the public offering price set forth on the cover of this prospectus and to dealers at that price less a concession not in excess of $ per share. After the initial offering, the public offering price, concession or any other term of the offering may be changed.
The following table shows the public offering price, underwriting discount and proceeds before expenses to us and the selling stockholders. The information assumes either no exercise or full exercise by the underwriters of their option to purchase additional shares.
| Per Share | Without Option | With Option | ||||||||||
| Public offering price |
$ | $ | $ | |||||||||
| Underwriting discount |
$ | $ | $ | |||||||||
| Proceeds, before expenses, to us |
$ | $ | $ | |||||||||
| Proceeds, before expenses, to the selling stockholders | $ | $ | $ | |||||||||
The expenses of the offering, not including the underwriting discount, are estimated at $ and are payable by us.
139
Table of Contents
Option to Purchase Additional Shares
The selling stockholders have granted an option to the underwriters to purchase up to additional shares at the public offering price, less the underwriting discount. The underwriters may exercise this option for 30 days from the date of this prospectus. If the underwriters exercise this option, each will be obligated, subject to conditions contained in the purchase agreement, to purchase a number of additional shares proportionate to that underwriter’s initial amount reflected in the above table.
Lockup Agreements
We, our executive officers and directors, the selling stockholders and our other existing security holders have agreed not to sell or transfer any common stock or securities convertible into, exchangeable for, exercisable for, or repayable with common stock, for 180 days after the date of this prospectus without first obtaining the written consent of Merrill Lynch, Pierce, Fenner & Smith Incorporated and Goldman, Sachs & Co. Specifically, we and these other persons have agreed, with certain limited exceptions, not to directly or indirectly:
| • | offer, pledge, sell or contract to sell any common stock; |
| • | sell any option or contract to purchase any common stock; |
| • | purchase any option or contract to sell any common stock; |
| • | grant any option, right or warrant for the sale of any common stock; |
| • | lend or otherwise dispose of or transfer any common stock; |
| • | file, or request or demand or cause to be filed any a registration statement related to the common stock or other securities referred to below; or |
| • | enter into any swap or other agreement or transaction that transfers, in whole or in part, the economic consequence of ownership of any common stock or other securities referred to below, |
whether any such swap or transaction is to be settled by delivery of shares or other securities, in cash or otherwise. However, the lock-up provisions do not restrict these persons from participating as selling stockholders in this offering, including by sale or transfer of their shares or other securities to the underwriters.
This lock-up provision applies to common stock and to securities convertible into or exchangeable or exercisable for or repayable with common stock. It also applies to common stock owned now or acquired later by the person executing the agreement or for which the person executing the agreement later acquires the power of disposition. In the event that either (x) during the last 17 days of the lock-up period referred to above, we issue an earnings release or material news or a material event relating to us occurs or (y) prior to the expiration of the lock-up period, we announce that we will release earnings results or become aware that material news or a material event will occur during the 16-day period beginning on the last day of the lock-up period, the restrictions described above shall continue to apply until the expiration of the 18-day period beginning on the issuance of the earnings release or the occurrence of the material news or material event, unless Merrill Lynch, Pierce, Fenner & Smith Incorporated and Goldman, Sachs & Co. waive, in writing, such extension; provided, however, that the lock-up period extension shall not apply to the extent that FINRA has amended or repealed NASD Rule 2711(f)(4), or has otherwise provided written interpretive guidance regarding such rule, in each case, so as to eliminate the prohibition of any broker, dealer, or member of a national securities association from publishing or distributing any research report, with respect to the securities of an emerging growth company (as defined in the JOBS Act) prior to or after the expiration of any agreement between the broker, dealer, or member of a national securities association and the emerging growth company or its shareholders that restricts or prohibits the sale of securities held by the emerging growth company or its shareholders after the initial public offering date.
Listing
We expect the shares to be approved for listing on the NYSE under the symbol “RH.”
140
Table of Contents
Since June 2008, and prior to this offering, there has been no public market for our common stock. The initial public offering price will be determined through negotiations between us and the representatives. In addition to prevailing market conditions, the factors to be considered in determining the initial public offering price are:
| • | the valuation multiples of publicly traded companies that the representatives believe to be comparable to us; |
| • | our financial information; |
| • | the history of, and the prospects for, our Company and the industry in which we compete; |
| • | an assessment of our management, its past and present operations, and the prospects for, and timing of, our future revenues; |
| • | the present state of our development; and |
| • | the above factors in relation to market values and various valuation measures of other companies engaged in activities similar to ours. |
An active trading market for the shares may not develop. It is also possible that after the offering the shares will not trade in the public market at or above the initial public offering price.
The underwriters do not expect to sell more than 5% of the shares in the aggregate to accounts over which they exercise discretionary authority.
Price Stabilization, Short Positions and Penalty Bids
Until the distribution of the shares is completed, SEC rules may limit underwriters and selling group members from bidding for and purchasing our common stock. However, the representatives may engage in transactions that stabilize the price of the common stock, such as bids or purchases to peg, fix or maintain that price.
In connection with the offering, the underwriters may purchase and sell our common stock in the open market. These transactions may include short sales, purchases on the open market to cover positions created by short sales and stabilizing transactions. Short sales involve the sale by the underwriters of a greater number of shares than they are required to purchase in the offering. “Covered” short sales are sales made in an amount not greater than the underwriters’ option to purchase additional shares described above. The underwriters may close out any covered short position by either exercising their option to purchase additional shares or purchasing shares in the open market. In determining the source of shares to close out the covered short position, the underwriters will consider, among other things, the price of shares available for purchase in the open market as compared to the price at which they may purchase shares through the option to purchase additional shares. “Naked” short sales are sales in excess of the option to purchase additional shares. The underwriters must close out any naked short position by purchasing shares in the open market. A naked short position is more likely to be created if the underwriters are concerned that there may be downward pressure on the price of our common stock in the open market after pricing that could adversely affect investors who purchase in the offering. Stabilizing transactions consist of various bids for or purchases of shares of common stock made by the underwriters in the open market prior to the completion of the offering.
The underwriters may also impose a penalty bid. This occurs when a particular underwriter repays to the underwriters a portion of the underwriting discount received by it because the representatives have repurchased shares sold by or for the account of such underwriter in stabilizing or short covering transactions.
Similar to other purchase transactions, the underwriters’ purchases to cover the syndicate short sales may have the effect of raising or maintaining the market price of our common stock or preventing or retarding a
141
Table of Contents
decline in the market price of our common stock. As a result, the price of our common stock may be higher than the price that might otherwise exist in the open market. The underwriters may conduct these transactions on the NYSE, in the over-the-counter market or otherwise.
Neither we nor any of the underwriters make any representation or prediction as to the direction or magnitude of any effect that the transactions described above may have on the price of our common stock. In addition, neither we nor any of the underwriters make any representation that the representatives will engage in these transactions or that these transactions, once commenced, will not be discontinued without notice.
Electronic Offer, Sale and Distribution of Shares
In connection with the offering, certain of the underwriters or securities dealers may distribute prospectuses by electronic means, such as email.
Conflicts of Interest
Bank of America, N.A., an affiliate of Merrill Lynch, Pierce, Fenner & Smith Incorporated, an underwriter in this offering, is a lender under the Restoration Hardware, Inc. revolving line of credit and term loan and may receive more than 5% of the net proceeds of this offering as a result of our intention to repay borrowings under the revolving line of credit and term loan. Because Merrill Lynch, Pierce, Fenner & Smith Incorporated is an underwriter and may receive more than 5% of the entire net proceeds in this offering, Merrill Lynch, Pierce, Fenner & Smith Incorporated may be deemed to have a “conflict of interest” under the applicable provisions of Rule 5121 of the Conduct Rules of the Financial Industry Regulatory Authority, Inc., or FINRA. Accordingly, this offering will be made in compliance with the applicable provisions of Rules 5110 and 5121 of the Conduct Rules regarding the underwriting of securities of a company with a member that has a conflict of interest within the meaning of those rules. Pursuant to Rule 5121, Goldman, Sachs & Co. has served as the “qualified independent underwriter,” as defined by FINRA, and, in that capacity, has performed due diligence investigations and reviewed and participated in the preparation of the registration statement of which this prospectus forms a part. Goldman, Sachs & Co. has received $10,000 from us as compensation for such role. No underwriter with a conflict of interest will execute sales in discretionary accounts without the prior written specific approval of the customers.
Other Relationships
The underwriters and their respective affiliates are full service financial institutions engaged in various activities, which may include securities trading, commercial and investment banking, financial advisory, investment management, investment research, principal investment, hedging, financing and brokerage activities. Some of the underwriters and their affiliates have engaged in, and may in the future engage in, investment banking and other commercial dealings in the ordinary course of business with us or our affiliates. They have received, or may in the future receive, customary fees and commissions for these transactions.
In addition, in the ordinary course of their business activities, the underwriters and their affiliates may make or hold a broad array of investments and actively trade debt and equity securities (or related derivative securities) and financial instruments (including bank loans) for their own account and for the accounts of their customers. Such investments and securities activities may involve securities and/or instruments of ours or our affiliates. The underwriters and their affiliates may also make investment recommendations and/or publish or express independent research views in respect of such securities or financial instruments and may hold, or recommend to clients that they acquire, long and/or short positions in such securities and instruments.
Notice to Prospective Investors in the European Economic Area
This prospectus is not a prospectus for the purposes of the Prospectus Directive. This prospectus has been prepared on the basis that all offers of the shares will be made pursuant to an exemption under the Prospectus
142
Table of Contents
Directive from the requirement to produce a prospectus in connection with offers of the shares. Accordingly, any person making or intending to make any offer within the European Economic Area of the shares which are the subject of the offering contemplated in this prospectus should only do so in circumstances in which no obligation arises for us to produce a prospectus for such offers.
In relation to each Member State of the European Economic Area which has implemented the Prospectus Directive (each, a “Relevant Member State”), with effect from and including the date on which the Prospectus Directive is implemented in that Relevant Member State (the “Relevant Implementation Date”), no offer of shares may be made to the public in that Relevant Member State other than:
| A. | to any legal entity which is a qualified investor as defined in the Prospectus Directive; |
| B. | to fewer than 150 natural or legal persons (other than qualified investors as defined in the Prospectus Directive), as permitted under the Prospectus Directive, subject to obtaining the prior consent of the representatives; or |
| C. | in any other circumstances falling within Article 3(2) of the Prospectus Directive, |
provided that no such offer of shares shall require us or the representatives to publish a prospectus pursuant to Article 3 of the Prospectus Directive or supplement a prospectus pursuant to Article 16 of the Prospectus Directive.
Each person in a Relevant Member State who initially acquires any shares or to whom any offer is made will be deemed to have represented, acknowledged and agreed that (A) it is a “qualified investor” within the meaning of the law in that Relevant Member State implementing Article 2(1)(e) of the Prospectus Directive, and (B) in the case of any shares acquired by it as a financial intermediary, as that term is used in Article 3(2) of the Prospectus Directive, the shares acquired by it in the offering have not been acquired on behalf of, nor have they been acquired with a view to their offer or resale to, persons in any Relevant Member State other than “qualified investors” as defined in the Prospectus Directive, or in circumstances in which the prior consent of the representatives has been given to the offer or resale. In the case of any shares being offered to a financial intermediary as that term is used in Article 3(2) of the Prospectus Directive, each such financial intermediary will be deemed to have represented, acknowledged and agreed that the shares acquired by it in the offer have not been acquired on a non-discretionary basis on behalf of, nor have they been acquired with a view to their offer or resale to, persons in circumstances which may give rise to an offer of any shares to the public other than their offer or resale in a Relevant Member State to qualified investors as so defined or in circumstances in which the prior consent of the representatives has been obtained to each such proposed offer or resale.
We, the representatives and their affiliates will rely upon the truth and accuracy of the foregoing representation, acknowledgement and agreement.
This prospectus has been prepared on the basis that any offer of shares in any Relevant Member State will be made pursuant to an exemption under the Prospectus Directive from the requirement to publish a prospectus for offers of shares. Accordingly any person making or intending to make an offer in that Relevant Member State of shares which are the subject of the offering contemplated in this prospectus may only do so in circumstances in which no obligation arises for us or any of the underwriters to publish a prospectus pursuant to Article 3 of the Prospectus Directive in relation to such offer. Neither we nor the underwriters have authorized, nor do they authorize, the making of any offer of shares in circumstances in which an obligation arises for us or the underwriters to publish a prospectus for such offer.
For the purpose of the above provisions, the expression “an offer to the public” in relation to any shares in any Relevant Member State means the communication in any form and by any means of sufficient information on the terms of the offer and the shares to be offered so as to enable an investor to decide to purchase or subscribe the shares, as the same may be varied in the Relevant Member State by any measure implementing the
143
Table of Contents
Prospectus Directive in the Relevant Member State and the expression “Prospectus Directive” means Directive 2003/71/EC (including the 2010 PD Amending Directive) and includes any relevant implementing measure in the Relevant Member State and the expression “2010 PD Amending Directive” means Directive 2010/73/EU.
Notice to Prospective Investors in the United Kingdom
In addition, in the United Kingdom, this prospectus is being distributed only to, and is directed only at, and any offer subsequently made may only be directed at persons who are “qualified investors” (as defined in the Prospectus Directive) (i) who have professional experience in matters relating to investments falling within Article 19 (5) of the Financial Services and Markets Act 2000 (Financial Promotion) Order 2005, as amended (the “Order”) and/or (ii) who are high net worth companies (or persons to whom it may otherwise be lawfully communicated) falling within Article 49(2)(a) to (d) of the Order (all such persons together being referred to as “relevant persons”). This prospectus must not be acted on or relied on in the United Kingdom by persons who are not relevant persons. In the United Kingdom, any investment or investment activity to which this prospectus relates is only available to, and will be engaged in with, relevant persons.
Notice to Prospective Investors in Hong Kong
This prospectus has not been approved by or registered with the Securities and Futures Commission of Hong Kong or the Registrar of Companies of Hong Kong. The shares will not be offered or sold in Hong Kong other than (a) to “professional investors” as defined in the Securities and Futures Ordinance (Cap. 571) of Hong Kong and any rules made under that Ordinance; or (b) in other circumstances which do not result in the document being a “prospectus” as defined in the Companies Ordinance (Cap. 32) of Hong Kong or which do not constitute an offer to the public within the meaning of that Ordinance. No advertisement, invitation or document relating to the shares which is directed at, or the contents of which are likely to be accessed or read by, the public of Hong Kong (except if permitted to do so under the securities laws of Hong Kong) has been issued or will be issued in Hong Kong or elsewhere other than with respect to shares which are or are intended to be disposed of only to persons outside Hong Kong or only to “professional investors” as defined in the Securities and Futures Ordinance and any rules made under that Ordinance.
Notice to Prospective Investors in Singapore
This prospectus has not been registered as a prospectus with the Monetary Authority of Singapore. Accordingly, this prospectus and any other document or material in connection with the offer or sale, or invitation for subscription or purchase, of the shares may not be circulated or distributed, nor may the shares be offered or sold, or be made the subject of an invitation for subscription or purchase, whether directly or indirectly, to persons in Singapore other than (i) to an institutional investor under Section 274 of the Securities and Futures Act (Chapter 289) (the “SFA”), (ii) to a relevant person, or any person pursuant to Section 275(1A) of the SFA, and in accordance with the conditions, specified in Section 275 of the SFA or (iii) otherwise pursuant to, and in accordance with the conditions of, any other applicable provision of the SFA.
Where the shares are subscribed or purchased under Section 275 by a relevant person which is: (a) a corporation (which is not an accredited investor) the sole business of which is to hold investments and the entire share capital of which is owned by one or more individuals, each of whom is an accredited investor; or (b) a trust (where the trustee is not an accredited investor) whose sole purpose is to hold investments and each beneficiary is an accredited investor, then shares, debentures and units of shares and debentures of that corporation or the beneficiaries’ rights and interest in that trust shall not be transferable for six months after that corporation or that trust has acquired the shares under Section 275 except: (i) to an institutional investor under Section 274 of the SFA or to a relevant person, or any person pursuant to Section 275(1A) of the SFA, and in accordance with the conditions, specified in Section 275 of the SFA; (ii) where no consideration is given for the transfer; or (iii) by operation of law.
144
Table of Contents
Notice to Prospective Investors in Japan
The shares have not been and will not be registered under the Financial Instruments and Exchange Law of Japan (Law No. 25 of 1948, as amended) and, accordingly, will not be offered or sold, directly or indirectly, in Japan, or for the benefit of any Japanese Person or to others for re-offering or resale, directly or indirectly, in Japan or to any Japanese Person, except in compliance with all applicable laws, regulations and ministerial guidelines promulgated by relevant Japanese governmental or regulatory authorities in effect at the relevant time. For the purposes of this paragraph, “Japanese Person” shall mean any person resident in Japan, including any corporation or other entity organized under the laws of Japan.
Notice to Prospective Investors in Switzerland
The shares may not be publicly offered in Switzerland and will not be listed on the SIX Swiss Exchange (“SIX”) or on any other stock exchange or regulated trading facility in Switzerland. This document has been prepared without regard to the disclosure standards for issuance prospectuses under art. 652a or art. 1156 of the Swiss Code of Obligations or the disclosure standards for listing prospectuses under art. 27 ff. of the SIX Listing Rules or the listing rules of any other stock exchange or regulated trading facility in Switzerland. Neither this document nor any other offering or marketing material relating to the shares or the offering may be publicly distributed or otherwise made publicly available in Switzerland.
Neither this prospectus nor any other offering or marketing material relating to the offering, the Company or the shares have been or will be filed with or approved by any Swiss regulatory authority. In particular, this prospectus will not be filed with, and the offer of shares will not be supervised by, the Swiss Financial Market Supervisory Authority, and the offer of shares has not been and will not be authorized under the Swiss Federal Act on Collective Investment Schemes (“CISA”). The investor protection afforded to acquirers of interests in collective investment schemes under the CISA does not extend to acquirers of shares.
Notice to Prospective Investors in the Dubai International Financial Centre
This prospectus relates to an Exempt Offer in accordance with the Offered Securities Rules of the Dubai Financial Services Authority (“DFSA”). This prospectus is intended for distribution only to persons of a type specified in the Offered Securities Rules of the DFSA. It must not be delivered to, or relied on by, any other person. The DFSA has no responsibility for reviewing or verifying any documents in connection with Exempt Offers. The DFSA has not approved this prospectus nor taken steps to verify the information set forth herein and has no responsibility for the prospectus. The shares to which this prospectus relates may be illiquid and/or subject to restrictions on their resale. Prospective purchasers of the shares offered should conduct their own due diligence on the shares. If you do not understand the contents of this prospectus you should consult an authorized financial advisor.
145
Table of Contents
The validity of the common stock offered hereby will be passed upon for us by Morrison & Foerster LLP, San Francisco, California. Certain legal matters will be passed upon for the underwriters by Sidley Austin LLP, San Francisco, California.
The balance sheets of Restoration Hardware Holdings, Inc. as of September 2, 2011 and January 28, 2012 and the consolidated financial statements of Restoration Hardware, Inc. as of January 29, 2011 and January 28, 2012 and for the fiscal years ended January 30, 2010, January 29, 2011 and January 28, 2012 included in this prospectus have been so included in reliance on the reports of PricewaterhouseCoopers LLP, an independent registered public accounting firm, given on the authority of said firm as experts in auditing and accounting.
146
Table of Contents
WHERE YOU CAN FIND MORE INFORMATION
We have filed with the SEC a registration statement on Form S-1 under the Securities Act that registers the shares of our common stock to be sold in this offering. The registration statement, including the attached exhibits, contains additional relevant information about us and our common stock. The rules and regulations of the SEC allow us to omit from this document certain information included in the registration statement.
You may read and copy the reports and other information we file with the SEC at the SEC’s Public Reference Room at 100 F Street, N.E., Room 1580, Washington, D.C. 20549. You may also obtain copies of this information by mail from the public reference section of the SEC, 100 F Street, N.E., Washington, D.C. 20549, at prescribed rates. You may obtain information regarding the operation of the public reference room by calling 1-800-SEC-0330. The SEC also maintains a website that contains reports, proxy statements and other information about issuers, like us, who file electronically with the SEC. The address of that website is http://www.sec.gov.
Upon completion of this offering, we will become subject to the reporting, proxy and information requirements of the Exchange Act, and as a result will be required to file periodic reports, proxy statements and other information with the SEC. These periodic reports, proxy statements and other information will be available for inspection and copying at the SEC’s public reference room and on the website of the SEC referred to above, as well as on our websites, www.restorationhardware.com and www.rh.com. The contents of our website are not part of this prospectus, and you should not consider the contents of our website in making an investment decision with respect to our common stock.
We intend to furnish our stockholders with annual reports containing audited financial statements and make available to our stockholders quarterly reports for the first three quarters of each fiscal year containing unaudited interim financial information.
147
Table of Contents
INDEX TO CONSOLIDATED FINANCIAL STATEMENTS
| Page Number |
||||
| Restoration Hardware Holdings, Inc. |
||||
| Report of PricewaterhouseCoopers LLP, an Independent Registered Public Accounting Firm |
F-2 | |||
| Audited Financial Statements |
||||
| Balance Sheets as of September 2, 2011, and January 28, 2012 |
F-3 | |||
| F-4 | ||||
| Unaudited Financial Statements |
||||
| F-5 | ||||
| F-6 | ||||
| Restoration Hardware, Inc. |
||||
| Report of PricewaterhouseCoopers LLP, an Independent Registered Public Accounting Firm |
F-7 | |||
| Audited Consolidated Financial Statements |
||||
| Consolidated Balance Sheets as of January 29, 2011, and January 28, 2012 |
F-8 | |||
| F-9 | ||||
| F-10 | ||||
| F-11 | ||||
| F-12 | ||||
| F-13 | ||||
| Unaudited Condensed Consolidated Financial Statements |
||||
| Condensed Consolidated Balance Sheets as of January 28, 2012, and July 28, 2012 |
F-37 | |||
| F-38 | ||||
| F-39 | ||||
| F-40 | ||||
| F-41 | ||||
F-1
Table of Contents
REPORT OF INDEPENDENT REGISTERED PUBLIC ACCOUNTING FIRM
To the Board of Directors of Restoration Hardware Holdings, Inc.:
In our opinion, the accompanying balance sheets present fairly, in all material respects, the financial position of Restoration Hardware Holdings, Inc. at September 2, 2011, and January 28, 2012, in conformity with accounting principles generally accepted in the United States of America. The balance sheets are the responsibility of the Company’s management. Our responsibility is to express an opinion on these balance sheets based on our audits. We conducted our audits of these statements in accordance with the standards of the Public Company Accounting Oversight Board (United States). Those standards require that we plan and perform the audit to obtain reasonable assurance about whether the balance sheets are free of material misstatement. An audit includes examining, on a test basis, evidence supporting the amounts and disclosures in the balance sheets, assessing the accounting principles used and significant estimates made by management, and evaluating the overall balance sheet presentation. We believe that our audits provide a reasonable basis for our opinion.
/s/ PricewaterhouseCoopers LLP
San Francisco, CA
April 26, 2012
F-2
Table of Contents
RESTORATION HARDWARE HOLDINGS, INC.
BALANCE SHEETS
(In thousands, except share amounts)
| September 2, 2011 |
January 28, 2012 |
|||||||
| ASSETS |
||||||||
| Current assets: |
||||||||
| Cash and cash equivalents |
$ | 1 | $ | 1 | ||||
|
|
|
|
|
|||||
| Total assets |
$ | 1 | $ | 1 | ||||
|
|
|
|
|
|||||
| LIABILITIES AND STOCKHOLDER’S EQUITY |
||||||||
| Commitments and contingencies |
$ | — | $ | — | ||||
| Stockholder’s equity: |
||||||||
| Common stock, zero par value, 1,000 shares authorized, 1,000 shares issued and outstanding as of both September 2, 2011 and January 28, 2012 |
— | — | ||||||
| Additional paid-in capital |
1 | 1 | ||||||
|
|
|
|
|
|||||
| Total liabilities and stockholder’s equity |
$ | 1 | $ | 1 | ||||
|
|
|
|
|
|||||
The accompanying notes are an integral part of these Balance Sheets.
F-3
Table of Contents
RESTORATION HARDWARE HOLDINGS, INC.
NOTES TO BALANCE SHEETS
NOTE 1—THE COMPANY
Restoration Hardware Holdings, Inc. (the “Company”), a Delaware corporation, was formed on August 18, 2011 and capitalized on September 2, 2011 as a holding company for the purposes of facilitating an initial public offering of common equity. The Company has not engaged in any business or other activities. It is expected that following an internal reorganization, Restoration Hardware, Inc., a Delaware corporation, will become a direct, wholly owned subsidiary of the Company prior to the completion of the initial public offering.
NOTE 2—SUMMARY OF SIGNIFICANT ACCOUNTING POLICIES
The balance sheets and accompanying notes are prepared in accordance with accounting principles generally accepted in the United States.
Cash and Cash Equivalents
The Company considers highly liquid investments with original maturities of three months or less to be cash equivalents.
NOTE 3—SUBSEQUENT EVENTS
Management has evaluated all events and transactions that occurred after January 28, 2012, through April 26, 2012, which is the date the financial statements are available to be issued. No material subsequent events have occurred since January 28, 2012 that require recognition or disclosure in these financial statements.
F-4
Table of Contents
RESTORATION HARDWARE HOLDINGS, INC.
BALANCE SHEETS
(In thousands, except share amounts)
(Unaudited)
| January 28, 2012 |
July 28, 2012 |
|||||||
| ASSETS |
||||||||
| Current assets: |
||||||||
| Cash and cash equivalents |
$ | 1 | $ | 1 | ||||
|
|
|
|
|
|||||
| Total assets |
$ | 1 | $ | 1 | ||||
|
|
|
|
|
|||||
| LIABILITIES AND STOCKHOLDER’S EQUITY |
||||||||
| Commitments and contingencies |
$ | — | $ | — | ||||
| Stockholder’s equity: |
||||||||
| Common stock, zero par value, 1,000 shares authorized, 1,000 shares issued and outstanding as of both January 28, 2012 and July 28, 2012 |
— | — | ||||||
| Additional paid-in capital |
1 | 1 | ||||||
|
|
|
|
|
|||||
| Total liabilities and stockholder’s equity |
$ | 1 | $ | 1 | ||||
|
|
|
|
|
|||||
The accompanying notes are an integral part of these Balance Sheets.
F-5
Table of Contents
RESTORATION HARDWARE HOLDINGS, INC.
NOTES TO BALANCE SHEETS
(Unaudited)
NOTE 1—THE COMPANY
Restoration Hardware Holdings, Inc. (the “Company”), a Delaware corporation, was formed on August 18, 2011 and capitalized on September 2, 2011 as a holding company for the purposes of facilitating an initial public offering of common equity. The Company has not engaged in any business or other activities. It is expected that following an internal reorganization, Restoration Hardware, Inc., a Delaware corporation, will become a direct, wholly owned subsidiary of the Company prior to the completion of the initial public offering.
NOTE 2—SUMMARY OF SIGNIFICANT ACCOUNTING POLICIES
The balance sheets and accompanying notes are prepared in accordance with accounting principles generally accepted in the United States.
Cash and Cash Equivalents
The Company considers highly liquid investments with original maturities of three months or less to be cash equivalents.
NOTE 3—SUBSEQUENT EVENTS
Management has evaluated all events and transactions that occurred after July 28, 2012, through September 19, 2012, which is the date the financial statements are available to be issued. No material subsequent events have occurred since July 28, 2012 that require recognition or disclosure in these financial statements.
F-6
Table of Contents
REPORT OF INDEPENDENT REGISTERED PUBLIC ACCOUNTING FIRM
To the Board of Directors of Restoration Hardware, Inc.:
In our opinion, the accompanying consolidated balance sheets and the related consolidated statements of operations, comprehensive loss, stockholders’ equity and cash flows present fairly, in all material respects, the financial position of Restoration Hardware, Inc. and its subsidiaries at January 29, 2011, and January 28, 2012, and the results of their operations and their cash flows for the years ended January 30, 2010, January 29, 2011, and January 28, 2012 in conformity with accounting principles generally accepted in the United States of America. These financial statements are the responsibility of the Company’s management. Our responsibility is to express an opinion on these financial statements based on our audits. We conducted our audits of these statements in accordance with the standards of the Public Company Accounting Oversight Board (United States). Those standards require that we plan and perform the audit to obtain reasonable assurance about whether the financial statements are free of material misstatement. An audit includes examining, on a test basis, evidence supporting the amounts and disclosures in the financial statements, assessing the accounting principles used and significant estimates made by management, and evaluating the overall financial statement presentation. We believe that our audits provide a reasonable basis for our opinion.
/s/ PricewaterhouseCoopers LLP
San Francisco, CA
April 26, 2012, except for the change in the presentation of comprehensive income discussed in Note 3, as to which the date is June 25, 2012.
F-7
Table of Contents
CONSOLIDATED BALANCE SHEETS
(In thousands, except share amounts)
| January 29, 2011 |
January 28, 2012 |
|||||||
| ASSETS |
||||||||
| Current assets: |
||||||||
| Cash and cash equivalents |
$ | 13,364 | $ | 8,511 | ||||
| Accounts receivable—net |
4,462 | 11,759 | ||||||
| Merchandise inventories |
206,406 | 245,876 | ||||||
| Prepaid expense and other current assets |
20,361 | 56,731 | ||||||
|
|
|
|
|
|||||
| Total current assets |
244,593 | 322,877 | ||||||
| Property and equipment—net |
76,450 | 83,558 | ||||||
| Goodwill |
122,603 | 122,595 | ||||||
| Trademarks |
47,100 | 47,100 | ||||||
| Other intangible assets—net |
8,793 | 5,426 | ||||||
| Other assets |
2,452 | 5,253 | ||||||
|
|
|
|
|
|||||
| Total assets |
$ | 501,991 | $ | 586,809 | ||||
|
|
|
|
|
|||||
| LIABILITIES AND STOCKHOLDERS’ EQUITY |
||||||||
| Current liabilities: |
||||||||
| Accounts payable and accrued expenses |
$ | 90,726 | $ | 105,694 | ||||
| Deferred revenue and customer deposits |
14,001 | 25,419 | ||||||
| Other current liabilities |
25,000 | 30,861 | ||||||
|
|
|
|
|
|||||
| Total current liabilities |
129,727 | 161,974 | ||||||
| Revolving line of credit |
111,837 | 107,502 | ||||||
| Term loan |
— | 14,798 | ||||||
| Deferred rent and lease incentives |
18,130 | 19,851 | ||||||
| Deferred tax liabilities |
17,853 | 22,153 | ||||||
| Other long-term obligations |
8,640 | 10,069 | ||||||
|
|
|
|
|
|||||
| Total liabilities |
286,187 | 336,347 | ||||||
|
|
|
|
|
|||||
| Commitments and contingencies (See Note 14 to the consolidated financial statements) |
— | — | ||||||
| Stockholders’ equity: |
||||||||
| Common stock, $0.01 par value, 1,000 shares authorized, 100 shares issued and outstanding as of both January 29, 2011 and January 28, 2012 |
— | — | ||||||
| Additional paid-in capital |
279,126 | 293,280 | ||||||
| Accumulated other comprehensive income |
987 | 1,150 | ||||||
| Accumulated deficit |
(64,309 | ) | (43,968 | ) | ||||
|
|
|
|
|
|||||
| Total stockholders’ equity |
215,804 | 250,462 | ||||||
|
|
|
|
|
|||||
| Total liabilities and stockholders’ equity |
$ | 501,991 | $ | 586,809 | ||||
|
|
|
|
|
|||||
The accompanying notes are an integral part of these Consolidated Financial Statements.
F-8
Table of Contents
CONSOLIDATED STATEMENTS OF OPERATIONS
(In thousands, except share and per share amounts)
| Year Ended | ||||||||||||
| January 30, 2010 |
January 29, 2011 |
January 28, 2012 |
||||||||||
| Net revenues |
$ | 625,685 | $ | 772,752 | $ | 958,084 | ||||||
| Cost of goods sold |
412,629 | 501,132 | 601,735 | |||||||||
|
|
|
|
|
|
|
|||||||
| Gross profit |
213,056 | 271,620 | 356,349 | |||||||||
| Selling, general and administrative expenses |
238,889 | 275,859 | 329,753 | |||||||||
|
|
|
|
|
|
|
|||||||
| Income (loss) from operations |
(25,833 | ) | (4,239 | ) | 26,596 | |||||||
| Interest expense |
(3,241 | ) | (3,150 | ) | (5,134 | ) | ||||||
|
|
|
|
|
|
|
|||||||
| Income (loss) before income taxes |
(29,074 | ) | (7,389 | ) | 21,462 | |||||||
| Income tax expense (benefit) |
(423 | ) | 685 | 1,121 | ||||||||
|
|
|
|
|
|
|
|||||||
| Net income (loss) |
$ | (28,651 | ) | $ | (8,074 | ) | $ | 20,341 | ||||
|
|
|
|
|
|
|
|||||||
| Basic and diluted net income (loss) per share |
$ | (286,510 | ) | $ | (80,740 | ) | $ | 203,410 | ||||
| Shares used in computing basic and diluted net income (loss) per share |
100 | 100 | 100 | |||||||||
| Pro forma basic and diluted net income per share (unaudited) |
$ | |||||||||||
| Pro forma shares used in computing basic and diluted net income per share (unaudited) |
||||||||||||
The accompanying notes are an integral part of these Consolidated Financial Statements.
F-9
Table of Contents
CONDENSED CONSOLIDATED STATEMENTS OF COMPREHENSIVE INCOME (LOSS)
(In thousands)
| Year Ended | ||||||||||||
| January 30, 2010 |
January 29, 2011 |
January 28, 2012 |
||||||||||
| Net income (loss) |
$ | (28,651 | ) | $ | (8,074 | ) | $ | 20,341 | ||||
| Foreign currency translation adjustment—net of tax |
1,576 | 657 | 163 | |||||||||
|
|
|
|
|
|
|
|||||||
| Total comprehensive income (loss) |
$ | (27,075 | ) | $ | (7,417 | ) | $ | 20,504 | ||||
|
|
|
|
|
|
|
|||||||
The accompanying notes are an integral part of these Consolidated Financial Statements.
F-10
Table of Contents
CONSOLIDATED STATEMENTS OF STOCKHOLDERS’ EQUITY
(In thousands, except share amounts)
| Common Stock | Additional Paid-In Capital |
Accumulated Other Comprehensive Income (Loss) |
Accumulated Deficit |
Total Stockholders’ Equity |
||||||||||||||||||||
| Shares | Amount | |||||||||||||||||||||||
| Balances—January 31, 2009 |
100 | $ | — | $ | 267,500 | $ | (1,246 | ) | $ | (27,584 | ) | $ | 238,670 | |||||||||||
| Capital contribution |
— | — | 5,000 | — | — | 5,000 | ||||||||||||||||||
| Capital contribution—management fee |
— | — | 3,892 | — | — | 3,892 | ||||||||||||||||||
| Stock-based compensation |
— | — | 592 | — | — | 592 | ||||||||||||||||||
| Net loss |
— | — | — | — | (28,651 | ) | (28,651 | ) | ||||||||||||||||
| Foreign currency translation adjustment—net of tax |
— | — | — | 1,576 | — | 1,576 | ||||||||||||||||||
|
|
|
|
|
|
|
|
|
|
|
|
|
|||||||||||||
| Balances—January 30, 2010 |
100 | — | 276,984 | 330 | (56,235 | ) | 221,079 | |||||||||||||||||
| Stock-based compensation |
— | — | 2,142 | — | — | 2,142 | ||||||||||||||||||
| Net loss |
— | — | — | — | (8,074 | ) | (8,074 | ) | ||||||||||||||||
| Foreign currency translation adjustment—net of tax |
— | — | — | 657 | — | 657 | ||||||||||||||||||
|
|
|
|
|
|
|
|
|
|
|
|
|
|||||||||||||
| Balances—January 29, 2011 |
100 | — | 279,126 | 987 | (64,309 | ) | 215,804 | |||||||||||||||||
| Stock-based compensation |
— | — | 1,804 | — | — | 1,804 | ||||||||||||||||||
| Capital contribution—executive compensation |
— | — | 6,350 | — | — | 6,350 | ||||||||||||||||||
| Capital contribution—management fee |
— | — | 6,000 | — | — | 6,000 | ||||||||||||||||||
| Net income |
— | — | — | — | 20,341 | 20,341 | ||||||||||||||||||
| Foreign currency translation adjustment—net of tax |
— | — | — | 163 | — | 163 | ||||||||||||||||||
|
|
|
|
|
|
|
|
|
|
|
|
|
|||||||||||||
| Balances—January 28, 2012 |
100 | $ | — | $ | 293,280 | $ | 1,150 | $ | (43,968 | ) | $ | 250,462 | ||||||||||||
|
|
|
|
|
|
|
|
|
|
|
|
|
|||||||||||||
The accompanying notes are an integral part of these Consolidated Financial Statements.
F-11
Table of Contents
CONSOLIDATED STATEMENTS OF CASH FLOWS
(In thousands)
| Year Ended | ||||||||||||
| January 30, 2010 |
January 29, 2011 |
January 28, 2012 |
||||||||||
| CASH FLOWS FROM OPERATING ACTIVITIES |
||||||||||||
| Net income (loss) |
$ | (28,651 | ) | $ | (8,074 | ) | $ | 20,341 | ||||
| Adjustments to reconcile net income (loss) to net cash provided by |
||||||||||||
| Depreciation and amortization |
43,065 | 31,263 | 29,186 | |||||||||
| Net non-cash charges resulting from inventory fair value adjustment |
(12,780 | ) | — | — | ||||||||
| Impairment of property and equipment |
2,304 | 2,115 | — | |||||||||
| Loss on disposal of property and equipment |
— | — | 674 | |||||||||
| Stock-based compensation expense |
592 | 2,142 | 1,804 | |||||||||
| Capital contribution—executive compensation |
— | — | 6,350 | |||||||||
| Capital contribution—management fee paid by Parent on behalf of the Company |
3,892 | — | 6,000 | |||||||||
| Deferred income taxes |
(179 | ) | (427 | ) | 4,299 | |||||||
| Amortization of financing fees |
193 | 193 | 573 | |||||||||
| Change in assets and liabilities: |
||||||||||||
| Accounts receivable |
3,804 | 68 | (7,280 | ) | ||||||||
| Merchandise inventories |
34,953 | (57,103 | ) | (39,475 | ) | |||||||
| Prepaid expense and other current assets |
(1,009 | ) | (1,477 | ) | (36,371 | ) | ||||||
| Other assets |
704 | (797 | ) | (573 | ) | |||||||
| Accounts payable and accrued expenses |
8,202 | 5,475 | 14,374 | |||||||||
| Deferred revenue and customer deposits |
1,188 | 2,503 | 11,418 | |||||||||
| Other current liabilities |
(208 | ) | 3,395 | 3,915 | ||||||||
| Deferred rent and lease incentives |
1,236 | 8,638 | 1,732 | |||||||||
| Other long-term obligations |
(238 | ) | 276 | 154 | ||||||||
|
|
|
|
|
|
|
|||||||
| Net cash provided by (used in) operating activities |
57,068 | (11,810 | ) | 17,121 | ||||||||
|
|
|
|
|
|
|
|||||||
| CASH FLOWS FROM INVESTING ACTIVITIES |
||||||||||||
| Capital expenditures |
(2,024 | ) | (39,907 | ) | (25,593 | ) | ||||||
|
|
|
|
|
|
|
|||||||
| Net cash used in investing activities |
(2,024 | ) | (39,907 | ) | (25,593 | ) | ||||||
|
|
|
|
|
|
|
|||||||
| CASH FLOWS FROM FINANCING ACTIVITIES |
||||||||||||
| Gross borrowings under revolving line of credit |
616,878 | 875,936 | 1,007,330 | |||||||||
| Gross repayments under revolving line of credit |
(670,325 | ) | (821,734 | ) | (1,011,937 | ) | ||||||
| Proceeds from issuance of term loan |
— | — | 15,000 | |||||||||
| Debt issuance costs |
— | — | (2,835 | ) | ||||||||
| Payments on capital leases and other long-term obligations |
(2,608 | ) | (2,601 | ) | (4,188 | ) | ||||||
| Capital contributions |
5,000 | — | — | |||||||||
|
|
|
|
|
|
|
|||||||
| Net cash (used in) provided by financing activities |
(51,055 | ) | 51,601 | 3,370 | ||||||||
|
|
|
|
|
|
|
|||||||
| Effects of foreign currency exchange rate translation |
594 | 294 | 249 | |||||||||
|
|
|
|
|
|
|
|||||||
| Net increase (decrease) in cash and cash equivalents |
4,583 | 178 | (4,853 | ) | ||||||||
| Cash and cash equivalents |
||||||||||||
| Beginning of period |
8,603 | 13,186 | 13,364 | |||||||||
|
|
|
|
|
|
|
|||||||
| End of period |
$ | 13,186 | $ | 13,364 | $ | 8,511 | ||||||
|
|
|
|
|
|
|
|||||||
| Cash paid for interest |
$ | 2,761 | $ | 2,068 | $ | 3,737 | ||||||
| Cash paid for taxes |
354 | 744 | 1,697 | |||||||||
| Non-cash transactions: |
||||||||||||
| Property and equipment acquired under capital lease |
— | 3,550 | 7,770 | |||||||||
| Property and equipment additions in accounts payable |
41 | 454 | 645 | |||||||||
| Capital contribution—executive compensation |
— | — | 6,350 | |||||||||
| Capital contribution—management fee paid by Parent on behalf of the Company |
3,892 | — | 6,000 | |||||||||
The accompanying notes are an integral part of these Consolidated Financial Statements.
F-12
Table of Contents
NOTES TO CONSOLIDATED FINANCIAL STATEMENTS
NOTE 1—NATURE OF BUSINESS
Restoration Hardware, Inc., a Delaware corporation, together with its subsidiaries (collectively, the “Company”), is a luxury home furnishings retailer that offers a growing number of categories including furniture, lighting, textiles, bathware, décor, outdoor, garden, and baby and child products. These products are sold through the Company’s stores, catalogs and websites. As of January 28, 2012, the Company operated a total of 74 retail stores and 10 outlet stores in 29 states, the District of Columbia and Canada, and had sourcing operations in Shanghai and Hong Kong.
NOTE 2—ORGANIZATION
In June 2008, the Company completed a merger with a wholly owned subsidiary (“Merger Sub”) of Home Holdings, LLC (“Parent”), a Delaware limited liability company, pursuant to which Merger Sub merged with and into the Company and the Company became a direct wholly owned subsidiary of Parent (the “Acquisition”). Parent is controlled by investment funds affiliated with Catterton Management Company, LLC (“Catterton”) and Tower Three Partners, LLC (“Tower Three”). In addition, certain of the Company’s stockholders prior to the merger (including Mr. Friedman and certain funds affiliated with GJK Capital Advisors, LLC (“Glenhill”)) exchanged their shares of the Company’s common stock for equity interests in Parent in connection with the Acquisition.
Subsequent to the Acquisition, Parent has transferred an additional $40 million to the Company, which was originally contributed by Parent’s equityholders to Parent, and is recorded as additional paid-in capital on the consolidated statements of stockholders’ equity. Parent transferred $35 million of such funds to the Company in 2008 and $5 million of such funds to the Company in fiscal 2009.
In connection with the Acquisition, goodwill of $122.3 million was recognized by the Company.
NOTE 3—SIGNIFICANT ACCOUNTING POLICIES
Basis of Presentation
These consolidated financial statements are prepared in conformity with accounting principles generally accepted in the United States (“GAAP”). The consolidated financial statements include the accounts of the Company and its wholly owned subsidiaries. Accordingly, all intercompany balances and transactions have been eliminated through the consolidation process.
Fiscal Years
The Company’s fiscal year ends on the Saturday closest to January 31. As a result, the Company’s fiscal year may include 53 weeks. The fiscal years ended January 30, 2010 ( “fiscal 2009”), January 29, 2011 (“fiscal 2010”), and January 28, 2012 (“fiscal 2011”) each consisted of 52 weeks.
Use of Accounting Estimates
The preparation of the Company’s consolidated financial statements in conformity with GAAP requires management to make estimates and assumptions that affect the reported amounts of assets and liabilities and disclosures of contingent assets and liabilities at the date of the consolidated financial statements and the reported amounts of revenues and expenses during the reporting period. Actual results could differ from those estimates and such differences could be material to the consolidated financial statements.
F-13
Table of Contents
Cash and Cash Equivalents
The Company considers highly liquid investments with original maturities of three months or less to be cash equivalents.
Concentration of Credit Risk
The Company maintains its cash and cash equivalent accounts in financial institutions in both U.S. dollar and Canadian dollar denominations. Accounts at the U.S. institutions are insured by the Federal Deposit Insurance Corporation (“FDIC”) up to $250,000 and accounts at the Canadian institutions are insured by the Canada Deposit Insurance Corporation (“CDIC”) up to $100,000 Canadian dollars. As of January 28, 2012, the Company had four U.S. bank account balances that were in excess of the FDIC insurance limit. No Canadian bank account balances were in excess of the CIDC insurance limit as of January 28, 2012. The Company performs ongoing evaluations of these institutions to limit its concentration of credit risk.
Accounts Receivable
Accounts receivable consist primarily of receivables from the Company’s credit card processors for sales transactions and tenant improvement allowances from the Company’s landlords in connection with new leases. Accounts receivable is presented net of allowance for doubtful accounts which is recorded on a specific identification basis. The allowance for doubtful accounts was not significant as of January 29, 2011 and January 28, 2012.
Merchandise Inventories
The Company’s merchandise inventories are comprised of finished goods and are carried at the lower of cost or market, with cost determined on a weighted average cost method and market determined based on the estimated net realizable value. To determine if the value of inventory should be marked down below original cost, the Company considers current and anticipated demand, customer preference and the merchandise age. The inventory value is adjusted periodically to reflect current market conditions, which requires management judgments that may significantly affect the ending inventory valuation, as well as gross margin. The significant estimates used in inventory valuation are obsolescence (including excess and slow-moving inventory and lower of cost or market reserves) and estimates of inventory shrinkage. The Company adjusts its inventory for obsolescence based on historical trends, aging reports, specific identification and its estimates of future retail sales prices.
Reserves for shrinkage are estimated and recorded throughout the period as a percentage of net sales based on historical shrinkage results and current inventory levels. Actual shrinkage is recorded throughout the year based upon periodic cycle counts and the results of the Company’s annual physical inventory count. Actual inventory shrinkage and obsolescence can vary from estimates due to factors including the mix of the Company’s inventory (which ranges from large furniture to decorative accessories) and execution against loss prevention initiatives in the Company’s stores, distribution centers, off-site storage locations and with its third-party transportation providers.
Due to these factors, the Company’s obsolescence and shrinkage reserves contain uncertainties. Both estimates have calculations that require management to make assumptions and to apply judgment regarding a number of factors, including market conditions, the selling environment, historical results and current inventory trends. If actual obsolescence or shrinkage estimates change from the Company’s original estimates, the Company will adjust its inventory reserves accordingly throughout the period. Management does not believe that changes in the assumptions used in these estimates would have a significant effect on the Company’s net income (loss) or inventory balances. The Company’s inventory reserve balances were $3.7 million and $5.6 million as of January 29, 2011 and January 28, 2012, respectively.
F-14
Table of Contents
The allocation of the purchase price accounting as a result of the Acquisition had the net effect of reducing the carrying amount of the Company’s inventory by $47.9 million at the time of the Acquisition. This decrease in inventory value was amortized to cost of goods sold over a nine-month period, resulting in a decrease to costs of goods sold of $12.8 million in fiscal 2009. As this amount was fully amortized in fiscal 2009, there was no impact in fiscal 2010 or fiscal 2011.
Prepaid Catalog and Advertising Expenses
Advertising expenses primarily represent the costs associated with the Company’s catalog mailings, as well as print and website marketing. All advertising costs are expensed as incurred, with the exception of prepaid catalog expenses. Prepaid catalog expenses consist primarily of third-party incremental direct costs to prepare, print and distribute catalogs. Such costs are capitalized as prepaid catalog expenses and are amortized over their expected period of future benefit. Such amortization is based upon the ratio of actual revenues to the total of actual and estimated future revenues on an individual catalog basis. Estimated future revenues are based upon various factors such as the total number of catalogs and pages circulated, the probability and magnitude of consumer response and the assortment of merchandise offered. Each catalog is generally fully amortized within a six- to seven-month period, with the majority of the amortization occurring within the first three to four months. Prepaid catalog expenses are evaluated for realizability on a regular basis by comparing the carrying amount associated with each catalog to the estimated probable remaining future sales associated with that catalog. The Company had $6.6 million and $28.6 million of prepaid catalog costs that are included in prepaid expense and other current assets on the consolidated balance sheets as of January 29, 2011, and January 28, 2012, respectively.
Advertising costs, recorded in selling, general and administrative expenses, were $43.6 million, $56.1 million, and $66.9 million in fiscal 2009, fiscal 2010, and fiscal 2011, respectively.
Property and Equipment
Property and equipment is recorded at cost, net of accumulated depreciation and amortization. Depreciation is calculated using the straight-line method, generally using the following useful lives:
| Category of Property and Equipment |
Useful Life | |
| Building |
40 years | |
| Furniture, fixtures and equipment |
3 to 7 years | |
| Machinery and equipment |
3 to 5 years | |
| Computer software |
3 years |
The cost of leasehold improvements and lease acquisitions is amortized over the lesser of the useful life of the asset or the applicable lease term.
Interest is capitalized on construction in progress and software projects during the period in which expenditures have been made, activities are in progress to prepare the asset for its intended use and actual interest costs are being incurred.
Assets acquired under non-cancelable leases, which meet the criteria of capital leases, are capitalized in property and equipment and amortized over the lesser of the useful life of the asset or the applicable lease term.
The land purchased by the Company is recorded at cost and is a non-depreciable asset.
Property and equipment is reviewed for impairment whenever events or changes in circumstances indicate that the carrying amount of assets may not be recoverable.
F-15
Table of Contents
Intangible Assets
Intangible assets reflect the value assigned to trademarks, customer relationships, core technologies and the fair market value of the Company’s leases at the time of the Acquisition. Customer relationships, core technologies and the fair market value of the leases are amortized over their useful life. The Company does not amortize trademarks as the Company defines the life of the asset as indefinite.
Impairment
Goodwill
The Company evaluates goodwill annually to determine whether it is impaired. Goodwill is also tested between annual impairment tests if an event occurs or circumstances change that would indicate that the fair value of a reporting unit is less than its carrying amount. Conditions that may indicate impairment include, but are not limited to, a significant adverse change in customer demand or business climate that could affect the value of an asset; general economic conditions, such as increasing Treasury rates or unexpected changes in GDP growth; a change in the Company’s market share; budget-to-actual performance and consistency of operating margins and capital expenditures; a product recall or an adverse action or assessment by a regulator; or changes in management, key personnel, etc. If an impairment indicator exists, the Company tests the intangible asset for recoverability. The Company has identified only one single reporting unit. The Company selected the fourth fiscal quarter to perform its annual goodwill impairment testing.
In fiscal 2011, the Company elected to early adopt the option to qualitatively assess goodwill impairment to determine whether it is more likely than not that the fair value of a reporting unit is less than its carrying amount. Accordingly, the Company performed a qualitative analysis examining key events and circumstances affecting fair value and determined it is more likely than not that the reporting unit’s fair value is greater than its carrying amount. As such, no further analysis was required for purposes of testing of the Company’s goodwill for impairment.
If goodwill is not qualitatively assessed, a two-step quantitative approach is used. In the first step, the Company compares the fair value of the reporting unit, generally defined as the same level as or one level below an operating segment, to its carrying value. If the fair value of the reporting unit exceeds the carrying value of the net assets assigned to that unit, goodwill is considered not impaired and the Company is not required to perform further testing. If the carrying value of the net assets assigned to the reporting unit exceeds the fair value of the reporting unit, then the Company must perform the second step of the impairment test in order to determine the implied fair value of the reporting unit’s goodwill. If the carrying value of a reporting unit’s goodwill exceeds its implied fair value, then the Company would record an impairment loss equal to the difference.
The Company’s tests for impairment of goodwill resulted in a determination that the fair value of the Company substantially exceeded the carrying value of the Company’s net assets in fiscal 2010 and fiscal 2011. No impairment to goodwill has been recorded in any period.
Trademarks
The Company annually evaluates whether trademarks continue to have an indefinite life. Trademarks are reviewed for impairment annually in the fourth quarter and may be reviewed more frequently if indicators of impairment are present. Conditions that may indicate impairment include, but are not limited to, a significant adverse change in customer demand or business climate that could affect the value of an asset, a product recall or an adverse action or assessment by a regulator.
The impairment review is performed by comparing the carrying value to the estimated fair value, determined using a discounted cash flow methodology. Factors used in the valuation of intangible assets with indefinite lives include, but are not limited to, management’s plans for future operations, brand initiatives, recent operating results and projected future cash flows. The Company tested the trademarks for impairment and concluded that there has been no impairment in any period.
F-16
Table of Contents
Long-Lived Assets
Long-lived assets, such as property and equipment and intangible assets subject to amortization, are reviewed for impairment whenever events or changes in circumstances indicate that the carrying amount of an asset may not be recoverable. Conditions that may indicate impairment include, but are not limited to, a significant adverse change in customer demand or business climate that could affect the value of an asset, a product recall or an adverse action or assessment by a regulator. If the sum of the estimated undiscounted future cash flows related to the asset are less than the carrying value, the Company recognizes a loss equal to the difference between the carrying value and the fair value, usually determined by the estimated discounted cash flow analysis of the asset.
The Company evaluates long-lived tangible assets at an individual store level, which is the lowest level at which independent cash flows can be identified. The Company evaluates corporate assets or other long-lived assets that are not store-specific at the consolidated level.
Since there is typically no active market for the Company’s long-lived tangible assets, the Company estimates fair values based on the expected future cash flows. The Company estimates future cash flows based on store-level historical results, current trends, and operating and cash flow projections. The Company’s estimates are subject to uncertainty and may be affected by a number of factors outside its control, including general economic conditions and the competitive environment. While the Company believes its estimates and judgments about future cash flows are reasonable, future impairment charges may be required if the expected cash flow estimates, as projected, do not occur or if events change requiring the Company to revise its estimates.
The Company recorded a $2.3 million and $2.1 million impairment charge on long-lived assets of certain underperforming stores in fiscal 2009 and fiscal 2010, respectively, which is included in cost of goods sold on the consolidated statements of operations. The Company did not record an impairment charge on long-lived assets in fiscal 2011.
Capital and Operating Leases
The Company classifies leases at the inception of the lease as either a capital lease or an operating lease. A lease is classified as a capital lease if any of the following conditions are met: (i) the ownership of the leased property is transferred to the lessee by the end of the lease term, (ii) there is a bargain purchase option, (iii) the lease term is at least 75% of the property’s estimated remaining economic life or (iv) the present value of the minimum lease payments at the beginning of the lease term is 90% or more of the fair value of the leased property. A capital lease is accounted for as if there were an acquisition of an asset and an incurrence of an obligation at the inception of the lease. All leases not identified as capital leases are accounted for as operating leases.
The Company leases stores, distribution facilities, office space and certain machinery and equipment under various operating leases. Most real estate lease agreements contain, among other terms and conditions, tenant improvement allowances, rent holidays, lease premiums, rent escalation clauses and contingent rent provisions. For purposes of recognizing lease incentives, premiums and minimum rental expenses on a straight-line basis over the terms of the leases, the Company uses the date of initial possession to begin amortization, which is generally when the Company enters the space and begins to make improvements in preparation of intended use. For tenant improvement allowances and rent holidays, the Company records a deferred rent liability, reported as a long-term liability on the consolidated balance sheets, and amortizes the deferred rent over the term of the lease as an adjustment to rent expense.
For scheduled rent changes during the lease terms or for rental payments commencing at a date other than the date of initial occupancy (rent holidays), the Company records minimum rental expenses on a straight-line basis over the term of the lease.
F-17
Table of Contents
Certain leases provide for contingent rents, which are determined as a percentage of gross sales in excess of specified levels. The Company records a contingent rent liability in accounts payable and accrued expenses on the consolidated balance sheets and the corresponding rent expense when specified levels have been achieved or when management estimates that achieving the specified levels during the lease term is probable.
Debt Issuance Costs
The Company capitalizes debt issuance costs related to its revolving line of credit and term loan. Capitalized costs related to the revolving line of credit are included in other assets on the consolidated balance sheets as deferred financing fees. Capitalized costs paid to lenders relating to the term loan are netted against the term loan on the consolidated balance sheets. Deferred financing fees are amortized utilizing the straight-line method and are included in interest expense on the consolidated statements of operations.
Revenue Recognition
The Company recognizes revenues and the related cost of goods sold when merchandise is received by its customers. Revenues from “cash-and-carry” store sales is recognized at the point of sale in the store. Revenues from direct-to-customer and home-delivered sales is recognized when the merchandise is delivered to the customer. Discounts provided to customers are accounted for as a reduction of sales.
The Company recognizes shipping and handling fees as revenue when the merchandise is shipped to the customer. Costs of shipping and handling are included in cost of goods sold.
Sales tax collected is not recognized as revenue but is included in accounts payable and accrued expenses on the consolidated balance sheets as it is ultimately remitted to governmental authorities.
The Company reserves for projected merchandise returns. Merchandise returns are often resaleable merchandise and are refunded by issuing the same payment tender of the original purchase. Merchandise exchanges of the same product and price are not considered merchandise returns and, therefore, are excluded when calculating the sales returns reserve.
The Company’s customers may return purchased items for an exchange or refund. The Company provides an allowance for sales returns based on historical return rates. A summary of the allowance for sales returns, presented net of cost of goods sold, is as follows (in thousands):
| Year Ended | ||||||||||||
| January 30, 2010 |
January 29, 2011 |
January 28, 2012 |
||||||||||
| Balance at beginning of fiscal year |
$ | 2,119 | $ | 3,145 | $ | 3,403 | ||||||
| Provision for sales returns |
78,107 | 83,393 | 102,875 | |||||||||
| Actual sales returns |
(77,081 | ) | (83,135 | ) | (103,097 | ) | ||||||
|
|
|
|
|
|
|
|||||||
| Balance at end of fiscal year |
$ | 3,145 | $ | 3,403 | $ | 3,181 | ||||||
|
|
|
|
|
|
|
|||||||
Deferred Revenue and Customer Deposits
Deferred revenue represents the revenue associated with orders that have been shipped by the Company to its customers but have not yet been received by the customer. As the Company recognizes revenue when the merchandise is received by its customers, it is included as deferred revenue on the consolidated balance sheets while in-transit.
Customer deposits represent payments made by customers on custom orders. At the time of purchase the Company collects deposits for all custom orders equivalent to 50% of the customer purchase price. Custom order deposits are recognized as revenue when the merchandise is received by the customer or at the time of cancellation of the order by the customer.
F-18
Table of Contents
Gift Certificates and Merchandise Credits
The Company sells gift certificates and issues merchandise credits to its customers in its stores and through its websites and product catalogs. Such gift certificates and merchandise credits do not have expiration dates. Revenue associated with gift certificates and merchandise credits is deferred until either (i) redemption of the gift certificate and merchandise credits or (ii) when the likelihood of redemption is remote and there exists no legal obligation to remit the value of unredeemed gift certificates or merchandise credits to the relevant jurisdictions (breakage). The breakage rate is based on monitoring of certificates issued, actual certificate redemptions and the Company’s analysis of when it believes it is remote that redemptions will occur.
Redeemed gift certificates and merchandise credits are recorded in net revenues. Breakage resulted in a reduction of selling, general and administrative expenses on the consolidated statements of operations of $2.7 million, $3.0 million, and $3.2 million in fiscal 2009, fiscal 2010, and fiscal 2011, respectively.
Self Insurance
The Company maintains insurance coverage for significant exposures, as well as those risks that, by law, must be insured. In the case of the Company’s health care coverage for employees, the Company has a managed self insurance program related to claims filed. Expenses related to this self insured program are computed on an actuarial basis, based on claims experience, regulatory requirements, an estimate of claims incurred but not yet reported (“IBNR”) and other relevant factors. The projections involved in this process are subject to uncertainty related to the timing and amount of claims filed, levels of IBNR, fluctuations in health care costs and changes to regulatory requirements.
The Company is not self-insured for workers’ compensation claims related to incidents incurred after October 31, 2007. The Company is self-insured for all workers’ compensation claims prior to November 1, 2007.
Stock-Based Compensation
The Company accounts for stock-based compensation in accordance with applicable guidance which requires the fair value of stock-based payments to be recognized in the consolidated financial statements as compensation expense over the requisite service period. Compensation expense is recognized on a graded basis, net of forfeitures, over the requisite service period for the fair value of awards that actually vest.
Parent has granted performance-based units in Parent that vest and become deliverable upon achievement or satisfaction of performance conditions specified in the performance agreement or upon the return on investment attained by certain of the equity investors in Parent at defined liquidity events, including an initial public offering or certain sale or merger transactions. The Company estimates the fair value of performance-based units awarded to employees at the grant date based on the fair value of the Company on such date. The Company also considers the probability of achieving the established performance targets in determining its stock-based compensation with respect to these awards. The Company recognizes compensation cost over the performance period. When the performance is related to a specific event occurring in the future, the Company recognizes the full expense at the time of the event.
Cost of Goods Sold
Cost of goods sold includes, but is not limited to, the direct cost of purchased merchandise, inventory shrinkage, inventory reserves and write-downs, inbound freight, all freight costs to get merchandise to the Company’s stores, design and buying costs, occupancy costs related to store operations, such as rent, property tax and common area maintenance, depreciation and amortization, and all logistics costs associated with shipping product to customers.
F-19
Table of Contents
Selling, General and Administrative Expenses
Selling, general and administrative expenses include all operating costs not included in cost of goods sold. These expenses include payroll, expenses related to many of the Company’s operations at its headquarters, including utilities, depreciation and amortization, store expenses other than occupancy and marketing expense, which primarily includes catalog production, mailing and print advertising costs.
Store Pre-Opening Activities
All store pre-opening costs are expensed as incurred.
Earnings (Loss) Per Share
Basic earnings (loss) per share is computed as net income (loss) divided by the weighted average number of common shares outstanding for the period. Diluted earnings (loss) per share is computed as net income (loss) divided by the weighted average number of common shares outstanding for the period plus common stock equivalents consisting of shares subject to stock-based awards with exercise prices less than or equal to the average market price of the Company’s common stock for the period, to the extent their inclusion would be dilutive. Potential dilutive securities are excluded from the computation of diluted earnings (loss) per share if their effect is anti-dilutive. The Company did not have any anti-dilutive securities in fiscal 2009, fiscal 2010, or fiscal 2011 because all securities granted in those periods were granted by Parent.
Income Taxes
The Company accounts for income taxes under an asset and liability approach that requires the recognition of deferred tax assets and liabilities for the expected future tax consequences of events that have been recognized in the Company’s consolidated financial statements or tax returns. In estimating future tax consequences, the Company generally takes into account all expected future events then known to it, other than changes in the tax law or rates which have not yet been enacted and which are not permitted to be considered. Accordingly, the Company may record a valuation allowance to reduce its net deferred tax assets to the amount that is more-likely-than-not to be realized. The determination as to whether a deferred tax asset will be realized is made on a jurisdictional basis and is based upon management’s best estimate of the recoverability of the Company’s net deferred tax assets. Future taxable income and ongoing prudent and feasible tax planning are considered in determining the amount of the valuation allowance, and the amount of the allowance is subject to adjustment in the future. Specifically, in the event the Company were to determine that it is not more-likely-than-not able to realize its net deferred tax assets in the future, an adjustment to the valuation allowance would decrease income in the period such determination is made. This allowance does not alter the Company’s ability to utilize the underlying tax net operating loss and credit carryforwards in the future, the utilization of which is limited to achieving future taxable income.
The accounting standard for uncertainty in income taxes prescribes a recognition threshold that a tax position is required to meet before being recognized in the financial statements and provides guidance on derecognition, measurement, classification, interest and penalties, accounting in interim periods, disclosure and transition issues. Differences between tax positions taken in a tax return and amounts recognized in the financial statements generally result in an increase in a liability for income taxes payable or a reduction of an income tax refund receivable, or a reduction in a deferred tax asset or an increase in a deferred tax liability, or both. The Company recognizes interest and penalties related to unrecognized tax benefits in tax expense.
Fair Value of Financial Instruments
The carrying values of cash and cash equivalents, accounts receivable, accounts payable and borrowings under the revolving line of credit approximate their estimated fair values.
F-20
Table of Contents
The degree of judgment used in measuring the fair value of financial instruments generally correlates to the level of pricing observability. Pricing observability is impacted by a number of factors, including the type of financial instrument, whether the financial instrument is new to the market and not yet established and the characteristics specific to the transaction. Financial instruments with readily available active quoted prices for which fair value can be measured generally will have a higher degree of pricing observability and a lesser degree of judgment used in measuring fair value. Conversely, financial instruments rarely traded or not quoted will generally have less, or no, pricing observability and a higher degree of judgment used in measuring fair value.
The Company’s financial assets and liabilities measured and reported at fair value are classified and disclosed in one of the following categories:
| • | Level 1—Quoted prices are available in active markets for identical investments as of the reporting date. |
| • | Level 2—Pricing inputs are other than quoted prices in active markets, which are either directly or indirectly observable as of the reporting date, and fair value is determined through the use of models or other valuation methodologies. |
| • | Level 3—Pricing inputs are unobservable for the investment and include situations where there is little, if any, market activity for the investment. The inputs used in the determination of fair value require significant management judgment or estimation. |
The Company’s financial assets and liabilities were classified as Level 1 as of January 29, 2011 and January 28, 2012.
Comprehensive Income (Loss)
Comprehensive income (loss) consists of net income (loss) and other comprehensive income (loss). The Company’s other comprehensive income (loss) consists of foreign currency translation adjustments.
Foreign Currency Translation
Local currencies are generally considered the functional currencies outside the United States of America. Assets and liabilities denominated in non-U.S. currencies are translated at the rate of exchange prevailing on the date of the consolidated balance sheets and revenues and expenses are translated at average rates of exchange for the period. The related translation gains (losses) are reflected in the accumulated other comprehensive income (loss) section of the consolidated statements of stockholders’ equity. Foreign currency gains (losses) resulting from foreign currency transactions are included in selling, general and administrative expenses on the consolidated statements of operations and have not been material in all periods presented.
Recently Issued Accounting Standards
In September 2011, the Financial Accounting Standards Board (“FASB”) issued guidance that revises the requirements around how entities test goodwill for impairment. The guidance allows companies to perform a qualitative assessment before calculating the fair value of the reporting unit. If entities determine, on the basis of qualitative factors, that the fair value of the reporting unit is more likely than not greater than the carrying amount, a quantitative calculation would not be needed. The Company early adopted this guidance effective for its fiscal 2011 annual goodwill impairment test. The adoption of this guidance resulted in a change in how the Company performed its goodwill impairment assessment; however, it did not have a material impact on its consolidated financial statements.
In June 2011, the FASB issued guidance that revises the manner in which entities present comprehensive income in their financial statements. The guidance requires entities to report the components of comprehensive income in either a single, continuous statement or two separate but consecutive statements. In December 2011,
F-21
Table of Contents
the FASB issued guidance which defers certain requirements set forth in June 2011. These amendments are being made to allow the FASB time to redeliberate whether to present on the face of the financial statements the effects of reclassifications out of accumulated other comprehensive income on the components of net income and other comprehensive income in all periods presented. Both sets of guidance are effective for fiscal years, and interim periods within those years, beginning after December 15, 2011 and is to be applied retrospectively. The adoption of this guidance will not have a material impact on the Company’s consolidated financial statements, however, the Company expects the adoption to result in a change in how it presents the components of comprehensive income, which is currently presented within its consolidated statements of stockholders’ equity.
In May 2011, the FASB issued guidance to amend the fair value measurement and disclosure requirements. The guidance requires the disclosure of quantitative information about unobservable inputs used, a description of the valuation processes used, and a qualitative discussion around the sensitivity of the measurements. The guidance is effective during interim and annual periods beginning after December 15, 2011 and is to be applied prospectively. The adoption of this guidance will not have a material impact on the disclosures in the notes to the Company’s consolidated financial statements.
NOTE 4—PREPAID EXPENSES AND OTHER CURRENT ASSETS
Prepaid expenses and other current assets consist of the following (in thousands):
| January 29, 2011 |
January 28, 2012 |
|||||||
| Prepaid catalog |
$ | 6,590 | $ | 28,608 | ||||
| Vendor deposits |
2,413 | 9,399 | ||||||
| Prepaid expenses |
9,327 | 8,923 | ||||||
| Deferred tax assets |
58 | 4,161 | ||||||
| Other current assets |
1,973 | 5,640 | ||||||
|
|
|
|
|
|||||
| Total prepaid expenses and other current assets |
$ | 20,361 | $ | 56,731 | ||||
|
|
|
|
|
|||||
NOTE 5—PROPERTY AND EQUIPMENT
Property and equipment consists of the following (in thousands):
| January 29, 2011 |
January 28, 2012 |
|||||||
| Leasehold improvements (1) |
$ | 100,537 | $ | 118,898 | ||||
| Land |
2,388 | 2,388 | ||||||
| Building |
2,205 | 2,205 | ||||||
| Furniture, fixtures and equipment |
10,285 | 16,166 | ||||||
| Machinery and equipment |
675 | 4,823 | ||||||
| Computer software |
24,109 | 27,194 | ||||||
| Equipment under capital leases (2) |
12,309 | 13,918 | ||||||
|
|
|
|
|
|||||
| Total property and equipment |
152,508 | 185,592 | ||||||
| Less—accumulated depreciation and amortization |
(76,058 | ) | (102,034 | ) | ||||
|
|
|
|
|
|||||
| Total property and equipment—net |
$ | 76,450 | $ | 83,558 | ||||
|
|
|
|
|
|||||
| (1) | Leasehold improvements include construction in progress of $4.1 million and $9.1 million as of January 29, 2011, and January 28, 2012, respectively. |
| (2) | Accumulated depreciation and amortization include accumulated amortization related to equipment under capital leases of $11.2 million and $8.5 million as of January 29, 2011, and January 28, 2012, respectively. |
F-22
Table of Contents
The Company recorded depreciation expense of $25.9 million, $27.8 million, and $26.2 million in fiscal 2009, fiscal 2010, and fiscal 2011, respectively.
NOTE 6—GOODWILL AND INTANGIBLE ASSETS
The following sets forth the goodwill and intangible assets as of January 29, 2011 (dollar amounts in thousands):
| Gross Carrying Amount |
Accumulated Amortization |
Foreign Currency Translation |
Net Book Value January 29, 2011 |
Useful Life |
||||||||||||||||
| Intangible assets subject to amortization: |
||||||||||||||||||||
| Core technologies |
$ | 6,580 | $ | (3,509 | ) | $ | — | $ | 3,071 | 5 years | ||||||||||
| Fair value of leases |
||||||||||||||||||||
| Fair market write-up |
13,910 | (8,236 | ) | 48 | 5,722 | (2 | ) | |||||||||||||
| Fair market write-down |
(3,070 | ) | 1,361 | — | (1,709 | )(1) | (2 | ) | ||||||||||||
|
|
|
|
|
|
|
|
|
|||||||||||||
| Total intangible assets subject to amortization |
17,420 | (10,384 | ) | 48 | 7,084 | |||||||||||||||
| Intangible assets not subject to amortization: |
||||||||||||||||||||
| Goodwill |
122,285 | — | 318 | 122,603 | ||||||||||||||||
| Trademarks |
47,100 | — | — | 47,100 | ||||||||||||||||
|
|
|
|
|
|
|
|
|
|||||||||||||
| Total intangible assets |
$ | 186,805 | $ | (10,384 | ) | $ | 366 | $ | 176,787 | |||||||||||
|
|
|
|
|
|
|
|
|
|||||||||||||
| (1) | The fair market write-down of leases is included in other long-term obligations on the consolidated balance sheets. |
| (2) | The fair value of each lease is amortized over the life of the respective lease. The longest lease for which a fair value adjustment was recorded has a termination date in January 2019. |
The following sets forth the goodwill and intangible assets as of January 28, 2012 (dollar amounts in thousands):
| Gross Carrying Amount |
Accumulated Amortization |
Foreign Currency Translation |
Net Book Value January 28, 2012 |
Useful Life |
||||||||||||||||
| Intangible assets subject to amortization: |
||||||||||||||||||||
| Core technologies |
$ | 6,580 | $ | (4,825 | ) | $ | — | $ | 1,755 | 5 years | ||||||||||
| Fair value of leases |
||||||||||||||||||||
| Fair market write-up |
11,988 | (8,365 | ) | 48 | 3,671 | (2 | ) | |||||||||||||
| Fair market write-down |
(2,591 | ) | 1,448 | — | (1,143 | )(1) | (2 | ) | ||||||||||||
|
|
|
|
|
|
|
|
|
|||||||||||||
| Total intangible assets subject to amortization |
15,977 | (11,742 | ) | 48 | 4,283 | |||||||||||||||
| Intangible assets not subject to amortization: |
||||||||||||||||||||
| Goodwill |
122,285 | — | 310 | 122,595 | ||||||||||||||||
| Trademarks |
47,100 | — | — | 47,100 | ||||||||||||||||
|
|
|
|
|
|
|
|
|
|||||||||||||
| Total intangible assets |
$ | 185,362 | $ | (11,742 | ) | $ | 358 | $ | 173,978 | |||||||||||
|
|
|
|
|
|
|
|
|
|||||||||||||
| (1) | The fair market write-down of leases is included in other long-term obligations on the consolidated balance sheets. |
| (2) | The fair value of each lease is amortized over the life of the respective lease. The longest lease for which a fair value adjustment was recorded has a termination date in January 2019. |
F-23
Table of Contents
Core technologies represents the fair market value of Company-developed technologies that had been fully depreciated at the time of the Acquisition. The fair value of leases reflects the Company’s favorable and unfavorable positions of lease terms for its stores, distribution centers and corporate headquarters at the time of the Acquisition.
The Company recorded amortization expense related to intangible assets of $17.1 million, $3.4 million, and $2.8 million in fiscal 2009, fiscal 2010, and fiscal 2011, respectively.
The following table sets forth the remaining amortization of the intangible assets based on a straight-line method of amortization over the respective useful lives as of January 28, 2012 (in thousands):
| 2012 |
$ | 2,219 | ||
| 2013 |
1,204 | |||
| 2014 |
690 | |||
| 2015 |
95 | |||
| 2016 |
56 | |||
| Thereafter |
19 | |||
|
|
|
|||
| Total amortization |
$ | 4,283 | ||
|
|
|
NOTE 7—ACCOUNTS PAYABLE, ACCRUED EXPENSES AND OTHER CURRENT LIABILITIES
Accounts payable and accrued expenses consist of the following (in thousands):
| January 29, 2011 |
January 28, 2012 |
|||||||
| Accounts payable |
$ | 51,409 | $ | 47,440 | ||||
| Accrued compensation |
16,698 | 21,168 | ||||||
| Accrued freight |
5,925 | 8,896 | ||||||
| Accrued occupancy |
4,309 | 6,203 | ||||||
| Accrued catalog |
101 | 7,176 | ||||||
| Accrued sales taxes |
6,881 | 8,472 | ||||||
| Accrued professional fees |
1,557 | 2,494 | ||||||
| Other accrued expenses |
3,846 | 3,845 | ||||||
|
|
|
|
|
|||||
| Total accounts payable and accrued expenses |
$ | 90,726 | $ | 105,694 | ||||
|
|
|
|
|
|||||
Accounts payable included negative cash balances due to outstanding checks of $6.0 million and $12.4 million as of January 29, 2011, and January 28, 2012, respectively.
Other current liabilities consist of the following (in thousands):
| January 29, 2011 |
January 28, 2012 |
|||||||
| Unredeemed gift certificate and merchandise credit liability |
$ | 16,240 | $ | 20,742 | ||||
| Allowance for sales returns |
3,403 | 3,181 | ||||||
| Capital lease obligation—current |
2,392 | 4,114 | ||||||
| Other liabilities |
2,965 | 2,824 | ||||||
|
|
|
|
|
|||||
| Total other current liabilities |
$ | 25,000 | $ | 30,861 | ||||
|
|
|
|
|
|||||
NOTE 8—LINE OF CREDIT AND TERM LOAN
In August 2011, the Company, along with its Canadian subsidiary, Restoration Hardware Canada, Inc., entered into a revolving line of credit agreement with Bank of America, N.A., as administrative agent, and
F-24
Table of Contents
certain other lenders. This credit agreement modified a previous facility in which the Company had a revolving line of credit for up to $190.0 million. As a result of the modification, the unamortized deferred financing fees related to the previous revolving line of credit on the date of the modification of $0.2 million will be amortized over the life of the new revolving line of credit, which has a maturity date of August 3, 2016. Under this amended credit agreement (which was further amended in January 2012 to incorporate a term loan facility), the Company has (i) a revolving line of credit available of up to $317.5 million, of which $10.0 million is available to Restoration Hardware Canada, Inc., and (ii) a $15.0 million term loan with a maturity date of July 6, 2015.
Under the terms of the credit agreement, the Company may increase the amount of the revolving line of credit by up to an additional $100 million provided that, among other things, the lenders agree to participate in the increased loan commitments under the credit facility, no default under the revolving line of credit then exists or would result from such increase and sufficient borrowing base collateral is available to support increased loan amounts.
The availability of credit at any given time under the revolving line of credit is limited by reference to a borrowing base formula based upon numerous factors, including the value of eligible inventory, eligible accounts receivable, eligible real estate, and, in the case of the term loan, registered trade names, and reserves established by the administrative agent. As a result of the borrowing base formula, the actual borrowing availability under the revolving line of credit could be less than the stated amount of the revolving line of credit (as reduced by the actual borrowings and outstanding letters of credit under the revolving line of credit). The revolving line of credit is secured by substantially all of the Company’s assets, including accounts receivable, inventory, intangible assets, property, equipment, goods and fixtures.
Borrowings under the revolving line of credit are subject to interest, at borrowers’ option, at either the bank’s reference rate or LIBOR (or the BA Rate or the Canadian Prime Rate, as such terms are defined in the credit agreement, in the case of Canadian borrowings denominated in Canadian dollars or the U.S. Index Rate or LIBOR for Canadian borrowings denominated in U.S. dollars) plus an applicable margin rate, in each case. The weighted-average interest rate for the revolving line of credit was 2.8% as of January 28, 2012. The term loan bears interest at a rate of LIBOR plus 5.0%, and the interest rate for the term loan was 5.3% as of January 28, 2012.
As of January 28, 2012, $107.5 million was outstanding under the revolving line of credit and the term loan was $14.8 million, net of $0.2 million unamortized debt issuance costs. As of January 28, 2012, the Company’s undrawn borrowing availability under the credit facility was $93.4 million. There were $5.5 million and $6.9 million in outstanding letters of credit as of January 29, 2011 and January 28, 2012, respectively.
The Company is required to repay the term loan in quarterly installments of $1.25 million beginning July 2012 with the final payment in April 2015.
In fiscal 2011, the Company capitalized debt issuance costs of $2.6 million and $0.2 million related to the revolving line of credit and term loan, respectively.
The credit agreement contains various restrictive covenants, including, among others, limitations on the ability to incur liens, make loans or other investments, incur additional debt, issue additional equity, merge or consolidate with or into another person, sell assets, pay dividends or make other distributions, or enter into transactions with affiliates. The credit agreement does not contain any significant financial or coverage ratio covenants unless the availability under the revolving line of credit is less than the greater of (i) $17.5 million and (ii) 10% of the lesser of (A) the aggregate maximum commitments under the credit facility and (B) the domestic borrowing base. If the availability under the revolving line of credit is less than the foregoing amount, then the Company is required to maintain a consolidated fixed charge coverage ratio of at least one to one. As of January 28, 2012, the Company is in compliance with all covenants, and if the availability under the revolving line of credit were less than the amount described above, the Company would have been in compliance with the
F-25
Table of Contents
consolidated fixed charge coverage ratio described in the previous sentence. The credit agreement requires a daily sweep of cash to prepay the loans under the credit agreement while (i) an event of default exists or (ii) the availability under the revolving line of credit for extensions of credit to the Company is less than the greater of (A) $20.0 million and (B) 15% of the lesser of the aggregate maximum commitments and the domestic borrowing base.
NOTE 9—INCOME TAXES
The following is a summary of the income tax expense (benefit) (in thousands):
| Year Ended | ||||||||||||
| January 30, 2010 |
January 29, 2011 |
January 28, 2012 |
||||||||||
| Current |
||||||||||||
| Federal |
$ | (226 | ) | $ | 53 | $ | — | |||||
| State |
172 | 837 | 331 | |||||||||
| Foreign |
(190 | ) | 280 | 595 | ||||||||
|
|
|
|
|
|
|
|||||||
| Total current tax expense (benefit) |
(244 | ) | 1,170 | 926 | ||||||||
|
|
|
|
|
|
|
|||||||
| Deferred |
||||||||||||
| Federal |
92 | 135 | (76 | ) | ||||||||
| State |
(271 | ) | (397 | ) | 223 | |||||||
| Foreign |
— | (223 | ) | 48 | ||||||||
|
|
|
|
|
|
|
|||||||
| Total deferred tax benefit |
(179 | ) | (485 | ) | 195 | |||||||
|
|
|
|
|
|
|
|||||||
| Total income tax expense (benefit) |
$ | (423 | ) | $ | 685 | $ | 1,121 | |||||
|
|
|
|
|
|
|
|||||||
A reconciliation of the federal statutory tax rate to the Company’s effective tax rate is as follows:
| Year Ended | ||||||||||||
| January 30, 2010 |
January 29, 2011 |
January 28, 2012 |
||||||||||
| Provision at federal statutory tax rate |
34.0 | % | 34.0 | % | 34.0 | % | ||||||
| State income taxes—net of federal tax impact |
4.1 | 1.8 | 5.4 | |||||||||
| Foreign income |
(1.1 | ) | (2.9 | ) | (2.0 | ) | ||||||
| Net adjustments to tax accruals and other |
8.2 | (3.7 | ) | 4.7 | ||||||||
| Valuation allowance |
(42.7 | ) | (28.0 | ) | (49.8 | ) | ||||||
| Stock-based compensation |
(0.8 | ) | (10.5 | ) | 12.9 | |||||||
|
|
|
|
|
|
|
|||||||
| Effective tax rate |
1.7 | % | (9.3 | )% | 5.2 | % | ||||||
|
|
|
|
|
|
|
|||||||
F-26
Table of Contents
Significant components of the Company’s deferred tax assets and liabilities are as follows (in thousands):
| January 29, 2011 |
January 28, 2012 |
|||||||
| Current deferred tax assets (liabilities) |
||||||||
| Accrued expense |
$ | 6,587 | $ | 9,970 | ||||
| State tax benefit |
(579 | ) | (1,370 | ) | ||||
| Inventory |
10,033 | 11,121 | ||||||
| Deferred revenue |
6,081 | 12,213 | ||||||
| Net operating loss carryforwards |
— | 27,166 | ||||||
| Construction allowance |
— | (1,037 | ) | |||||
| Prepaid expense and other |
(3,643 | ) | (12,729 | ) | ||||
|
|
|
|
|
|||||
| Current deferred tax assets |
18,479 | 45,334 | ||||||
| Valuation allowance |
(18,421 | ) | (41,173 | ) | ||||
|
|
|
|
|
|||||
| Net current deferred tax assets |
58 | 4,161 | ||||||
|
|
|
|
|
|||||
| Long-term deferred tax assets (liabilities) |
||||||||
| State tax benefit |
(2,089 | ) | (892 | ) | ||||
| Deferred lease credits |
(11,213 | ) | 4,251 | |||||
| Property and equipment |
38,831 | (2,061 | ) | |||||
| Net operating loss carryforwards |
14,795 | 7,525 | ||||||
| U.S. impact of Canadian transfer pricing |
3,762 | 3,760 | ||||||
| Trademarks |
(19,051 | ) | (19,275 | ) | ||||
| Other |
7,009 | 850 | ||||||
|
|
|
|
|
|||||
| Long-term deferred tax assets (liabilities) |
32,044 | (5,842 | ) | |||||
| Valuation allowance |
(49,897 | ) | (16,311 | ) | ||||
|
|
|
|
|
|||||
| Net long-term deferred tax liabilities |
(17,853 | ) | (22,153 | ) | ||||
|
|
|
|
|
|||||
| Net deferred tax liabilities |
$ | (17,795 | ) | $ | (17,992 | ) | ||
|
|
|
|
|
|||||
A reconciliation of the valuation allowance is as follows (in thousands):
| Year Ended | ||||||||||||
| January 30, 2010 |
January 29, 2011 |
January 28, 2012 |
||||||||||
| Balance at beginning of fiscal year |
$ | 54,221 | $ | 65,087 | $ | 68,318 | ||||||
| Charged to expense |
— | (236 | ) | 299 | ||||||||
| Net changes in deferred tax assets and liabilities |
10,866 | 3,467 | (11,133 | ) | ||||||||
|
|
|
|
|
|
|
|||||||
| Balance at end of fiscal year |
$ | 65,087 | $ | 68,318 | $ | 57,484 | ||||||
|
|
|
|
|
|
|
|||||||
The Company’s accounting for deferred tax consequences represents its best estimate of the likely future tax consequences of events that have been recognized in its financial statements or tax returns and their future probability. In assessing the need for a valuation allowance, the Company considers both positive and negative evidence related to the likelihood of realization of the deferred tax asset. If, based on the weight of available evidence, it is more likely than not that the deferred tax assets will not be realized, the Company records a valuation allowance.
Due to the historical losses incurred, the Company has recorded a full valuation allowance against the U.S. net deferred tax assets, excluding deferred tax liabilities related to indefinite lived intangibles, as well as against the net deferred tax assets of Shanghai. If the Company achieves cumulative profitability, these deferred tax assets may be available to offset future income taxes.
F-27
Table of Contents
As of January 28, 2012, the Company had federal and state net operating loss carryovers of $83.3 million and $76.2 million, respectively. The federal and state net operating loss carryovers will expire between 2012 and 2031. Internal Revenue Code Section 382 and similar state rules place a limitation on the amount of taxable income which can be offset by net operating loss carryforwards after a change in ownership (generally greater than 50% change in ownership). The Company cannot give any assurances that it will not undergo an ownership change at a time when this limitation would have a significant effect. Due to these provisions, annual utilization of the net operating loss carryforwards are limited as a result of the Acquisition.
A reconciliation of the exposures related to unrecognized tax benefits is as follows (in thousands):
| Year Ended | ||||||||||||
| January 30, 2010 |
January 29, 2011 |
January 28, 2012 |
||||||||||
| Balance at beginning of fiscal year |
$ | 2,866 | $ | 8,261 | $ | 9,015 | ||||||
| Gross (decreases) increases—prior period tax positions |
6,202 | — | — | |||||||||
| Gross increases (decreases)—current period tax positions |
(485 | ) | 1,048 | (14 | ) | |||||||
| Consent for accounting method change |
— | — | (6,496 | ) | ||||||||
| Lapses in statute of limitations |
(322 | ) | (294 | ) | — | |||||||
|
|
|
|
|
|
|
|||||||
| Balance at end of fiscal year |
$ | 8,261 | $ | 9,015 | $ | 2,505 | ||||||
|
|
|
|
|
|
|
|||||||
A significant portion of the Company’s unrecognized tax benefits as of January 29, 2011 was related to an uncertain tax position for advanced payments for the sale of gift cards. The Company filed a request to change its accounting method for advanced payments for the sale of gift cards with the IRS in fiscal 2011 and, during the fourth quarter of fiscal 2011, the IRS approved the Company’s request. This approval allowed the Company to increase its tax liability for the impact of the change over a four-year period beginning with its January 28, 2012 tax return. The Company reduced its balance of unrecognized tax benefits by $6.5 million for the impact of the approval on this uncertain tax position.
As of both January 29, 2011, and January 28, 2012, $2.5 million of the exposures related to unrecognized tax benefits would affect the effective tax rate if realized and are included in other long-term obligations on the consolidated balance sheets. These amounts are primarily associated with foreign tax exposures. The balance of amounts above represent exposures that would, if realized, reduce the amount of net operating losses that would ultimately be utilized. As of January 28, 2012, $0.6 million of the exposures related to unrecognized tax benefits will decrease in the next 12 months due to the lapse of statute of limitations.
The Company accounts for interest and penalties related to exposures as a component of income tax expense. The Company has accrued $1.1 million and $1.3 million of interest associated with exposures as of January 29, 2011 and January 28, 2012, respectively.
This Company is subject to tax in the United States, Canada, Shanghai and Hong Kong. The Company could be subject to United States federal and state tax examinations for years 2001 and forward by virtue of net operating loss carryforwards available from those years. There are no United States tax examinations currently in progress. The Company may also be subject to audits in Canada for years 2003 and forward. Restoration Hardware Canada, Inc. is currently under audit by the Canada Revenue Agency for the years ended 2006 and 2007 and for the period ended June 16, 2008.
NOTE 10—PRO FORMA NET LOSS PER SHARE (UNAUDITED)
Restoration Hardware Holdings, Inc. (the “Issuer”) was incorporated as a Delaware corporation on August 18, 2011, for the purpose of acquiring all of the stock of the Company. Prior to the completion of this offering, the Issuer will acquire all of the outstanding shares of capital stock of the Company. Outstanding units under Parent’s equity compensation plan, referred to as the Team Resto Ownership Plan, will be converted in connection with this offering into common stock of the Issuer, and the vesting status of the Home Holdings units will carry over to the Issuer’s common stock. These transactions are referred to as the “Reorganization.”
F-28
Table of Contents
Unaudited pro forma net income per share for the year ended January 28, 2012, has been computed to give effect to the Reorganization as if such events had been completed as of the beginning of the fiscal year and the share capital resulting therefrom was outstanding for the year ended January 28, 2012. In addition, shares issued in the initial public offering of common stock of the Issuer for proceeds of $ will be used to repay a portion of the outstanding amounts under the Company’s revolving line of credit and term loan, which were $107.5 million and $14.8 million, net of unamortized debt issuance costs of $0.2 million, respectively, as of January 28, 2012. The issuance of the shares and the repayment of the revolving line of credit and term loan are assumed to have occurred as of the beginning of the fiscal year. The Company has assumed that the initial public offering price is $ , the midpoint in the estimated price range set forth on the cover of the prospectus included in the Issuer’s Form S-1 Registration Statement.
Pro forma net income has been computed by taking net income and removing interest expense related to debt assumed to be repaid. The interest expense amount has not been adjusted to record the tax effect at the Company’s estimated statutory tax rate of 40% as all deferred tax assets have a full valuation allowance as of January 28, 2012.
The following table summarizes pro forma net income and pro forma basic and diluted net income per share computations for the year ended January 28, 2012 (in thousands, except share and per share amounts):
| Net income—as reported |
$ | 20,341 | ||
| Less—interest expense |
||||
|
|
|
|||
| Pro forma net income |
$ | |||
|
|
|
|||
| Pro forma weighted-average shares outstanding after Reorganization |
||||
| Pro forma shares issued to repay revolving line of credit and term loan |
||||
|
|
|
|||
| Pro forma shares for basic and diluted income per share |
||||
|
|
|
|||
| Pro forma basic and diluted net income per share |
$ |
NOTE 11—STOCK-BASED COMPENSATION
The Company accounts for stock-based compensation in accordance with applicable guidance, which requires the Company to estimate the value of securities issued based upon an option-pricing model and recognize this estimated value as compensation expense over the vesting periods.
In connection with the Acquisition, Parent established the Team Resto Ownership Plan in fiscal 2009. Awards under the Team Resto Ownership Plan are granted by the Parent and are made up of the following:
| • | Time-based units—time-based units vest in annual installments, generally over a five-year graded vesting period. |
| • | Performance-based units—performance-based units vest based on a return on equity investment to the Company’s investors between either two times and three times such investment (the “2X—3X Performance-based Units”) or three times and five times such investment (the “3X—5X Performance-based Units”). |
Under the terms of the Team Resto Ownership Plan, 2X—3X Performance-based Units will vest to the extent cumulative return on equity investment is greater than two times and up to and including three times the original invested capital amount, with proportional vesting in between. At a return on equity investment equal to three times the original invested capital amount, 100% of the 2X—3X Performance-based Units vest. In the case of 3X—5X Performance-based Units, these performance-based units will vest to the extent cumulative return on equity investment is greater than three and up to and including five times the original invested capital amount, with proportional vesting in between. In the case of these 3X—5X Performance-based Units, 100% of the units vest at cumulative return on equity investment equal to five times the original invested capital amount. Performance-based units that do not vest will be cancelled for no consideration.
F-29
Table of Contents
Under the Team Resto Ownership Plan, vesting of performance-based units will occur upon the consummation of an initial public offering to the extent of achievement of the applicable cumulative return on equity investment as provided in the Team Resto Ownership Plan. Return on equity investment will be calculated based upon a return on investment to the Company’s investors assuming that its investors had received the initial public offering price for their investments as a result of such offering.
All stock-based compensation expense associated with the grants of units by Parent to the Company’s directors, executive officers and employees is recorded by the Company.
As of January 28, 2012, the total number of units issuable under the Team Resto Ownership Plan was 21,045,517. If all 21,045,517 units were issued and fully vested under their terms, such interests would represent 24.9% of all of the outstanding equity interests in Parent on a fully diluted basis. Awards of units reduce the number of units available for future issuance. Cancellations and forfeitures of units previously granted increase the number of units available for future issuance. The number of units available for future issuance under the Team Resto Ownership Plan as of January 28, 2012, was 1,416,009.
The Company estimates the fair value of each grant on the date of grant using a lattice model that incorporates a Monte Carlo Simulation (the “Monte Carlo method”), which includes the following assumptions:
Expected Equity Returns and Volatility—The Monte-Carlo method incorporates both expectations concerning equity returns in the future and an expected volatility in terms of the possible range of returns units based upon historical volatility data from a group of comparable companies prior to the valuation date and expectations of future volatility over a timeframe consistent with the expected life of the awards.
Expected Unit Life—The Monte-Carlo method analysis includes an estimate of the expected unit life from grant date which represents the period that the units are anticipated to be outstanding after initial grant until expiration or settlement based upon various factors including expectations concerning a potential liquidity event, the contractual terms of the equity based awards and vesting schedules.
Risk Free Interest Rate—The Monte-Carlo method incorporates an assumed risk-free interest rate which is based on the U.S. Treasury yield curve rates in effect at the time of the grant using the term most consistent with the expected life of the award.
Expected Dividend Yield—Dividend yield was estimated at zero as Parent does not anticipate making future distributions to equity holders.
Time-Based Units
The following table presents the time-based unit activity in fiscal 2010 and fiscal 2011:
| Number Of Units |
Weighted Average Grant Date Fair Value |
Weighted Average Remaining Contractual Life (In Years) |
||||||||||
| Outstanding—January 30, 2010 |
8,250,407 | $ | 0.51 | 9.22 | ||||||||
| Granted |
2,469,190 | 0.92 | 10.00 | |||||||||
| Forfeited |
(918,526 | ) | 0.51 | 9.30 | ||||||||
|
|
|
|||||||||||
| Outstanding—January 29, 2011 |
9,801,071 | 0.61 | 8.35 | |||||||||
| Granted |
1,626,000 | 1.28 | 10.00 | |||||||||
| Cancelled |
(570,426 | ) | 0.58 | 9.53 | ||||||||
| Forfeited |
(567,925 | ) | 1.18 | 9.78 | ||||||||
|
|
|
|||||||||||
| Outstanding—January 28, 2012 |
10,288,720 | 0.69 | 7.43 | |||||||||
|
|
|
|||||||||||
F-30
Table of Contents
As of January 28, 2012, 4,072,751 time-based units were vested with a weighted average grant date fair value of $0.57 and a remaining weighted average expected life of 7.35 years.
The fair value of each time-based unit granted in fiscal 2010 and fiscal 2011 was estimated on the date of grant using a Monte Carlo method with the following weighted average assumptions:
| Year Ended | ||||||||
| January 29, 2011 |
January 28, 2012 |
|||||||
| Expected volatility |
59 | % | 56 | % | ||||
| Expected life (years) |
1.7 | 0.8 | ||||||
| Risk-free interest rate |
0.95 | % | 0.19 | % | ||||
| Dividend yield |
— | — | ||||||
During fiscal 2010 and fiscal 2011, the fair value of units vested was $0.6 million and $1.1 million, respectively. As of January 28, 2012, the total unrecognized compensation expense related to non-vested time-based units was $2.9 million, which is expected to be recognized on a graded basis over a weighted average period of 2.05 years. No stock-based compensation cost has been capitalized in the accompanying consolidated financial statements.
The Company recorded stock-based compensation expense for time-based units of $0.6 million, $2.1 million, and $1.8 million in fiscal 2009, fiscal 2010, and fiscal 2011, respectively, which is included in selling, general and administrative expenses on the consolidated statements of operations.
Performance-Based Units
The following table presents the performance-based unit activity in fiscal 2010 and fiscal 2011:
| Number Of Units |
Weighted Average Grant Date Fair Value |
|||||||
| Outstanding—January 30, 2010 |
8,212,364 | $ | 0.16 | |||||
| Granted |
2,305,386 | 0.49 | ||||||
| Forfeited |
(1,095,366 | ) | 0.16 | |||||
|
|
|
|||||||
| Outstanding—January 29, 2011 |
9,422,384 | 0.25 | ||||||
| Granted |
1,069,000 | 0.48 | ||||||
| Cancelled |
(762,609 | ) | 0.35 | |||||
| Forfeited |
(607,000 | ) | 0.11 | |||||
|
|
|
|||||||
| Outstanding—January 28, 2012 |
9,121,775 | 0.28 | ||||||
|
|
|
|||||||
The fair value of each performance-based unit granted in fiscal 2010 and fiscal 2011 was estimated on the date of grant using a Monte Carlo method with the following weighted average assumptions:
| Year Ended | ||||||||
| January 29, 2011 |
January 28, 2012 |
|||||||
| Expected volatility |
59 | % | 56 | % | ||||
| Expected life (years) |
1.7 | 0.8 | ||||||
| Risk-free interest rate |
0.95 | % | 0.21 | % | ||||
| Dividend yield |
— | — | ||||||
The Company recognizes expense associated with the units when it becomes probable that the performance condition will be met. Once it becomes probable that a participant will vest, the Company recognizes
F-31
Table of Contents
compensation expense equal to the number of shares which have vested multiplied by the fair value of the related shares measured at the grant date. No performance-based awards are considered to have vested and, as such, no expense was recorded in fiscal 2009, fiscal 2010 or fiscal 2011. In the event of an initial public offering, all outstanding awards vest. As of January 28, 2012, the total unrecognized compensation expense related to non-vested performance-based units was $2.5 million.
NOTE 12—EMPLOYEE BENEFIT PLANS
The Company has a 401(k) plan for its employees who meet certain service and age requirements. Participants may contribute up to 50% of their salaries limited to the maximum allowed by the Internal Revenue Service regulations. The Company, at its discretion, may contribute funds to the 401(k) plan. The Company made no contributions to the 401(k) plan during fiscal 2009, fiscal 2010, or fiscal 2011.
NOTE 13—RELATED PARTY TRANSACTIONS
Management Agreement
Pursuant to the Amended and Restated Management Services Agreement with certain affiliates of Catterton, Tower Three and Glenhill, such affiliated entities are to provide services to the Company for general management, consulting services and other strategic planning functions. The amount of the annual management fee payable to Catterton, Tower Three and Glenhill under the Amended and Restated Management Services Agreement is equal to 1.5% of Catterton’s and Tower Three’s invested capital in Parent and 1% of Glenhill’s invested capital in Parent.
The Company recorded management fees of $3.9 million in selling, general and administrative expenses in fiscal 2009, which were paid directly by Parent and reflected as a capital contribution from Parent through additional paid-in capital.
The Company recorded management fees of $3.9 million in selling, general and administrative expenses in fiscal 2010 and such management fees were paid by the Company as of January 29, 2011.
The Company recorded management fees of $9.9 million in selling, general and administrative expenses in fiscal 2011, of which $6.0 million was paid directly by Parent and reflected as a capital contribution from Parent through additional paid-in capital. The remaining $3.9 million was paid by the Company as of January 28, 2012.
The Amended and Restated Management Services Agreement provides that the term of the agreement ends upon the consummation of an initial public offering, and that additional fees shall be payable upon termination in connection with an initial public offering. In connection with this offering, the Company plans to pay the additional fees upon termination in connection with an initial public offering to Catterton, Tower Three and Glenhill in the amount of $ , $ and $ , respectively.
Equity Interest in Parent
Each of Mr. Friedman, Mr. Krevlin, a member of the Company’s Board of Directors, and certain funds of Glenhill entered into separate stockholder voting agreements with the Company in connection with the First Amendment to Agreement and Plan of Merger. Mr. Krevlin has sole voting power and investment power with respect to shares beneficially owned by such funds of Glenhill. Pursuant to such stockholder voting agreements, Mr. Friedman, Mr. Krevlin and such funds agreed to vote for and support the Acquisition. In addition, immediately prior to the completion of the Acquisition, Mr. Friedman and Mr. Krevlin (through such funds of Glenhill) contributed approximately 1,000,000 and 3,632,533 shares, respectively, of the Company’s common stock to Parent in exchange for equity interests in Parent pursuant to rollover agreements between the Company, Parent and each of Mr. Friedman and such funds of Glenhill.
F-32
Table of Contents
Executive Loans with Parent
In December 2008, Mr. Friedman entered into a $1.0 million loan with Parent in connection with the purchase of a 0.3% ownership interest in Parent. The full recourse loan initially bore interest at a rate of 8.0% per annum. If the interest was not paid in cash on December 31 of each year, such interest was deemed paid by capitalization and added to the principal amount of the loan. Principal and accrued interest was due the earlier of December 31, 2018, upon the sale of the Company or upon Mr. Friedman’s termination of employment. In May 2010, the loan was amended and restated to, among other things, reduce the interest rate to 5.0% per annum, as of the date of the original $1.0 million loan received in December 2008, modify the maturity date to December 31, 2015, and provide for an additional $5.0 million loan from Parent in connection with the purchase of an additional 1.7% ownership interest in Parent.
In September 2011, Mr. Friedman repaid the loans owed to Parent, together with accrued interest thereon, through the reclassification by Parent of Mr. Friedman’s Class A units and Class A-1 units in Parent into an equal number of Class A Prime units and Class A-1 Prime units in Parent, respectively. The Class A Prime units and Class A-1 Prime units, which are not subject to any future vesting, do not entitle Mr. Friedman to distributions from Parent until after certain amounts have been distributed to the holders of Class A units, commensurate with the amount of all previously outstanding principal and interest on the loans. On the date of such repayment, the total principal amount of the loans, including all accrued interest thereon, was $6,559,877. No prior payments of principal or interest were made by Mr. Friedman under the loan agreements. The Company completed a valuation analysis regarding the reclassification of units which resulted in a $6.4 million compensation charge included in selling, general and administrative expenses on the consolidated statements of operations for fiscal 2011 and reflected as a capital contribution from Parent through additional paid-in capital. Such compensation charge was calculated as the total principal amount of the loans, including all accrued interest thereon, as of the repayment date, less the difference in fair value of the Class A units and Class A-1 units in Parent as compared to the Class A Prime units and Class A-1 Prime units in Parent.
In May 2010, Mr. Alberini, the Company’s Chief Executive Officer, entered into a $4.0 million loan with Parent in connection with the purchase of a 1.4% ownership interest in Parent bearing interest at the rate of 5.0% per annum with a maturity date of ninety days from the original date of such note. The loan to Mr. Alberini was repaid in full on August 25, 2010.
In April 2011, Mr. Dunaj, the Company’s Chief Operating Officer, entered into a $600,000 loan with Parent. The full recourse loan bears interest at 5.0% per annum and is secured by Mr. Dunaj’s Team Restoration Ownership Plan units. The loan, together will all interest accrued but unpaid, is due and payable on the first to occur of (i) December 31, 2015, (ii) ninety days following termination of employment, (iii) the date of any sale of the Company, (iv) the date of an initial public offering, (v) the date of any acceleration that might occur as a result of a defined default under the note, or (vi) demand for repayment by Parent.
In September 2011, Mr. Dunaj repaid the loan owed to Parent, together with accrued interest thereon, through the reclassification by Parent of Mr. Dunaj’s Class B units issued under the Team Resto Ownership Plan into an equal number of Class B Prime units under the Team Resto Ownership Plan. The Class B Prime units are entitled to a lower distribution amount than Class B units, commensurate with the amount of all previously outstanding principal and interest on the loan. On the date of such repayment, the total principal amount of the loan, including all accrued interest thereon, was $620,712. No prior payments of principal or interest were made by Mr. Dunaj under the loan agreement. On the date of such repayment, Mr. Dunaj surrendered 300,000 of his unvested Class B performance units under the Team Resto Ownership Plan. The Company undertook a valuation analysis regarding the reclassification of units which resulted in no compensation charge recorded in connection with the reclassification in the Company’s consolidated financial statements for fiscal 2011 as it relates to vested awards and over the remaining vesting periods for currently unvested awards.
These loans are recorded by Parent and therefore are not included on the consolidated balance sheets of the Company.
F-33
Table of Contents
NOTE 14—COMMITMENTS AND CONTINGENCIES
Leases
The Company leases certain property consisting of retail and outlet stores, corporate offices, distribution centers and equipment. Leases expire at various dates through 2027. The stores, distribution centers and corporate office leases generally provide that the Company assumes the maintenance and all or a portion of the property tax obligations on the leased property. Most store leases also provide for minimum annual rentals, with provisions for additional rent based on a percentage of sales and for payment of certain expenses.
The aggregate future minimum rental payments under leases in effect as of January 28, 2012, are as follows (in thousands):
| Capital Leases |
Operating Leases |
Total | ||||||||||
| 2012 |
$ | 4,445 | $ | 54,397 | $ | 58,842 | ||||||
| 2013 |
3,098 | 59,634 | 62,732 | |||||||||
| 2014 |
1,462 | 49,805 | 51,267 | |||||||||
| 2015 |
214 | 42,686 | 42,900 | |||||||||
| 2016 |
42 | 38,978 | 39,020 | |||||||||
| Thereafter |
— | 232,689 | 232,689 | |||||||||
|
|
|
|
|
|
|
|||||||
| Minimum lease commitments |
9,261 | $ | 478,189 | $ | 487,450 | |||||||
|
|
|
|
|
|||||||||
| Less—amount representing interest |
(520 | ) | ||||||||||
|
|
|
|||||||||||
| Present value of capital lease obligations |
8,741 | |||||||||||
| Less—current capital lease obligations |
(4,114 | ) | ||||||||||
|
|
|
|||||||||||
| Long-term capital lease obligations |
$ | 4,627 | ||||||||||
|
|
|
|||||||||||
The current capital lease obligations are included in other current liabilities on the consolidated balance sheets. The long-term capital lease obligations are included in other long-term obligations on the consolidated balance sheets.
Lease payments that depend on factors that are not measurable at the inception of the lease, such as future sales volume, are contingent rentals and are excluded from minimum lease payments and included in the determination of total rental expense when it is probable that the expense has been incurred and the amount is reasonably estimable. Future payments for insurance, real estate taxes and repair and maintenance to which the Company is obligated are excluded from minimum lease payments. Minimum and contingent rental expense under operating leases is as follows (in thousands):
| Year Ended | ||||||||||||
| January 30, 2010 |
January 29, 2011 |
January 28, 2012 |
||||||||||
| Operating leases |
||||||||||||
| Minimum rental expense |
$ | 51,054 | $ | 48,801 | $ | 51,665 | ||||||
| Contingent rental expense |
268 | 900 | 1,456 | |||||||||
|
|
|
|
|
|
|
|||||||
| Total operating leases |
$ | 51,322 | $ | 49,701 | $ | 53,121 | ||||||
|
|
|
|
|
|
|
|||||||
Commitments
The Company had no off balance sheet commitments as of January 28, 2012.
In the event of a subsequent sale of the Company, illiquid sale of the Company or an initial public offering, the Company would be required to make payments to Catterton, Tower Three and Glenhill pursuant to the terms of their management services agreement. The amount of such payments will be negotiated with Parent’s Board of Directors at the time of such transaction.
F-34
Table of Contents
In addition, certain former executives are entitled to cash payments up to $2.2 million in the event of a subsequent sale of the Company, illiquid sale of the Company or initial public offering.
Contingencies
The Company is involved from time to time in various legal claims, actions and complaints arising in connection with its business. The outcome of matters the Company is involved in cannot be determined at this time and the results cannot be predicted with certainty.
The Company reviews the need for any loss contingency reserves and establishes reserves when, in the opinion of management, it is probable that a matter would result in liability, and the amount of loss, if any, can be reasonably estimated. Generally, in view of the inherent difficulty of predicting the outcome of those matters, particularly in cases in which claimants seek substantial or indeterminate damages, it is not possible to determine whether a liability has been incurred or to reasonably estimate the ultimate or minimum amount of that liability until the case is close to resolution, in which case no reserve is established until that time.
NOTE 15—SEGMENT REPORTING
The Company defines an operating segment on the same basis that it uses to evaluate performance internally by the Chief Operating Decision Maker (“CODM”). The Company has determined that the Co-Chief Executive Officers were its CODM and there was one operating segment. Therefore, the Company reports as a single segment. This includes all sales channels accessed by the Company’s customers, including sales through catalogs, sales through the Company’s website and sales through the Company’s stores.
The Company classifies its sales into furniture and non-furniture product lines. Furniture includes both indoor and outdoor furniture from the Company’s business lines. Non-furniture includes lighting, textiles, accessories and home décor. Net revenues in each category were as follows (in thousands):
| Year Ended | ||||||||||||
| January 30, 2010 |
January 29, 2011 |
January 28, 2012 |
||||||||||
| Furniture |
$ | 221,117 | $ | 339,173 | $ | 477,730 | ||||||
| Non-furniture |
404,568 | 433,579 | 480,354 | |||||||||
|
|
|
|
|
|
|
|||||||
| Total net revenues |
$ | 625,685 | $ | 772,752 | $ | 958,084 | ||||||
|
|
|
|
|
|
|
|||||||
The Company is domiciled in the United States and operates stores in the United States and Canada. Revenues from Canadian operations, and the long-lived assets in Canada, are not material to the Company. Geographic revenues are determined based upon where service is rendered.
No single customer accounted for more than 10% of the Company’s revenues in fiscal 2009, fiscal 2010, or fiscal 2011.
NOTE 16—RETAIL STORE CLOSURES AND OFFICE RESTRUCTURING
Shanghai Office Restructuring
In April 2011, the Company restructured its Shanghai office location and terminated employees at that office, as well as terminated employees within the corporate headquarters in Corte Madera, CA. As a result, during fiscal 2011, the Company incurred $1.6 million in restructuring related costs, including one-time employee termination benefits, contract termination fees, loss on disposal of capitalized property and equipment, and other associated costs, which are included in selling, general and administrative expenses on the consolidated statements of operations. The Company does not expect to incur additional costs associated with this office closure in future periods.
F-35
Table of Contents
Retail Store Closures
In June and July 2011, the Company closed four retail store locations prior to their respective lease termination dates. As a result, during fiscal 2011, the Company incurred $3.2 million in exit related costs, including contract termination fees, one-time employee termination benefits and other associated costs, which are included in selling, general and administrative expenses on the consolidated statements of operations. At January 28, 2012, the Company had remaining future liabilities existing under the lease agreements of $1.5 million which consisted of $1.0 million in contract termination fees and broker commission related costs of $0.5 million. The Company does not expect to incur additional costs associated with these retail store closures in future periods.
NOTE 17—SUBSEQUENT EVENTS
Management has evaluated all events and transactions that occurred after January 28, 2012, through April 26, 2012, which is the date the financial statements are available to be issued. No material subsequent events have occurred since January 28, 2012, that require recognition or disclosure in these consolidated financial statements, except the following:
Reorganization
Restoration Hardware Holdings, Inc. was formed on August 18, 2011, as a holding company for the purposes of facilitating an initial public offering of its common stock. It is expected that following the Reorganization, as defined in Note 10—Pro Forma Net Loss Per Share (Unaudited), the Company will become a direct, wholly owned subsidiary of Restoration Hardware Holdings, Inc. prior to the completion of the initial public offering.
F-36
Table of Contents
CONDENSED CONSOLIDATED BALANCE SHEETS
(In thousands, except share amounts)
(Unaudited)
| January 28, 2012 |
July 28, 2012 |
|||||||
| ASSETS |
||||||||
| Current assets: |
||||||||
| Cash and cash equivalents |
$ | 8,511 | $ | 10,102 | ||||
| Accounts receivable—net |
11,759 | 17,417 | ||||||
| Merchandise inventories |
245,876 | 275,485 | ||||||
| Prepaid expense and other current assets |
56,731 | 81,187 | ||||||
|
|
|
|
|
|||||
| Total current assets |
322,877 | 384,191 | ||||||
| Property and equipment—net |
83,558 | 87,904 | ||||||
| Goodwill |
122,595 | 122,585 | ||||||
| Trademarks |
47,100 | 47,404 | ||||||
| Other intangible assets—net |
5,426 | 4,136 | ||||||
| Other assets |
5,253 | 4,654 | ||||||
|
|
|
|
|
|||||
| Total assets |
$ | 586,809 | $ | 650,874 | ||||
|
|
|
|
|
|||||
| LIABILITIES AND STOCKHOLDERS’ EQUITY |
||||||||
| Current liabilities: |
||||||||
| Accounts payable and accrued expenses |
$ | 105,694 | $ | 117,175 | ||||
| Deferred revenue and customer deposits |
25,419 | 38,599 | ||||||
| Other current liabilities |
30,861 | 29,640 | ||||||
|
|
|
|
|
|||||
| Total current liabilities |
161,974 | 185,414 | ||||||
| Revolving line of credit |
107,502 | 129,637 | ||||||
| Term loan |
14,798 | 14,815 | ||||||
| Deferred rent and lease incentives |
19,851 | 25,144 | ||||||
| Deferred tax liabilities |
22,153 | 22,154 | ||||||
| Other long-term obligations |
10,069 | 8,587 | ||||||
|
|
|
|
|
|||||
| Total liabilities |
336,347 | 385,751 | ||||||
|
|
|
|
|
|||||
| Commitments and contingencies (See Note 11 to the unaudited condensed consolidated financial statements) |
— | — | ||||||
| Stockholders’ equity: |
||||||||
| Common stock, $0.01 par value, 1,000 shares authorized, 100 shares issued and outstanding as of both January 28, 2012 and July 28, 2012 |
— | — | ||||||
| Additional paid-in capital |
293,280 | 293,917 | ||||||
| Accumulated other comprehensive income |
1,150 | 1,185 | ||||||
| Accumulated deficit |
(43,968 | ) | (29,979 | ) | ||||
|
|
|
|
|
|||||
| Total stockholders’ equity |
250,462 | 265,123 | ||||||
|
|
|
|
|
|||||
| Total liabilities and stockholders’ equity |
$ | 586,809 | $ | 650,874 | ||||
|
|
|
|
|
|||||
The accompanying notes are an integral part of these unaudited Condensed Consolidated Financial Statements.
F-37
Table of Contents
CONDENSED CONSOLIDATED STATEMENTS OF OPERATIONS
(In thousands, except share and per share amounts)
(Unaudited)
| Six Months Ended | ||||||||
| July 30, 2011 |
July 28, 2012 |
|||||||
| Net revenues |
$ | 420,383 | $ | 510,820 | ||||
| Cost of goods sold |
265,953 | 321,425 | ||||||
|
|
|
|
|
|||||
| Gross profit |
154,430 | 189,395 | ||||||
| Selling, general and administrative expenses |
150,619 | 171,729 | ||||||
|
|
|
|
|
|||||
| Income from operations |
3,811 | 17,666 | ||||||
| Interest expense |
(1,888 | ) | (3,054 | ) | ||||
|
|
|
|
|
|||||
| Income before income taxes |
1,923 | 14,612 | ||||||
| Income tax expense |
783 | 623 | ||||||
|
|
|
|
|
|||||
| Net income |
$ | 1,140 | $ | 13,989 | ||||
|
|
|
|
|
|||||
| Basic and diluted net income per share |
$ | 11,400 | $ | 139,890 | ||||
| Shares used in computing basic and diluted net income per share |
100 | 100 | ||||||
| Pro forma basic and diluted net income per share |
$ | |||||||
| Pro forma shares used in computing basic and diluted net income per share |
||||||||
The accompanying notes are an integral part of these unaudited Condensed Consolidated Financial Statements.
F-38
Table of Contents
CONDENSED CONSOLIDATED STATEMENTS OF COMPREHENSIVE INCOME
(In thousands)
(Unaudited)
| Six Months Ended | ||||||||
| July 30, 2011 |
July 28, 2012 |
|||||||
| Net income |
$ | 1,140 | $ | 13,989 | ||||
| Foreign currency translation adjustment—net of tax |
310 | 35 | ||||||
|
|
|
|
|
|||||
| Total comprehensive income |
$ | 1,450 | $ | 14,024 | ||||
|
|
|
|
|
|||||
The accompanying notes are an integral part of these unaudited Condensed Consolidated Financial Statements.
F-39
Table of Contents
CONDENSED CONSOLIDATED STATEMENTS OF CASH FLOWS
(In thousands)
(Unaudited)
| Six Months Ended | ||||||||
| July 30, 2011 |
July 28, 2012 |
|||||||
| CASH FLOWS FROM OPERATING ACTIVITIES |
||||||||
| Net income |
$ | 1,140 | $ | 13,989 | ||||
| Adjustments to reconcile net income to net cash used in operating activities: |
||||||||
| Depreciation and amortization |
14,983 | 12,892 | ||||||
| Loss on disposal of property and equipment |
674 | — | ||||||
| Stock-based compensation expense |
1,100 | 637 | ||||||
| Amortization of financing fees |
96 | 309 | ||||||
| Change in assets and liabilities: |
||||||||
| Accounts receivable |
(7,689 | ) | (5,660 | ) | ||||
| Merchandise inventories |
(36,666 | ) | (29,639 | ) | ||||
| Prepaid expense and other current assets |
(19,324 | ) | (24,464 | ) | ||||
| Other assets |
(512 | ) | 396 | |||||
| Accounts payable and accrued expenses |
18,907 | 8,894 | ||||||
| Deferred revenue and customer deposits |
9,086 | 13,180 | ||||||
| Other current liabilities |
2,899 | (758 | ) | |||||
| Deferred rent and lease incentives |
351 | 5,310 | ||||||
| Other long-term obligations |
128 | 282 | ||||||
|
|
|
|
|
|||||
| Net cash used in operating activities |
(14,827 | ) | (4,632 | ) | ||||
|
|
|
|
|
|||||
| CASH FLOWS FROM INVESTING ACTIVITIES |
||||||||
| Capital expenditures |
(12,168 | ) | (13,517 | ) | ||||
| Purchase of domain name |
— | (304 | ) | |||||
|
|
|
|
|
|||||
| Net cash used in investing activities |
(12,168 | ) | (13,821 | ) | ||||
|
|
|
|
|
|||||
| CASH FLOWS FROM FINANCING ACTIVITIES |
||||||||
| Gross borrowings under line of credit |
465,410 | 566,808 | ||||||
| Gross repayments under line of credit |
(440,734 | ) | (544,673 | ) | ||||
| Payments on capital leases |
(2,027 | ) | (2,104 | ) | ||||
|
|
|
|
|
|||||
| Net cash provided by financing activities |
22,649 | 20,031 | ||||||
|
|
|
|
|
|||||
| Effects of foreign currency exchange rate translation |
121 | 13 | ||||||
|
|
|
|
|
|||||
| Net increase (decrease) in cash and cash equivalents |
(4,225 | ) | 1,591 | |||||
| Cash and cash equivalents |
||||||||
| Beginning of period |
13,364 | 8,511 | ||||||
|
|
|
|
|
|||||
| End of period |
$ | 9,139 | $ | 10,102 | ||||
|
|
|
|
|
|||||
| Non-cash transactions: |
||||||||
| Property and equipment acquired under capital lease |
$ | 6,752 | $ | — | ||||
| Property and equipment additions in accounts payable |
$ | 13 | $ | 2,590 | ||||
The accompanying notes are an integral part of these unaudited Condensed Consolidated Financial Statements.
F-40
Table of Contents
NOTES TO CONDENSED CONSOLIDATED FINANCIAL STATEMENTS
(Unaudited)
NOTE 1—THE COMPANY
Nature of Business
Restoration Hardware, Inc., a Delaware corporation, together with its subsidiaries (collectively, the “Company”), is a luxury home furnishings retailer that offers a growing number of categories including furniture, lighting, textiles, bathware, décor, outdoor, garden, and baby and child products. These products are sold through the Company’s stores, catalogs and websites. As of July 28, 2012, the Company operated a total of 73 retail stores and 10 outlet stores in 29 states, the District of Columbia and Canada, and had sourcing operations in Shanghai and Hong Kong.
On June 16, 2008, the Company completed a merger with a wholly owned subsidiary (“Merger Sub”) of Home Holdings, LLC (“Parent”), a Delaware limited liability company, pursuant to which Merger Sub merged with and into the Company and the Company became a direct wholly owned subsidiary of Parent (the “Acquisition”). Parent is controlled by investment funds affiliated with Catterton Management Company, LLC (“Catterton”), Tower Three Partners LLC (“Tower Three”) and GJK Capital Advisors, LLC (“Glenhill”).
Basis of Presentation
The accompanying unaudited interim condensed consolidated financial statements have been prepared from the Company’s records and, in management’s opinion, include all adjustments (consisting of normal recurring adjustments) necessary to fairly state the Company’s financial position as of July 28, 2012, and the results of operations and changes of cash flows for the six months ended July 30, 2011, and July 28, 2012, which both consist of twenty-six week periods.
The Company’s accounting policies are described in Note 3 to its audited consolidated financial statements for the fiscal year ended January 28, 2012 (“fiscal 2011”). Certain information and disclosures normally included in the notes to annual consolidated financial statements prepared in accordance with accounting principles generally accepted in the United States of America have been condensed or omitted for purposes of these interim condensed consolidated financial statements. The interim condensed consolidated financial statements should be read in conjunction with the audited consolidated financial statements, including the notes thereto, for fiscal 2011. The Company’s current fiscal year ends on February 2, 2013 (“fiscal 2012”).
The results of operations for the six months ended July 28, 2012, presented herein are not necessarily indicative of the results to be expected for the full fiscal year.
NOTE 2—RECENT ACCOUNTING PRONOUNCEMENTS
In July 2012, the Financial Accounting Standards Board (“FASB”) issued guidance that revises the requirements around how entities test indefinite-lived intangible assets other than goodwill for impairment. Similar to the guidance issued in September 2011 related to the testing of goodwill for impairment, this guidance allows companies to perform a qualitative assessment before calculating the fair value of the indefinite-lived intangible asset. If entities determine, on the basis of qualitative factors, that the fair value of the indefinite-lived intangible asset is more likely than not greater than the carrying amount, a quantitative calculation would not be needed. The Company will adopt this guidance effective for its fiscal 2012 annual indefinite-lived intangible assets impairment test. The adoption of this guidance will result in a change in how the Company performs its indefinite-lived intangible assets impairment assessment; however, the Company does not expect it to have a material impact on its consolidated financial statements.
F-41
Table of Contents
In June 2011, the FASB issued guidance that revises the manner in which entities present comprehensive income in their financial statements. The guidance requires entities to report the components of comprehensive income in either a single, continuous statement or two separate but consecutive statements. In December 2011, the FASB issued guidance which defers certain requirements set forth in June 2011. These amendments are being made to allow the FASB time to redeliberate whether to present on the face of the financial statements the effects of reclassifications out of accumulated other comprehensive income on the components of net income and other comprehensive income in all periods presented. Both sets of guidance are effective for fiscal years, and interim periods within those years, beginning after December 15, 2011 and is to be applied retrospectively. The Company adopted this guidance on January 29, 2012 and such adoption only resulted in a change in how the Company presents the components of comprehensive income, which was previously presented within its consolidated statements of stockholders’ equity.
In May 2011, the FASB issued guidance to amend the fair value measurement and disclosure requirements. The guidance requires the disclosure of quantitative information about unobservable inputs used, a description of the valuation processes used, and a qualitative discussion around the sensitivity of the measurements. The guidance is effective during interim and annual periods beginning after December 15, 2011 and is to be applied prospectively. The Company adopted this guidance on January 29, 2012 and adoption did not have a material impact on its condensed consolidated financial statement footnote disclosures.
NOTE 3—PREPAID EXPENSES AND OTHER CURRENT ASSETS
Prepaid expenses and other current assets consist of the following (in thousands):
| January 28, 2012 |
July 28, 2012 |
|||||||
| Prepaid catalog |
$ | 28,608 | $ | 45,083 | ||||
| Vendor deposits |
9,399 | 13,578 | ||||||
| Prepaid expenses |
8,923 | 11,255 | ||||||
| Deferred tax assets |
4,161 | 4,161 | ||||||
| Other current assets |
5,640 | 7,110 | ||||||
|
|
|
|
|
|||||
| Total prepaid expenses and other current assets |
$ | 56,731 | $ | 81,187 | ||||
|
|
|
|
|
|||||
NOTE 4—PROPERTY AND EQUIPMENT
Property and equipment consists of the following (in thousands):
| January 28, 2012 |
July 28, 2012 |
|||||||
| Leasehold improvements (1) |
$ | 118,898 | $ | 129,989 | ||||
| Land |
2,388 | 2,388 | ||||||
| Building |
2,205 | 2,205 | ||||||
| Furniture, fixtures and equipment |
16,166 | 21,532 | ||||||
| Machinery and equipment |
4,823 | 4,999 | ||||||
| Computer software |
27,194 | 29,520 | ||||||
| Equipment under capital leases (2) |
13,918 | 10,976 | ||||||
|
|
|
|
|
|||||
| Total property and equipment |
185,592 | 201,609 | ||||||
| Less—accumulated depreciation and amortization |
(102,034 | ) | (113,705 | ) | ||||
| Total property and equipment—net |
$ | 83,558 | $ | 87,904 | ||||
| (1) | Leasehold improvements include construction in progress of $9.1 million and $9.6 million as of January 28, 2012, and July 28, 2012, respectively. |
F-42
Table of Contents
| (2) | Accumulated depreciation and amortization include accumulated amortization related to equipment under capital leases of $8.5 million and $7.2 million as of January 28, 2012, and July 28, 2012, respectively. |
The Company recorded depreciation expense of $13.4 million and $11.7 million in the six months ended July 30, 2011, and July 28, 2012, respectively.
NOTE 5—GOODWILL AND INTANGIBLE ASSETS
The following sets forth the goodwill and intangible assets as of January 28, 2012 (dollar amounts in thousands):
| Gross Carrying Amount |
Accumulated Amortization |
Foreign Currency Translation |
Net Book Value |
Useful Life |
||||||||||||||||
| Intangible assets subject to amortization: |
||||||||||||||||||||
| Core technologies |
$ | 6,580 | $ | (4,825 | ) | $ | — | $ | 1,755 | 5 years | ||||||||||
| Fair value of leases |
||||||||||||||||||||
| Fair market write-up |
11,988 | (8,365 | ) | 48 | 3,671 | (2 | ) | |||||||||||||
| Fair market write-down |
(2,591 | ) | 1,448 | — | (1,143 | )(1) | (2 | ) | ||||||||||||
|
|
|
|
|
|
|
|
|
|||||||||||||
| Total intangible assets subject to amortization |
15,977 | (11,742 | ) | 48 | 4,283 | |||||||||||||||
| Intangible assets not subject to amortization: |
||||||||||||||||||||
| Goodwill |
122,285 | — | 310 | 122,595 | ||||||||||||||||
| Trademarks |
47,100 | — | — | 47,100 | ||||||||||||||||
|
|
|
|
|
|
|
|
|
|||||||||||||
| Total intangible assets |
$ | 185,362 | $ | (11,742 | ) | $ | 358 | $ | 173,978 | |||||||||||
|
|
|
|
|
|
|
|
|
|||||||||||||
| (1) | The fair market write-down of leases is included in other long-term obligations on the condensed consolidated balance sheets. |
| (2) | The fair value of each lease is amortized over the life of the respective lease. The longest lease for which a fair value adjustment was recorded has a termination date in January 2019. |
The following sets forth the goodwill and intangible assets as of July 28, 2012 (dollar amounts in thousands):
| Gross Carrying Amount |
Accumulated Amortization |
Foreign Currency Translation |
Net Book Value |
Useful Life |
||||||||||||||||
| Intangible assets subject to amortization: |
||||||||||||||||||||
| Core technologies |
$ | 6,580 | $ | (5,483 | ) | $ | — | $ | 1,097 | 5 years | ||||||||||
| Fair value of leases |
||||||||||||||||||||
| Fair market write-up |
11,988 | (8,996 | ) | 48 | 3,039 | (2 | ) | |||||||||||||
| Fair market write-down |
(2,591 | ) | 1,623 | — | (968 | )(1) | (2 | ) | ||||||||||||
|
|
|
|
|
|
|
|
|
|||||||||||||
| Total intangible assets subject to amortization |
15,977 | (12,856 | ) | 48 | 3,168 | |||||||||||||||
| Intangible assets not subject to amortization: |
||||||||||||||||||||
| Goodwill |
122,285 | — | 300 | 122,585 | ||||||||||||||||
| Trademarks |
47,404 | — | — | 47,404 | ||||||||||||||||
|
|
|
|
|
|
|
|
|
|||||||||||||
| Total intangible assets |
$ | 185,666 | $ | (12,856 | ) | $ | 348 | $ | 173,157 | |||||||||||
|
|
|
|
|
|
|
|
|
|||||||||||||
| (1) | The fair market write-down of leases is included in other long-term obligations on the condensed consolidated balance sheets. |
F-43
Table of Contents
| (2) | The fair value of each lease is amortized over the life of the respective lease. The longest lease for which a fair value adjustment was recorded has a termination date in January 2019. |
Core technologies represents the fair market value of Company-developed technologies that had been fully depreciated at the time of the Acquisition. The fair value of leases reflects the Company’s favorable and unfavorable positions of lease terms for its stores, distribution centers and corporate headquarters at the time of the Acquisition.
In July 2012, the Company purchased the domain rights to the web address “www.rh.com” for $0.3 million, which is included in trademarks on the condensed consolidated balance sheets.
The Company recorded amortization expense related to intangible assets of $1.5 million and $1.1 million in the six months ended July 30, 2011, and July 28, 2012, respectively.
The following table sets forth the remaining amortization of the intangible assets based on a straight-line method of amortization over the respective useful lives as of July 28, 2012 (in thousands):
| Remainder of 2012 |
$ | 1,104 | ||
| 2013 |
1,204 | |||
| 2014 |
690 | |||
| 2015 |
95 | |||
| 2016 |
56 | |||
| Thereafter |
19 | |||
|
|
|
|||
| Total amortization |
$ | 3,168 | ||
|
|
|
NOTE 6—ACCOUNTS PAYABLE AND ACCRUED EXPENSES
Accounts payable and accrued expenses consist of the following (in thousands):
| January 28, 2012 |
July 28, 2012 |
|||||||
| Accounts payable |
$ | 47,440 | $ | 62,655 | ||||
| Accrued compensation |
21,168 | 14,550 | ||||||
| Accrued freight |
8,896 | 9,538 | ||||||
| Accrued occupancy |
6,203 | 7,040 | ||||||
| Accrued catalog |
7,176 | 4,277 | ||||||
| Accrued sales taxes |
8,472 | 9,037 | ||||||
| Accrued professional fees |
2,494 | 5,844 | ||||||
| Other accrued expenses |
3,845 | 4,234 | ||||||
|
|
|
|
|
|||||
| Total accounts payable and accrued expenses |
$ | 105,694 | $ | 117,175 | ||||
|
|
|
|
|
|||||
Accounts payable included negative cash balances due to outstanding checks of $12.4 million and $16.5 million as of January 28, 2012, and July 28, 2012, respectively.
NOTE 7—LINE OF CREDIT AND TERM LOAN
In August 2011, the Company, along with its Canadian subsidiary, Restoration Hardware Canada, Inc., entered into a revolving line of credit agreement with Bank of America, N.A., as administrative agent, and certain other lenders. This credit agreement modified a previous facility in which the Company had a revolving
F-44
Table of Contents
line of credit for up to $190.0 million. As a result of the modification, the unamortized deferred financing fees related to the previous revolving line of credit on the date of the modification of $0.2 million will be amortized over the life of the new revolving line of credit, which has a maturity date of August 3, 2016. Under this amended credit agreement (which was further amended in January 2012 to incorporate a term loan facility), the Company has (i) a revolving line of credit available of up to $317.5 million, of which $10.0 million is available to Restoration Hardware Canada, Inc., and (ii) a $15.0 million term loan with a maturity date of July 6, 2015.
Under the terms of the credit agreement, the Company may increase the amount of the revolving line of credit by up to an additional $100 million provided that, among other things, the lenders agree to participate in the increased loan commitments under the credit facility, no default under the revolving line of credit then exists or would result from such increase and sufficient borrowing base collateral is available to support increased loan amounts.
The availability of credit at any given time under the revolving line of credit is limited by reference to a borrowing base formula based upon numerous factors, including the value of eligible inventory, eligible accounts receivable, eligible real estate, and, in the case of the term loan, registered trade names, and reserves established by the administrative agent. As a result of the borrowing base formula, the actual borrowing availability under the revolving line of credit could be less than the stated amount of the revolving line of credit (as reduced by the actual borrowings and outstanding letters of credit under the revolving line of credit). The revolving line of credit is secured by substantially all of the Company’s assets, including accounts receivable, inventory, intangible assets, property, equipment, goods and fixtures.
Borrowings under the revolving line of credit are subject to interest, at borrowers’ option, at either the bank’s reference rate or LIBOR (or the BA Rate or the Canadian Prime Rate, as such terms are defined in the credit agreement, in the case of Canadian borrowings denominated in Canadian dollars or the U.S. Index Rate or LIBOR for Canadian borrowings denominated in U.S. dollars) plus an applicable margin rate, in each case. The weighted-average interest rate for the revolving line of credit was 2.7% as of July 28, 2012. The term loan bears interest at a rate of LIBOR plus 5.0%, and the interest rate for the term loan was 5.3% as of July 28, 2012.
As of July 28, 2012, $129.6 million was outstanding under the revolving line of credit and the term loan was $14.8 million, net of $0.2 million unamortized debt issuance costs. As of July 28, 2012, the Company’s undrawn borrowing availability under the credit facility was $86.2 million. There were $6.9 million and $11.5 million in outstanding letters of credit as of January 28, 2012, and July 28, 2012, respectively.
The Company is required to repay the term loan in quarterly installments of $1.25 million beginning October 2012 with the final payment in April 2015.
The credit agreement contains various restrictive covenants, including, among others, limitations on the ability to incur liens, make loans or other investments, incur additional debt, issue additional equity, merge or consolidate with or into another person, sell assets, pay dividends or make other distributions, or enter into transactions with affiliates. The credit agreement does not contain any significant financial or coverage ratio covenants unless the availability under the revolving line of credit is less than the greater of (i) $17.5 million and (ii) 10% of the lesser of (A) the aggregate maximum commitments under the credit facility and (B) the domestic borrowing base. If the availability under the revolving line of credit is less than the foregoing amount, then the Company is required to maintain a consolidated fixed charge coverage ratio of at least one to one. As of July 28, 2012, the Company is in compliance with all covenants, and if the availability under the revolving line of credit were less than the amount described above, the Company would have been in compliance with the consolidated fixed charge coverage ratio described in the previous sentence. The credit agreement requires a daily sweep of cash to prepay the loans under the credit agreement while (i) an event of default exists or (ii) the availability under the revolving line of credit for extensions of credit to the Company is less than the greater of (A) $20.0 million and (B) 15% of the lesser of the aggregate maximum commitments and the domestic borrowing base.
F-45
Table of Contents
NOTE 8—INCOME TAXES
As of January 28, 2012, and July 28, 2012, $2.5 million and $2.6 million, respectively, of the exposures related to unrecognized tax benefits would affect the effective tax rate if realized and are included in other long-term obligations on the condensed consolidated balance sheets. These amounts are primarily associated with foreign tax exposures that would, if realized, reduce the amount of net operating losses that would ultimately be utilized. As of July 28, 2012, $0.5 million of the exposures related to unrecognized tax benefits are expected to decrease in the next 12 months due to the lapse of the statute of limitations.
Adjustments required upon adoption of accounting for uncertainty in income taxes related to deferred tax asset accounts were offset by the related valuation allowance. Future changes to the Company’s assessment of the realizability of those deferred tax assets will impact the effective tax rate. The Company accounts for interest and penalties related to exposures as a component of income tax expense. The Company has accrued $1.3 million and $1.4 million of penalties and interest associated with exposures as of January 28, 2012, and July 28, 2012, respectively.
Income tax expense for the six months ended July 28, 2012 of $0.6 million decreased $0.2 million from income tax expense for the six months ended July 30, 2011 of $0.8 million, despite significantly improved results. This decrease is primarily due to California allowing the use of net operating loss carryforwards to offset California income, where previously California suspended the use of net operating loss caryforwards for the year ended January 28, 2012.
NOTE 9—PRO FORMA EQUITY AND NET LOSS PER SHARE
Restoration Hardware Holdings, Inc. (the “Issuer”) was incorporated as a Delaware corporation on August 18, 2011, for the purpose of acquiring all of the stock of the Company. Prior to the completion of this offering, the Issuer will acquire all of the outstanding shares of capital stock of the Company. Outstanding units under Parent’s equity compensation plan, referred to as the Team Resto Ownership Plan, will be converted in connection with this offering into common stock of the Issuer. These transactions are referred to as the “Reorganization.”
Pro forma stockholders’ equity as of July 28, 2012, has been computed to give effect to the Reorganization of the Company as if such events had been completed as of the beginning of the fiscal period.
Unaudited pro forma net income per share for the six months ended July 28, 2012, has been computed to give effect to the Reorganization as if such events had been completed as of the beginning of the fiscal period and the share capital resulting therefrom was outstanding for the six months ended July 28, 2012. In addition, shares issued in the initial public offering of common stock of the Issuer for proceeds of $ will be used to repay all of the outstanding amounts under the Company’s revolving line of credit and term loan, which were $129.6 million and $14.8 million, net of unamortized debt issuance costs of $0.2 million, respectively, as of July 28, 2012. The issuance of the shares and the repayment of the revolving line of credit and term loan are assumed to have occurred as of the beginning of the fiscal period. The Company has assumed that the initial public offering price is $ , the midpoint in the estimated price range set forth on the cover of the prospectus included in the Issuer’s Form S-1 Registration Statement.
Pro forma net income has been computed by taking net income and removing interest expense related to debt assumed to be repaid. The interest expense amount has not been adjusted to record the tax effect at the Company’s estimated statutory tax rate of 40% as all deferred tax assets have a full valuation allowance as of July 28, 2012.
F-46
Table of Contents
The following table summarizes pro forma net income and pro forma basic and diluted net income per share computations for the six months ended July 28, 2012 (in thousands, except share and per share amounts):
| Net income—as reported |
$ | 13,989 | ||
| Less—interest expense |
||||
|
|
|
|||
| Pro forma net income |
$ | |||
|
|
|
|||
| Pro forma weighted-average shares outstanding after Reorganization |
||||
| Pro forma shares issued to repay revolving line of credit and term loan |
||||
|
|
|
|||
| Pro forma shares for basic and diluted income per share |
||||
|
|
|
|||
| Pro forma basic and diluted net income per share |
$ |
NOTE 10—STOCK-BASED COMPENSATION
The Company accounts for stock-based compensation in accordance with applicable guidance, which requires the Company to estimate the value of securities issued based upon an option-pricing model and recognize this estimated value as compensation expense over the vesting periods.
In connection with the Acquisition, Parent established the Team Resto Ownership Plan in fiscal 2009. Awards under the Team Resto Ownership Plan are granted by Parent and are made up of the following:
| • | Time-based units—time-based units vest in annual installments, generally over a five-year graded vesting period. |
| • | Performance-based units—performance-based units vest based on a return on equity investment to the Company’s investors between either two times and three times such investment (the “2X—3X Performance-based Units”) or three times and five times such investment (the “3X—5X Performance-based Units”). |
Under the terms of the Team Resto Ownership Plan, 2X—3X Performance-based Units will vest to the extent cumulative return on equity investment is greater than two times and up to and including three times the original invested capital amount, with proportional vesting in between. At a return on equity investment equal to three times the original invested capital amount, 100% of the 2X—3X Performance-based Units vest. In the case of 3X—5X Performance-based Units, these performance-based units will vest to the extent cumulative return on equity investment is greater than three and up to and including five times the original invested capital amount, with proportional vesting in between. In the case of these 3X—5X Performance-based Units, 100% of the units vest at cumulative return on equity investment equal to five times the original invested capital amount. Performance-based units that do not vest will be cancelled for no consideration.
Under the Team Resto Ownership Plan, vesting of performance-based units will occur upon the consummation of an initial public offering to the extent of achievement of the applicable cumulative return on equity investment as provided in the Team Resto Ownership Plan. Return on equity investment will be calculated based upon a return on investment to the Company’s investors assuming that its investors had received the initial public offering price for their investments as a result of such offering.
All stock-based compensation expense associated with the grants of units by Parent to the Company’s directors, executive officers and employees is recorded by the Company.
As of July 28, 2012, the total number of units issuable under the Team Resto Ownership Plan was 21,045,517. If all 21,045,517 units were issued and fully vested under their terms, such interests would represent 24.9% of all of the outstanding equity interests in Parent on a fully diluted basis. Awards of units reduce the
F-47
Table of Contents
number of units available for future issuance. Cancellations and forfeitures of units previously granted increase the number of units available for future issuance. The number of units available for future issuance under the Team Resto Ownership Plan as of July 28, 2012, was 1,687,759.
The Company estimates the fair value of each grant on the date of grant using a lattice model that incorporates a Monte Carlo Simulation (the “Monte Carlo method”), which includes the following assumptions:
Expected Equity Returns and Volatility—The Monte-Carlo method incorporates both expectations concerning equity returns in the future and an expected volatility in terms of the possible range of returns units based upon historical volatility data from a group of comparable companies prior to the valuation date and expectations of future volatility over a timeframe consistent with the expected life of the awards.
Expected Unit Life—The Monte-Carlo method analysis includes an estimate of the expected unit life from grant date which represents the period that the units are anticipated to be outstanding after initial grant until expiration or settlement based upon various factors including expectations concerning a potential liquidity event, the contractual terms of the equity based awards and vesting schedules.
Risk Free Interest Rate—The Monte-Carlo method incorporates an assumed risk-free interest rate which is based on the U.S. Treasury yield curve rates in effect at the time of the grant using the term most consistent with the expected life of the award.
Expected Dividend Yield—Dividend yield was estimated at zero as Parent does not anticipate making future distributions to equity holders.
Time-Based Units
The following table presents the time-based unit activity for the three months ended July 28, 2012:
| Number Of Units |
Weighted Average Grant Date Fair Value |
Weighted Average Remaining Contractual Life (In Years) |
||||||||||
| Outstanding—January 28, 2012 |
10,288,720 | $ | 0.69 | 7.43 | ||||||||
| Granted |
— | — | — | |||||||||
| Cancelled |
(33,000 | ) | 0.62 | 9.85 | ||||||||
| Forfeited |
(241,750 | ) | 1.24 | 10.17 | ||||||||
|
|
|
|||||||||||
| Outstanding—July 28, 2012 |
10,013,970 | 0.68 | 7.15 | |||||||||
|
|
|
|||||||||||
As of July 28, 2012, 5,852,566 time-based units were vested with a weighted average grant date fair value of $0.59 and a remaining weighted average expected life of 7.01 years.
During the six months ended July 30, 2011 and July 28, 2012, the fair value of units vested was $1.1 million and $1.0 million, respectively. As of July 28, 2012, the total unrecognized compensation expense related to non-vested time-based units was $1.9 million, which is expected to be recognized on a graded basis over a weighted average period of 2.22 years. No stock-based compensation cost has been capitalized in the accompanying condensed consolidated financial statements.
The Company recorded stock-based compensation expense for time-based units of $1.1 million and $0.6 million in the six months ended July 30, 2011, and July 28, 2012, respectively, which is included in selling, general and administrative expenses on the condensed consolidated statements of operations.
F-48
Table of Contents
Performance-Based Units
The following table presents the performance-based unit activity for the six months ended July 28, 2012:
| Number Of Units |
Weighted Average Grant Date Fair Value |
|||||||
| Outstanding—January 28, 2012 |
9,121,775 | $ | 0.28 | |||||
| Granted |
— | — | ||||||
| Forfeited |
(30,000 | ) | 0.77 | |||||
|
|
|
|||||||
| Outstanding—July 28, 2012 |
9,091,775 | 0.28 | ||||||
|
|
|
|||||||
The Company recognizes expense associated with the units when it becomes probable that the performance condition will be met. Once it becomes probable that a participant will vest, the Company recognizes compensation expense equal to the number of shares which have vested multiplied by the fair value of the related shares measured at the grant date. No performance-based awards are considered to have vested and, as such, no expense was recorded in the six months ended July 30, 2011 or July 28, 2012. In the event of a public offering, all outstanding awards vest. As of July 28, 2012, the total unrecognized compensation expense related to non-vested performance-based units was $2.5 million.
NOTE 11—RELATED PARTY TRANSACTIONS
Management Agreement
Pursuant to the Amended and Restated Management Service Agreement with certain affiliates of Catterton, Tower Three and Glenhill, such affiliates are to provide services to the Company for general management, consulting services and other strategic planning functions. The Company recorded management fees of $1.9 million in selling, general and administrative expenses in each of the six months ended July 30, 2011, and July 28, 2012, and all such management fees were paid by the Company as of July 28, 2012.
Equity Interest in Parent
In connection with the Acquisition, each of Mr. Friedman, Mr. Krevlin, a member of the Company’s Board of Directors, and certain funds of Glenhill entered into separate stockholder voting agreements with the Company in connection with the First Amendment to Agreement and Plan of Merger. Mr. Krevlin has sole voting power and investment power with respect to shares beneficially owned by such funds of Glenhill. Pursuant to such stockholder voting agreements, Mr. Friedman, Mr. Krevlin and such funds agreed to vote for and support the Acquisition. In addition, immediately prior to the completion of the Acquisition, Mr. Friedman and Mr. Krevlin (through such funds of Glenhill) contributed approximately 1,000,000 and 3,632,533 shares, respectively, of the Company’s common stock to Parent in exchange for equity interests in Parent pursuant to rollover agreements between the Company, Parent and each of Mr. Friedman and such funds of Glenhill.
NOTE 12—COMMITMENTS AND CONTINGENCIES
Commitments
The Company has no off balance sheet commitments as of July 28, 2012.
In the event of a subsequent sale of the Company, illiquid sale of the Company or an initial public offering, the Company would be required to make payments to Catterton, Tower Three and Glenhill pursuant to the terms of their management services agreement. The amount of such payments will be negotiated with Parent’s Board of Directors at the time of such transaction.
In addition, certain former executives are entitled to cash payments up to $2.2 million in the event of a subsequent sale of the Company, illiquid sale of the Company or an initial public offering.
F-49
Table of Contents
Contingencies
The Company is involved from time to time in various legal claims, actions and complaints arising in connection with its business. The outcome of matters the Company is involved in cannot be determined at this time and the results cannot be predicted with certainty.
The Company reviews the need for any loss contingency reserves and establishes reserves when, in the opinion of management, it is probable that a matter would result in liability, and the amount of loss, if any, can be reasonably estimated. Generally, in view of the inherent difficulty of predicting the outcome of those matters, particularly in cases in which claimants seek substantial or indeterminate damages, it is not possible to determine whether a liability has been incurred or to reasonably estimate the ultimate or minimum amount of that liability until the case is close to resolution, in which case no reserve is established until that time.
NOTE 13 —SEGMENT REPORTING
The Company defines an operating segment on the same basis that it uses to evaluate performance internally by the Chief Operating Decision Maker (“CODM”). The Company has determined that the Co-Chief Executive Officers were its CODM and there was one operating segment. Therefore, the Company reports as a single segment. This includes all sales channels accessed by the Company’s customers, including sales through catalogs, sales through the Company’s website and sales through the Company’s stores.
The Company classifies its sales into furniture and non-furniture product lines. Furniture includes both indoor and outdoor furniture from the Company’s business lines. Non-furniture includes lighting, textiles, accessories and home décor. Net revenues in each category were as follows (in thousands):
| Six Months Ended | ||||||||
| July 30, 2011 |
July 28, 2012 |
|||||||
| Furniture |
$ | 223,050 | $ | 281,913 | ||||
| Non-furniture |
197,333 | 228,907 | ||||||
|
|
|
|
|
|||||
| Total net revenues |
$ | 420,383 | $ | 510,820 | ||||
|
|
|
|
|
|||||
The Company is domiciled in the United States and operates stores in the United States and Canada. Revenues from Canadian operations, and the long-lived assets in Canada, are not material to the Company. Geographic revenues are determined based upon where service is rendered.
No single customer accounted for more than 10% of the Company’s revenues in the six months ended July 30, 2011 or July 28, 2012.
NOTE 14—RETAIL STORE CLOSURES AND OFFICE RESTRUCTURING
Shanghai Office Restructuring
In April 2011, the Company restructured its Shanghai office location and terminated employees at that office, as well as terminated employees within the corporate headquarters in Corte Madera, CA. As a result, during the six months ended July 30, 2011, the Company incurred $1.6 million in restructuring related costs, including one-time employee termination benefits, contract termination fees, loss on disposal of capitalized property and equipment, and other associated costs, which are included in selling, general and administrative expenses on the condensed consolidated statements of operations. During the six months ended July 31, 2012, the Company did not incur any restructuring related costs. At July 28, 2012, the Company did not have any remaining future liabilities related to this office restructuring. The Company does not expect to incur additional costs associated with this office restructuring in future periods.
F-50
Table of Contents
Retail Store Closures
In June and July 2011, the Company closed four retail store locations prior to their respective lease termination dates. As a result, during the six months ended July 30, 2011, the Company incurred $3.6 million in exit related costs, including contract termination fees, one-time employee termination benefits and other associated costs. During fiscal 2011, the Company had broker commission related costs of $0.5 million relating to a store closure for one retail store. During the six months ended July 28, 2012, the Company recorded income of $0.4 million related to a change in estimate of liabilities related to closed stores. At July 28, 2012, the Company had remaining future liabilities existing under the lease agreements of $0.5 million. The Company does not expect to incur additional costs associated with these retail store closures in future periods.
NOTE 15—SUBSEQUENT EVENTS
Management has evaluated all events and transactions that occurred after July 28, 2012, through September 19, 2012, which is the date the financial statements are available to be issued. No material subsequent events have occurred since July 28, 2012, that require recognition or disclosure in these condensed consolidated financial statements, except the following:
Reorganization
Restoration Hardware Holdings, Inc. was formed on August 18, 2011, as a holding company for the purposes of facilitating an initial public offering of its common stock. It is expected that following the Reorganization, as defined in Note 8—Pro Forma Equity and Net Loss Per Share, the Company will become a direct, wholly owned subsidiary of Restoration Hardware Holdings, Inc. prior to the completion of the initial public offering.
F-51
Table of Contents
Through and including , 2012 (the 25th day after the date of this prospectus), all dealers effecting transactions in these securities, whether or not participating in this offering, may be required to deliver a prospectus. This is in addition to a dealer’s obligation to deliver a prospectus when acting as an underwriter and with respect to an unsold allotment or subscription.
Shares
Common Stock
PROSPECTUS
BofA Merrill Lynch
Goldman, Sachs & Co.
Baird
William Blair
Piper Jaffray
Stifel Nicolaus Weisel
, 2012
Table of Contents
PART II
INFORMATION NOT REQUIRED IN PROSPECTUS
| Item 13. | Other Expenses of Issuance and Distribution |
The following table sets forth the costs and expenses, other than the underwriting discount, payable in connection with the sale and distribution of the securities being registered. All amounts are estimated except the SEC registration fee and the FINRA filing fee. Except as otherwise noted, all the expenses below will be paid by us.
| Amount to be paid |
||||
| SEC Registration Fee |
$ | 17,415 | ||
| FINRA Filing Fee |
15,500 | |||
| Listing Fee |
* | |||
| Legal Fees and Expenses |
* | |||
| Accounting Fees and Expenses |
* | |||
| Printing and Engraving Expenses |
* | |||
| Blue Sky Fees and Expenses |
* | |||
| Transfer Agent and Registrar Fees |
* | |||
| Director and Officer Insurance |
* | |||
| Miscellaneous Expenses |
* | |||
|
|
|
|||
| Total |
$ | * | ||
| * | To be filed by amendment. |
| Item 14. | Indemnification of Directors and Officers |
Section 145 of the Delaware General Corporation Law (the “DGCL”) permits a corporation to include in its charter documents, and in agreements between the corporation and its directors and officers, provisions expanding the scope of indemnification beyond that specifically provided by the current law.
Our certificate of incorporation will provide that our directors will not be liable for monetary damages for breach of fiduciary duty.
Our bylaws provide that we will indemnify our directors and officers to the fullest extent permitted by the DGCL. Our bylaws provide for the indemnification of officers and directors acting on our behalf if this person acted in good faith and in a manner reasonably believed to be in and not opposed to our best interest, and, with respect to any criminal action or proceeding, the indemnified party had no reason to believe his or her conduct was unlawful.
We intend to enter into indemnification agreements with each of our executive officers and directors, in addition to indemnification provided for in our charter documents, and we intend to enter into indemnification agreements with any new directors and executive officers in the future. The indemnification agreements will provide the executive officers and directors with contractual rights to indemnification, expense advancement and reimbursement, to the fullest extent permitted under the DGCL.
The underwriting agreement (Exhibit 1.1 hereto) provides for indemnification by the underwriters of us, and indemnification of the underwriters by us for certain liabilities, including liabilities arising under the Securities Act of 1933, as amended, in connection with matters specifically provided in writing by the underwriters for inclusion in the registration statement.
II-1
Table of Contents
We will purchase and intend to maintain insurance on behalf of us and any person who is or was a director or officer against any loss arising from any claim asserted against him or her and incurred by him or her in that capacity, subject to certain exclusions and limits of the amount of coverage.
| Item 15. | Recent Sales of Unregistered Securities |
Set forth below is information regarding securities sold by Home Holdings, LLC (“Home Holdings”) within the past three fiscal years that were not registered under the Securities Act of 1933, as amended (the “Securities Act”). Also included is information relating to the section of the Securities Act, or rule of the SEC, under which exemption from registration was claimed.
| (1) | In connection with the agreement and plan of merger described in the prospectus that is a part of this registration statement, Gary Friedman, certain funds affiliated with Glenhill and certain funds affiliated with Palo Alto Investors, LLC entered into rollover agreements with Home Holdings pursuant to which they agreed to contribute, immediately prior to the effective time of the merger, a portion of his or its shares of Restoration Hardware, Inc.’s common stock in exchange for a pro rata equity interest in Home Holdings. |
| (2) | In December 2008, May 2010 and June 2010, as described in the prospectus that is a part of this registration statement, two of our officers entered into subscription agreements with Home Holdings whereby they purchased 215,269 Class A units, 2,006,952 Class A-1 units and 2,006,952 Class A-2 units at an aggregate purchase price of approximately $10 million. |
| (3) | In May 2009, Gary Friedman was granted 7,183,441 Class B-1 units under the Home Holdings 2008 Team Resto Ownership Plan (the “Team Resto Ownership Plan”), and in June 2010, Carlos Alberini, our Chief Executive Officer and a director, was granted 4,225,554 Class B-1 units and one Class B-2 unit under the Team Resto Ownership Plan. In addition to these grants to Mr. Friedman and Mr. Alberini, from May 2009 through April 18, 2012, 146 of our current and former employees, consultants, directors and members of our board were granted 16,125,476 Class B units under the Team Resto Ownership Plan. |
| (4) | In September 2011, as described in the prospectus that is a part of this Registration Statement, 1,215,269 Class A Units of Home Holdings held by Gary Friedman were reclassified into 1,215,269 Class A Prime units of Home Holdings, 1,118,064 Class A-1 units of Home Holdings held by Mr. Friedman were reclassified into 1,118,064 Class A-1 Prime units of Home Holdings and 1,810,000 Class B units held by Ken Dunaj, our Chief Operating Officer, were reclassified into 1,810,000 Class B Prime units of Home Holdings, in each case in connection with the repayment of loans owed to Home Holdings by Mr. Friedman or Mr. Dunaj, as applicable. |
There were no underwriters employed in connection with any of the transactions set forth in Item 15. These transactions were made in reliance upon Section 4(2) of the Securities Act (or Rule 501 of Regulation D promulgated thereunder), or Rule 701 promulgated under Section 3(b) of the Securities Act, as transactions by an issuer not involving a public offering or pursuant to a compensatory benefit plan approved by the issuer’s board of directors. Each recipient of the securities in these transactions represented his, her or its intention to acquire the securities for investment only and not with a view to, or for resale in connection with, any distribution thereof. In each case, the recipient received adequate information about the issuer or had adequate access, through his, her or its relationship with Home Holdings, to information about Home Holdings. The sales of these securities were made without any general solicitation or advertising.
| Item 16. | Exhibits and Financial Statement Schedules |
(a) Exhibits
The exhibit index attached hereto is incorporated herein by reference.
II-2
Table of Contents
(b) Financial Statement Schedules
Financial statement schedules have been omitted because the information required to be set forth therein is not applicable or is shown in the financial statements or notes thereto.
| Item 17. | Undertakings |
The undersigned registrant hereby undertakes to provide to the underwriter at the closing specified in the underwriting agreements, certificates in such denominations and registered in such names as required by the underwriters to permit prompt delivery to each purchaser.
Insofar as indemnification for liabilities arising under the Securities Act may be permitted as to directors, officers and controlling persons of the registrant pursuant to the provisions described in Item 14, or otherwise, we have been advised that in the opinion of the SEC such indemnification is against public policy as expressed in the Securities Act and is therefore unenforceable. In the event that a claim for indemnification against such liabilities (other than the payment by the registrant of expenses incurred or paid by a director, officer or controlling person of the registrant in the successful defense of any action, suit or proceeding) is asserted by such director, officer or controlling person in connection with the securities being registered, we will, unless in the opinion of our counsel the matter has been settled by controlling precedent, submit to a court of appropriate jurisdiction the question whether such indemnification by us is against public policy as expressed in the Securities Act and will be governed by the final adjudication of such issue.
The undersigned registrant hereby undertakes that:
| (1) | For purposes of determining any liability under the Securities Act, the information omitted from the form of prospectus as filed as part of this Registration Statement in reliance upon Rule 430A and contained in a form of prospectus filed by the registrant pursuant to Rule 424(b)(1) or (4) or 497(h) under the Securities Act shall be deemed to be part of this Registration Statement as of the time it was declared effective. |
| (2) | For the purpose of determining any liability under the Securities Act, each post-effective amendment that contains a form of prospectus shall be deemed to be a new Registration Statement relating to the securities offered therein, and the offering of such securities at that time shall be deemed to be the initial bona fide offering thereof. |
That, for the purpose of determining liability of the registrant under the Securities Act of 1933 to any purchaser in the initial distribution of the securities: the undersigned registrant undertakes that in a primary offering of securities of the undersigned registrant pursuant to this registration statement, regardless of the underwriting method used to sell the securities to the purchaser, if the securities are offered or sold to such purchaser by means of any of the following communications, the undersigned registrant will be a seller to the purchaser and will be considered to offer or sell such securities to such purchaser:
| (i) | Any preliminary prospectus or prospectus of the undersigned registrant relating to the offering required to be filed pursuant to Rule 424; |
| (ii) | Any free writing prospectus relating to the offering prepared by or on behalf of the undersigned registrant or used or referred to by the undersigned registrant; |
| (iii) | The portion of any other free writing prospectus relating to the offering containing material information about the undersigned registrant or its securities provided by or on behalf of the undersigned registrant; and |
| (iv) | Any other communication that is an offer in the offering made by the undersigned registrant to the purchaser. |
II-3
Table of Contents
The undersigned registrant hereby further undertakes that:
If the registrant is subject to Rule 430C, each prospectus filed pursuant to Rule 424(b) as part of a registration statement relating to an offering, other than registration statements relying on Rule 430B or other than prospectuses filed in reliance on Rule 430A, shall be deemed to be part of and included in the registration statement as of the date it is first used after effectiveness. Provided, however, that no statement made in a registration statement or prospectus that is part of the registration statement or made in a document incorporated or deemed incorporated by reference into the registration statement or prospectus that is part of the registration statement will, as to a purchaser with a time of contract of sale prior to such first use, supersede or modify any statement that was made in the registration statement or prospectus that was part of the registration statement or made in any such document immediately prior to such date of first use.
II-4
Table of Contents
Signatures
Pursuant to the requirements of the Securities Act of 1933, we have duly caused this Registration Statement on Form S-1 to be signed on its behalf by the undersigned, thereunto duly authorized, in the Town of Corte Madera, State of California, on the 19th day of September, 2012.
| RESTORATION HARDWARE HOLDINGS, INC. | ||
| By: | /s/ Carlos Alberini | |
| Carlos Alberini Chief Executive Officer | ||
Pursuant to the requirements of the Securities Act of 1933, as amended, this Registration Statement on Form S-1 has been signed by the following persons in the capacities and on the dates indicated.
| Signature |
Title |
Date | ||
| /s/ Carlos Alberini Carlos Alberini |
Chief Executive Officer; Director (Principal Executive Officer) |
September 19, 2012 | ||
| /s/ Karen Boone Karen Boone |
Chief Financial Officer (Principal Financial Officer; Principal Accounting Officer) |
September 19, 2012 | ||
| * Gary Friedman |
Chief Executive Officer** Director (Principal Executive Officer) |
September 19, 2012 | ||
| * J. Michael Chu |
Director |
September 19, 2012 | ||
| * Scott Dahnke |
Director |
September 19, 2012 | ||
| * Mark Demilio |
Director |
September 19, 2012 | ||
| * William Forrest |
Director |
September 19, 2012 | ||
| * Glenn Krevlin |
Director |
September 19, 2012 | ||
| * Marc Magliacano |
Director |
September 19, 2012 | ||
| * Frederick Wilson |
Director |
September 19, 2012 | ||
| *By: | /s/ Carlos Alberini | |
| Carlos Alberini Attorney-in-Fact |
| ** | Prior to the effective date of this registration statement, Mr. Friedman will have resigned from his employment with the Company and his positions as Co-Chief Executive Officer and director. |
II-5
Table of Contents
EXHIBIT INDEX
| Exhibit |
Description of Exhibit | |
| 1.1 | Form of Underwriting Agreement. | |
| 3.1* | Form of Certificate of Incorporation of Restoration Hardware Holdings, Inc., to be in effect upon completion of this offering. | |
| 3.2* | Form of Bylaws of Restoration Hardware Holdings, Inc., to be in effect upon completion of this offering. | |
| 4.1* | Form of Restoration Hardware Holdings, Inc.’s Common Stock Certificate. | |
| 5.1* | Opinion of Morrison & Foerster LLP. | |
| 10.1*† | Amended and Restated Compensation and Severance Agreement, effective as of February 1, 2010, by and between Restoration Hardware, Inc. and Gary Friedman. | |
| 10.2*† | Employment Agreement, entered into as of May 12, 2010, by and between Restoration Hardware, Inc. and Carlos Alberini. | |
| 10.3*† | Amended and Restated Offer Letter, between Restoration Hardware, Inc. and Ken Dunaj. | |
| 10.4*† | Form of Indemnification Agreement to be entered into by and between Restoration Hardware Holdings, Inc. and each of its directors. | |
| 10.5‡ | First Amendment to Ninth Amended and Restated Credit Agreement dated as of January 6, 2012, by and among Restoration Hardware, Inc., as lead borrower, Restoration Hardware Canada, Inc., as Canadian borrower, the other borrowers party thereto, the guarantors party thereto, the lenders party thereto and Bank of America, N.A., as administrative agent and collateral agent. | |
| 10.6‡ | Ninth Amended and Restated Credit Agreement dated as of August 3, 2011, by and among Restoration Hardware, Inc., as lead borrower, Restoration Hardware Canada, Inc., as Canadian borrower, the other borrowers party thereto, the guarantors party thereto, the lenders from time to time party thereto and Bank of America, N.A., as administrative agent and collateral agent. | |
| 10.7*† | Management Incentive Plan. | |
| 10.8*† | 2012 Stock Incentive Plan and related documents. | |
| 10.9*† | 2012 Equity Replacement Plan. | |
| 10.10†‡ | Transition Agreement, entered into December 21, 2011, between Restoration Hardware, Inc. and James Stewart. | |
| 10.11* | Form of Stockholders Agreement to be entered into effective upon completion of this offering among Restoration Hardware Holdings, Inc., Home Holdings, LLC, Gary Friedman and Carlos Alberini. | |
| 10.12* | Form of Registration Rights to be entered into effective upon completion of this offering among Restoration Hardware Holdings, Inc., Home Holdings, LLC, CP Home Holdings, LLC, Tower Three Home, LLC, Gary Friedman and Carlos Alberini. | |
| 10.13* | Advisory Services Agreement entered into , 2012, between Restoration Hardware, Inc. and Gary Friedman. | |
| 21.1‡ | Subsidiary List. | |
| 23.1* | Consent of Counsel (included in exhibit 5.1). | |
| 23.2 | Consent of PricewaterhouseCoopers LLP. | |
| 23.3 | Consent of PricewaterhouseCoopers LLP. | |
| 24.1‡ | Powers of Attorney (included on signature page). | |
| * | To be filed by amendment. |
| † | Indicates a management contract or compensatory plan or arrangement. |
| ‡ | Previously filed. |