Attached files
| file | filename |
|---|---|
| 8-K - FORM 8-K - MOSAIC CO | d412749d8k.htm |
Exhibit 99.1


Market Mosaic is a newsletter published for our customers, suppliers and stakeholders by the Market and Strategic Analysis group of The Mosaic Company. This issue recaps our assessment of the near term outlook for agricultural and crop nutrient markets.
Michael R. Rahm
Vice President Market and Strategic Analysis
Luis F. Dowling
Sr. Market Analyst
Josh Paula
Sr. Market Analyst
Mathew Philippi
Market Analyst
“You don’t need a weatherman to know which way the wind blows”
Bob Dylan
Subterranean Homesick Blues
Ok, we know the Dylan lyric doesn’t refer to the National Weather Service. Nevertheless, an accurate weather forecast would have helped to plan for the extreme weather events this summer. Now, a clairvoyant analyst is needed to assess the impacts on agricultural commodity and crop nutrient markets.
What a summer it was. The North American growing season got off to a great start. Ideal planting conditions and high initial crop condition scores raised expectations for a record-shattering harvest and a sizeable build of grain and oilseed inventories. Some consultants had advised clients to plan for sub-$4.00 corn as well as declines in crop nutrient prices during the second half of 2012.
Mother Nature had different ideas. The most severe drought in more than 50 years scorched a wide swath of the U.S. Heartland. Hot and dry conditions around the Black Sea also shriveled crops in Russia, Kazakhstan and Ukraine. The monsoon delivered late and below average rainfall to key agricultural regions in India and excess rainfall harmed some crops in parts of Brazil and China.
The prospect of a much-smaller-than-expected global harvest ignited powerful rallies in key agricultural commodity markets. In fact, front month futures prices for several crops vaulted to record highs that exceeded the peaks of 2008 or 2011 by wide margins. The spikes in grain and oilseed prices rekindled fears of another food crisis, renewed calls for waivers of biofuel mandates, stirred speculation of export embargos and raised questions about whether crop nutrient prices would soon follow.
This issue of Market Mosaic examines how the extreme events of this summer may play out in agricultural commodity and crop nutrient markets during the 2012/13 crop nutrient year. We draw three main conclusions from this analysis.
First, despite current harvest pressures, it looks to us like there is the potential for more economic and political fireworks in agricultural commodity markets due to the likelihood that this year’s much-smaller-than-expected global harvest may get even smaller by the time final estimates are in the books. Second, recent developments in agricultural commodity markets look like a big net positive for phosphate (P) and potash (K) demand in 2012/13. Finally, despite the prospect of record demand and stronger fundamentals, a repeat of 2008-like spikes in P&K prices looks unlikely at this point.
– continued inside
| U.S. Corn Supply/Demand Balance Sheet | ||||||||||||||||||||||||||||||||||||
| 2012/13F | ||||||||||||||||||||||||||||||||||||
| (mil bu) |
07/08 | 08/09 | 09/10 | 10/11 | 11/12 E | May | Sept. | SCGS1 | 13/14F | |||||||||||||||||||||||||||
| Acreage |
||||||||||||||||||||||||||||||||||||
| Planted (mil acres) |
93.5 | 86.0 | 86.4 | 88.2 | 91.9 | 95.9 | 96.4 | 96.4 | 95.0 | |||||||||||||||||||||||||||
| Harvested (mil acres) |
86.5 | 78.6 | 79.5 | 81.4 | 84.0 | 89.1 | 87.4 | 82.9 | 86.9 | |||||||||||||||||||||||||||
| Yield (bu/acre) |
150.7 | 153.9 | 164.7 | 152.8 | 147.2 | 166.0 | 122.8 | 120.0 | 163.5 | |||||||||||||||||||||||||||
| Supply |
||||||||||||||||||||||||||||||||||||
| Beginning Stocks |
1,304 | 1,624 | 1,673 | 1,708 | 1,128 | 851 | 1,181 | 1,021 | 400 | |||||||||||||||||||||||||||
| Production |
13,038 | 12,092 | 13,092 | 12,447 | 12,358 | 14,790 | 10,727 | 9,948 | 14,212 | |||||||||||||||||||||||||||
| Imports |
20 | 14 | 8 | 28 | 25 | 15 | 75 | 75 | 30 | |||||||||||||||||||||||||||
| Total |
14,361 | 13,729 | 14,773 | 14,182 | 13,511 | 15,656 | 11,983 | 11,045 | 14,642 | |||||||||||||||||||||||||||
| Use |
||||||||||||||||||||||||||||||||||||
| Feed & Residual |
5,858 | 5,182 | 5,125 | 4,793 | 4,550 | 5,450 | 4,150 | 3,324 | 4,900 | |||||||||||||||||||||||||||
| FIS |
4,442 | 5,025 | 5,961 | 6,428 | 6,390 | 6,425 | 5,850 | 6,120 | 6,520 | |||||||||||||||||||||||||||
| Ethanol for Fuel |
3,026 | 3,709 | 4,591 | 5,021 | 5,000 | 5,000 | 4,500 | 4,800 | 5,100 | |||||||||||||||||||||||||||
| Exports |
2,437 | 1,849 | 1,980 | 1,834 | 1,550 | 1,900 | 1,250 | 1,200 | 1,700 | |||||||||||||||||||||||||||
| Total |
12,737 | 12,056 | 13,066 | 13,055 | 12,490 | 13,775 | 11,250 | 10,645 | 13,120 | |||||||||||||||||||||||||||
| Ending Stocks |
1,624 | 1,673 | 1,708 | 1,128 | 1,021 | 1,881 | 733 | 400 | 1,522 | |||||||||||||||||||||||||||
| Stocks as % of Use |
12.8 | % | 13.9 | % | 13.1 | % | 8.6 | % | 8.2 | % | 13.7 | % | 6.5 | % | 3.8 | % | 11.6 | % | ||||||||||||||||||
| Average Farm Price |
||||||||||||||||||||||||||||||||||||
| Low |
$ | 5.18 | $ | 5.95 | $ | 4.20 | $ | 7.50 | ||||||||||||||||||||||||||||
| High |
$ | 5.18 | $ | 6.25 | $ | 5.00 | $ | 8.90 | ||||||||||||||||||||||||||||
| 1 | SCGS - Small Crops Get Smaller / Strong Ethanol Demand |
Source: USDA and Mosaic
The Potential for More Fireworks
Grain and oilseed prices will need to move to levels that destroy staggering amounts of demand during the 2012/13 crop year. The levels of these market clearing prices will hinge on four key factors in our view: 1) final estimates of this year’s U.S. and Russian harvests, 2) oil and gasoline prices, 3) livestock prices and 4) the size of the 2012/13 Southern Hemisphere crop. Several plausible scenarios could play out depending on how these drivers unfold during the next few months. We handicap what looks like the most likely scenario for the corn market – one that indicates the potential for more fireworks.
Small Crops Get Smaller
This old adage is expected to apply to this year’s drought ravaged crops. Estimates of the Russian harvest continue to shrink. Recent U.S. crop tour surveys have inferred lower corn and soybean yields than current USDA estimates and early reports from combine cabs indicate lower than expected readings on many yield monitors. Most analysts also expect much higher corn acreage abandonment than current USDA estimates.
The U.S. corn supply and demand balance sheet provides a sobering example of the magnitude of demand destruction required in 2012/13. The table shows USDA estimates from its May and September World Agricultural Supply and Demand Estimates (WASDE) reports as well as a “small crops get smaller/strong ethanol demand” scenario for 2012/13.
If the average U.S. corn yield roughly equals recent crop tour estimates and if abandonment rates drop to levels in line with those of other severe drought years, the U.S. corn harvest could slip to less than 10 billion bushels or more than 700 million bushels less than the USDA estimate released on September 12. The market no doubt is trading a sub-10.7 billion bushel crop but not a sub-10.0 billion bushel crop.
USDA released its first estimate of 2012/13 corn use in May. The agency projected record use of 13.78 billion bushels based on an expected monster crop of 14.79 billion bushels and a projected drop in the average farm price from $5.95 to $6.25 per bushel in 2011/12 to $4.20 to $5.00 per bushel in 2012/13.
The much smaller corn crop forced the USDA to make deep cuts in demand and ending inventories. The agency slashed use to 11.25 billion bushels in its September WASDE report, a drop of 2.52 billion from its initial May estimate and a decline of 1.62 billion from the three-year average of 12.87 billion. Cuts were made in all major demand categories although the rationale for the reductions was not transparent. The USDA boosted its estimate of the average farm price to $7.20-$8.60 per bushel in order to destroy this much demand.
Ethanol is High Bidder at Current Gasoline Prices
Ethanol producers are expected to remain the high bidders for available corn supplies due to high gasoline, ethanol and dried distillers grain with solubles (DDGS) prices. Ethanol and DDGS traded at more than $2.40 per gallon and more than $290 per ton, respectively, during the second week of September. Based on our model of a typical Corn Belt plant, we estimate that ethanol producers could bid up to about $7.80 per bushel for corn before shutting down at current ethanol and DDGS prices. If the price of ethanol increased to the current wholesale price of gasoline or about $3.00 per gallon, we estimate that ethanol producers could pay almost $10.00 per bushel before shutting down. Economics vary from plant to plant and a few facilities have closed, but the vast majority of ethanol plants operate because the price of ethanol still exceeds variable costs.


Model Midwest Ethanol Plant
Estimated Net Return Over Variable Cost ($/gal)
| Corn Market Price ($/bu) | ||||||||||||||||||||||||||||||||||||||||||||||||
| $ | 6.00 | $ | 6.50 | $ | 7.00 | $ | 7.50 | $ | 8.00 | $ | 8.50 | $ | 9.00 | $ | 9.50 | $ | 10.00 | $ | 10.50 | $ | 11.00 | |||||||||||||||||||||||||||
| $ | 2.0 | 0.05 | -0.09 | -0.22 | -0.35 | -0.48 | -0.62 | -0.75 | -0.88 | -1.01 | -1.14 | -1.28 | ||||||||||||||||||||||||||||||||||||
| $ | 2.1 | 0.15 | 0.01 | -0.12 | -0.25 | -0.38 | -0.52 | -0.65 | -0.78 | -0.91 | -1.04 | -1.18 | ||||||||||||||||||||||||||||||||||||
| $ | 2.2 | 0.25 | 0.11 | -0.02 | -0.15 | -0.28 | -0.42 | -0.55 | -0.68 | -0.81 | -0.94 | -1.08 | ||||||||||||||||||||||||||||||||||||
| $ | 2.3 | 0.35 | 0.21 | 0.08 | -0.05 | -0.18 | -0.32 | -0.45 | -0.58 | -0.71 | -0.84 | -0.98 | ||||||||||||||||||||||||||||||||||||
| $ | 2.4 | 0.45 | 0.31 | 0.18 | 0.05 | -0.08 | -0.22 | -0.35 | -0.48 | -0.61 | -0.74 | -0.88 | ||||||||||||||||||||||||||||||||||||
| $ | 2.5 | 0.55 | 0.41 | 0.28 | 0.15 | 0.02 | -0.12 | -0.25 | -0.38 | -0.51 | -0.64 | -0.78 | ||||||||||||||||||||||||||||||||||||
| $ | 2.6 | 0.65 | 0.51 | 0.38 | 0.25 | 0.12 | -0.02 | -0.15 | -0.28 | -0.41 | -0.54 | -0.68 | ||||||||||||||||||||||||||||||||||||
| Ethanol Price($/gal) |
$ | 2.7 | 0.75 | 0.61 | 0.48 | 0.35 | 0.22 | 0.08 | -0.05 | -0.18 | -0.31 | -0.44 | -0.58 | |||||||||||||||||||||||||||||||||||
| $ | 2.8 | 0.85 | 0.71 | 0.58 | 0.45 | 0.32 | 0.18 | 0.05 | -0.08 | -0.21 | -0.34 | -0.48 | ||||||||||||||||||||||||||||||||||||
| $ | 2.9 | 0.95 | 0.81 | 0.68 | 0.55 | 0.42 | 0.28 | 0.15 | 0.02 | -0.11 | -0.24 | -0.38 | ||||||||||||||||||||||||||||||||||||
| $ | 3.0 | 1.05 | 0.91 | 0.78 | 0.65 | 0.52 | 0.38 | 0.25 | 0.12 | -0.01 | -0.14 | -0.28 | ||||||||||||||||||||||||||||||||||||
| $ | 3.1 | 1.15 | 1.01 | 0.88 | 0.75 | 0.62 | 0.48 | 0.35 | 0.22 | 0.09 | -0.04 | -0.18 | ||||||||||||||||||||||||||||||||||||
| $ | 3.2 | 1.25 | 1.11 | 0.98 | 0.85 | 0.72 | 0.58 | 0.45 | 0.32 | 0.19 | 0.06 | -0.08 | ||||||||||||||||||||||||||||||||||||
| $ | 3.3 | 1.35 | 1.21 | 1.08 | 0.95 | 0.82 | 0.68 | 0.55 | 0.42 | 0.29 | 0.16 | 0.02 | ||||||||||||||||||||||||||||||||||||
| $ | 3.4 | 1.45 | 1.31 | 1.18 | 1.05 | 0.92 | 0.78 | 0.65 | 0.52 | 0.39 | 0.26 | 0.12 | ||||||||||||||||||||||||||||||||||||
| $ | 3.5 | 1.55 | 1.41 | 1.28 | 1.15 | 1.02 | 0.88 | 0.75 | 0.62 | 0.49 | 0.36 | 0.22 | ||||||||||||||||||||||||||||||||||||
Source: Mosaic
Ethanol significantly enhances margins for refiners and distributors who today blend 10% ethanol (~ 115 octane) with a gasoline blendstock (~ 84 octane) to make the widely used E10 blend (~ 87 octane). U.S. oil refineries have calibrated operations to produce a gasoline blendstock – known as Reformulated Gasoline Blendstock for Oxygenate Blending (RBOB) — that is ideal and highly profitable for blending with lower cost ethanol to meet the renewable fuel standard (RFS) or blending mandate.
If the U.S. corn crop turns out smaller than current estimates and higher corn prices threaten to shut down ethanol plants, refiners and blenders should be willing to bid up the price of ethanol to at least the RBOB price. In fact, refiners and blenders likely would continue to blend ethanol even if its price exceeded the RBOB price for several reasons such as the need to recalibrate refining operations as well as the lack of suitable low cost additives to boost the octane and oxygen content of the standard gasoline blendstock.
Livestock Producers Liquidate Herds and Seek Relief
Assuming no collapse of oil and RBOB prices, livestock producers are expected to bear the brunt of demand destruction due to unprofitable feeding economics today. Doane Advisory Services recently estimated that hog producers were losing about $55 per head and cattle producers were losing about $140 per head based on current livestock and feed prices.
Livestock producers understandably are seeking relief from the surge in grain and oilseed prices. At last count, the governors of five states have requested EPA Administrator Lisa Jackson to grant a complete or partial waiver of the RFS due to the severe economic harm it is causing livestock producers in their states.
However, a waiver of the RFS is unlikely to provide any meaningful relief from high corn prices as long as RBOB continues to trade in the $3.00 per gallon range. The economics of grinding corn into ethanol and DDGS and blending ethanol with RBOB work at current prices — without the blending tax credit that expired at the end of 2011 and likely without the RFS. Recent analyses by Iowa State University and Purdue University concluded that a complete waiver of the RFS would result in only modest corn price reductions of 7% and 6%, respectively — much less than expected by livestock producers, food processors and editorial page writers.
Livestock producers are liquidating herds today. These actions exacerbate red ink right now but eventually are expected to result much higher livestock prices down the road. In fact, the Doane feeding model shows that hog producers turn profitable at $5 to $10 per head by next spring based on current futures prices for live hogs, corn and soybean meal. The key question is will livestock prices rebound quickly enough and high enough to enable feed buyers to bid against ethanol producers for available corn supplies. The outcome of that auction also will depend on the level of oil and gasoline prices as well as the size of Southern Hemisphere crops.
Price Implications
A stochastic simulation by the Center for Agricultural and Rural Development (CARD) at Iowa State University for a scenario that forced meeting the RFS of 13.2 billion gallons in 2012 and 13.8 billion in 2013 concluded that the expected corn price would need to increase to $9.73 per bushel in 2012/13 in order to allocate remaining supplies to the highest valued feed and export uses. As long as oil and gasoline prices stay at current high levels, this looks to us not like a forced scenario but the most likely scenario based on the above analysis.
Under this scenario, U.S. plants would grind 4.8 billion bushels of corn into 13.3 billion gallons of ethanol. The blend wall is approximately 13.3 billion gallons so refiners and blenders likely would utilize a tiny portion of their renewable identification number (RIN) credits to meet the remaining RFS requirements. If the U.S. corn harvest is 700 million bushels less than the current estimate, if U.S. exports drop to 1.2 billion bushels and if U.S. inventories decline to bare minimums, the table indicates that consequences for feed use are severe. This table also shows why we estimate that the corn market will need to bid for about 95 million acres of U.S. corn next spring.
Banking on a Large Southern Hemisphere Crop
The run-up in agricultural commodity prices has raised expectations for a record-shattering Southern Hemisphere crop this year. For example, South American soybean farmers made plans for the upcoming planting season based on a March 2013 futures contract price of $16.94 per bushel on September 12. This new crop price was up 36% or $4.50 per bushel since June 1!
As a consequence, we project that Brazilian soybean area will expand 8% to 16% or from 25.0 million hectares in 2011/12 to 27.0 to 29.0 million in 2012/13. And, despite several economic and political uncertainties, even Argentine soybean area is forecast to increase almost 15% or from 17.5 million hectares last year to more than 20.0 million this year.
Agricultural commodity traders will laser focus on weather developments in South America during the next several months.


Markets are banking on and trading a large South American crop and any sniff of a weather problem will further agitate already nervous markets.
Record 2013 P&K Demand Prospects
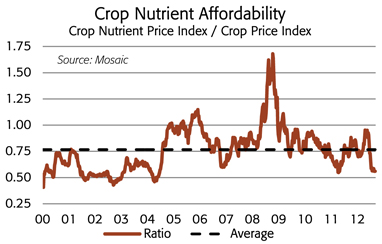
Our homemade affordability index shows that crop nutrients are the best buy since 2004 and the current reading underpins and increases the confidence level of our forecasts for record global P&K shipments in 2013. Demand prospects in key Southern Hemisphere countries look especially strong for the planting season that will get into full swing in September as well as for second crop seeding a few months down the road. The need to rebuild extremely low projected U.S. grain and oilseed stocks is expected to set off an intense “battle for dirt” in North America next spring.
Based on analog years and improved circumstances today, we estimate that this year’s drought will have at worst only a modest negative impact on U.S. P&K use in 2012/13, especially if parched regions receive adequate moisture this fall and winter. We examined changes in average P&K application rates on corn as well as changes in total P&K use in years following the last three major U.S. droughts in 1983, 1988 and 1993.
According to USDA statistics, average P&K application rates on corn increased modestly in 1984 and 1994 but declined 10% and 8%, respectively, in 1989. Total U.S. P&K use, however, increased significantly in 1984 and 1994 due to an increase in planted acreage (a large payment-in-kind program idled more than 40 million acres in 1983). U.S. phosphate use was flat and potash use was off just 2.8% in 1989.
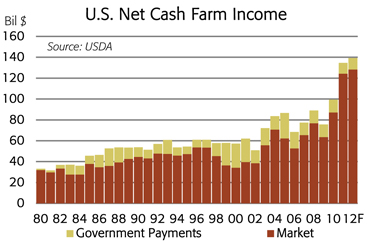
Circumstances today are much improved from back then. U.S. net cash farm income is at record-smashing levels now while farmers were struggling to recover from the farm crisis of the 1980s during previous droughts. In fact, estimates released by the USDA in August showed that U.S. net cash farm income totaled a record $134.7 billion in 2011, up 35% or $35.0 billion from 2010. Despite the severe drought this year, net cash farm income is projected to increase another 3% or $4.6 billion to $139.3 billion in 2012 due to higher commodity prices as well as comprehensive crop insurance programs.
North American phosphate use is forecast to decrease 3.0% to 5.3 million tons P2O5 in 2012/13 due to a modest drought-related decline in application rates as well as minor changes in the acreage mix. Our U.S. nutrient use forecasts assume that farmers will plant 95.0 million acres of corn and 77.5 million acres of soybeans when the dust settles next spring.
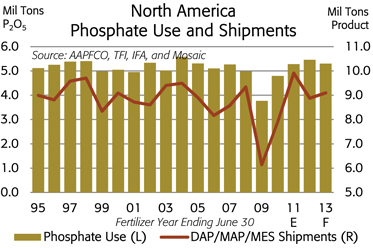
Shipments of the leading finished phosphate products, however, are forecast to climb 2.5% to 9.1 million tons in 2012/13 due to the de-stocking of channel inventories in 2011/12. North American shipments dropped 10.4% or 1.0 million tons to just 8.9 million tons in 2011/12 from the modern era record of 9.9 million tons in 2010/11.
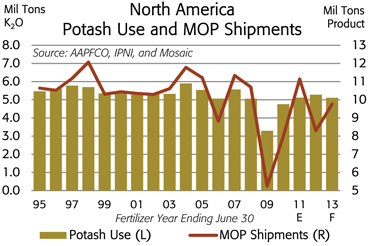
In the case of potash, North American use is projected to decrease 3.2% to 5.1 million tons K2O in 2012/13 for the same reasons. However, muriate of potash (MOP) shipments are forecast to rebound 17.6% or 1.5 million tons KCl to 9.8 million in 2012/13 due to the large de-stocking of channel inventories in 2011/12. North American shipments plunged 25.6% or 2.8 million tons to just 8.3 million tons in 2011/12 following shipments of 11.1 million tons in 2010/11. Distributors positioned extremely large volumes of MOP during the last half of May and June in 2011 for sales made during the 2011/12 crop nutrient year. That did not happen this year.
Demand prospects outside drought impacted regions look outstanding due to high commodity prices and profitable farm economics. The following tables show our current forecasts of global P&K shipments by region or country for 2012 and 2013 as well as the forecasts that we presented at Mosaic’s analyst day last February.
Processed Phosphate Shipment Forecasts
| 2010 | 2011 | 2012 | 2013 | |||||||||||||||||||||||||||||||||||||
| DAP/MAP/MES/TSP Mil Tonnes |
Actual | Actual | Feb. Forecast | Aug. Forecast | Feb. Forecast | Aug. Forecast | ||||||||||||||||||||||||||||||||||
| Low | High | Low | High | Low | High | Low | High | |||||||||||||||||||||||||||||||||
| Asia and Oceania |
33.8 | 34.0 | 35.7 | 37.2 | 36.6 | 37.1 | 37.4 | 38.7 | 37.3 | 38.5 | ||||||||||||||||||||||||||||||
| China |
16.0 | 17.5 | 17.8 | 18.3 | 18.0 | 18.1 | 18.5 | 18.8 | 18.6 | 18.8 | ||||||||||||||||||||||||||||||
| India |
11.0 | 9.8 | 10.5 | 11.0 | 11.4 | 11.5 | 11.0 | 11.5 | 11.0 | 11.5 | ||||||||||||||||||||||||||||||
| Pakistan |
1.4 | 1.3 | 1.3 | 1.4 | 1.2 | 1.3 | 1.4 | 1.5 | 1.3 | 1.5 | ||||||||||||||||||||||||||||||
| Australia |
1.4 | 1.3 | 1.7 | 1.8 | 1.5 | 1.6 | 1.7 | 1.8 | 1.6 | 1.7 | ||||||||||||||||||||||||||||||
| Other Asia and Oceania |
3.9 | 4.1 | 4.4 | 4.7 | 4.5 | 4.6 | 4.8 | 5.1 | 4.8 | 5.0 | ||||||||||||||||||||||||||||||
| Europe and FSU |
4.7 | 4.1 | 4.6 | 4.8 | 4.6 | 4.7 | 4.7 | 4.8 | 4.7 | 4.8 | ||||||||||||||||||||||||||||||
| Latin America |
7.5 | 8.7 | 8.8 | 9.3 | 8.5 | 8.9 | 9.2 | 9.8 | 8.9 | 9.5 | ||||||||||||||||||||||||||||||
| Brazil |
4.6 | 5.3 | 5.3 | 5.5 | 5.5 | 5.6 | 5.4 | 5.6 | 5.5 | 5.7 | ||||||||||||||||||||||||||||||
| Argentina |
1.0 | 1.2 | 1.3 | 1.4 | 1.0 | 1.1 | 1.3 | 1.5 | 1.3 | 1.4 | ||||||||||||||||||||||||||||||
| Chile |
0.3 | 0.3 | 0.3 | 0.4 | 0.3 | 0.3 | 0.4 | 0.4 | 0.3 | 0.4 | ||||||||||||||||||||||||||||||
| Other Latin America |
1.5 | 1.9 | 1.9 | 2.0 | 1.8 | 1.9 | 2.1 | 2.3 | 1.8 | 2.0 | ||||||||||||||||||||||||||||||
| North America |
8.1 | 8.4 | 8.3 | 8.5 | 8.3 | 8.4 | 8.5 | 8.7 | 8.6 | 8.8 | ||||||||||||||||||||||||||||||
| Other |
4.1 | 3.5 | 4.2 | 4.4 | 4.1 | 4.2 | 4.5 | 4.7 | 4.4 | 4.6 | ||||||||||||||||||||||||||||||
|
|
|
|
|
|
|
|
|
|
|
|
|
|
|
|
|
|
|
|
|
|||||||||||||||||||||
| World Total |
58.0 | 58.6 | 61.6 | 64.1 | 62.0 | 63.1 | 64.3 | 66.6 | 63.9 | 66.1 | ||||||||||||||||||||||||||||||
Muriate of Potash Shipment Forecasts
| 2010 | 2011 | 2012 | 2013 | |||||||||||||||||||||||||||||||||||||
| KCl Mil Tonnes |
Actual | Actual | Feb. Forecast | Aug. Forecast | Feb. Forecast | Aug. Forecast | ||||||||||||||||||||||||||||||||||
| Low | High | Low | High | Low | High | Low | High | |||||||||||||||||||||||||||||||||
| Asia/Oceania |
23.0 | 24.2 | 22.8 | 24.1 | 22.2 | 22.8 | 25.1 | 26.4 | 25.2 | 26.2 | ||||||||||||||||||||||||||||||
| China |
8.8 | 10.2 | 9.8 | 10.3 | 10.1 | 10.3 | 10.2 | 10.7 | 10.6 | 10.8 | ||||||||||||||||||||||||||||||
| India |
6.6 | 4.3 | 4.5 | 5.0 | 3.7 | 3.9 | 6.2 | 6.7 | 5.5 | 6.0 | ||||||||||||||||||||||||||||||
| Indonesia/Malaysia |
4.2 | 5.0 | 4.4 | 4.6 | 4.4 | 4.5 | 4.5 | 4.7 | 5.0 | 5.2 | ||||||||||||||||||||||||||||||
| Other Asia/Oceania |
3.3 | 4.6 | 4.1 | 4.2 | 4.0 | 4.1 | 4.2 | 4.3 | 4.1 | 4.2 | ||||||||||||||||||||||||||||||
| Europe/FSU |
10.8 | 10.8 | 11.2 | 11.5 | 10.6 | 10.7 | 11.5 | 11.8 | 11.3 | 11.5 | ||||||||||||||||||||||||||||||
| Latin America |
8.6 | 10.3 | 9.5 | 9.9 | 9.8 | 10.0 | 10.2 | 10.6 | 10.5 | 10.9 | ||||||||||||||||||||||||||||||
| Brazil |
6.7 | 8.1 | 7.3 | 7.6 | 7.6 | 7.7 | 7.8 | 8.1 | 8.1 | 8.3 | ||||||||||||||||||||||||||||||
| Other Latin America |
1.9 | 2.2 | 2.2 | 2.3 | 2.2 | 2.3 | 2.4 | 2.5 | 2.4 | 2.6 | ||||||||||||||||||||||||||||||
| North America |
9.5 | 9.4 | 9.0 | 9.2 | 7.8 | 7.9 | 9.6 | 9.8 | 9.4 | 9.6 | ||||||||||||||||||||||||||||||
| Other |
1.8 | 1.8 | 1.5 | 1.6 | 1.6 | 1.8 | 1.6 | 1.7 | 1.5 | 1.7 | ||||||||||||||||||||||||||||||
|
|
|
|
|
|
|
|
|
|
|
|
|
|
|
|
|
|
|
|
|
|||||||||||||||||||||
| World Total |
53.7 | 56.4 | 54.0 | 56.3 | 51.9 | 53.1 | 58.0 | 60.3 | 57.9 | 59.9 | ||||||||||||||||||||||||||||||
Source: Fertecon and Mosaic
In the case of phosphate, we have not changed our global forecasts very much but there are some differences in country or regional forecasts. Phosphate shipments continue to grow at impressive rates – shipments in 2012 are expected to set a record for the fourth year in a row. Our point estimate for 2012 is 11.2 million tonnes greater than the pre-Great Recession peak of 2007 and shipments have increased at a compound annual growth rate of 4.0% during the last five years.
In the case of potash, we have lowered our estimate for 2012 but still project a surge in shipments to a record level in 2013.
The table shows how we get to shipments of 58 to 60 million tonnes next year. More than two-thirds of the 6.4 million tonne jump from our 2012 point estimate results from large rebounds in shipments in India, Indonesia/Malaysia and North America. Projected increases in Europe, the former Soviet Union (FSU) and Brazil account for almost 20% of the expected surge next year.
The jump in North American shipments largely reflects differences in the timing of shipments and in what calendar year they get counted. The projected rebound in Indian shipments, however, results from an expected recalibration of grain and crop input prices. Retail potash prices have increased significantly due to a lower fixed subsidy, higher global prices and a weaker rupee. However, that is just one side of the ledger – and the side we hear the most about. On the other side of the ledger, the government has significantly increased minimum support prices for staple crops. In fact, our local team estimates that rice and wheat returns in 2012/13 will rank as the best and second best, respectively, in recent history. Outstanding but recalibrated farm economics is the main driver of our forecast for a strong rebound in potash shipments in 2013.
A Repeat of 2007/08 Looks Unlikely
Despite record demand prospects, crop nutrient prices have remained relatively stable during the frenzied run-up in agricultural commodity prices this summer. Fundamentals likely will pull up P&K prices at some point, but a repeat of

2008-like spikes in crop nutrient prices looks unlikely for several reasons. In Letterman fashion, here are our top five reasons:
5 Crop nutrient products today trade at prices much higher than the starting points of the rallies five years ago but far below the Everest-like peaks of 2008. Markets have priced in a positive outlook and another fundamental jolt likely will be required to move prices significantly up or down from current levels. However, it looks like there is more upside than downside risk today.
4 Crop nutrient supplies today are more reliable and greater than five years ago. Producers have plowed a large percentage of improved cash flows back into their facilities during the last five years in order to better maintain plant and equipment as well as to expand capacity. For example, we estimate that effective MOP capacity totaled 55 million tonnes KCl or just slightly more than global shipments in 2007. Producers struggled to keep pace with demand five years ago and shipments frequently were delayed weeks or even months due to supply availability. Today, we estimate that global capacity totals about 63 million tonnes KCl and the industry operates with a larger inventory cushion to meet projected demand.
3 The macroeconomic environment today is much weaker than five years ago. The global economy, led by double digit GDP growth in China and high single digit growth in India, was growing at a break-neck pace back then. Rapid growth created what seemed like an insatiable demand for basic materials. The U.S. economy also was growing at more than two times the “new normal” rates and Europe wasn’t yet mired in a deep financial crisis. This glum outlook has dulled growth prospects for many commodities such as iron ore, coking coal and copper and this negative sentiment and extreme caution has spilled over to other commodity markets including crop nutrients.
2 Changes in P&K subsidy policies in India have resulted in increases in retail prices, decreases in use and different importing behaviors. Prior to the reforms introduced for the 2010/11 fiscal year, the Indian government fixed retail prices of crop nutrients at levels far below global market prices. The government paid P&K importers a variable subsidy equal to the difference between the global price and the fixed retail price. The government in effect gave importers carte blanche privileges to procure required quantities of P&K products. Importers used these privileges to outbid other buyers and bid prices to record high levels during the extraordinarily tight markets of 2007/08.
After racking up a subsidy bill of more than $22 billion in the 2008/09 fiscal year, the Government of India in effect took away importers’ credit cards. The government fixed the subsidy paid on P&K imports and allowed the retail price to vary with global values. The government also has increased minimum support prices for wheat and rice so farm economics are profitable, but the sticker shock of higher retail prices as well as changes in the subsidy system have caused temporary declines in P&K use, shipments and imports.
1 And the number one reason why we do not expect a 2008-like spike in crop nutrient prices is that everyone has been to this rodeo before. Caution permeates the value chain from crop nutrient producers to farmers as a result of the extreme volatility five years ago.
This caution amplifies concerns about several uncertainties that overhang crop nutrient markets today. Where are agricultural commodity prices headed? How will the severe drought impact U.S. P&K use in 2012/13? How big of crop with the Southern Hemisphere produce this year? When will Indian P&K demand bounce back? How much phosphate will Chinese producers export? When will Ma’aden production ramp-up? How much new potash capacity will be brought on line during the next year?
Prospects for 2012/13 look increasingly positive to us, but a reliable weatherman and clairvoyant analyst still would help.