Attached files
| file | filename |
|---|---|
| 8-K - THE BANCORP, INC. FORM 8-K - Bancorp, Inc. | bancorp8k.htm |
Exhibit 99.1

NASDAQ: TBBK
The Bancorp, Inc. • Investor Presentation
2nd Quarter, 2012
2nd Quarter, 2012

Forward-Looking Statements
Safe Harbor Statement under the Private Securities Litigation Reform Act of 1995:
Statements in this presentation regarding The Bancorp, Inc.’s business that are not historical facts are “forward-
looking statements” that involve risks and uncertainties. These statements may be identified by the use of forward-
looking terminology, including the words “may,” “believe,” “will,” “expect,” “anticipate,” “estimate,” “continue,” or
similar words. For further discussion of these risks and uncertainties, see The Bancorp, Inc.’s filings with the SEC,
including the “risk factors” section of The Bancorp, Inc.’s Form 10-K. These risks and uncertainties could cause
actual results to differ materially from those projected in the forward-looking statements. The forward-looking
statements speak only as of the date of this presentation. The Bancorp, Inc. does not undertake to publicly revise or
update forward-looking statements in this presentation to reflect events or circumstances that arise after the date of
this presentation, except as may be required under applicable law.
1

The Bancorp, Inc. - Planning for Growth with Safety and Soundness
• Strategic Goal:
§ Create and grow a stable, profitable institution with the optimum reliance on capital, risk management and
technology, and manage it with knowledgeable and experienced management and senior officers
technology, and manage it with knowledgeable and experienced management and senior officers
• Tactical Approach:
§ Deposits - Utilize a branchless banking network to gather scalable deposits through strong contractual
relationships at costs significantly below peers
relationships at costs significantly below peers
§ Assets - Focus on asset classes including loans and securities appropriate to our expertise to achieve
returns above risk-adjusted peer net interest margins
returns above risk-adjusted peer net interest margins
§ Non Interest Income - Grow non interest income disproportionately in relation to non interest expense
through our deposit and asset approaches
through our deposit and asset approaches
§ Operating Leverage - Leverage infrastructure investment to grow earnings by creating efficiencies of
scale
scale
2

The Bancorp, Inc. - Planning for Growth
3
Consumer Distribution Channel Penetration
Percent of U.S. Households, 1980-2009
Source: Federal Reserve, FRB Boston, FRB Philadelphia, SRI Consulting, University of Michigan, Mintel, Celent, Bank of America, comScore, Nielsen Mobile, Wall Street Journal, Mercatus Analytics
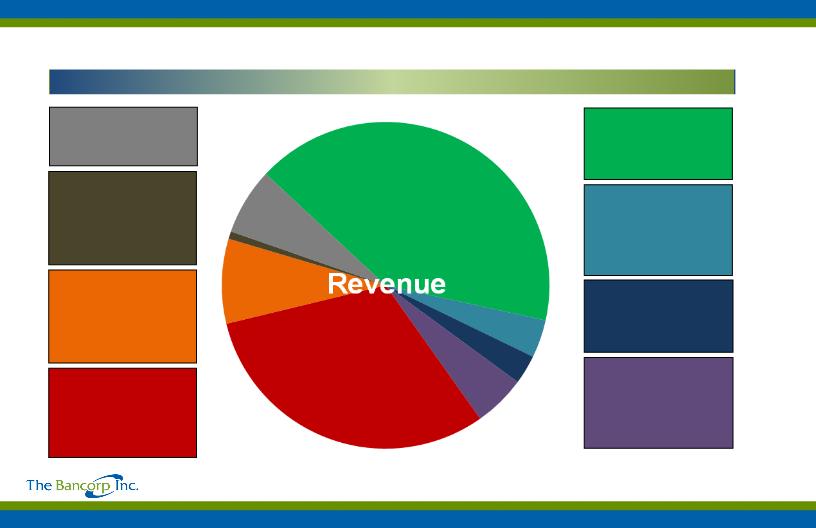
Business Model: A Distinct Business Strategy (1)
4
Assets Deposits
Prepaid Cards
Open Loop Prepaid Cards
• Deposits
• Non interest Income
Healthcare
Health Savings Accounts
and Flexible Spending
Accounts
and Flexible Spending
Accounts
• Deposits
• Non interest Income
Merchant Processing
Credit, Debit Card and
ACH Processing
Credit, Debit Card and
ACH Processing
• Deposits
• Non interest Income
Wealth Management
Deposit and Lending for
Clients of Wealth Firms
Clients of Wealth Firms
• Interest Income
• Deposits
• Non interest Income
Securities Portfolio
Primarily highly rated
government obligations
government obligations
• Interest Income
Government Guaranteed
Lending
Lending
Loans to franchisees;
75% guaranteed by
U.S. government
75% guaranteed by
U.S. government
• Interest Income
Automobile Fleet
Leasing
Leasing
Well-collateralized
Automobile Fleet Leasing
Automobile Fleet Leasing
• Interest Income
• Non interest Income
Community Bank
Traditional Community
Banking Products
Banking Products
• Interest Income
• Deposits
• Non interest Income
41%
4%
3%
7%
30%
8%
GGL:
1%
1%
6%
(1) For the above presentation, departmental revenue for asset-generators includes half the revenue on assets they do not fund, the other half of which is
allocated to the deposit-producing departments. The balance of interest income is retained by the asset generators.
allocated to the deposit-producing departments. The balance of interest income is retained by the asset generators.
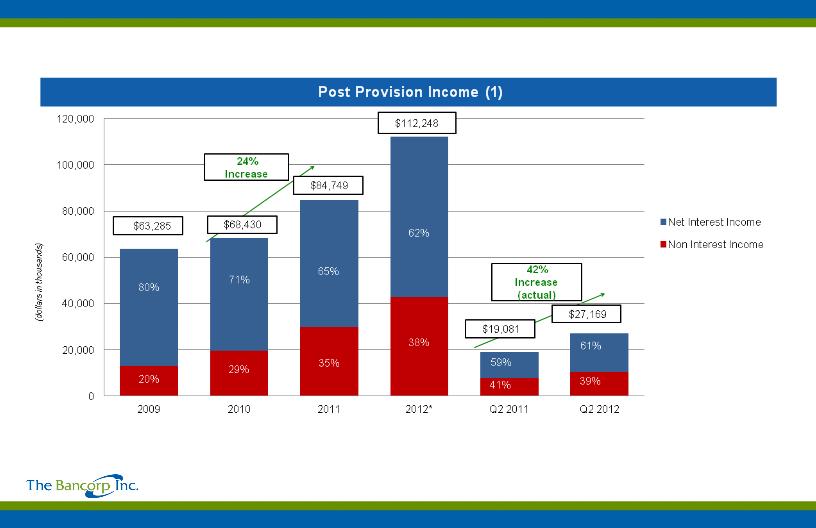
Revenue Composition
5
(1) Post provision net interest income and non interest income excluding securities gains and losses.
*Based on historical trends and is not intended to be, nor is, predictive of future results.
$

Non Interest Income-Generating Strategies: Growth and Sustainability
6
$
(1) Excludes gains on investment securities.
(2) Excluding a one time legal settlement of $233,000 for the second quarter 2011 the percentage increase would have been 57%.
(3) CAGR calculated 2009 through 2011
*Based on historical trends and is not intended to be, nor is, predictive of future results.
Continued Growth in Non Interest Income(1)
(2)
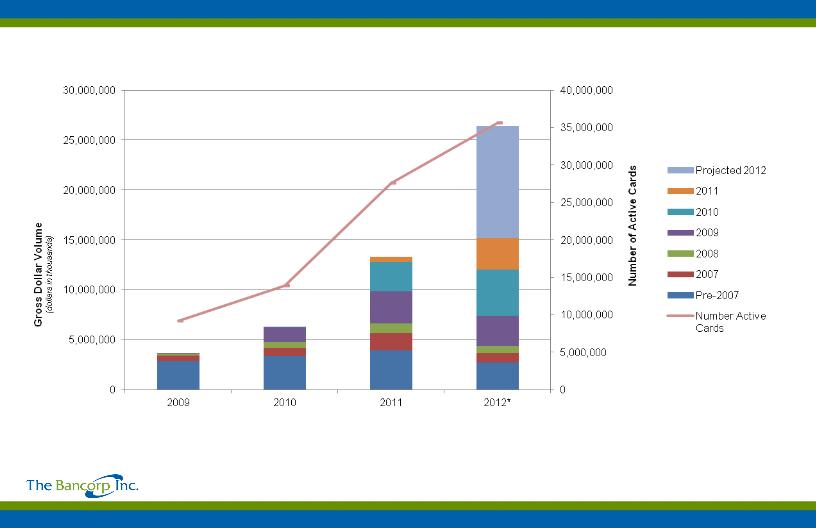
Prepaid Gross Dollar Volume (1) and Cardholder Growth (2)
7
(1) Gross Dollar Volume is the total amount spent on all cards outstanding within a given period.
(2) Number of active cards as of year-end of the stated year with the exception of 2012, which is end of the second quarter.
*Includes actual data from the first quarter and projected GDV for the remainder of the year. Projection for remainder of 2012 is not broken out by contracting year, is based on historical trends and is not intended to be,
nor is, predictive of future results.
nor is, predictive of future results.
$

Net Interest Income Generators(1)
Compressed Interest Rate Environment
8
$
(1) CAGR calculated 2009 through 2011
*Based on historical trends and is not intended to be, nor is, predictive of future results.
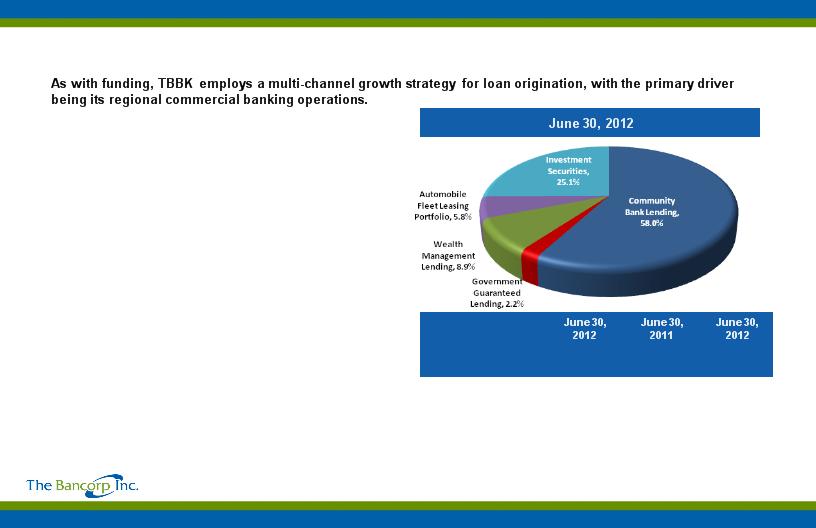
Primary Asset-Generating Strategies: Business Line Overview
• Community Bank
§ Offers traditional community banking products and services
targeting the highly fragmented Philadelphia/Wilmington banking
market
targeting the highly fragmented Philadelphia/Wilmington banking
market
• Automobile Fleet Leasing
§ Well-collateralized automobile fleet leasing
• Average transaction: 8-15 automobiles, $350,000
• 25% of portfolio leased by state and federal agencies
• Wealth Management
§ 17 affinity groups, managing $400 billion in assets
• SEI Investments, Legg Mason, Genworth Financial Trust
Company
Company
§ Generates security backed and other loans
• Government Guaranteed Lending
§ Loans from $250,000 to $1.5 million primarily to franchisees such
as UPS Stores, Massage Envy, FASTSIGNS and Save a Lot
which are 75% guaranteed by the U.S. government. Recently
approved lines $365 +million
as UPS Stores, Massage Envy, FASTSIGNS and Save a Lot
which are 75% guaranteed by the U.S. government. Recently
approved lines $365 +million
• Securities
§ High credit quality tax exempt municipal obligations
§ U.S. Government agency securities primarily 4-5 year average
lives and other highly rated mortgage-backed securities
lives and other highly rated mortgage-backed securities
9
|
Category
|
Balance
|
Balance
|
Avg. Yield
|
|
|
(in thousands)
|
|
|
|
Community Bank
|
$ 1,397,041
|
$ 1,377,041
|
4.22%
|
|
Government
Guaranteed Lending |
53,583
|
14,870
|
5.24%
|
|
Wealth Management
|
213,651
|
159,733
|
2.78%
|
|
Leasing Portfolio
|
140,012
|
127,016
|
7.20%
|
|
Investment Securities
|
604,611
|
371,201
|
3.30%
|
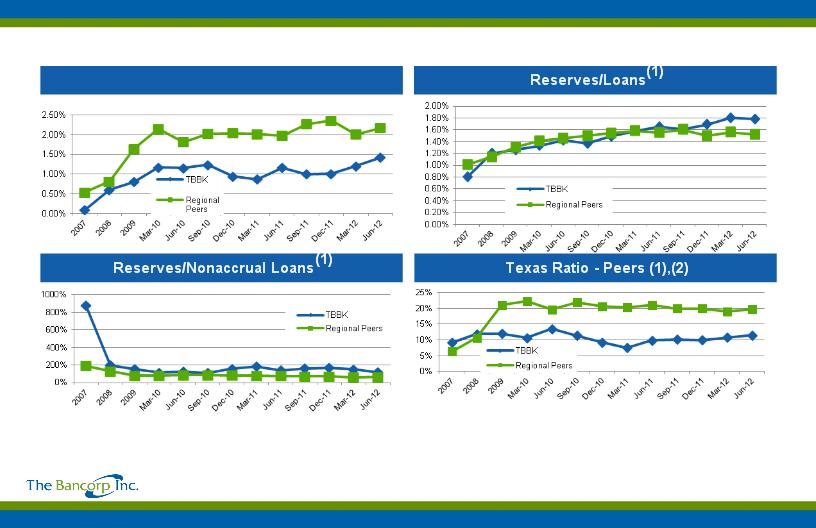
Non-Accrual Loans/Total Loans(1)
Asset Quality Overview
10
(1) Regional peers include publicly traded Mid-Atlantic commercial banks with assets between $1 billion and $4 billion as of June 30, 2012; graphs represent median values. (2) Texas Ratio = (Non-accrual Loans +
Restructured Loans + Loans 90 + days past due + OREO)/(Loss Reserves + Tangible Equity). TBBK computed with consolidated capital. Source: SNL Financial
Restructured Loans + Loans 90 + days past due + OREO)/(Loss Reserves + Tangible Equity). TBBK computed with consolidated capital. Source: SNL Financial

Deposit-Generating Strategies: Growth and Low Cost
The Bancorp has experienced strong growth in deposits at below-peer costs.
11
|
Growth in Average Deposits
|
|||
|
|
YTD Average Deposits
(dollars in thousands)
|
Cost of Funds(2)
|
Peer Cost of Funds(1)
|
|
2012
|
$ 3,420,470
|
0.26%
|
0.54%
|
|
2011
|
$ 2,527,704
|
0.43%
|
0.91%
|
|
Change
|
$ 892,766
|
-0.17%
|
-0.37%
|
|
% Change
|
35%
|
-40%
|
-41%
|
(1) Peer data source as of June 2012: Uniform Bank Performance Report for Banks $1-5 B in assets measuring interest expense to average interest earning assets.
(2) Bancorp cost of funds is lower after consideration of seasonal deposits.

Deposit-Generating Strategies: Sticky and Long-Term
The Bancorp has long-term, often exclusive agreements in place with its private label banking partners. We
have retained 99% of maturing contracts.
have retained 99% of maturing contracts.
12
|
Private Label Agreements by Remaining Contractual Term(1)
|

Growth Engine: Where Do Deposits Come From?
13
|
June 30, 2012
|
|
Category
|
Balance
(in millions)
|
Avg. Cost
|
|
Community Bank
|
$ 318
|
0.42%
|
|
Healthcare
|
445
|
0.96%
|
|
Prepaid Cards
(including demand deposit accounts)
|
1,104
|
0.04%
|
|
Wealth Management
|
618
|
0.53%
|
|
Merchant Processing
|
162
|
0.54%
|
|
1031 Exchange
|
176
|
0.73%
|
|
Total Deposits: $2.8 billion
|
|
Average Cost: 0.26%
|
|
(Peer Average Cost: 0.54%)(1)
|
(1) Peer data source as of June 2012: Uniform Bank Performance
Report for Banks $1-5 B in assets measuring interest expense to
average interest earning assets.
Report for Banks $1-5 B in assets measuring interest expense to
average interest earning assets.
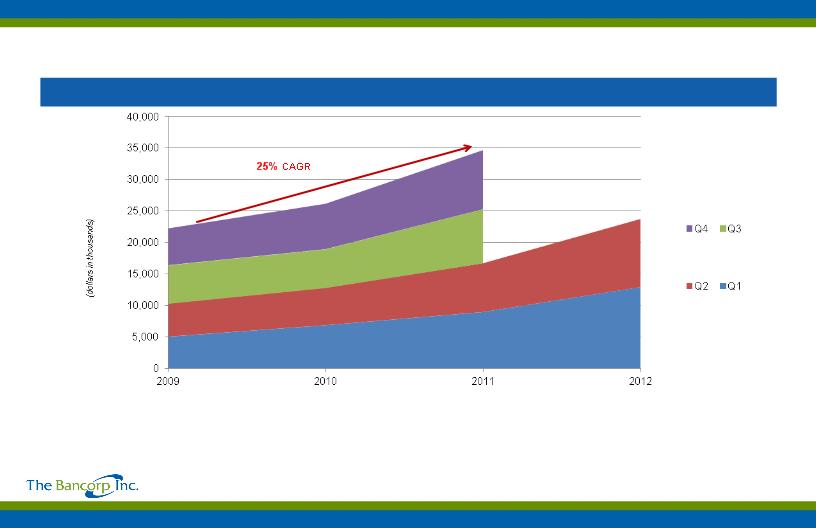
Adjusted Operating Earnings(1),(2)
Operating Leverage
14
(1) As a supplement to GAAP, Bancorp has provided this non-GAAP performance result. The Bancorp believes that this non-GAAP financial measure is useful because it allows investors to assess its operating
performance. Management utilizes adjusted operating earnings to measure the combined impact of changes in net interest income, non-interest income and certain other expenses. Adjusted operating earnings
exclude the impact of the provision for loan losses, income taxes, securities gains and losses and certain non-recurring items. Other companies may calculate adjusted operating earnings differently. Although
this non-GAAP financial measure is intended to enhance investors’ understanding of Bancorp’s business and performance, it should not be considered, and is not intended to be, a substitute for GAAP.
(2) CAGR calculated 2009 through 2011
$

The Bancorp, Inc. - Planning for Growth with Safety and Soundness
• Strategic Goal:
§ Create and grow a stable, profitable institution with the optimum reliance on capital, risk management and
technology, and manage it with knowledgeable and experienced management and senior officers
technology, and manage it with knowledgeable and experienced management and senior officers
• Tactical Approach:
§ Deposits - Utilize a branchless banking network to gather scalable deposits through strong contractual
relationships at costs significantly below peers
relationships at costs significantly below peers
§ Assets - Focus on asset classes including loans and securities appropriate to our expertise to achieve
returns above risk-adjusted peer net interest margins
returns above risk-adjusted peer net interest margins
§ Non Interest Income - Grow non interest income disproportionately in relation to non interest expense
through our deposit and asset approaches
through our deposit and asset approaches
§ Operating Leverage - Leverage infrastructure investment to grow earnings by creating efficiencies of
scale
scale
15

NASDAQ: TBBK
APPENDIX

Capital Ratios and Selected Financial Data
17
|
|
|
As of or for the three months ended
|
As of or for the three months ended
|
|
|
|
June 30, 2012
|
June 30, 2011
|
|
|
|
(dollars in thousands)
|
(dollars in thousands)
|
|
Selected Capital and Asset Quality Ratios:
|
|
|
|
|
|
Equity/assets
|
8.98%
|
10.63%
|
|
|
Tier 1 capital to average assets
|
8.22%
|
9.87%
|
|
|
Tier 1 capital to total risk-weighted assets
|
14.72%
|
14.88%
|
|
|
Total Capital to total risk-weighted assets
|
15.98%
|
16.14%
|
|
|
Allowance for loan and lease losses to total loans
|
1.73%
|
1.65%
|
|
|
|||
|
Balance Sheet Data:
|
|
|
|
|
|
Total assets
|
$ 3,150,202
|
$ 2,465,839
|
|
|
Total loans, net of unearned costs (fees)
|
1,804,312
|
1,678,660
|
|
|
Allowance for loan and lease losses
|
31,171
|
27,685
|
|
|
Total cash and cash equivalents
|
698,142
|
368,823
|
|
`
|
Total investments
|
600,015
|
365,567
|
|
|
Deposits
|
2,822,297
|
2,162,703
|
|
|
Short-term borrowings
|
0
|
0
|
|
|
Shareholders’ equity
|
282,874
|
262,237
|
|
|
|||
|
Selected Ratios:
|
|
|
|
|
|
Return on average assets
|
0.46%
|
0.31%
|
|
|
Return on average common equity
|
5.54%
|
3.54%
|
|
|
Net interest margin
|
2.59%
|
2.96%
|
|
|
Book value per share
|
$ 8.54
|
$ 8.18
|

Current Loan Portfolio and Asset Quality Overview at 6/30/2012
|
Category
(dollars in thousands)
|
Balance
|
% of Total
Loans |
Nonaccrual
Loans |
Nonaccrual/
Total Loans
|
OREO
|
30-89 Days
Delinquent |
90+ Days
Delinquen t |
Q2 2012
Quarterly Charge-offs (net) |
|
Commercial
|
$ 441,167
|
25%
|
$9,536
|
0.53%
|
$ 2,632
|
$670
|
$ 540
|
$ (779)
|
|
Commercial mortgage
|
596,639
|
34%
|
5,559
|
0.31%
|
1,555
|
5,628
|
1,632
|
363
|
|
Construction
|
269,636
|
15%
|
8,698
|
0.48%
|
-
|
4,513
|
667
|
( 4,127)
|
|
Direct financing leases
(auto leases) |
140,012
|
8%
|
-
|
0.00%
|
-
|
99
|
266
|
11
|
|
Residential mortgage
|
97,226
|
5%
|
95
|
0.01%
|
732
|
-
|
-
|
2
|
|
Securities backed loans
and other |
255,769
|
14%
|
927
|
0.05%
|
-
|
77
|
-
|
(86)
|
|
Total
|
$ 1,800,449
|
100%
|
$ 24,815
|
1.38%
|
$4,919
|
$ 10,987
|
$3,105
|
$ (4,616)
|
18

Bancorp’s Real Estate Lending Business Targets Well-Positioned Attractive, Stable
Markets
Markets
• Commercial lending is substantially all in greater Philadelphia/Wilmington metropolitan area
§ Consists of the 12 counties surrounding Philadelphia and Wilmington, including Philadelphia, Delaware,
Chester, Montgomery, Bucks and Lehigh Counties in Pennsylvania; New Castle County in Delaware; and
Mercer, Burlington, Camden, Ocean and Cape May Counties in New Jersey.
Chester, Montgomery, Bucks and Lehigh Counties in Pennsylvania; New Castle County in Delaware; and
Mercer, Burlington, Camden, Ocean and Cape May Counties in New Jersey.
• Philadelphia/Wilmington and the surrounding markets encompass a large population, stable economic activity
and attractive demographics.
and attractive demographics.
• Throughout the current down cycle and in prior cycles, the Philadelphia region has exhibited significant stability,
which is reflected in a lesser reduction in housing prices and negative equity compared to the rest of the nation,
as shown below.
which is reflected in a lesser reduction in housing prices and negative equity compared to the rest of the nation,
as shown below.
19
|
|
Home Prices Q4-2008 to Q4-2011 (1)
|
Home Prices Q4-2010 to Q4-2011 (1)
|
|
United States
|
-9.90%
|
-4.00%
|
|
Philadelphia, PA
|
-12.20%
|
-5.70%
|
|
1st Quarter 2012 (2)
|
US
|
NJ
|
DE
|
PA
|
|
% of Homes with Negative
Equity |
23.70%
|
18.90%
|
17.30%
|
9.40%
|
(1) Source: Fiserv Case-Shiller Home Price Indexes, May 2012
(2) Source: CoreLogic, Q1 2012

Notes
20

NASDAQ: TBBK
www.thebancorp.com