Attached files
| file | filename |
|---|---|
| 8-K - CURRENT REPORT ON FORM 8-K - GREEN DOT CORP | a2012-09x13form8xkxinvesto.htm |

Green Dot Corporation Investor Presentation September 2012

Non-GAAP Financial Measures During this presentation, references to financial measures of Green Dot Corporation will include references to non-GAAP financial measures. For an explanation to the most directly comparable GAAP financial measures, see the Appendix to these materials or the Supplemental Non-GAAP Financial Information available at Green Dot Corporation’s investor relations website at http://ir.greendot.com/ under “Financial Information.” Caution About Forward-Looking Statements This presentation contains forward-looking statements, which are subject to the safe harbor provisions of the Private Securities Litigation Reform Act of 1995. These statements include any statements regarding future events that involve risks and uncertainties. Actual results may differ materially from those contained in the forward-looking statements contained in this presentation, and reported results should not be considered as an indication of future performance. The potential risks and uncertainties that could cause actual results to differ from those projected include, among other things, the Company's dependence on revenues derived from Walmart and three other retail distributors, competition, the Company's reliance on retail distributors for the promotion of its products and services, demand for the Company's products and services, continued and improving returns from the Company’s investments in new growth initiatives, potential difficulties in integrating operations of acquired entities and acquired technologies, the Company's ability to operate in a highly regulated environment, changes to existing laws or regulations affecting the Company's operating methods or economics, the Company's reliance on third-party vendors and card issuing banks, changes in credit card association or other network rules or standards, changes in card association and debit network fees or products or interchange rates, instances of fraud or developments in the prepaid financial services industry that impact prepaid debit card usage generally, business interruption or systems failure, and the Company's involvement in litigation or investigations. These and other risks are discussed in greater detail in the Company's Securities and Exchange Commission filings, including its most recent annual report on From 10-K and quarterly report on Form 10-Q, which are available on the Company's investor relations website at http://ir.greendot.com/ and on the SEC website at www.sec.gov. All information provided in this release and in the attachments is as of September 13, 2012, and the Company assumes no obligation to update this information as a result of future events or developments.

Time to “Break Free” 2

3 Green Dot is… A founder-led, entrepreneurial inventor of the retail prepaid debit card category (2001) and the prepaid “reload” network (2003) Led by a two-time Ernst & Young Entrepreneur of the Year ® award winner, including the 2011 National Award in the Financial Services Category A Bank Holding Company whose mission is to provide simple, low-cost, and fair bank accounts to Americans living in households with income < $75,000 A provider of among the lowest cost products in the industry, with no penalty or overdraft fees ever The biggest player in GPR (2x active customers vs. #2) that has had the highest revenue growth The #1 brand name in prepaid, with 60+% unaided awareness amongst unbanked customers A company that has invested millions in its technology infrastructure and talent to position itself at the epicenter of disruption in consumer banking A firm that lives at the 4-way intersection of banking, technology, consumer products and consumer advocacy

A large and growing market opportunity 4 Unbanked Underbanked Unhappily-banked 160 million Americans Prepaid cards Reload services Checking accounts ~70 million Americans are either unbanked or underbanked, up 13% past 2yrs* •* Source: FDIC 2011 National Survey of Unbanked and Underbanked Households

Installed customer base Retail distribution Reload network Vertical integration Consumer brands Green Dot has the right stuff… Active cards – 4.4 million Gross dollar volume - $17 billion 65,000 locations1 Direct relationships Highly-profitable products ~40 million cash transfers this year More than 100 partners Bank Program management Reload network Green Dot AARP, NASCAR, RushCard 5 Financial strength Pro-consumer culture Legislators Regulators Consumer advocates $277 million of total cash2 ($6.30/share3) No debt Strong cash flow generation 1. Pro-forma for scheduled Dollar Tree rollout 2. Includes cash and cash equivalents; investment securities, available-for-sale; and federal funds sold 3. Per share amount based on non-GAAP diluted weighted-average shares outstanding. See Appendix for reconciliation of GAAP to non-GAAP financial measures

6 … to thrive in an evolving market We live to serve customers. All good things flow from well-served customers The century-old branch banking model doesn’t work for today’s America. Green Dot’s success is a testament to this reality Nimble Focused Customer-centric Success has brought many new “Goliaths” against our “David” ― Only time will tell how successful these competitors will be ― Historically, we have thrived through many direct attacks ― Customer acquisition is not likely a zero-sum game ― Generally, the #1 brand and the #1 value player win the race, and GDOT is both We are a culture that embraces honest self-evaluation and change ― We believe change makes us stronger ― Fear of change only delays success and, over time, ensures failure ― Therefore, we intend to continue to upgrade talent, adopt new technology and evolve our products and pricing

Achievements since our IPO Non-GAAP Revenue1 has grown by >$200 million to $527 million Active cards have grown by >1 million from 3.2 million to 4.4 million Gross Dollar Volume has nearly doubled to ~$17 billion Generated ~$200 million in cash flows from operations less capex >15,000 new retail distribution outlets, bringing the total to >65,0002 Green Dot Network volume has grown by >16 million transactions to ~40 million Progress in developing new products targeted at key customer segments: Education (Sallie Mae) Affinity (AARP, NASCAR, RushCard) New products for banked customers (Mobile checking account) Significant progress in vertical integration strategy: Card Issuing from Green Dot Bank Card Processing build out on track Mobile development expertise and key mobile patents 7 1. See Appendix for reconciliation of GAAP to non-GAAP financial measures 2. Pro forma for the scheduled Dollar Tree rollout

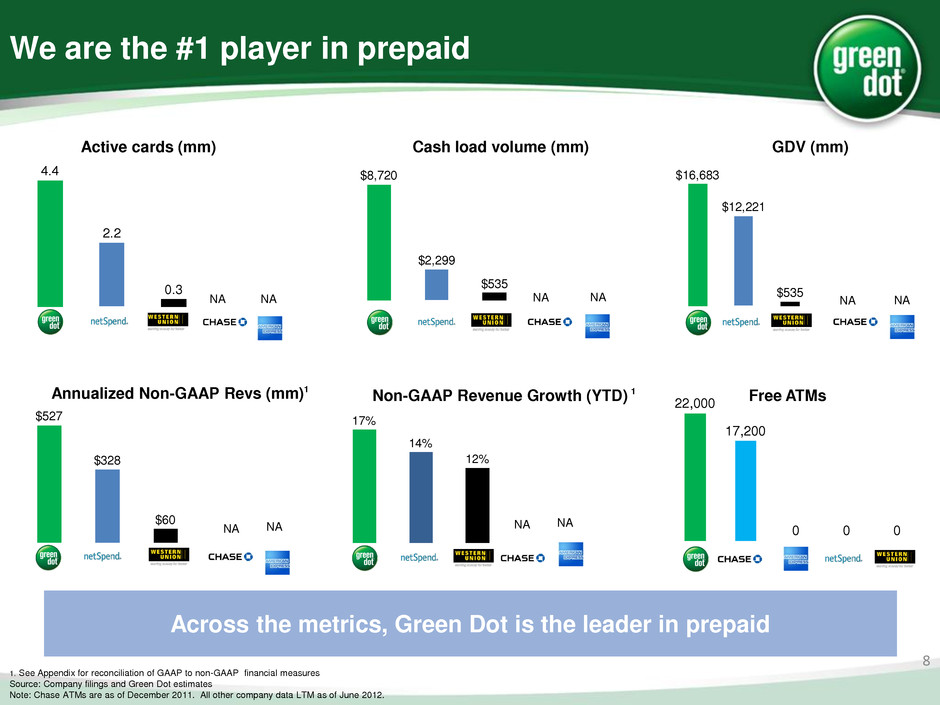
We are the #1 player in prepaid Across the metrics, Green Dot is the leader in prepaid 1. See Appendix for reconciliation of GAAP to non-GAAP financial measures Source: Company filings and Green Dot estimates Note: Chase ATMs are as of December 2011. All other company data LTM as of June 2012. 8 Active cards (mm) Cash load volume (mm) GDV (mm) Non-GAAP Revenue Growth (YTD) 1 Free ATMs Annualized Non-GAAP Revs (mm) 1 $16,683 $12,221 $535 NA NA NA $8,720 $2,299 $535 22,000 17,200 0 0 0 17% 14% 12% 4.4 2.2 0.3 $527 $328 $60 NA NA NA NA NA NA NA

We own the industry’s leading reload network 9 0 5,000,000 10,000,000 15,000,000 20,000,000 25,000,000 30,000,000 35,000,000 2006 2007 2008 2009 2010 2011 H1'11 H1'12 Note: Numbers for calendar years ended December 31; CAGR data from 2006 to 2011 GDOT network cash transfers Green Dot Network is a highly differentiated asset The largest reload network with 4X the cash load volume of next largest competitor Reloading customers show high levels of loyalty to GDN ~6 million customers use GDN an average of 6.5 times per year Strong and growing awareness of Green Dot Network and MoneyPak Network provides retailers with a highly profitable SKU

{So what changed? 10

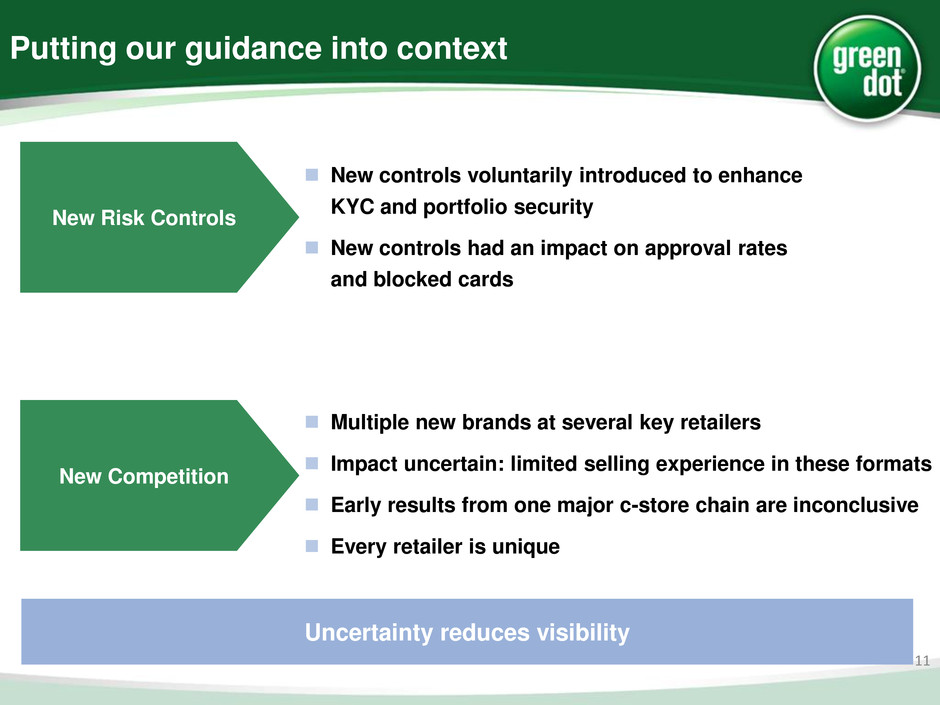
Putting our guidance into context 11 New controls voluntarily introduced to enhance KYC and portfolio security New controls had an impact on approval rates and blocked cards Uncertainty reduces visibility New Risk Controls New Competition Multiple new brands at several key retailers Impact uncertain: limited selling experience in these formats Early results from one major c-store chain are inconclusive Every retailer is unique

Why will Green Dot continue to grow? 12

#1. Green Dot is a Network Model With 12 years of success, ~50 million unit sales this year, the #1 brand name and 4.4 million active customers, we believe Green Dot is in a strong position to withstand attack from new “me too” competition 13

Existing reloading customers drive the business * Excludes Gift card spend. ** Excludes Gift card and third party revenue on GD Network • Reloading customer drive Green Dot’s financial performance • Reloader churn is ~60% lower than non- reloaders • >60% of revs from customers >1 year old • Higher usage has led to increasing revenue per customer each of past 10 quarters Non- reloaders Reloaders 40% 65% 80% 85% 60% 35% 20% 15% Activations Actives Spend* GPR Revenue** Most of Green Dot’s revenues come from “stickier” reloading customers

#2. Green Dot is more than just a card sold at retail We are aggressively pursuing new, potentially powerful channels of acquisition and deploying new retail programs that have the opportunity to yield material growth in 2013 15

Several new growth initiatives with upside potential 16 0-6 months 6-12 months >12 months “Category of the Stars” New Channels Digital Government Affinity Mobile New Products Strategic M&A New channels Revenue diversification New business initiatives could represent significant upside Mobile checking account

#3. Green Dot has a robust and profitable business model 17

Green Dot enjoys strong financial characteristics Positive cash flows from operations less capex every quarter since IPO Modest capital requirements, ~5% of non-GAAP revenues 18 Excess Cash Generation Solid Growth and Margins Strong Balance Sheet Non-GAAP revenue3 growth +17% YTD Adjusted EBITDA margins3 of >20% $277 million1 of total cash as of 6/30/12, or $6.30/share2 >$200 million of unencumbered capital, or ~$5/share No debt Green Dot’s financial position is a source of strength 1. Includes cash and cash equivalents; investment securities, available-for-sale; and federal funds sold 2. Per share amount based on non-GAAP diluted weighted-average shares outstanding. See Appendix for reconciliation of GAAP to non-GAAP financial measures 3. See Appendix for reconciliation of GAAP to non-GAAP financial measures

47 70 71 0 20 40 60 80 2009 2010 2011 4% 4% 5% 0% 2% 4% 6% 8% 10% 2009 2010 2011 Low capital intensity and strong cash flow generation (%) Capex / Non-GAAP Total Operating Revenues Note: Numbers for calendar years ended December 31 $MM Cash Flows From Operations Less Capex Green Dot’s business model is capital efficient and generates strong cash flows 19

Appendix

Reconciliation of Non-GAAP financial measures 21

Investor Relations Contact Chris Mammone 626.765.2041 cmammone@greendot.com
