Attached files
| file | filename |
|---|---|
| 8-K - FORM 8-K - ZIONS BANCORPORATION, NATIONAL ASSOCIATION /UT/ | form_8k.htm |

September 12, 2012 Barclays Capital Global Financial Services Conference
Forward-Looking Statements This presentation contains statements that relate to the projected or modeled performance or condition of Zions Bancorporation and elements of or affecting such performance or condition, including statements with respect to forecasts, opportunities, models, illustrations, scenarios, beliefs, plans, objectives, goals, guidance, expectations, anticipations or estimates, and similar matters. These statements constitute forward-looking information within the meaning of the Private Securities Litigation Reform Act. Actual facts, determinations, results or achievements may differ materially from the statements provided in this presentation since such statements involve significant known and unknown risks and uncertainties. Factors that might cause such differences include, but are not limited to: competitive pressures among financial institutions; economic, market and business conditions, either nationally, internationally, or locally in areas in which Zions Bancorporation conducts its operations, being less favorable than expected; changes in the interest rate environment reducing expected interest margins; changes in debt, equity and securities markets; adverse legislation or regulatory changes; and other factors described in Zions Bancorporation’s most recent annual and quarterly reports. In addition, the statements contained in this presentation are based on facts and circumstances as understood by management of the company on the date of this presentation, which may change in the future. Except as required by law, Zions Bancorporation disclaims any obligation to update any statements or to publicly announce the result of any revisions to any of the forward-looking statements included herein to reflect future events, developments, determinations or understandings. *
Overview Credit Quality Profitability Capital Financial Outlook Agenda
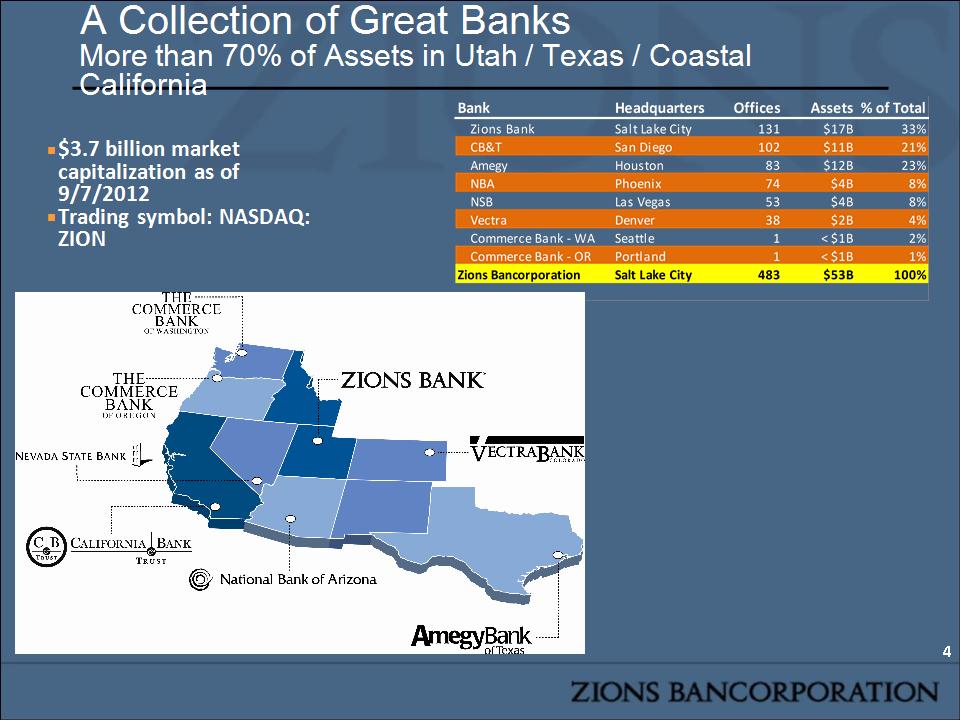
$3.7 billion market capitalization as of 9/7/2012 Trading symbol: NASDAQ: ZION A Collection of Great Banks More than 70% of Assets in Utah / Texas / Coastal California *
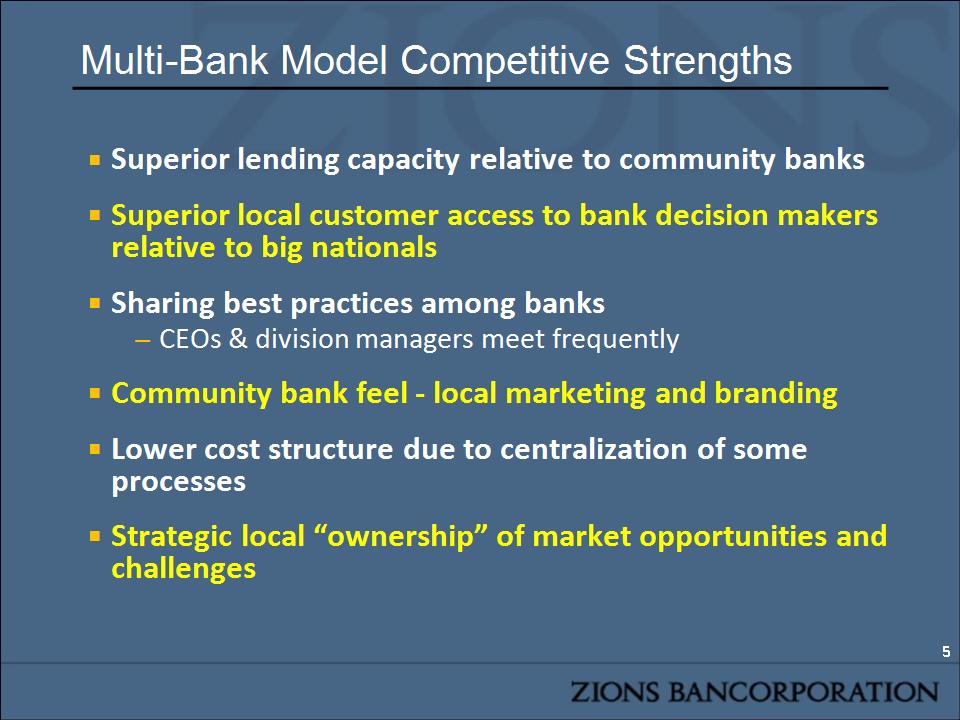
Superior lending capacity relative to community banks Superior local customer access to bank decision makers relative to big nationals Sharing best practices among banks CEOs & division managers meet frequently Community bank feel – local marketing and branding Lower cost structure due to centralization of some processes Strategic local “ownership” of market opportunities and challenges Multi-Bank Model Competitive Strengths *
Awards: Nationally Recognized for Excellence Thirteen 2011 Greenwich Excellence Awards in Small Business and Middle Market Banking Including: Excellence: Overall Satisfaction Excellence: Relationship Manager Performance – Small Businesses Excellence: Relationship Manager Performance – Middle-Market Businesses Superior treasury management products & services The Reputation Institute (cited in the American Banker): #2 Ranking Nationally (behind Harris Bank) Nationally Ranked #5 in SBA Loan Originations 1 Consistently Ranks #1 in SBA 504 (commercial real estate) originations ahead of B of A, JP Morgan, Wells Fargo Top team of women bankers – American Banker Magazine2 * 1. Volume and number of loans 2. One of four winning teams
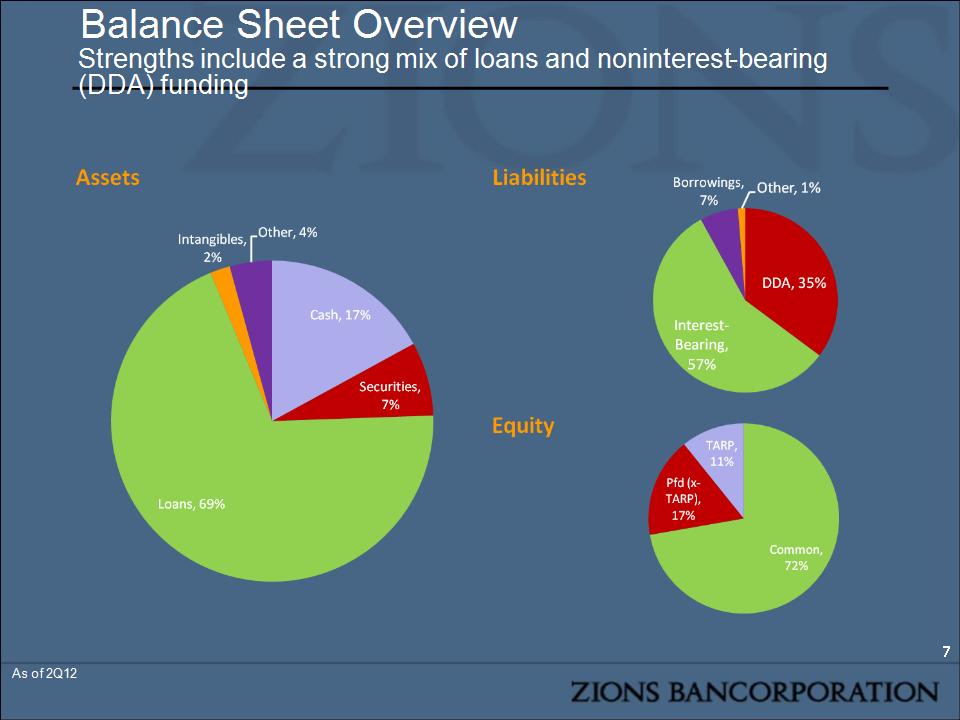
Balance Sheet Overview Strengths include a strong mix of loans and noninterest-bearing (DDA) funding * As of 2Q12
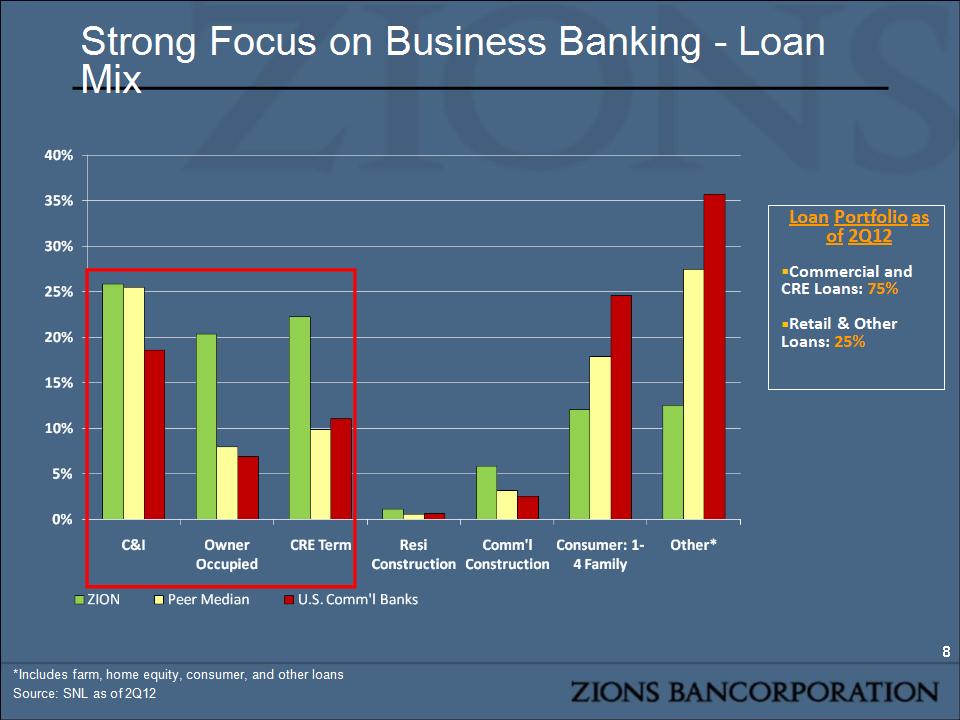
*Includes farm, home equity, consumer, and other loans Source: SNL as of 2Q12 Loan Portfolio as of 2Q12 Commercial and CRE Loans: 75% Retail & Other Loans: 25% * Strong Focus on Business Banking – Loan Mix

Overview Credit Quality Profitability Capital Financial Outlook Agenda
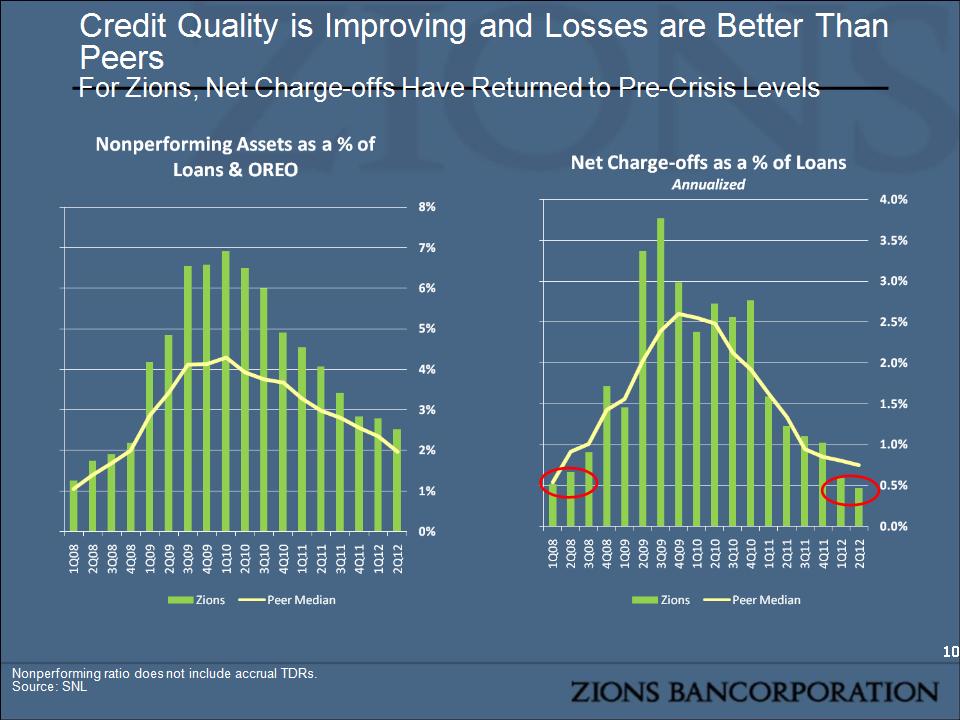
Credit Quality is Improving and Losses are Better Than Peers For Zions, Net Charge-offs Have Returned to Pre-Crisis Levels Nonperforming ratio does not include accrual TDRs. Source: SNL *
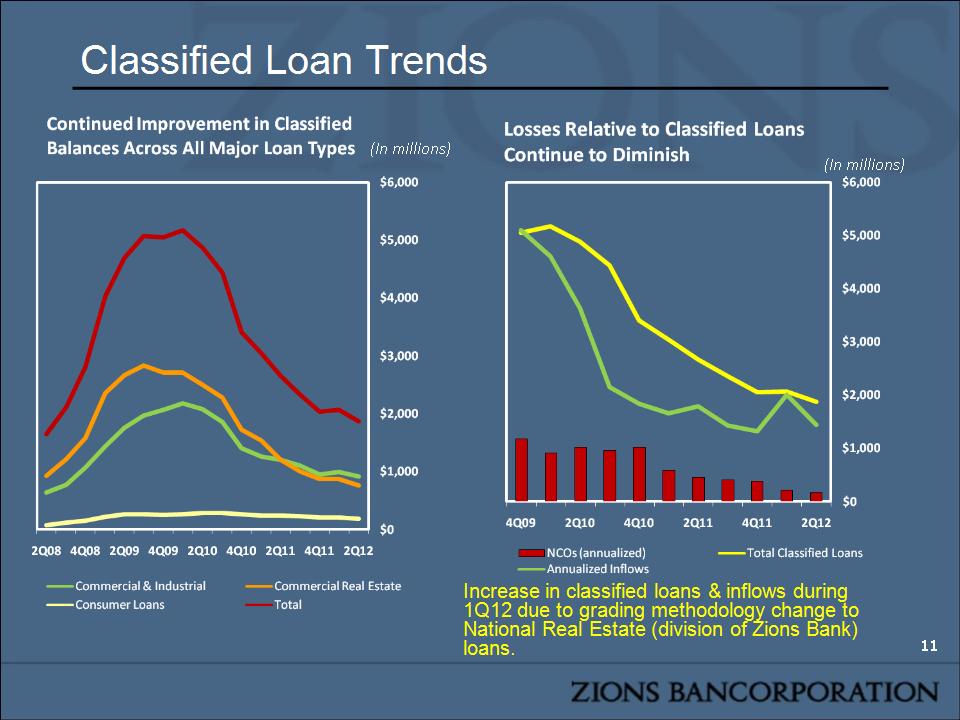
Classified Loan Trends * (In millions) Increase in classified loans & inflows during 1Q12 due to grading methodology change to National Real Estate (division of Zions Bank) loans. (In millions)
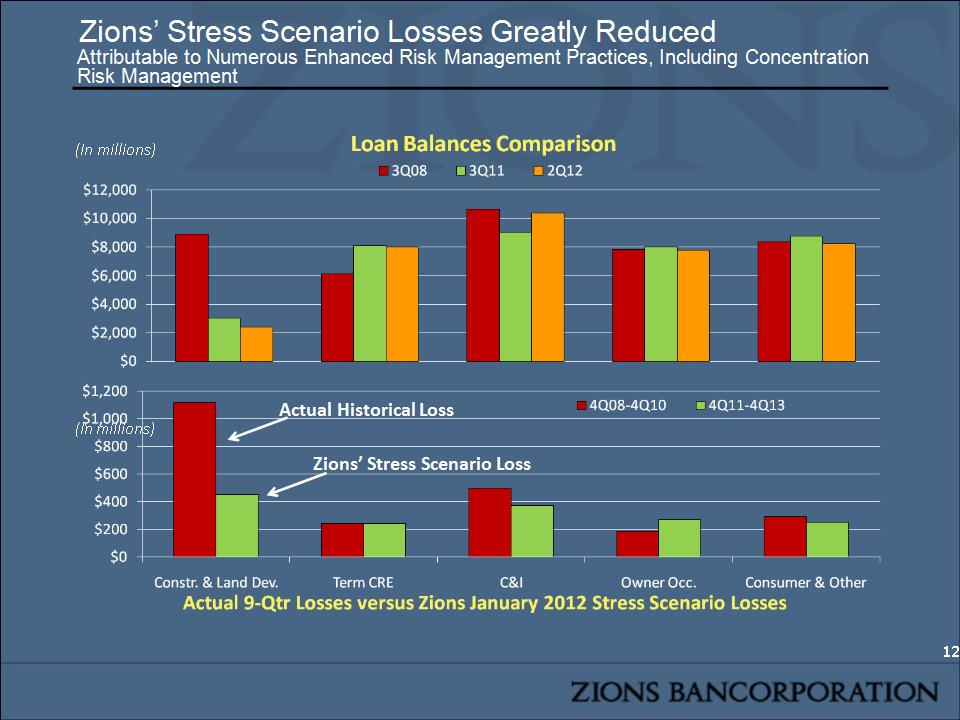
Zions’ Stress Scenario Losses Greatly Reduced Attributable to Numerous Enhanced Risk Management Practices, Including Concentration Risk Management (In millions) Actual Historical Loss Zions’ Stress Scenario Loss * (In millions)
Overview Credit Quality Profitability Capital Financial Outlook Agenda
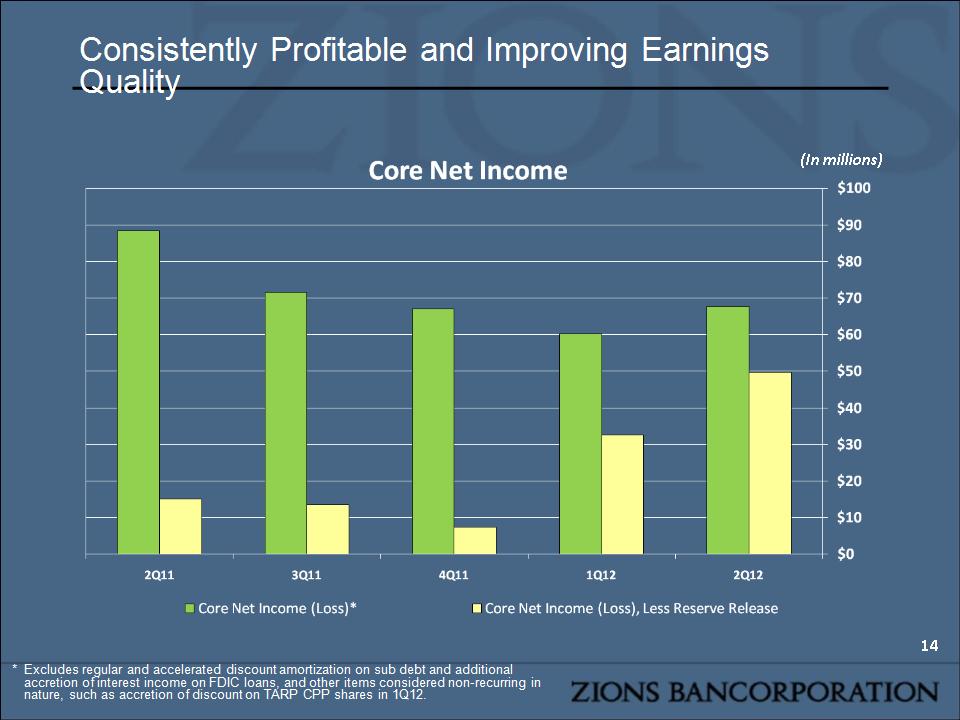
Consistently Profitable and Improving Earnings Quality * * Excludes regular and accelerated discount amortization on sub debt and additional accretion of interest income on FDIC loans, and other items considered non-recurring in nature, such as accretion of discount on TARP CPP shares in 1Q12. (In millions)
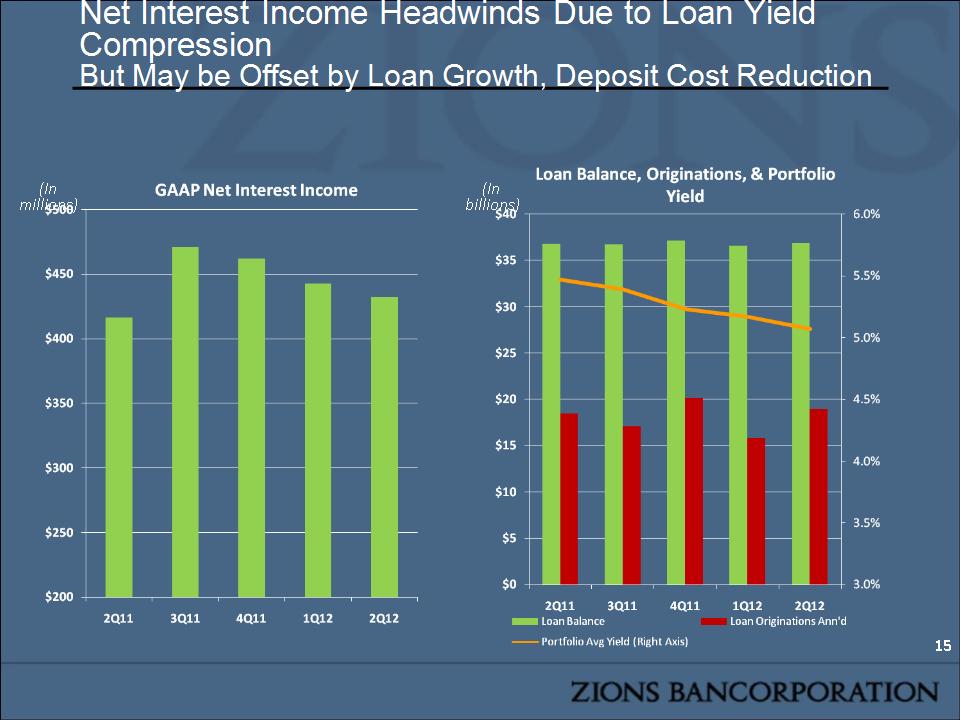
Net Interest Income Headwinds Due to Loan Yield Compression But May be Offset by Loan Growth, Deposit Cost Reduction * (In millions) (In billions)

Moderating Decline in New Loan Spread Versus matched-maturity funds at transfer pricing rate Cost of Interest Bearing Deposits Spread on Production: New Business * Source: Company documents as of 2Q12
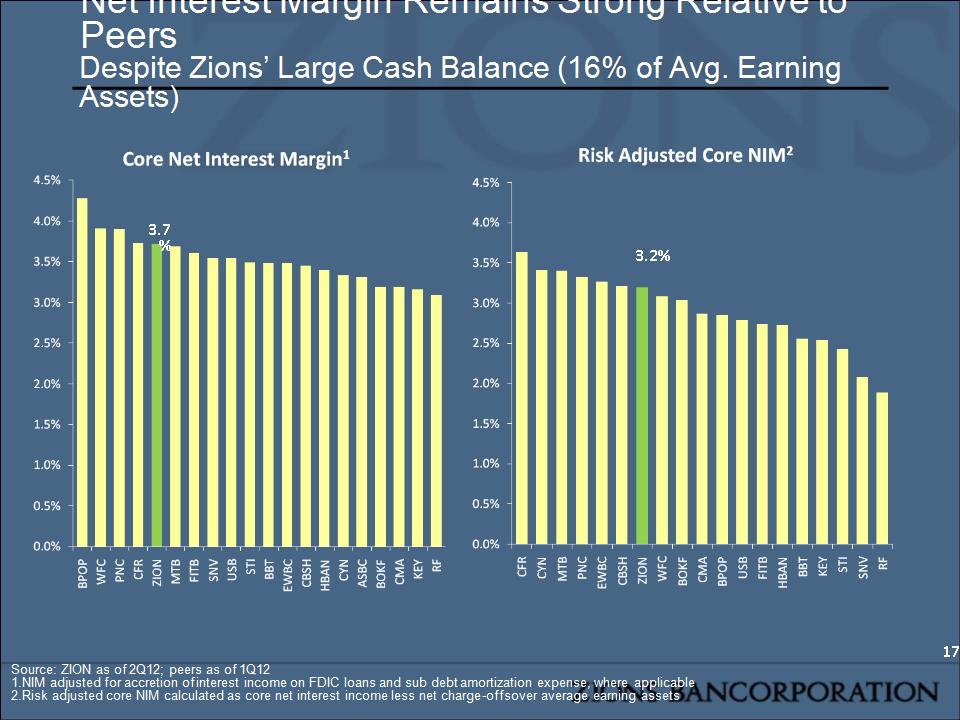
Net Interest Margin Remains Strong Relative to Peers Despite Zions’ Large Cash Balance (16% of Avg. Earning Assets) Source: ZION as of 2Q12; peers as of 1Q12 NIM adjusted for accretion of interest income on FDIC loans and sub debt amortization expense, where applicable Risk adjusted core NIM calculated as core net interest income less net charge-offs over average earning assets * 3.7% 3.2%
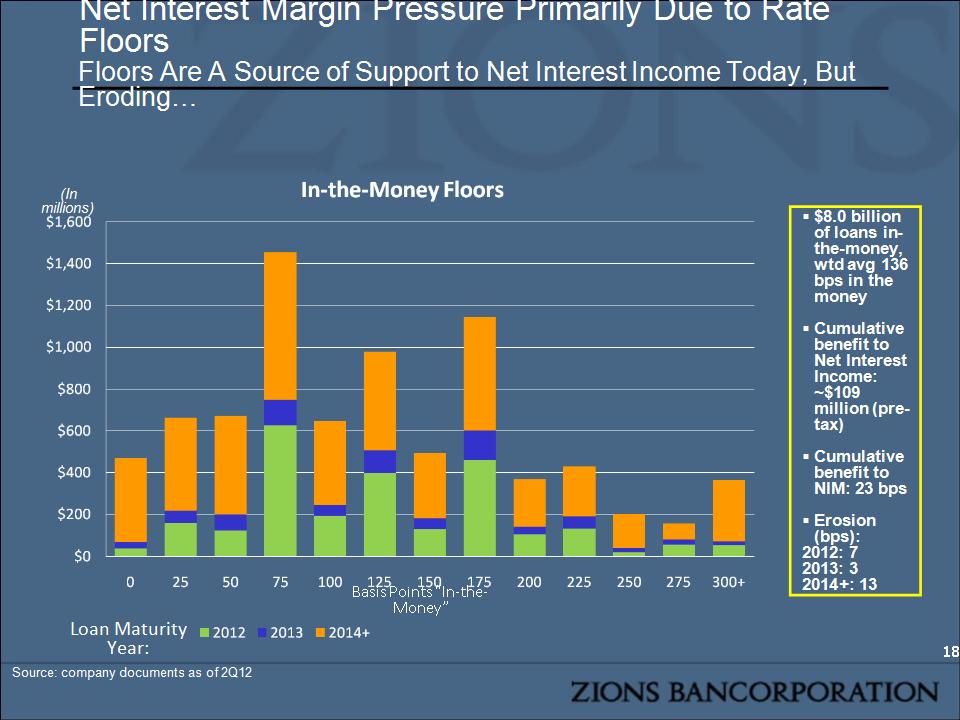
Net Interest Margin Pressure Primarily Due to Rate Floors Floors Are A Source of Support to Net Interest Income Today, But Eroding… * $8.0 billion of loans in-the-money, wtd avg 136 bps in the money Cumulative benefit to Net Interest Income: ~$109 million (pre-tax) Cumulative benefit to NIM: 23 bps Erosion (bps): 2012: 7 2013: 3 2014+: 13 Source: company documents as of 2Q12 Loan Maturity Year: (In millions) Basis Points “In-the-Money”
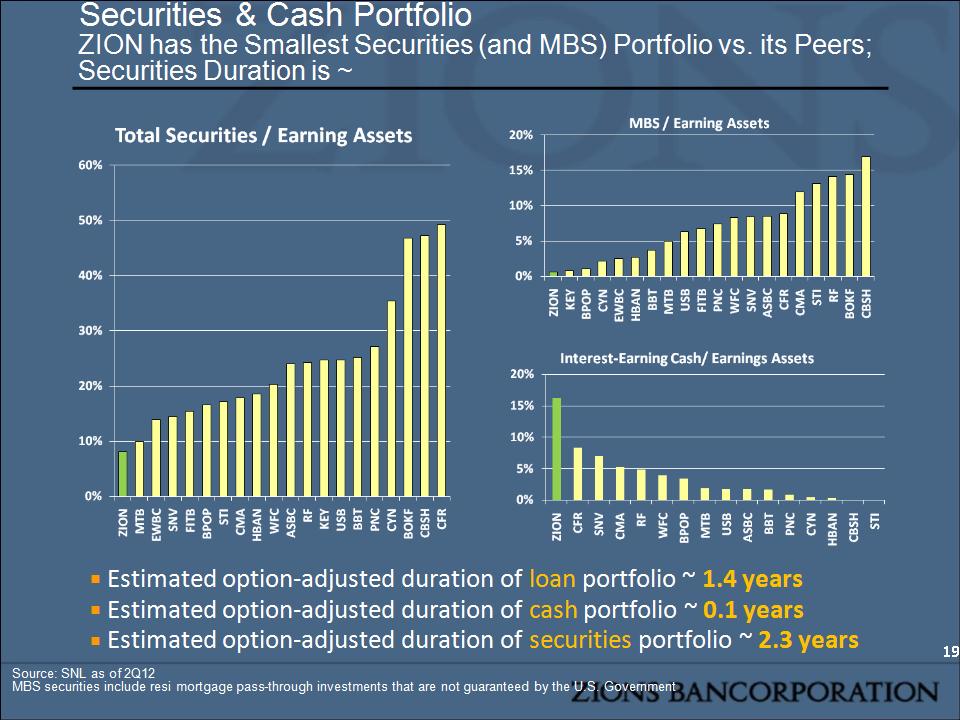
Securities & Cash Portfolio ZION has the Smallest Securities (and MBS) Portfolio vs. its Peers; Securities Duration is ~ Source: SNL as of 2Q12 MBS securities include resi mortgage pass-through investments that are not guaranteed by the U.S. Government Estimated option-adjusted duration of loan portfolio ~ 1.4 years Estimated option-adjusted duration of cash portfolio ~ 0.1 years Estimated option-adjusted duration of securities portfolio ~ 2.3 years *
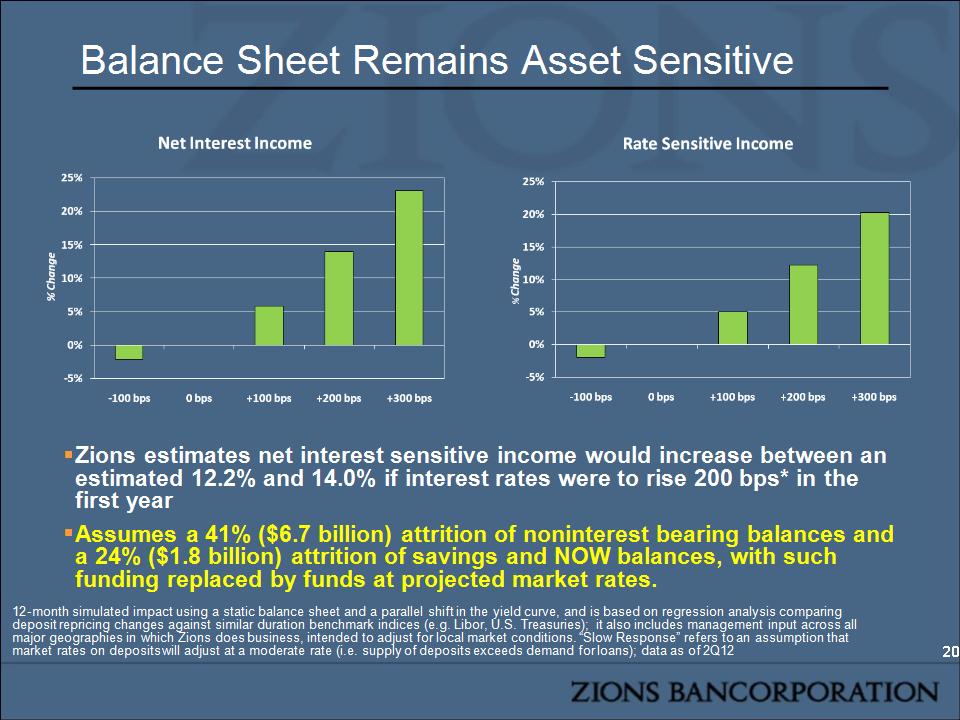
Balance Sheet Remains Asset Sensitive Zions estimates net interest sensitive income would increase between an estimated 12.2% and 14.0% if interest rates were to rise 200 bps* in the first year Assumes a 41% ($6.7 billion) attrition of noninterest bearing balances and a 24% ($1.8 billion) attrition of savings and NOW balances, with such funding replaced by funds at projected market rates. 12-month simulated impact using a static balance sheet and a parallel shift in the yield curve, and is based on regression analysis comparing deposit repricing changes against similar duration benchmark indices (e.g. Libor, U.S. Treasuries); it also includes management input across all major geographies in which Zions does business, intended to adjust for local market conditions. “Slow Response” refers to an assumption that market rates on deposits will adjust at a moderate rate (i.e. supply of deposits exceeds demand for loans); data as of 2Q12 *
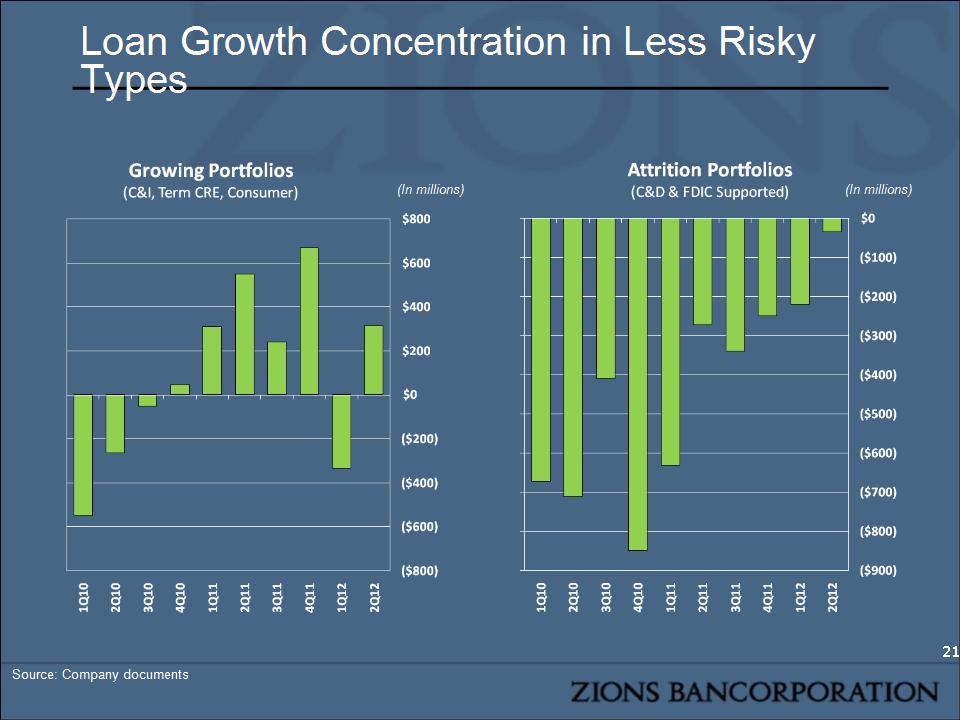
(In millions) (In millions) Loan Growth Concentration in Less Risky Types Source: Company documents *
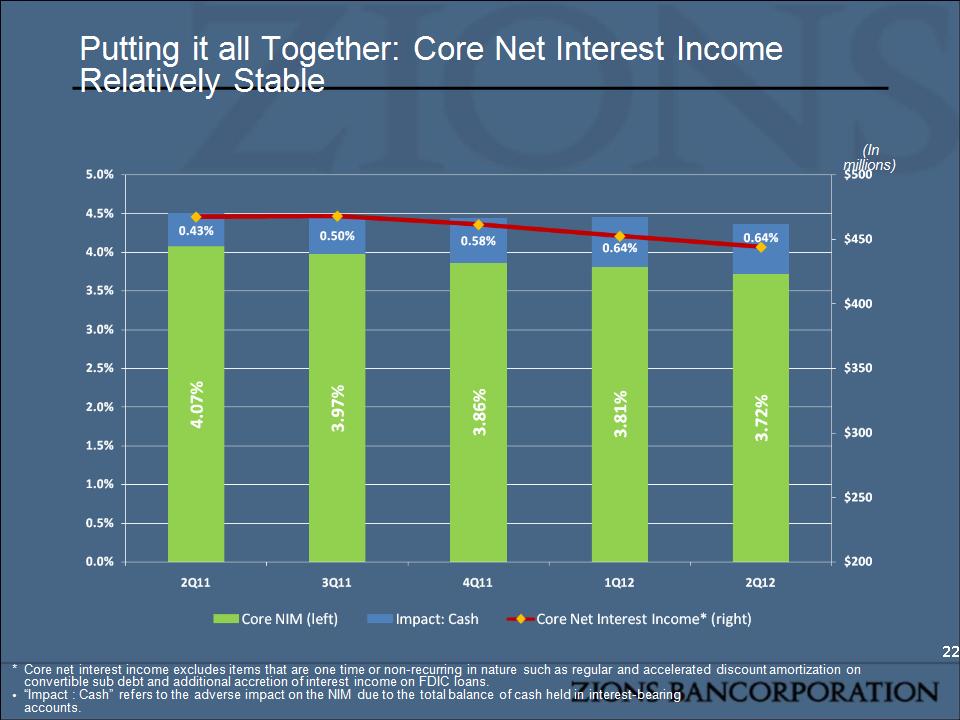
(In millions) Putting it all Together: Core Net Interest Income Relatively Stable * * Core net interest income excludes items that are one time or non-recurring in nature such as regular and accelerated discount amortization on convertible sub debt and additional accretion of interest income on FDIC loans. “Impact : Cash” refers to the adverse impact on the NIM due to the total balance of cash held in interest-bearing accounts.
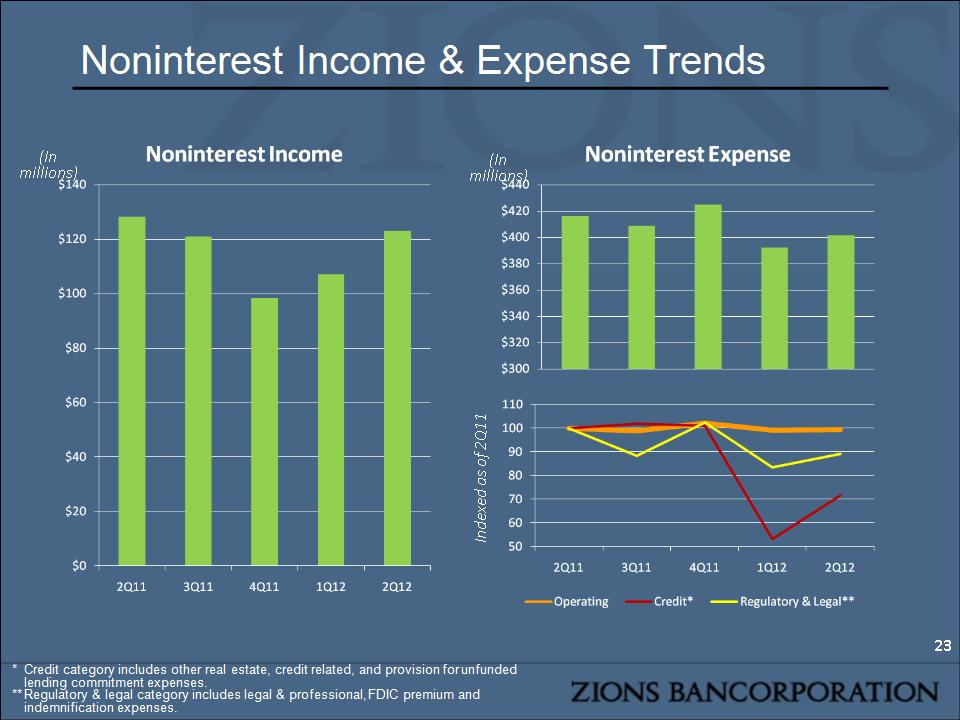
Noninterest Income & Expense Trends * (In millions) Indexed as of 2Q11 * Credit category includes other real estate, credit related, and provision for unfunded lending commitment expenses. ** Regulatory & legal category includes legal & professional, FDIC premium and indemnification expenses. (In millions)
Overview Credit Quality Net Interest Income Capital Financial Outlook Agenda
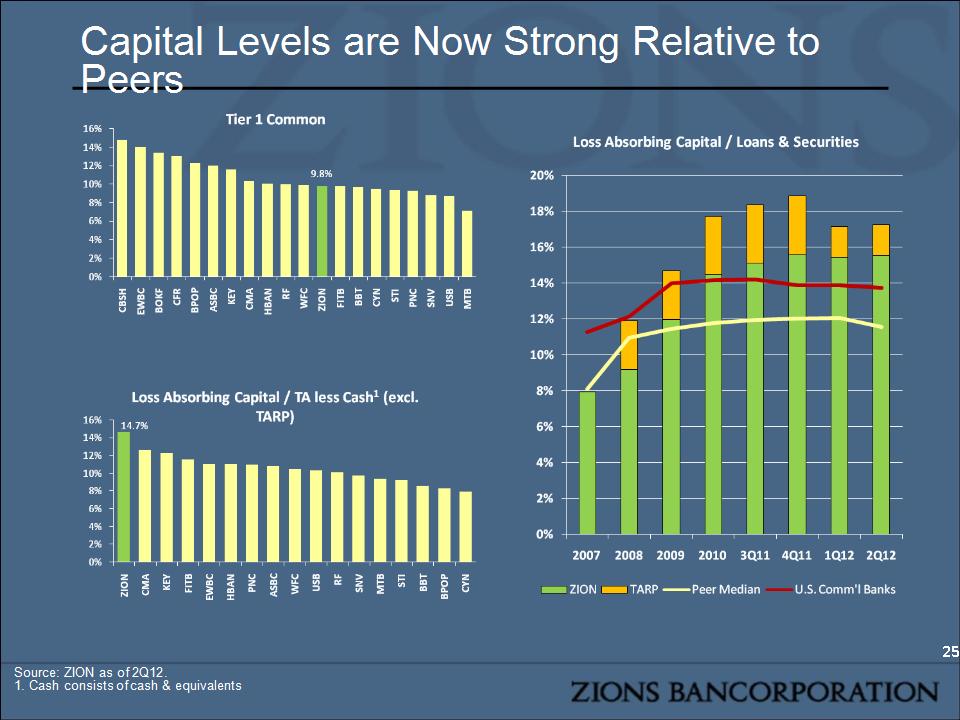
Capital Levels are Now Strong Relative to Peers Source: ZION as of 2Q12. 1. Cash consists of cash & equivalents *
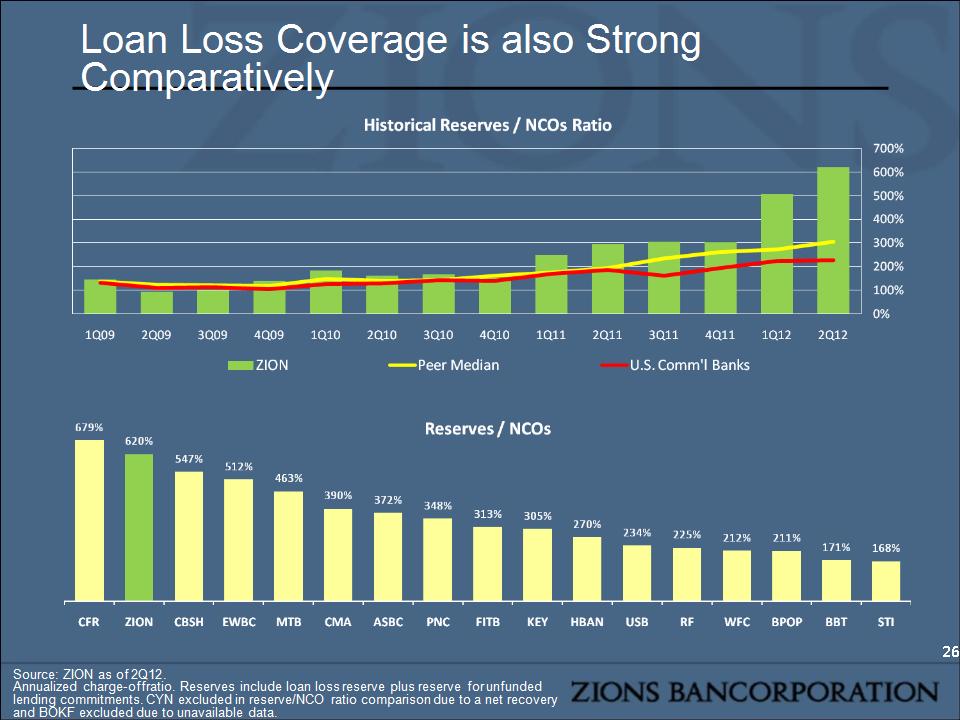
Source: ZION as of 2Q12. Annualized charge-off ratio. Reserves include loan loss reserve plus reserve for unfunded lending commitments. CYN excluded in reserve/NCO ratio comparison due to a net recovery and BOKF excluded due to unavailable data. * Loan Loss Coverage is also Strong Comparatively
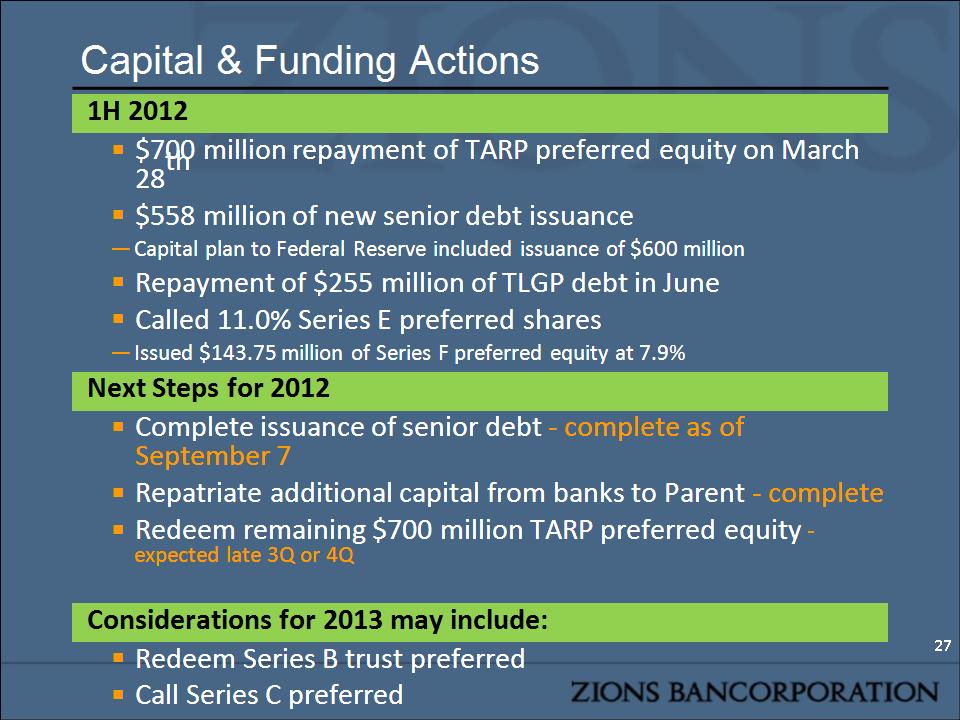
Capital & Funding Actions * 1H 2012 $700 million repayment of TARP preferred equity on March 28th $558 million of new senior debt issuance Capital plan to Federal Reserve included issuance of $600 million Repayment of $255 million of TLGP debt in June Called 11.0% Series E preferred shares Issued $143.75 million of Series F preferred equity at 7.9% Next Steps for 2012 Complete issuance of senior debt – complete as of September 7 Repatriate additional capital from banks to Parent – complete Redeem remaining $700 million TARP preferred equity – expected late 3Q or 4Q Considerations for 2013 may include: Redeem Series B trust preferred Call Series C preferred Partial replacement issuance throughout the year
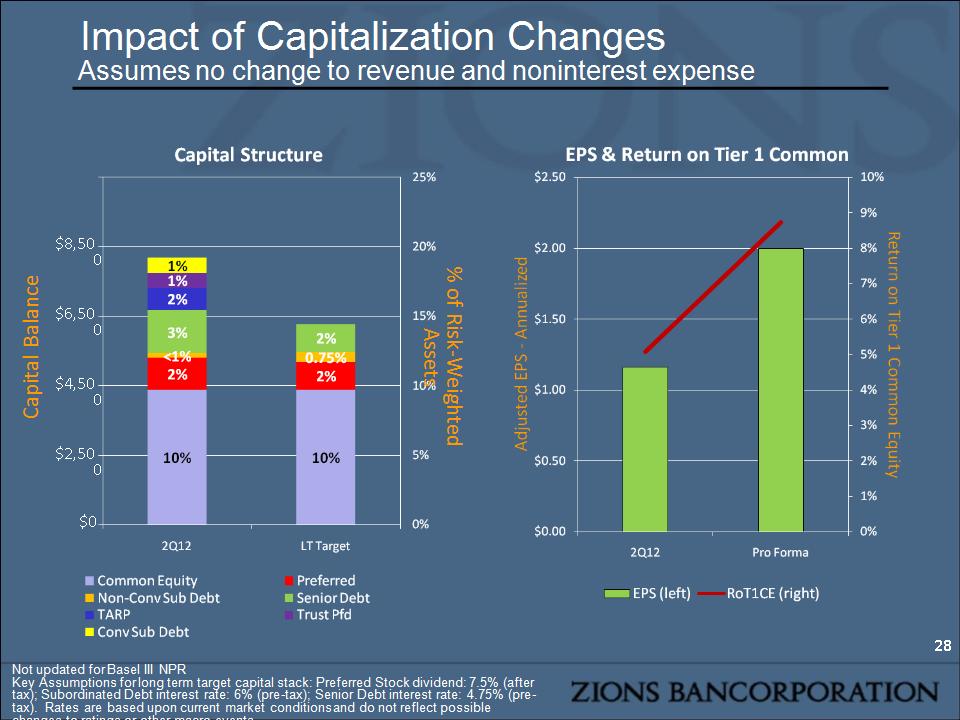
Impact of Capitalization Changes Assumes no change to revenue and noninterest expense * $8,500 Not updated for Basel III NPR Key Assumptions for long term target capital stack: Preferred Stock dividend: 7.5% (after tax); Subordinated Debt interest rate: 6% (pre-tax); Senior Debt interest rate: 4.75% (pre-tax). Rates are based upon current market conditions and do not reflect possible changes to ratings or other macro events. $4,500 $6,500 $2,500 $0 Capital Balance % of Risk-Weighted Assets
Overview Credit Quality – Still The Most Sensitive Driver of EPS Growth Capital and TARP Net Interest Income Financial Outlook Agenda
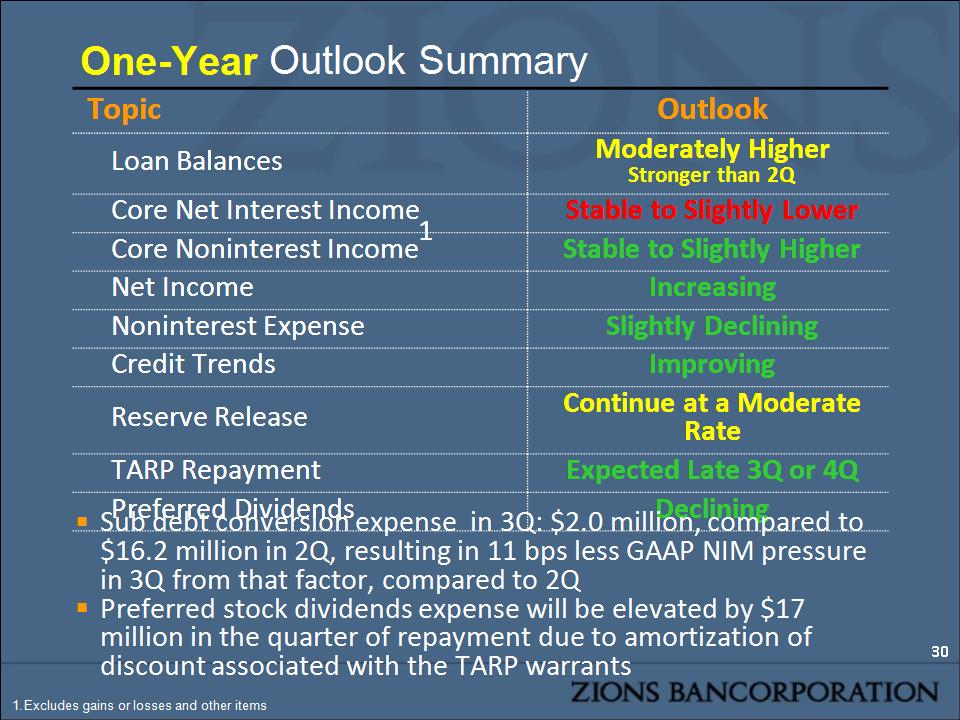
One-Year Outlook Summary Topic Outlook Loan Balances Moderately Higher Stronger than 2Q Core Net Interest Income Stable to Slightly Lower Core Noninterest Income1 Stable to Slightly Higher Net Income Increasing Noninterest Expense Slightly Declining Credit Trends Improving Reserve Release Continue at a Moderate Rate TARP Repayment Expected Late 3Q or 4Q Preferred Dividends Declining * Excludes gains or losses and other items Sub debt conversion expense in 3Q: $2.0 million, compared to $16.2 million in 2Q, resulting in 11 bps less GAAP NIM pressure in 3Q from that factor, compared to 2Q Preferred stock dividends expense will be elevated by $17 million in the quarter of repayment due to amortization of discount associated with the TARP warrants
Appendix
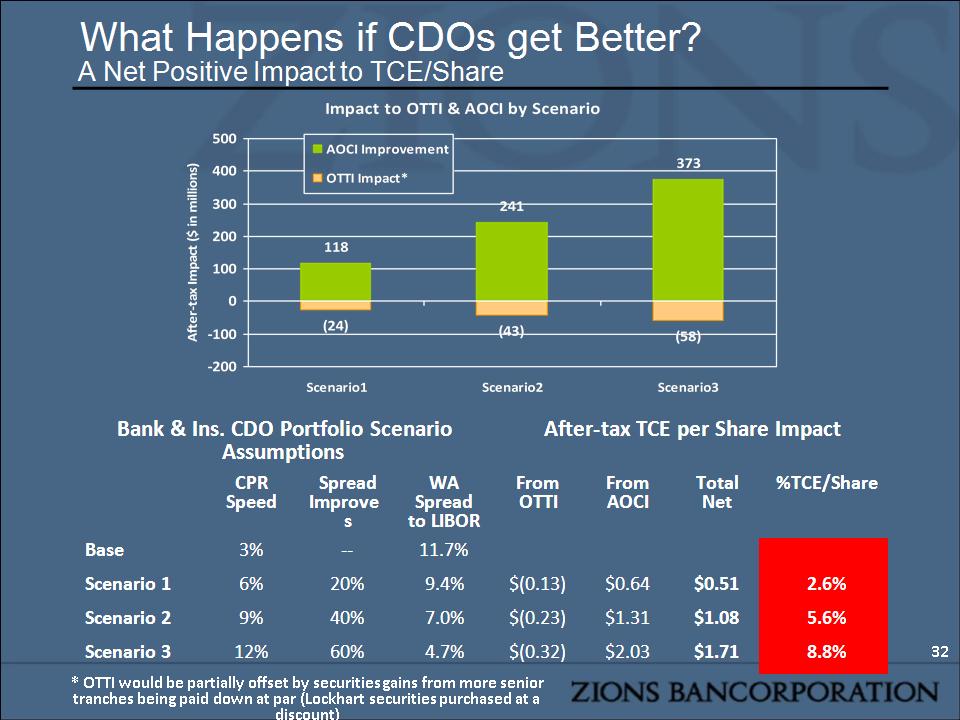
What Happens if CDOs get Better? A Net Positive Impact to TCE/Share Bank & Ins. CDO Portfolio Scenario Assumptions Bank & Ins. CDO Portfolio Scenario Assumptions Bank & Ins. CDO Portfolio Scenario Assumptions Bank & Ins. CDO Portfolio Scenario Assumptions After-tax TCE per Share Impact After-tax TCE per Share Impact After-tax TCE per Share Impact After-tax TCE per Share Impact CPR Speed Spread Improves WA Spread to LIBOR From OTTI From AOCI Total Net %TCE/Share Base 3% -- 11.7% Scenario 1 6% 20% 9.4% $(0.13) $0.64 $0.51 2.6% Scenario 2 9% 40% 7.0% $(0.23) $1.31 $1.08 5.6% Scenario 3 12% 60% 4.7% $(0.32) $2.03 $1.71 8.8% * * OTTI would be partially offset by securities gains from more senior tranches being paid down at par (Lockhart securities purchased at a discount)