Attached files
| file | filename |
|---|---|
| 8-K - LAYNE CHRISTENSEN COMPANY 8-K - LAYNE CHRISTENSEN CO | a50403244.htm |
Exhibit 99.1
Investor Presentation September 2012
Safe Harbor This presentation may contain forward‐looking statements within the meaning of Section 27A of the Securities Act of 1933 and Section 21E of the Exchange Act of 1934. Such statements may include, but are not limited to, statements of plans and objectives statements of future economic performance and statements of assumptions underlying such objectives, statements, and statements of management’s intentions, hopes, beliefs, expectations or predictions of the future. Forward‐looking statements can often be identified by the use of forward‐looking terminology, such as “should,” “intended,” “continue,” “believe,” “may,” “hope,” “anticipate,” “goal,” “forecast,” “plan,” “estimate” and similar words or phrases. Such statements are based on current expectations and are subject to certain risks, uncertainties and assumptions, including but not limited to: the outcome of the ongoing internal investigation into, among other things, the legality, under the FCPA and local laws, of certain payments to agents and other third parties interacting with government officials in certain countries in Africa relating to the payment of taxes and the importing of equipment (including any government enforcement action which could arise out of the matters under review or that the matters under review may have resulted in a higher dollar amount of payments or may have a greater financial or business impact than management currently anticipates), prevailing prices for various commodities, unanticipated slowdowns in the Company’s major markets, the availability of credit, the risks and uncertainties normally incident to the construction industry and exploration for and development and production of oil and gas, the impact of competition, the effectiveness of operational changes expected to increase efficiency and productivity, worldwide economic and political conditions and foreign currency fluctuations that may affect worldwide results of operations. Should one or more of these risks or uncertainties materialize, or should underlying assumptions prove incorrect, actual results may vary materially and adversely from those anticipated, estimated or projected. These forward-looking statements are made as of the date of this presentation and the Company assumes no obligation to update such forward‐looking statements or to update the reasons why actual results could differ materially from those anticipated in such forward‐looking statements. 2
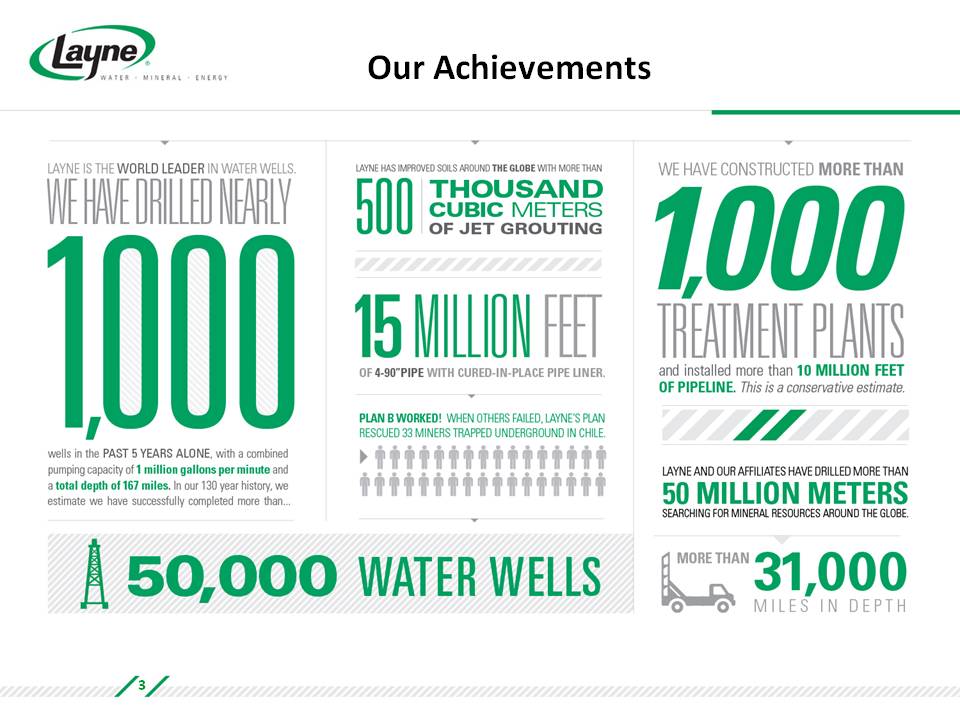
Our Achievements 3
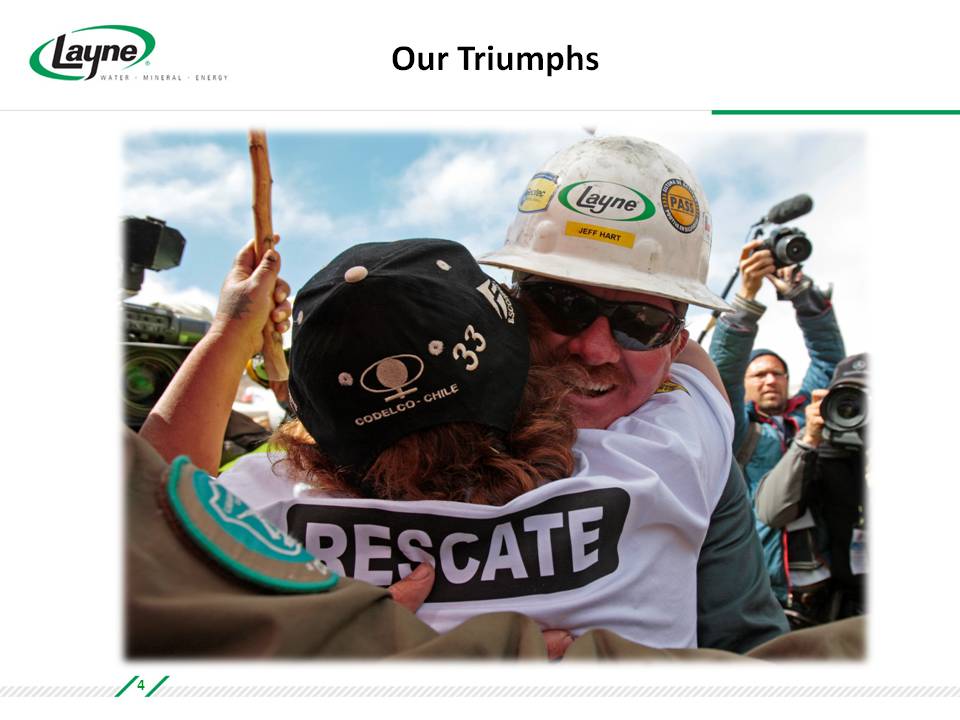
Our Triumphs 4
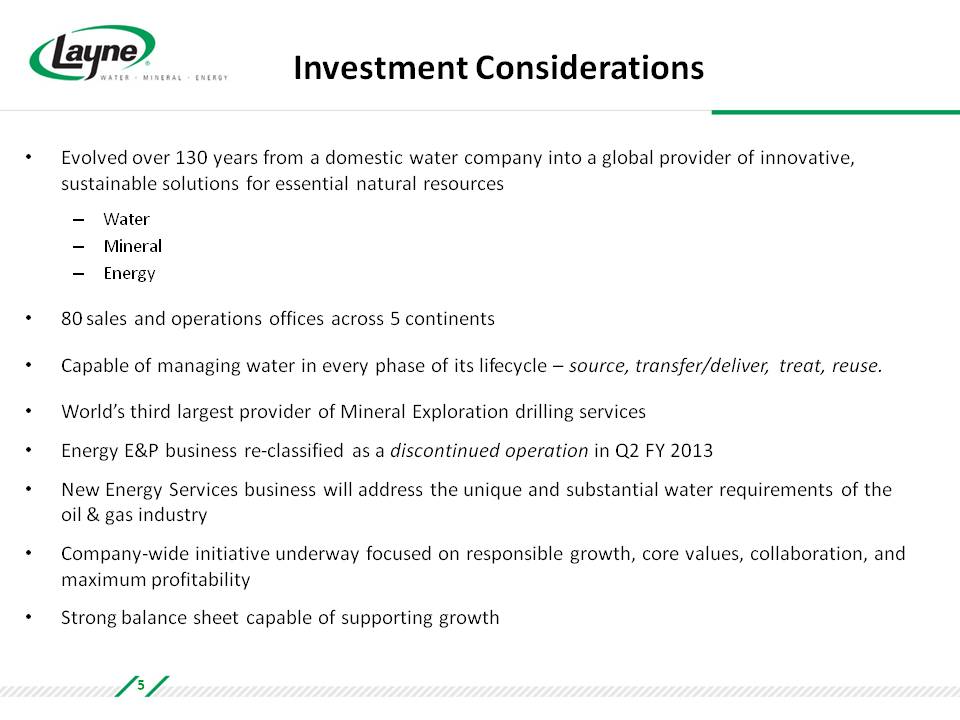
Investment Considerations Evolved over 130 years from a domestic water company into a global provider of innovative, sustainable solutions for essential natural resources Water Mineral Energy 80 sales and operations offices across 5 continents Capable of managing water in every phase of its lifecycle – source, transfer/deliver, treat, reuse. World’s third largest provider of Mineral Exploration drilling services Energy E&P business re‐classified as a discontinued operation in Q2 FY 2013 New Energy Services business will address the unique and substantial water requirements of the oil & gas industry Company‐wide initiative underway focused on responsible growth, core values, collaboration, and maximum profitability Strong balance sheet capable of supporting growth 5
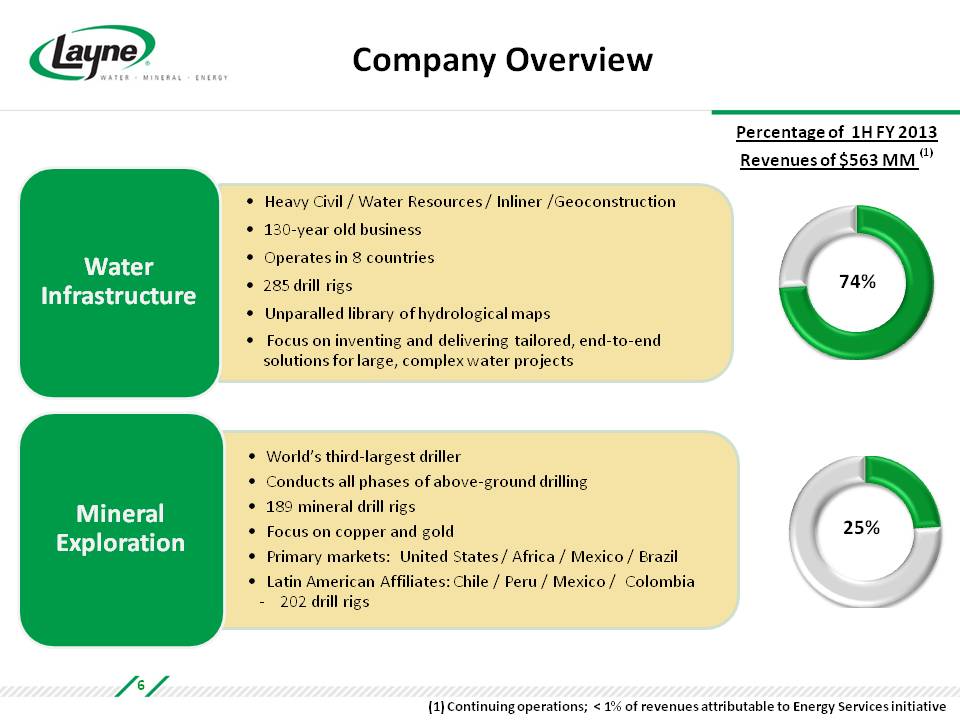
Company Overview Water Infrastructure Heavy Civil / Water Resources / Inliner /Geoconstruction 130‐year old business Operates in 8 countries 285 drill rigs Unparalled library of hydrological maps Focus on inventing and delivering tailored, end‐to‐end solutions for large, complex water projects Mineral Exploration World’s third‐largest driller Conducts all phases of above‐ground drilling 189 mineral drill rigs Focus on copper and gold Primary markets: United States / Africa / Mexico / Brazil Latin American Affiliates: Chile / Peru / Mexico / Colombia 202 drill rigs Percentage of 1H FY 2013 Revenues of $563 MM (1) 74% 25% (1) Continuing operations; < 1% of revenues attributable to Energy Services initiative 6
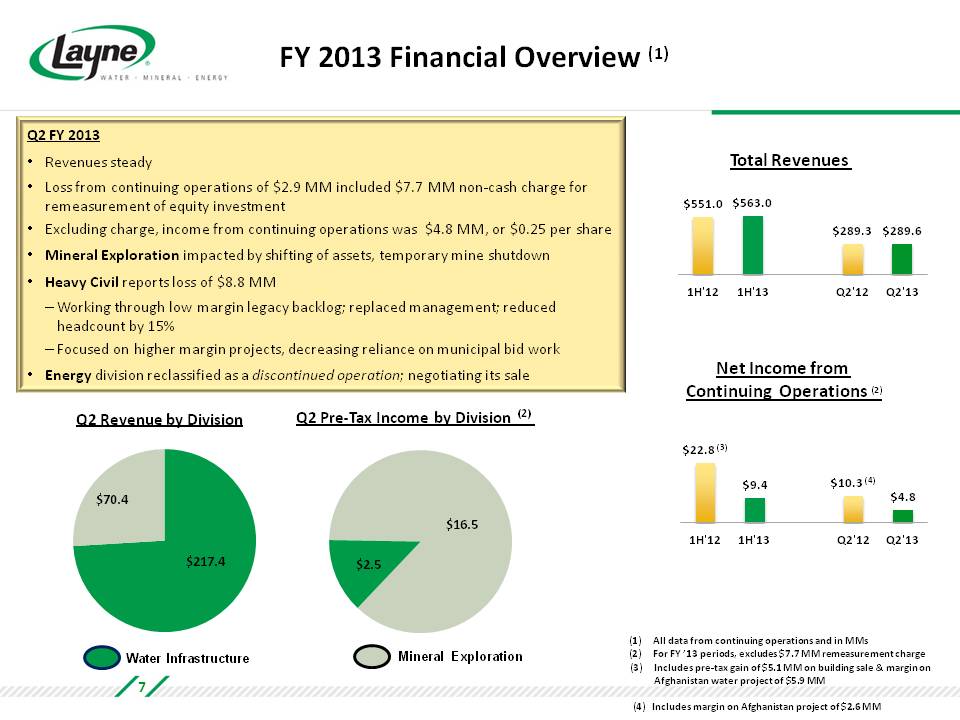
FY 2013 Financial Overview (1) Q2 FY 2013 Revenues steady Loss from continuing operations of $2.9 MM included $7.7 MM non‐cash charge for remeasurement of equity investment Excluding charge, income from continuing operations was $4.8 MM, or $0.25 per share Mineral Exploration impacted by shifting of assets, temporary mine shutdown Heavy Civil reports loss of $8.8 MM Working through low margin legacy backlog; replaced management; reduced headcount by 15% Focused on higher margin projects, decreasing reliance on municipal bid work Energy division reclassified as a discontinued operation; negotiating its sale Total Revenues $551.0 $563.0 $289.3 $289.6 1H'12 1H'13 Q2'12 Q2'13 Net Income from Continuing Operations (2) $22.8 (3) $9.4 $10.3 (4) $4.8 1H'12 1H'13 Q2'12 Q2'13 Q2 Revenue by Division Q2 Pre‐Tax Income by Division(2) $70.4 $217.4 Water Infrastructure Mineral Exploration $2.5 $16.5 (1) All data from continuing operations and in MMs (2) For FY ’13 periods, excludes $7.7 MM remeasurement charge (3) Includes pre‐tax gain of $5.1 MM on building sale & margin on Afghanistan water project of $5.9 MM (4) Includes margin on Afghanistan project of $2.6 MM 7
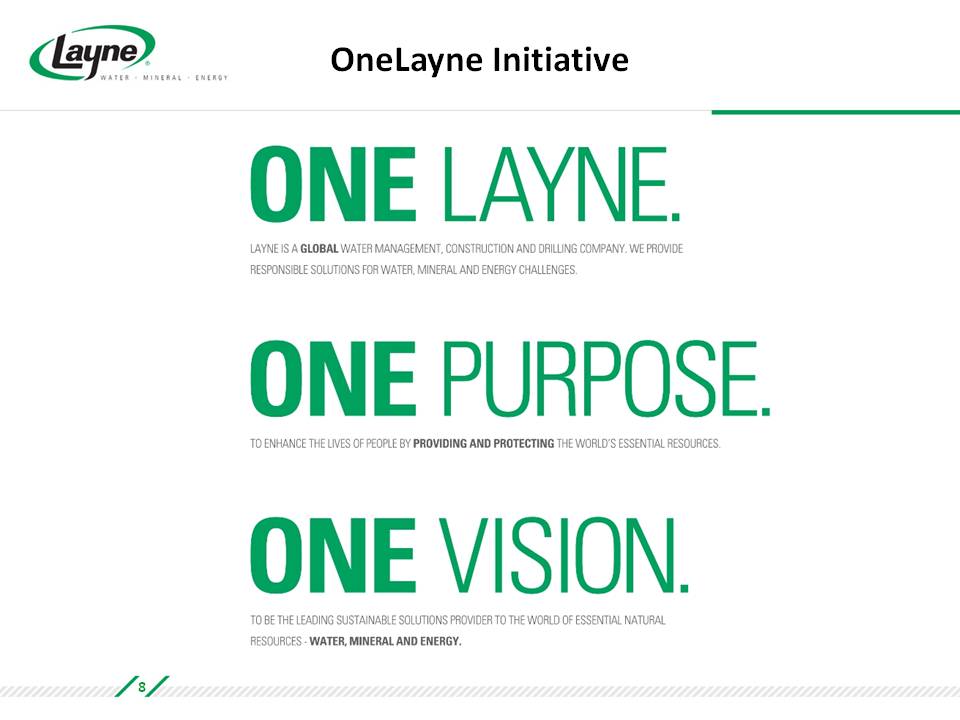
OneLayne Initiative ONE LAYNE. ONE PURPOSE. ONE VISION. 8
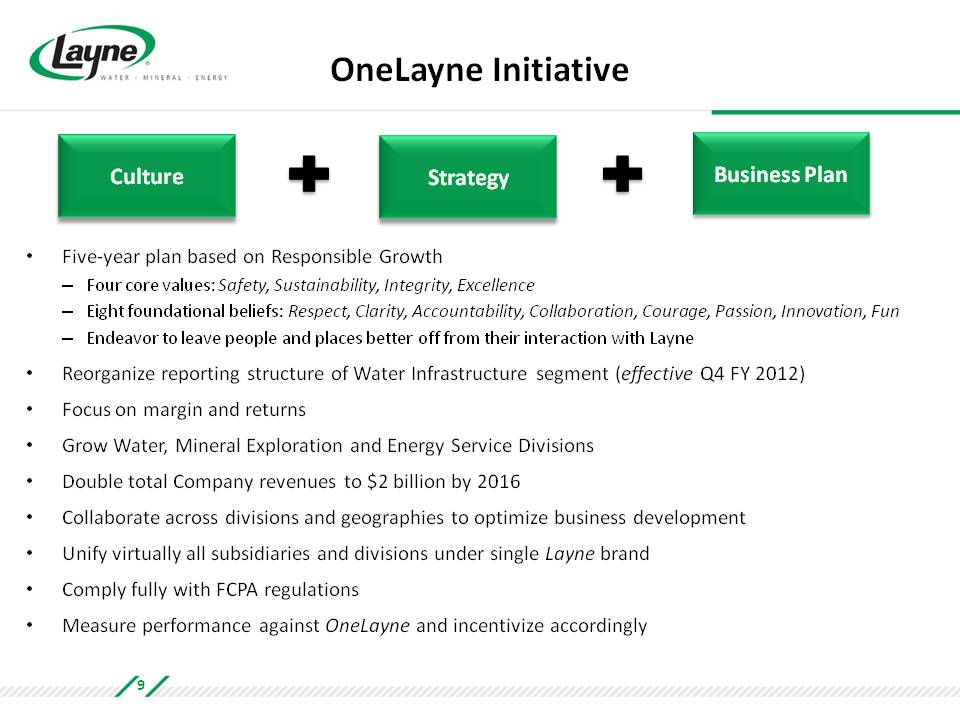
OneLayne Initiative Culture Strategy Business Plan Five‐year plan based on Responsible Growth Four core values: Safety, Sustainability, Integrity, Excellence Eight foundational beliefs: Respect, Clarity, Accountability, Collaboration, Courage, Passion, Innovation, Fun Endeavor to leave people and places better off from their interaction with Layne Reorganize reporting structure of Water Infrastructure segment (effective Q4 FY 2012) Focus on margin and returns Grow Water, Mineral Exploration and Energy Service Divisions Double total Company revenues to $2 billion by 2016 Collaborate across divisions and geographies to optimize business development Unify virtually all subsidiaries and divisions under single Layne brand Comply fully with FCPA regulations Measure performance against OneLayne and incentivize accordingly 9
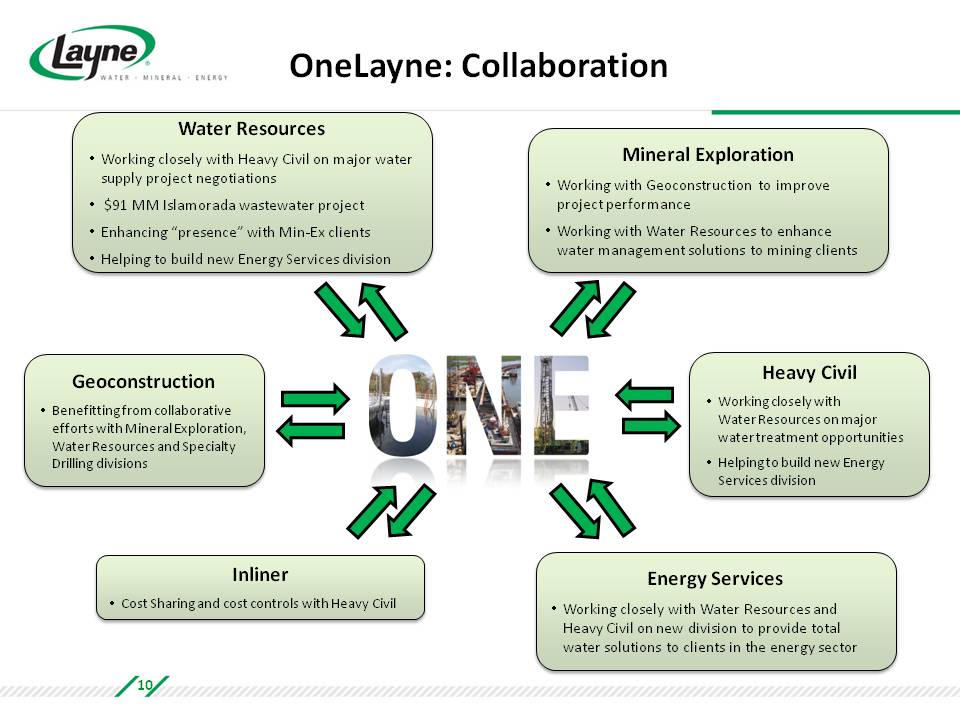
OneLayne: Collaboration Water Resources Working closely with Heavy Civil on major water supply project negotiations $91 MM Islamorada wastewater project Enhancing “presence” with Min‐Ex clients Helping to build new Energy Services division Mineral Exploration Working with Geoconstruction to improve project performance Working with Water Resources to enhance water management solutions to mining clients Geoconstruction Benefitting from collaborative efforts with Mineral Exploration, Water Resources and Specialty Drilling divisions Heavy Civil Working closely with Water Resources on major water treatment opportunities Helping to build new Energy Services division Inliner Cost Sharing and cost controls with Heavy Civil Energy Services Working closely with Water Resources and Heavy Civil on new division to provide total water solutions to clients in the energy sector 10
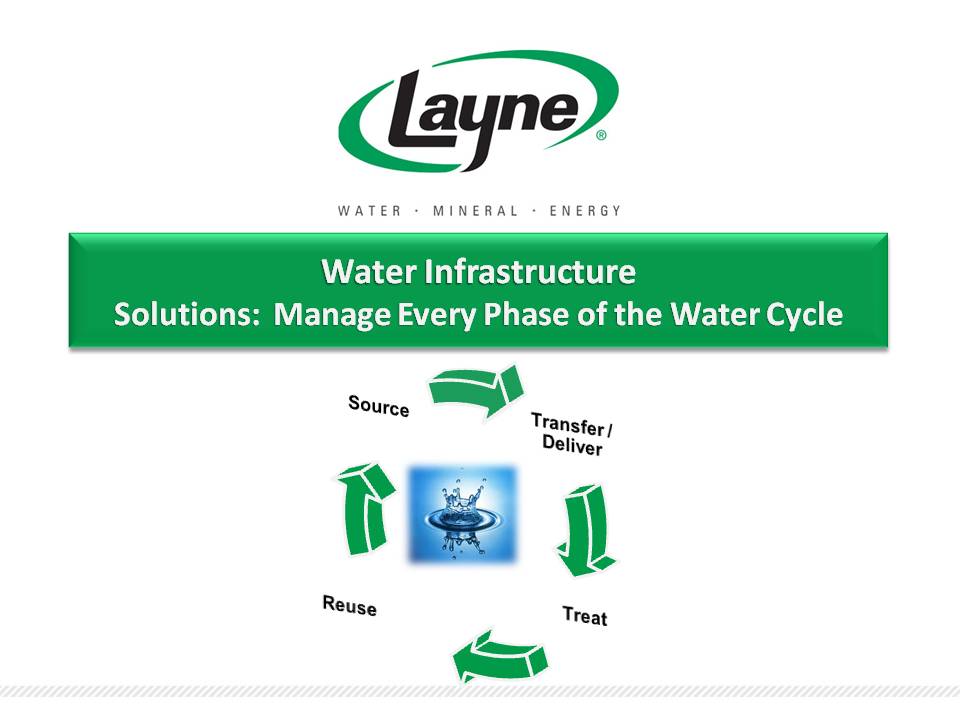
Water Infrastructure Solutions: Manage Every Phase of the Water Cycle Source Transfer / Deliver Treat Reuse
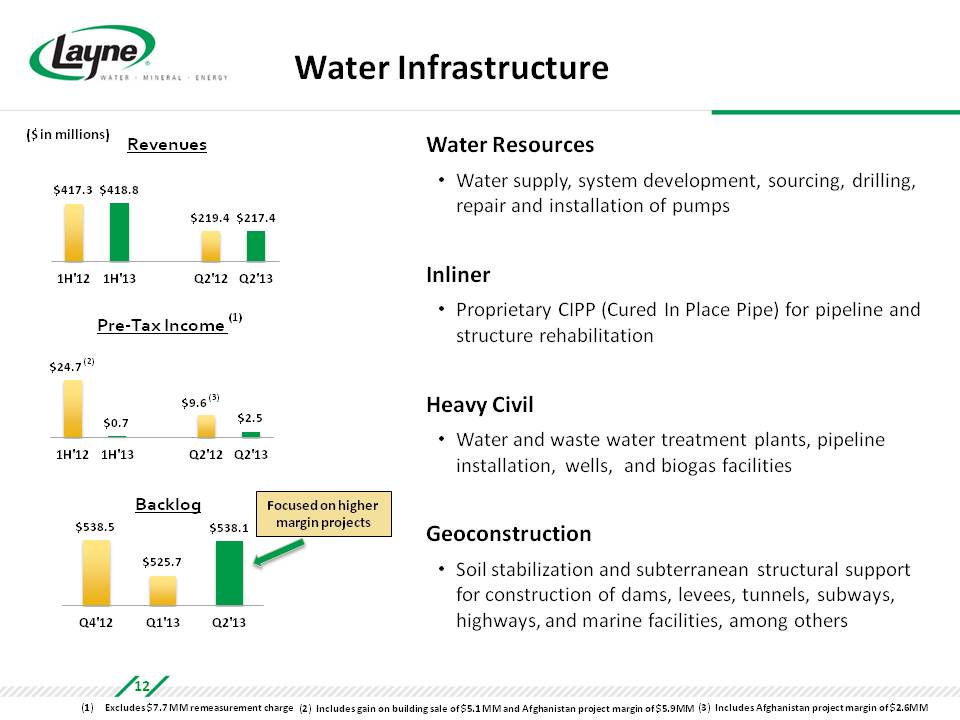
Water Infrastructure Water Resources Water supply, system development, sourcing, drilling, repair and installation of pumps Inliner Proprietary CIPP (Cured In Place Pipe) for pipeline and structure rehabilitation Heavy Civil Water and waste water treatment plants, pipeline installation, wells, and biogas facilities Geoconstruction Soil stabilization and subterranean structural support for construction of dams, levees, tunnels, subways, highways, and marine facilities, among others ($ in millions) Revenues $417.3 $418.8 $219.4 $217.4 1H'12 1H'13 Q2'12 Q2'13 Pre‐Tax Income (1) $24.7 (2) $0.7 $9.6 (3) $2.5 1H'12 1H'13 Q2'12 Q2'13 Backlog Focused on higher margin projects $538.5 $525.7 $538.1 Q4'12 Q1'13 Q2'13 (1) Excludes $7.7 MM remeasurement charge (2) Includes gain on building sale of $5.1 MM and Afghanistan project margin of $5.9MM (3) Includes Afghanistan project margin of $2.6MM 12
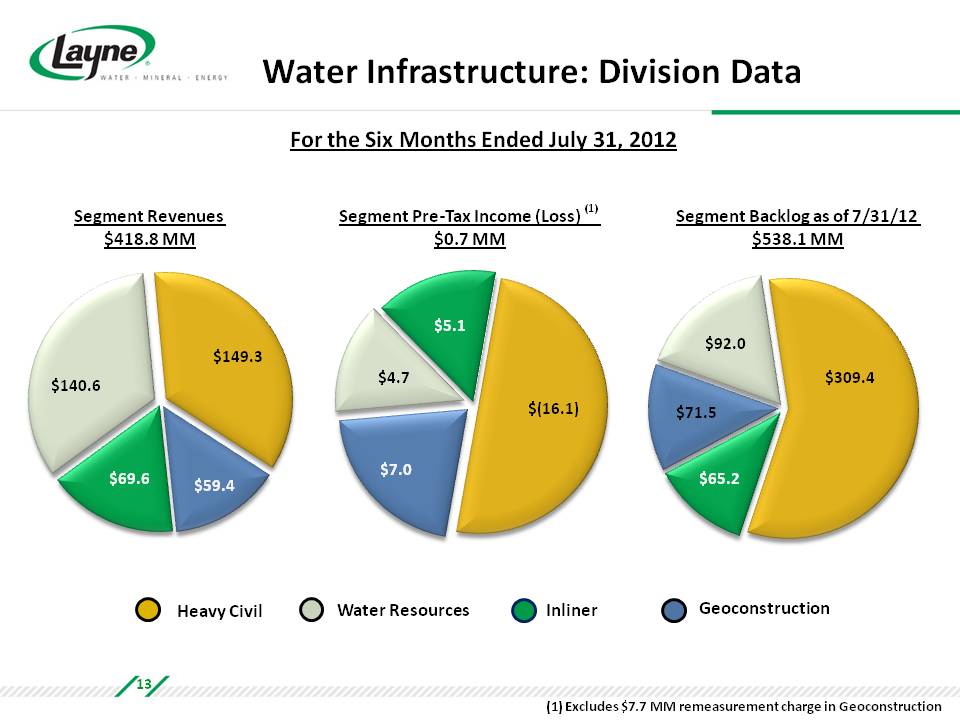
Water Infrastructure: Division Data For the Six Months Ended July 31, 2012 Segment Revenues $418.8 MM Segment Pre‐Tax Income (Loss) (1) $0.7 MM Segment Backlog as of 7/31/12 $538.1 MM $140.6 $149.3 $69.6 $59.4 $4.7 $5.1 $7.0 $(16.1) $71.5 $92.0 $65.2 $309.4 Heavy Civil Water Resources Inliner Geoconstruction (1) Excludes $7.7 MM remeasurement charge in Geoconstruction 13
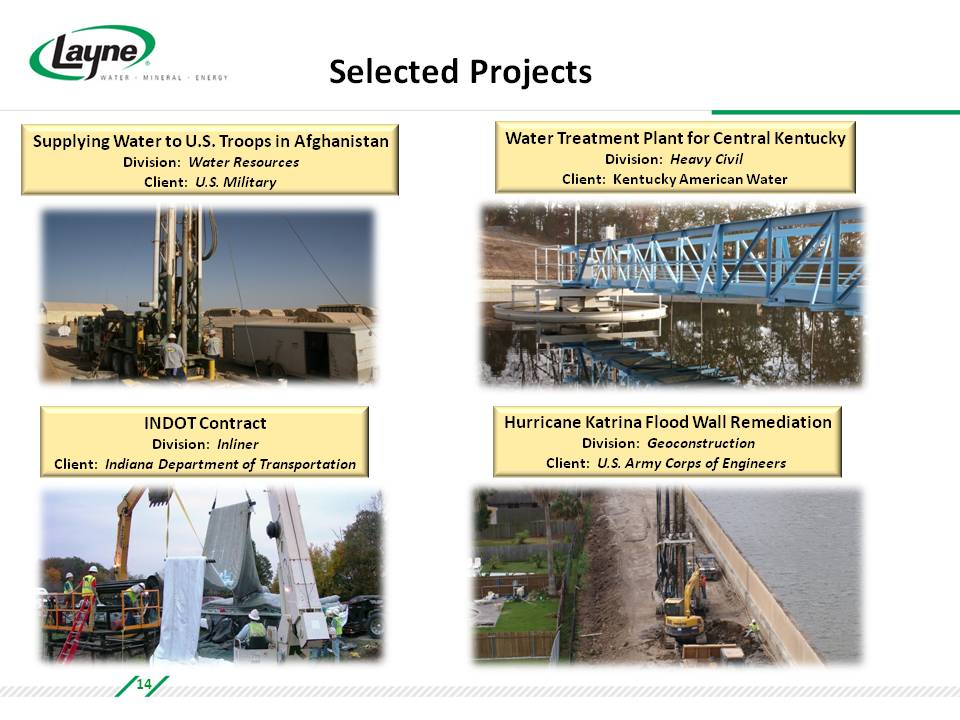
Selected Projects Supplying Water to U.S. Troops in Afghanistan Division: Water Resources Client: U.S. Military Water Treatment Plant for Central Kentucky Division: Heavy Civil Client: Kentucky American Water INDOT Contract Division: Inliner Client: Indiana Department of Transportation Hurricane Katrina Flood Wall Remediation Division: Geoconstruction Client: U.S. Army Corps of Engineers 14
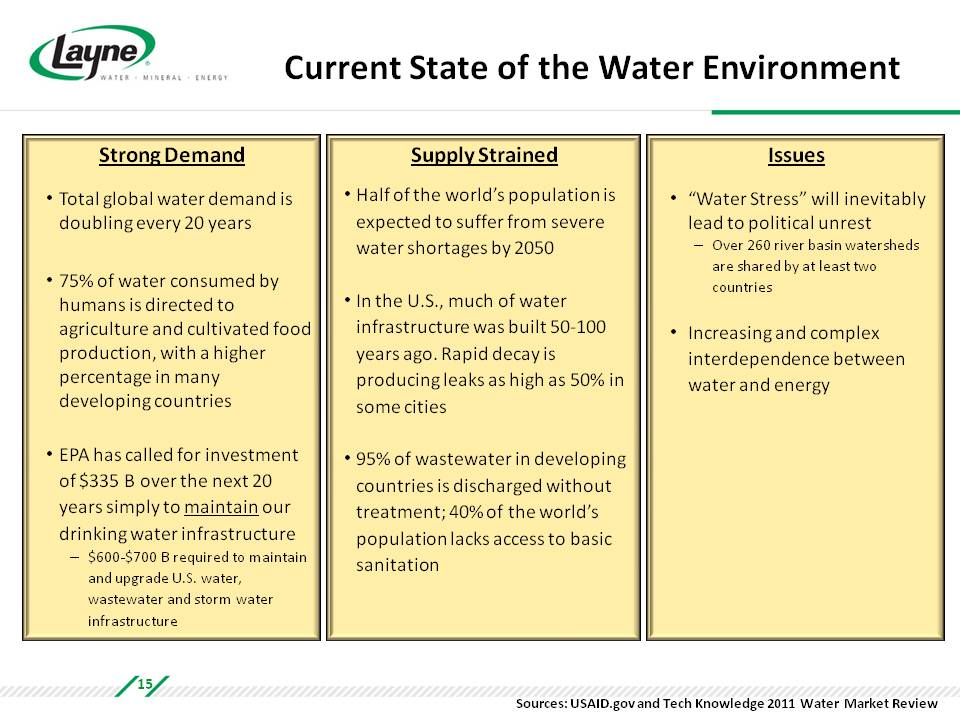
Current State of the Water Environment Strong Demand Total global water demand is doubling every 20 years 75% of water consumed by humans is directed to agriculture and cultivated food production, with a higher percentage in many developing countries EPA has called for investment of $335 B over the next 20 years simply to maintain our drinking water infrastructure $600‐$700 B required to maintain and upgrade U.S. water, wastewater and storm water infrastructure Supply Strained Half of the world’s population is expected to suffer from severe water shortages by 2050 In the U.S., much of water infrastructure was built 50‐100 years ago. Rapid decay is producing leaks as high as 50% in some cities 95% of wastewater in developing countries is discharged without treatment; 40% of the world’s population lacks access to basic sanitation Issues “Water Stress” will inevitably lead to political unrest Over 260 river basin watersheds are shared by at least two countries Increasing and complex interdependence between water and energy Sources: USAID.gov and Tech Knowledge 2011 Water Market Review 15
Acquisition of Remaining Interest in Costa Fortuna One of South America’s largest providers of specialty foundation and specialized marine geotechnical services Layne acquired remaining 50% interest in May 2012; initial 50% interest acquired July 2010 Remeasured previous 50% interest; realized $7.7 million non‐cash charge in Q2 FY 2013 Total investment of $34.3 million and $9 million of assumed debt Backlog at July 31, 2012 = $36.9 million For CY 2011, Costa Fortuna generated: Revenues = $49.5 million Net income = $7.8 million EBITDA = $13.9 million In Q2 FY 2013, Costa Fortuna contributed $5.1 million of revenue and $2.3 million of pre‐tax income Serving growing markets Average construction growth of the Central and South American regions ~ 5.8% annually for the next 5 years and 3.9% annually for the rest of the decade Estimated $100 billion Brazilian construction market (next 5 years) The FIFA World Cup games in 2014 and the Olympic Games in 2016 will contribute substantial investment in market opportunities Source: Global Construction Perspectives 16
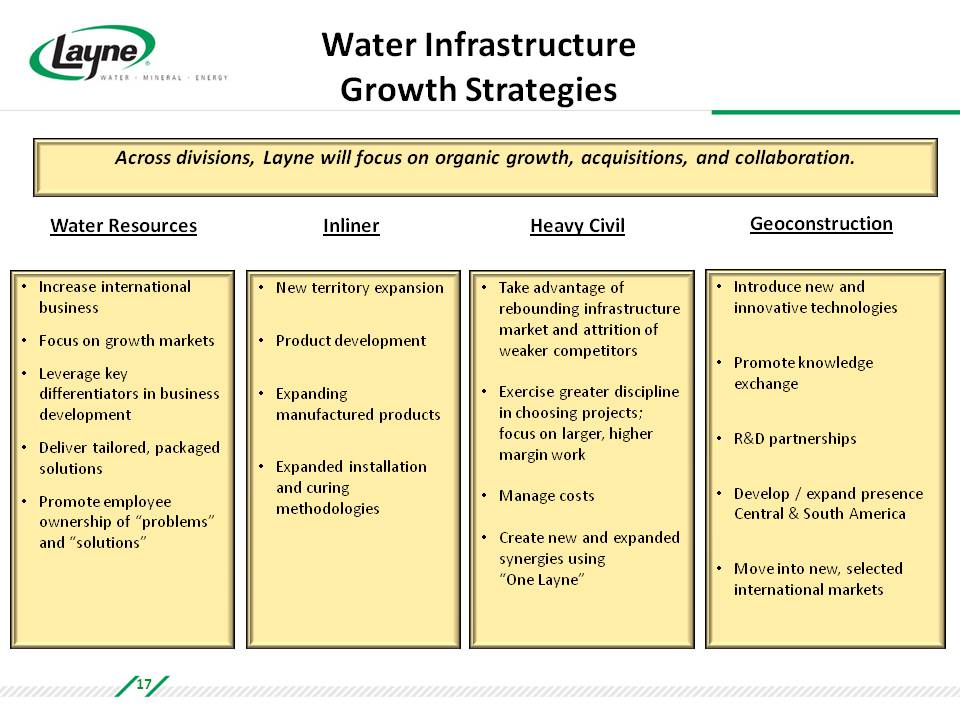
Water Infrastructure Growth Strategies Across divisions, Layne will focus on organic growth, acquisitions, and collaboration. Water Resources Inliner Heavy Civil Geoconstruction Increase international business Focus on growth markets Leverage key differentiators in business development Deliver tailored, packaged solutions Promote employee ownership of “problems” and “solutions” New territory expansion Product development Expanding manufactured products Expanded installation and curing methodologies Take advantage of rebounding infrastructure market and attrition of weaker competitors Exercise greater discipline in choosing projects; focus on larger, higher margin work Manage costs Create new and expanded synergies using “One Layne” Introduce new and innovative technologies Promote knowledge exchange R&D partnerships Develop / expand presence Central & South America Move into new, selected international markets 17
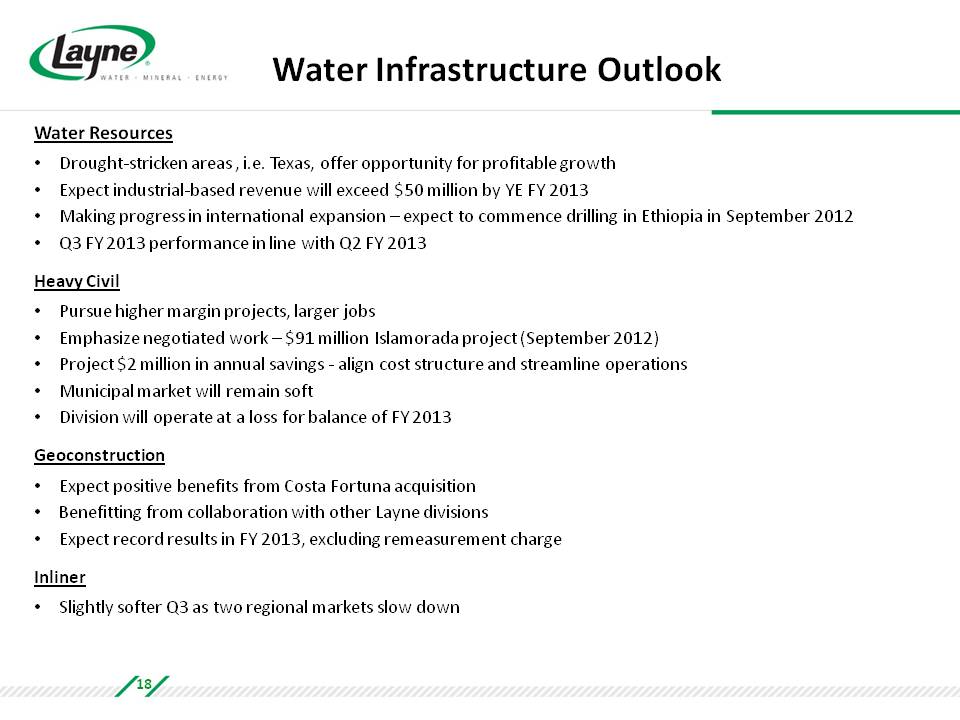
Water Infrastructure Outlook Water Resources Drought‐stricken areas , i.e. Texas, offer opportunity for profitable growth Expect industrial‐based revenue will exceed $50 million by YE FY 2013 Making progress in international expansion – expect to commence drilling in Ethiopia in September 2012 Q3 FY 2013 performance in line with Q2 FY 2013 Heavy Civil Pursue higher margin projects, larger jobs Emphasize negotiated work – $91 million Islamorada project (September 2012) Project $2 million in annual savings ‐ align cost structure and streamline operations Municipal market will remain soft Division will operate at a loss for balance of FY 2013 Geoconstruction Expect positive benefits from Costa Fortuna acquisition Benefitting from collaboration with other Layne divisions Expect record results in FY 2013, excluding remeasurement charge Inliner Slightly softer Q3 as two regional markets slow down 18
Mineral Exploration Full Spectrum Mineral Exploration Drilling Services
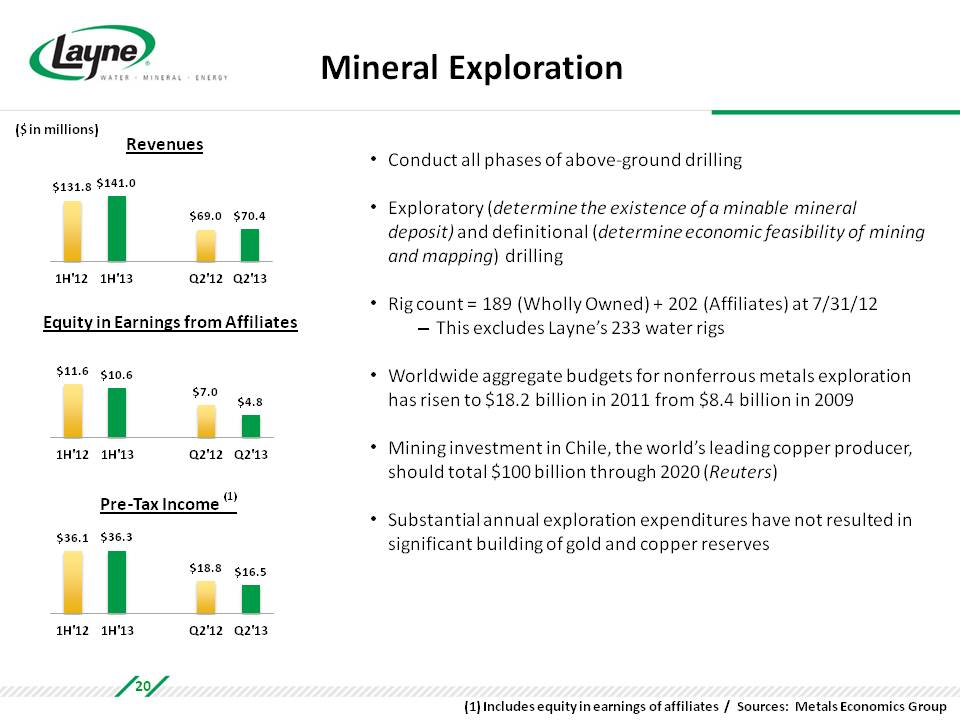
Mineral Exploration Conduct all phases of above‐ground drilling Exploratory (determine existence of a minable mineral deposit) and definitional (determine economic feasibility of mining and mapping) drilling Rig count = 189 (Wholly Owned) + 202 (Affiliates) at 7/31/12 This excludes Layne’s 233 water rigs Worldwide aggregate budgets for nonferrous metals exploration has risen to $18.2 billion in 2011 from $8.4 billion in 2009 Mining investment in Chile, the world’s leading copper producer, should total $100 billion through 2020 (Reuters) Substantial annual exploration expenditures have not resulted in significant building of gold and copper reserves ($ in millions) Revenues $131.8 $141.0 $69.0 $70.4 1H'12 1H'13 Q2'12 Q2'13 Equity in Earnings from Affiliates $11.6 $10.6 $7.0 $4.8 1H'12 1H'13 Q2'12 Q2'13 Pre‐Tax Income (1) $36.1 $36.3 $18.8 $16.5 1H'12 1H'13 Q2'12 Q2'13 (1) Includes equity in earnings of affiliates / Sources: Metals Economics Group 20
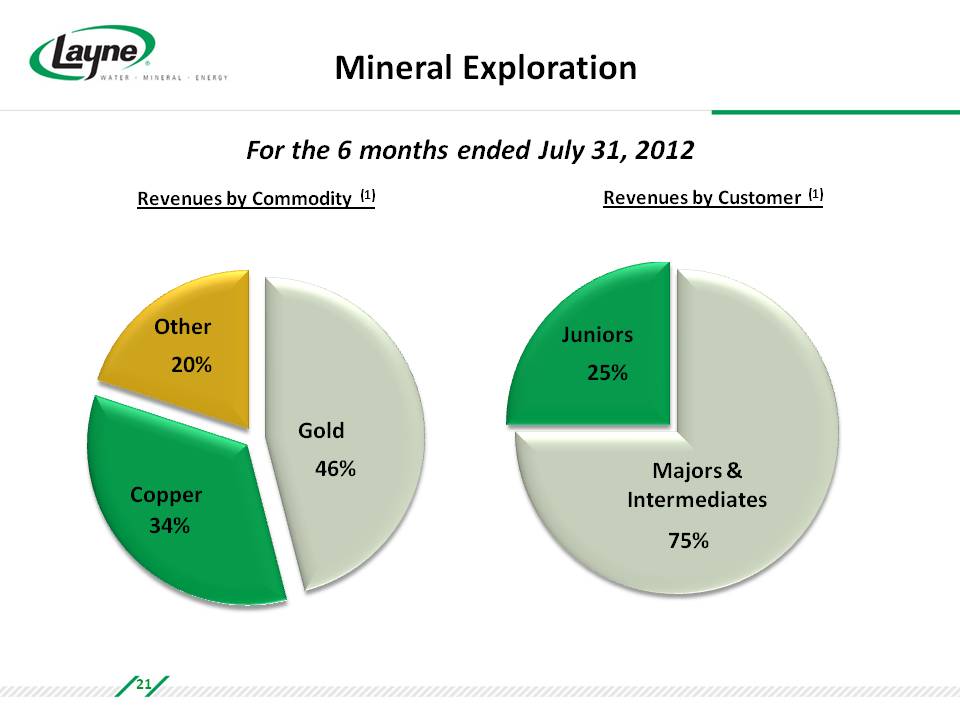
Mineral Exploration For the 6 months ended July 31, 2012 Revenues by Commodity (1) Revenues by Customer (1) Other 20% Copper 34% Gold 46% Juniors 25% Majors & Intermediates 75% 21
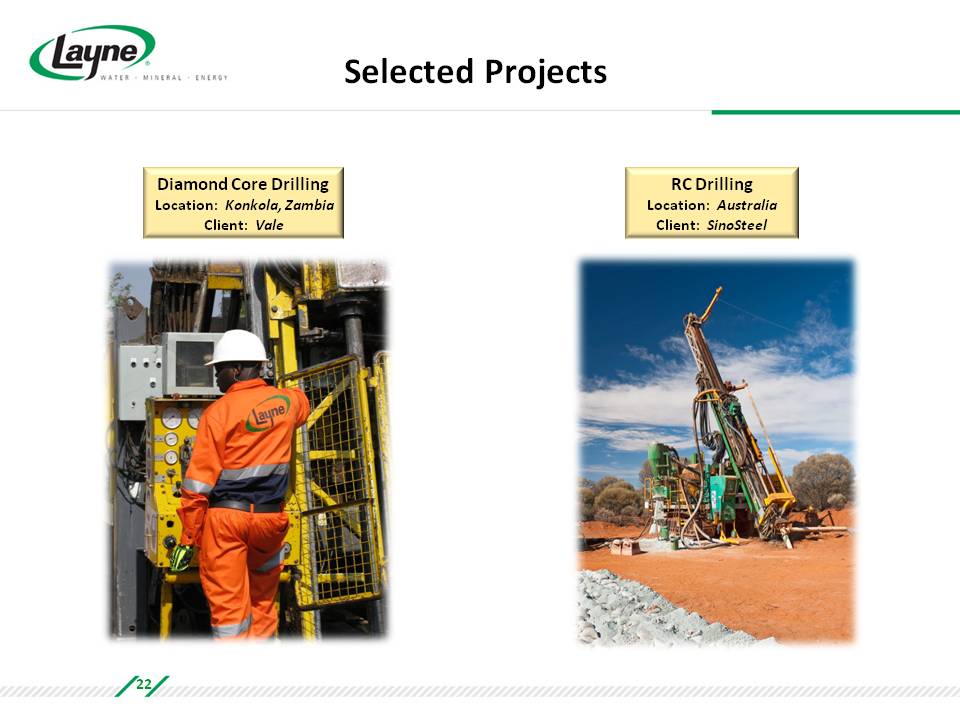
Selected Projects Diamond Core Drilling Location: Konkola, Zambia Client: Vale RC Drilling Location: Australia Client: SinoSteel 22
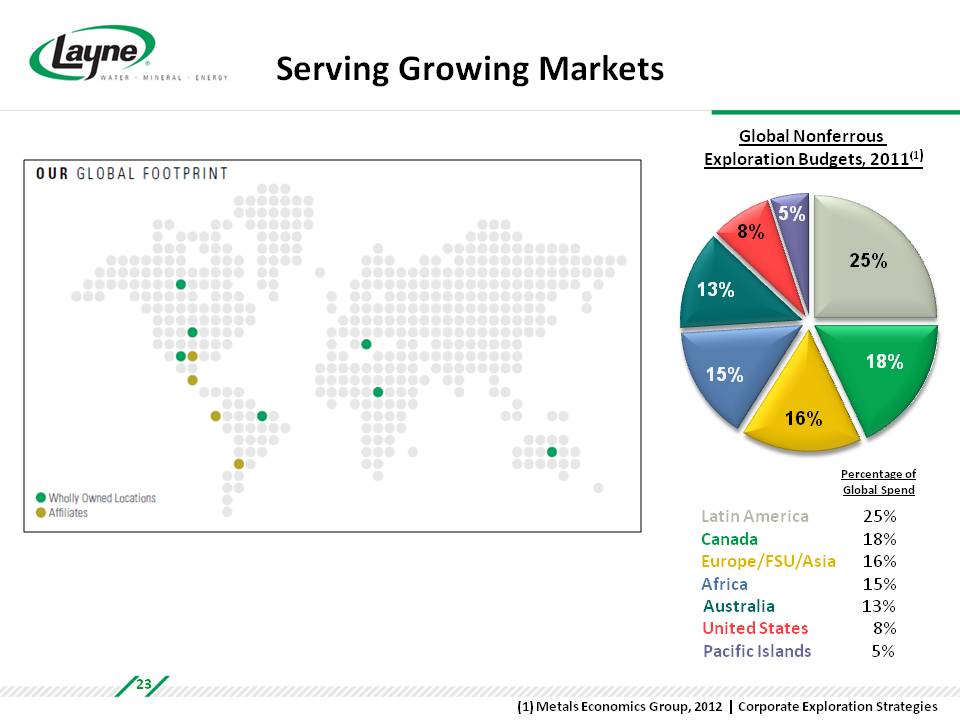
Serving Growing Markets Global Nonferrous Exploration Budgets, 2011(1) 25% 18% 16% 15% 13% 8% 5% Percentage of Global Spend Latin America 25% Canada 18% Europe/FSU/Asia 16% Africa 15% Australia 13% United States 8% Pacific Islands 5% (1) Metals Economics Group, 2012 | Corporate Exploration Strategies 23
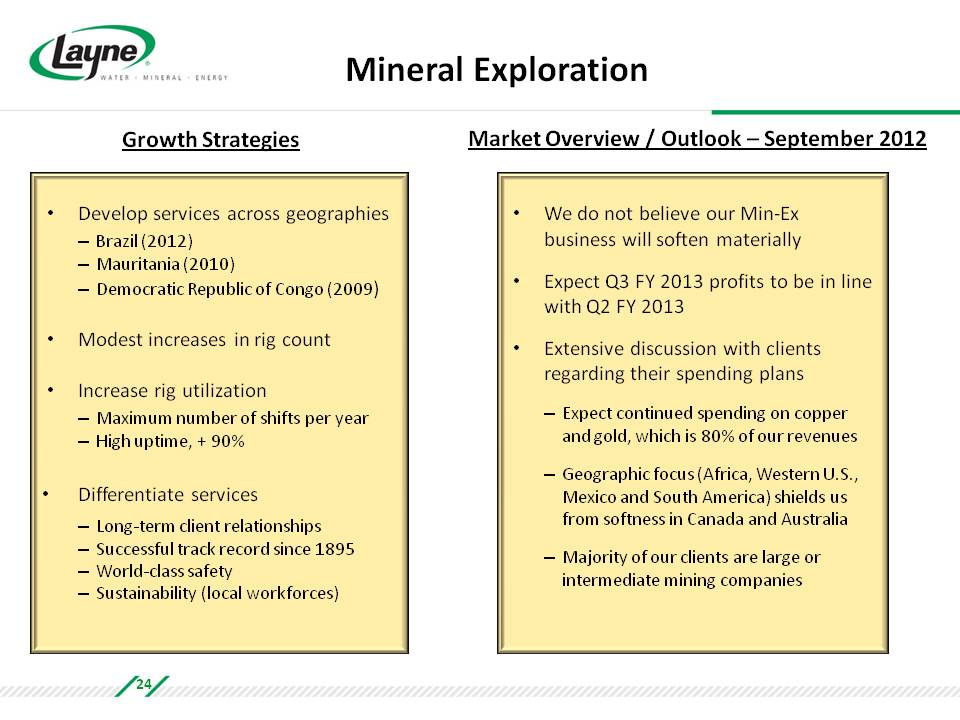
Mineral Exploration Growth Strategies Market Overview / Outlook – September 2012 Develop services across geographies Brazil (2012) Mauritania (2010) Democratic Republic of Congo (2009) Modest increases in rig count Increase rig utilization Maximum number of shifts per year High uptime, + 90% Differentiate services Long‐term client relationships Successful track record since 1895 World‐class safety Sustainability (local workforces) We do not believe our Min‐Ex business will soften materially Expect Q3 FY 2013 profits to be in line with Q2 FY 2013 Extensive discussion with clients regarding their spending plans Expect continued spending on copper and gold, which is 80% of our revenues Geographic focus (Africa, Western U.S., Mexico and South America) shields us from softness in Canada and Australia Majority of our clients are large or intermediate mining companies 24
Energy An Evolving Focus
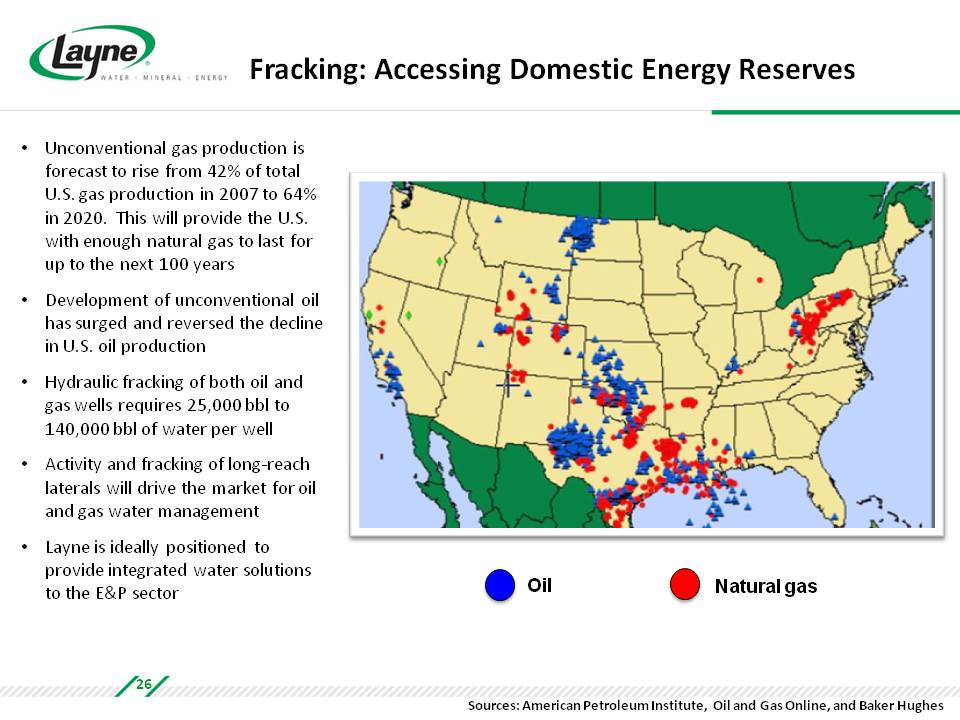
Fracking: Accessing Domestic Energy Reserves Unconventional gas production is forecast to rise from 42% of total U.S. gas production in 2007 to 64% in 2020. This will provide the U.S. with enough natural gas to last for up to the next 100 years Development of unconventional oil has surged and reversed the decline in U.S. oil production Hydraulic fracking of both oil and gas wells requires 25,000 bbl to 140,000 bbl of water per well Activity and fracking of long‐reach laterals will drive the market for oil and gas water management Layne is ideally positioned to provide integrated water solutions to the E&P sector Oil Natural gas Sources: American Petroleum Institute, Oil and Gas Online, and Baker Hughes 26
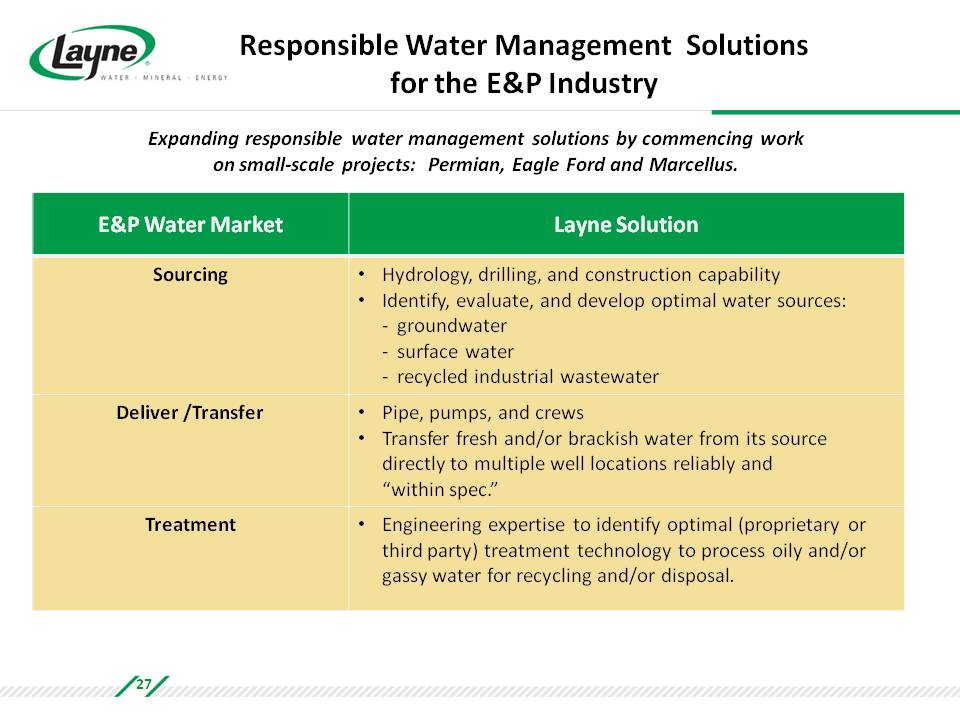
Responsible Water Management Solutions for the E&P Industry Expanding responsible water management solutions by commencing work on small‐scale projects: Permian, Eagle Ford and Marcellus. E&P Water Market Layne Solution Sourcing Hydrology, drilling, and construction capability Identify, evaluate, and develop optimal water sources: groundwater surface water recycled industrial wastewater Deliver /Transfer Pipe, pumps, and crews Transfer fresh and/or brackish water from its source directly to multiple well locations reliably and “within spec.” Treatment Engineering expertise to identify optimal (proprietary or third party) treatment technology to process oily and/or gassy water for recycling and/or disposal. 27
Appendix Financials
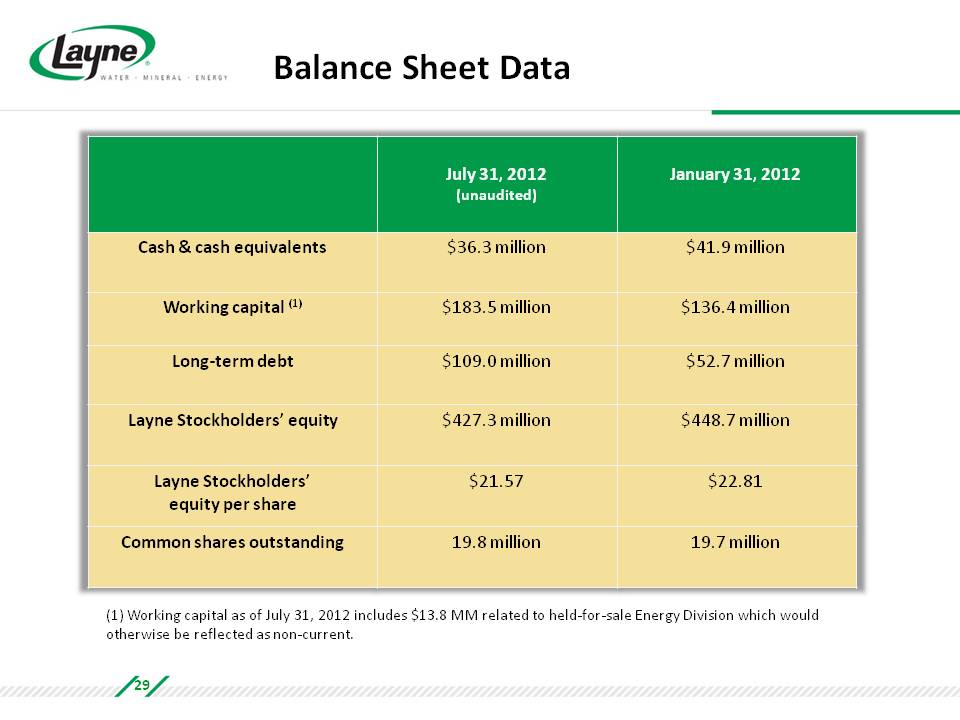
Balance Sheet Data July 31, 2012 (unaudited) January 31, 2012 Cash & cash equivalents $36.3 million $41.9 million Working capital (1) $183.5 million $136.4 million Long‐term debt $109.0 million $52.7 million Layne Stockholders’ equity $427.3 million $448.7 million Layne Stockholders’ equity per share $21.57 $22.81 Common shares outstanding 19.8 million 19.7 million (1) Working capital as of July 31, 2012 includes $13.8 MM related to held‐for‐sale Energy Division which would otherwise be reflected as non‐current. 29
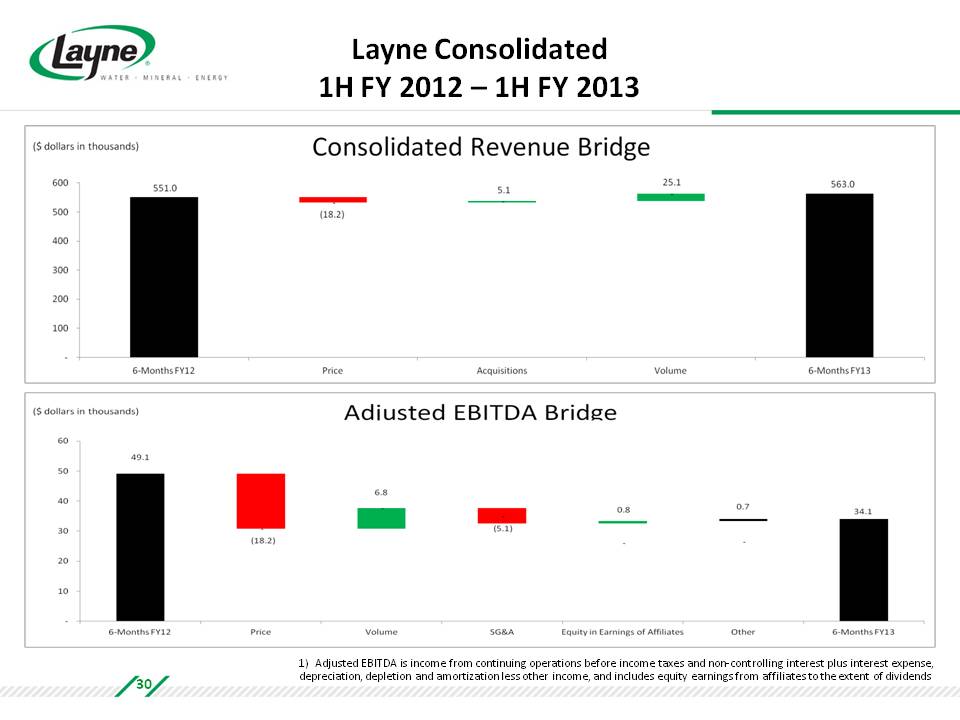
Layne Consolidated 1H FY 2012 – 1H FY 2013 Consolidated Revenue Bridge ($ dollars in thousands) 600 500 400 300 200 100 – 6-Months FY12 Price Acquisitions Volume 6-Months FY13 551.0 (18.2) 5.1 25.1 563.0 Adjusted EBITDA Bridge ($ dollars in thousands) 60 50 40 30 20 10 – 6-Months FY12 Price Volume SG&A Equity in Earnings of Affiliates Other 6-Months FY13 49.1 (18.2) 6.8 (5.1) 0.8 0.7 34.1 1) Adjusted EBITDA is income from continuing operations before income taxes and non‐controlling interest plus interest expense, depreciation, depletion and amortization less other income, and includes equity earnings from affiliates to the extent of dividends 30
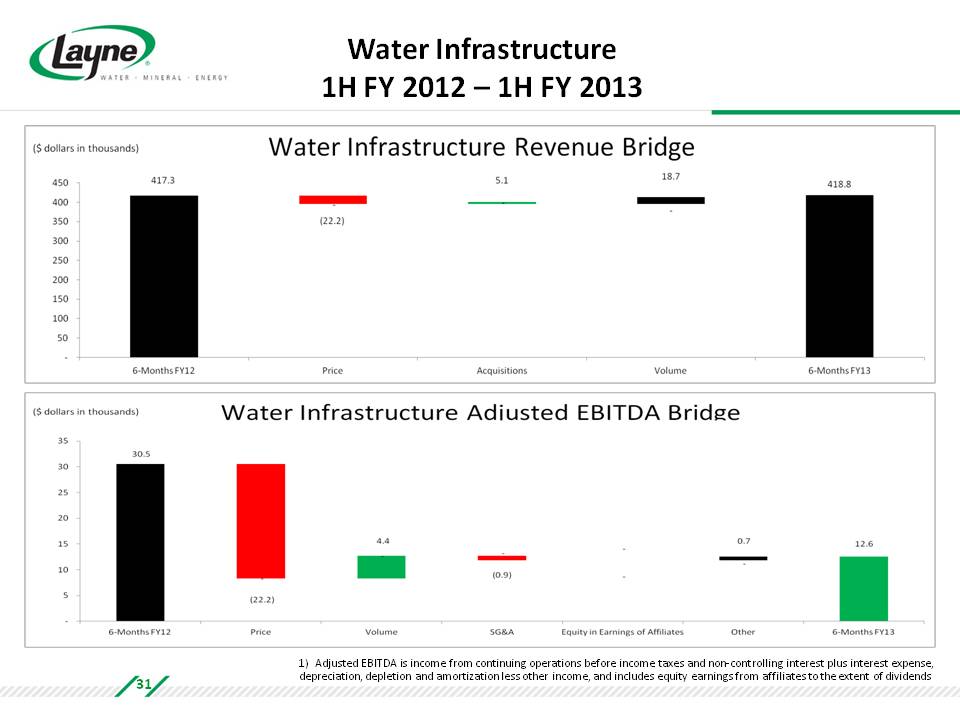
Water Infrastructure 1H FY 2012 – 1H FY 2013 Water Infrastructure Revenue Bridge ($ dollars in thousands) 450 400 350 300 250 200 150 100 50 - 6-Months FY12 Price Acquisitions Volume 6-Months FY13 417.3 (22.2) 5.1 18.7 418.8 Water Infrastructure Adjusted EBITDA Bridge ($ dollars in thousands) 35 30 25 20 15 10 5 - 6-Months FY12 Price Volume SG&A Equity in Earnings of Affiliates Other 6-Months FY13 30.5 (22.2) 4.4 (0.9) – 0.7 12.6 1) Adjusted EBITDA is income from continuing operations before income taxes and non‐controlling interest plus interest expense, depreciation, depletion and amortization less other income, and includes equity earnings from affiliates to the extent of dividends 31
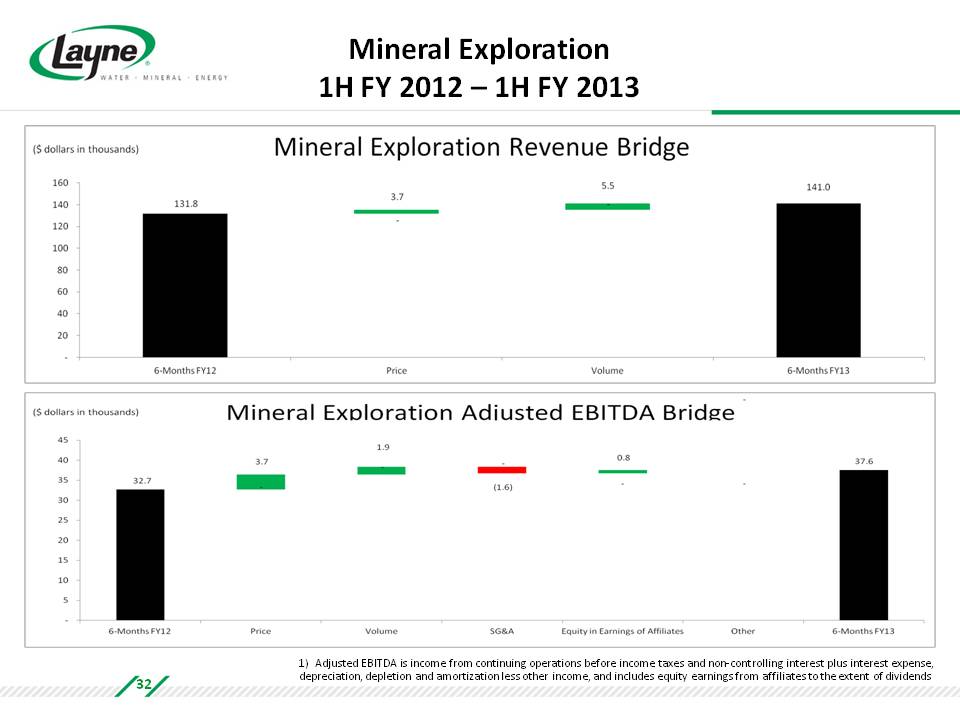
Mineral Exploration 1H FY 2012 – 1H FY 2013 Mineral Exploration Revenue Bridge ($ dollars in thousands) 160 140 120 100 80 60 40 20 - 6-Months FY12 Price Volume 6-Months FY13 131.8 3.7 5.5 141.0 Mineral Exploration Adjusted EBITDA Bridge ($ dollars in thousands) 45 40 35 30 25 20 15 10 5 - 6-Months FY12 Price Volume SG&A Equity in Earnings of Affiliates Other 6-Months FY13 32.7 3.7 1.9 (1.6) 0.8 – 37.6 1) Adjusted EBITDA is income from continuing operations before income taxes and non‐controlling interest plus interest expense, depreciation, depletion and amortization less other income, and includes equity earnings from affiliates to the extent of dividends 32
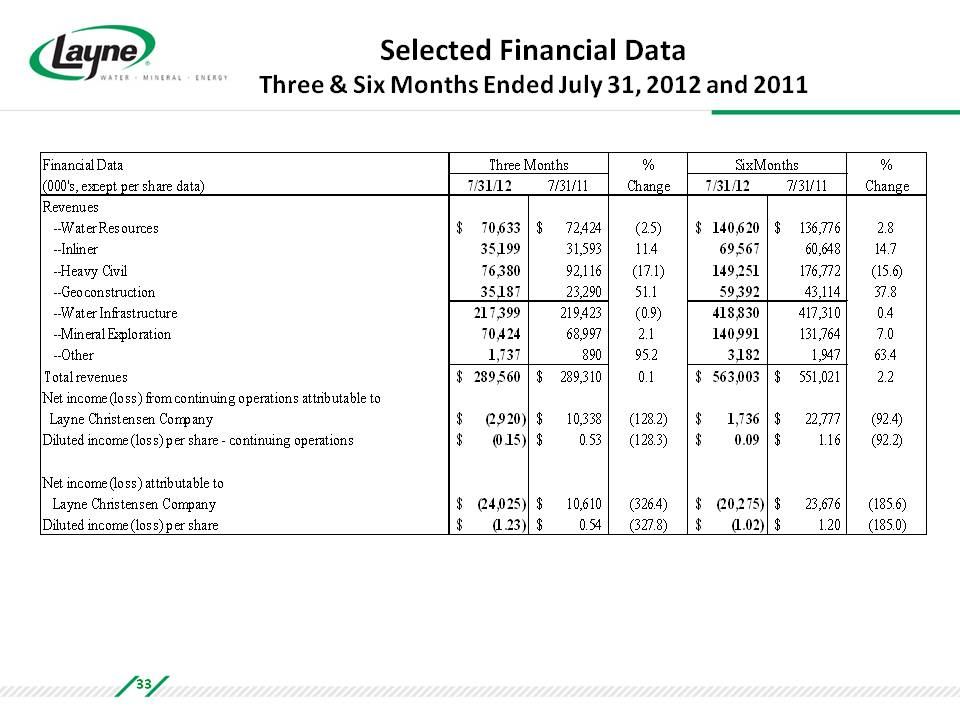
Selected Financial Data Three & Six Months Ended July 31, 2012 and 2011 Financial Data (000's, except per share data) Three Months 7/31/12 7/31/11 % Change Six Months 7/31/12 7/31/11 % Change Revenues Water Resources $ 70,633 $ 72,424 (2.5) $ 140,620 $ 136,776 2.8 Inliner 35,199 31,593 11.4 69,567 60,648 14.7 Heavy Civil 76,380 92,116 (17.1) 149,251 176,772 (15.6) Geoconstruction 35,187 23,290 51.1 59,392 43,114 37.8 Water Infrastructure 217,399 219,423 (0.9) 418,830 417,310 0.4 Mineral Exploration 70,424 68,997 2.1 140,991 131,764 7.0 Other 1,737 890 95.2 3,182 1,947 63.4 Total revenues $ 289,560 $ 289,310 0.1 $ 563,003 $ 551,021 2.2 Net income (loss) from continuing operations attributable to Layne Christensen Company $ (2,920) $ 10,338 (128.2) $ 1,736 $ 22,777 (92.4) Diluted income (loss) per share - continuing operations $ (0.15) $ 0.53 (128.3) $ 0.09 $ 1.16 (92.2) Net income (loss) attributable to Layne Christensen Company $ (24,025) $ 10,610 (326.4) $ (20,275) $ 23,676 (185.6) Diluted income (loss) per share $ (1.23) $ 0.54 (327.8) $ (1.02) $ 1.20 (185.0) 33
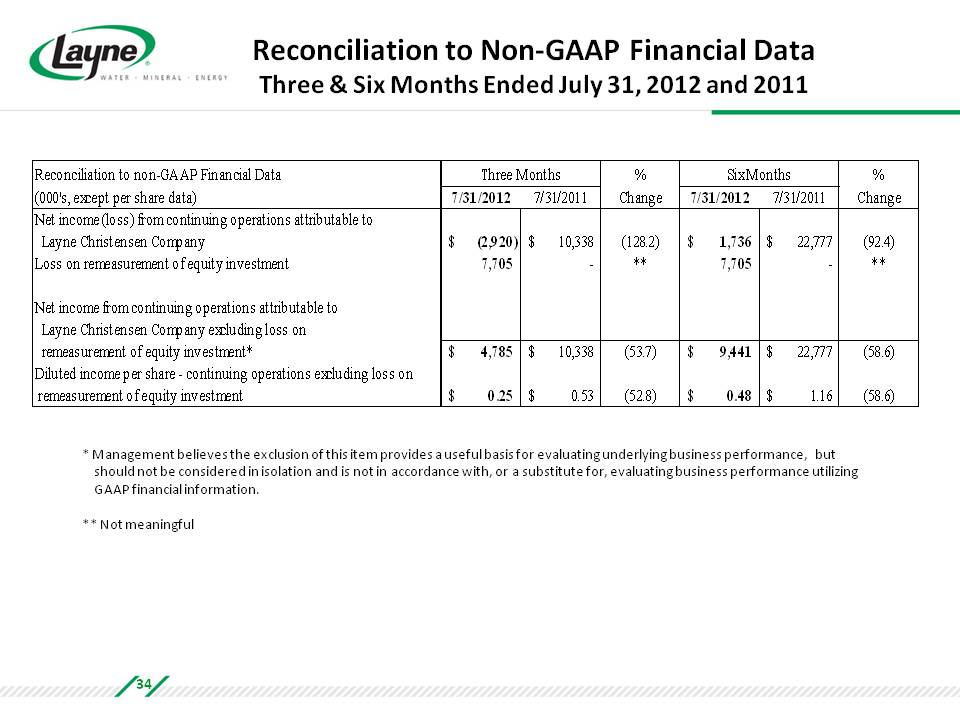
Reconciliation to Non‐GAAP Financial Data Three & Six Months Ended July 31, 2012 and 2011 Reconciliation to non-GAAP Financial Data (000's, except per share data) Three Months 7/31/2012 7/31/2011 % Change Six Months 7/31/2012 7/31/2011 % Change Net income (loss) from continuing operations attributable to Layne Christensen Company $ (2,920) $ 10,338 (128.2) $ 1,736 $ 22,777 (92.4) Loss on remeasurement of equity investment 7,705 - ** 7,705 - ** Net income from continuing operations attributable to Layne Christensen Company excluding loss on remeasurement of equity investment* $ 4,785 $ 10,338 (53.7) $ 9,441 $ 22,777 (58.6) Diluted income per share - continuing operations excluding loss on remeasurement of equity investment $ 0.25 $ 0.53 (52.8) $ 0.48 $ 1.16 (58.6) * Management believes the exclusion of this item provides a useful basis for evaluating underlying business performance, but should not be considered in isolation and is not in accordance with, or a substitute for, evaluating business performance utilizing GAAP financial information. ** Not meaningful 34
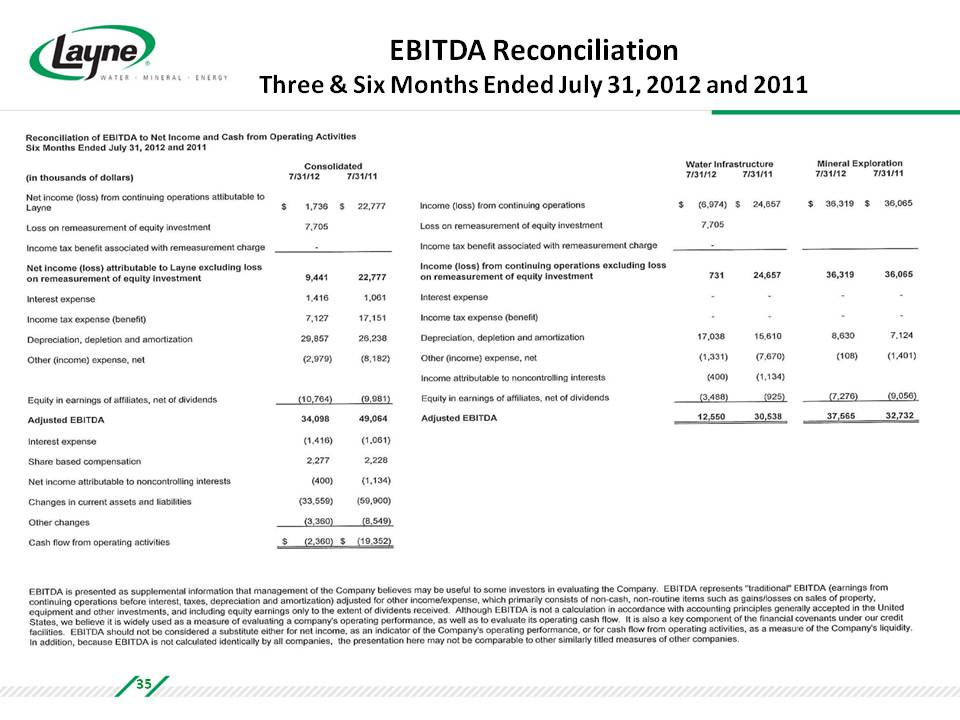
EBITDA Reconciliation Three & Six Months Ended July 31, 2012 and 2011 35

Contact Us AT THE COMPANY: INVESTOR RELATIONS: Jerry Fanska, SVP‐Finance 913.677.6858 Jerry.Fanska@layne.com www.layne.com Devin Sullivan, SVP 212.836.9608 dsullivan@equityny.com www.theequitygroup.com 36