Attached files
| file | filename |
|---|---|
| 8-K - FORM 8-K - PNC FINANCIAL SERVICES GROUP, INC. | d408298d8k.htm |
 The PNC
Financial Services Group, Inc. Barclays Global Financial Services
Conference
September 10, 2012
Exhibit 99.1 |
 2
Cautionary Statement Regarding Forward-Looking
Information and Adjusted Information
This presentation includes “snapshot” information about PNC used by way of
illustration. It is not intended as a full business or financial review and
should be viewed in the context of all of the information made available by PNC in its SEC
filings. The presentation also contains forward-looking statements regarding
our outlook for earnings, revenues, expenses, capital levels and ratios, liquidity levels, asset levels, asset quality, financial
position, and other matters regarding or affecting PNC and its future business and
operations. Forward-looking statements are necessarily subject to numerous
assumptions, risks and uncertainties, which change over time.
The forward-looking statements in this presentation are qualified by the factors affecting
forward-looking statements identified in the more detailed Cautionary Statement
included in the Appendix, which is included in the version of the presentation materials posted on our corporate website at
www.pnc.com/investorevents. We provide greater detail regarding these as well as other
factors in our 2011 Form 10-K, as amended by Amendment No. 1 thereto, and 2012 Form
10-Qs, including in the Risk Factors and Risk Management sections and in the Legal Proceedings and Commitments and
Guarantees Notes of the Notes to Consolidated Financial Statements in those reports, and in
our subsequent SEC filings. Our forward-looking statements may also be
subject to other risks and uncertainties, including those we may discuss in this presentation or in SEC filings, accessible on
the SEC’s website at www.sec.gov and on PNC’s corporate website at
www.pnc.com/secfilings. We have included web addresses in this presentation as
inactive textual references only. Information on these websites is not part of this presentation.
Future events or circumstances may change our outlook and may also affect the nature of the
assumptions, risks and uncertainties to which our forward-looking statements are
subject. Forward-looking statements in this presentation speak only as of the date of this presentation. We do not
assume any duty and do not undertake to update those statements. Actual results or
future events could differ, possibly materially, from those anticipated in
forward-looking statements, as well as from historical performance.
In this presentation, we sometimes refer to adjusted results to help illustrate the impact of
certain types of items, such as provisions for residential mortgage repurchase
obligations, non-cash charges related to redemptions of trust preferred securities, expenses for residential mortgage
foreclosure-related matters, legal, regulatory and OREO costs, and integration
costs. This information supplements our results as reported in accordance with
GAAP and should not be viewed in isolation from, or as a substitute for, our GAAP results. We believe that this additional information
and the reconciliations we provide may be useful to investors, analysts, regulators and others
as they evaluate the impact of these respective items on our results for the periods
presented due to the extent to which the items may not be indicative of our ongoing operations. We may also provide
information on pretax pre-provision earnings (total revenue less noninterest expense) and
on tangible book value per share (calculated as book value per share less total
intangible assets, other than servicing rights, per share). We believe that pretax pre-provision earnings, a non-GAAP measure, is
useful as a tool to help evaluate the ability to provide for credit costs through operations.
And we believe that tangible book value per share, a non- GAAP measure, is useful as
a tool to help to better evaluate growth of the company’s business apart from the amount, on a per share basis, of
intangible assets other than servicing rights included in book value. Where applicable, we
provide GAAP reconciliations for such additional information, including in the Appendix
and/or other slides and materials on our corporate website at www.pnc.com/investorevents.
In certain discussions, we may also provide information on yields and margins for all
interest-earning assets calculated using net interest income on a
taxable-equivalent basis by increasing the interest income earned on tax-exempt assets
to make it fully equivalent to interest income earned on taxable investments. We
believe this adjustment may be useful when comparing yields and margins for all earning assets. We may also use
annualized, proforma, estimated or third party numbers for illustrative or comparative
purposes only. These may not reflect actual results.
This presentation may also include discussion of other non-GAAP financial measures, which,
to the extent not so qualified therein or in the Appendix, is qualified by GAAP
reconciliation information available on our corporate website at www.pnc.com under “About PNC–Investor Relations.” |
 DRAFT
3
Navigating The Current Environment
Revenue
growth
Mortgage-
related issues
Manage risks and
capital
Global
economy
Control costs while
investing for growth
Regulatory
change
Grow customers and
quality revenues
Industry challenges
PNC’s priorities |
 DRAFT
4
Launching New Products That Enhance Customer
Experience
Investing in technology across all
customer segments
Product innovation driving customer
growth
PNC’s customer service differentiation:
–
Information organized based on
how customers think
–
Integrated experience
Giving customers choice
Driven by product innovation
Future service delivery model
SM |
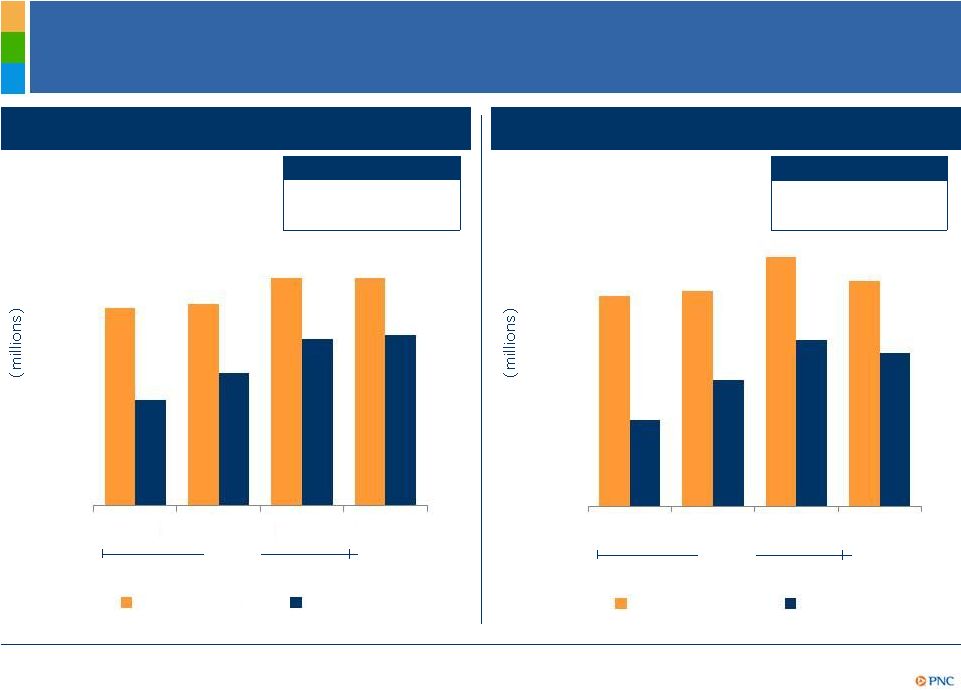
 DRAFT
Growing Customers –
Long-Term Revenue Potential
Retail Banking
Corporate Banking new
primary clients
Total checking relationships
Asset Management Group
New primary clients
(for the period indicated)
(for the period indicated)
(at period end)
5.4
5.6
6.3
2Q10
2Q11
2Q12
1,012
1,165
492
FY10
FY11
1H12
467
696
866
1H10
1H11
1H12
(1) Total checking relationships refers to consumer and small business accounts including
460,000 relationships acquired from RBC Bank (USA) in March 2012, 9,000 relationships
acquired from the Flagstar branch acquisition in December 2011, and 32,000 relationships
acquired from the BankAtlantic branch acquisition in June 2011. (2) A Corporate Banking
primary client is defined as a corporate banking relationship with annual revenue
generation of $50,000 or more or, within corporate banking, a commercial banking client relationship
with annual revenue generation of $10,000 or more. (3) Asset Management Group primary client
is defined as a client relationship with annual revenue generation of $10,000 or more. Corporate & Institutional
Banking 1
2
3
5 |
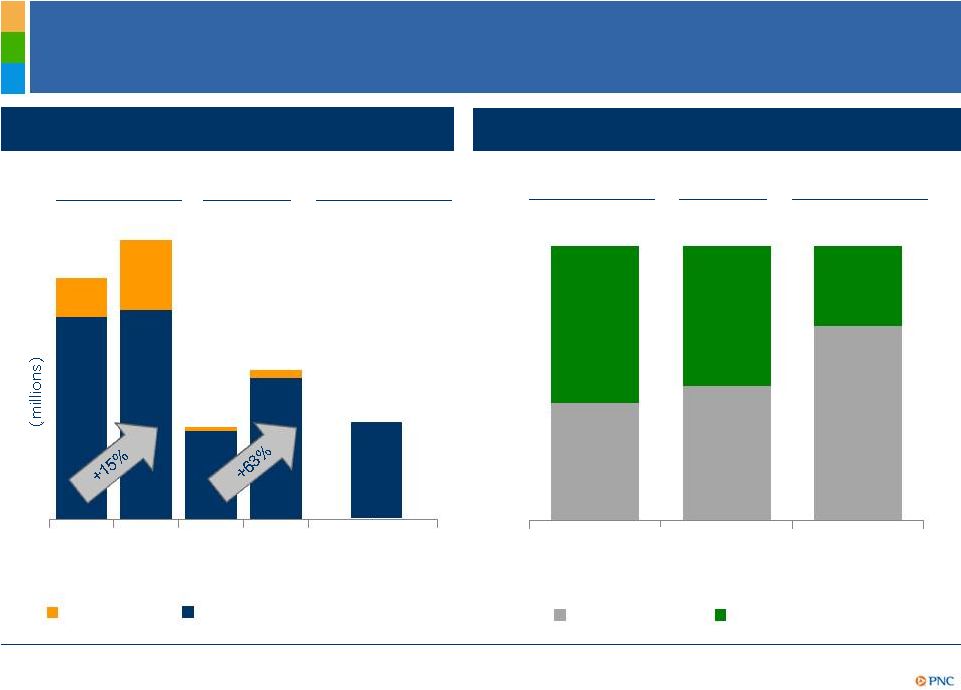
 DRAFT
6
Our Sales Momentum is Strong
Total Corporate Banking and AMG sales
Total Corporate Banking and AMG cross-sell
Actual
Annualized
Actual
Annualized
3-year CAGR
Northeast
5%
Midwest
17%
AMG refers to Asset Management Group. (1) Annualized.
3-year CAGR
Northeast
2%
Midwest
20%
1
1
$0
$100
$200
$300
$400
$500
$600
2009
2010
2011
2012
Northeast
Midwest
$50
$100
$150
$200
$250
$300
2009
2010
2011
2012
Northeast
Midwest
$0 |
 DRAFT
7
Philadelphia
3
AMG refers to Asset Management Group. (1) 2010 vs. 2012 annualized total market sales. (2) RBC
markets defined as Eastern Carolina, Western Carolina, Greater Georgia, Northern
Alabama and Gulf Coast. AMG sales not yet significant to RBC markets as we are in the build-out
phase. (3) For the first half 2012. (4) 12-month annualized sales calculated based on
April-July 2012 sales. (5) 12-month annualized. Expanding the Successful PNC
Model in Underpenetrated Markets
Philadelphia
1
Chicago
1
$xx
$105
$121
$40
$65
AMG sales
Corporate Banking sales
RBC markets
2
Chicago
3
Total Corporate Banking and AMG sales
Corporate Banking cross-sell sales by type
YTD12
$42
RBC markets
2
Apr-Jul
2012
2010
2012
5
2010
2012
5
2012
4
43%
49%
71%
57%
51%
29%
Non-Credit Sales
Credit Sales
1
2
3
1
3
2 |
 DRAFT
8
Key Retail Revenue Strategies
Overall revenue strategies
Opportunities to reduce cost to serve in
existing traditional branch network
Optimize branches and increase
customer loyalty
Examples –
Pittsburgh, Cleveland
markets
Grow select customer segments
Broaden
revenue
opportunities
by
expanding
our
share
of
customers’
wallets
Rethink our delivery network by creating a customer experience that improves customer
loyalty and our business margins
Secular trends in targeted segments
provide opportunity to grow using fewer
branches and more technology
Invest in multi-channel experiences
Applies in growth markets; such as:
Traditional branch network
Fewer branches/more technology
–
Migrate branch transactions to
image-enabled ATMs
–
Mobile deposit
–
PNC advantages –
brand, non-branch
sales, differentiated offers
–
Southeast, e.g. Atlanta
–
Midwest, e.g. Chicago |
 DRAFT
9
Improving Customer Experience, Loyalty and Margins
ATM channel migration strategy
PNC’s customers changing preferences
Withdrawals
Deposits
Check
cashing
40%
potential
20%
potential
Transaction
behavior
mix
1
Cost per transaction
High online
13%
0
2
4
6
8
10
12
Teller
ATM
Traditional
Branch
20%
Virtual
21%
Multi-
channel
46%
$3.97
$0.59
$0.56
$0.10
Branch
ATM
Online/ Mobile
Call center -
Interactive
voice response
Consumer
(1) Percentages reflect the proportion of PNC customers considered to be traditional branch,
virtual, high online usage or multi-channel customers based upon channel utilized for
transactions. Transactions refer to service transactions which include deposits, withdrawals and payments. Traditional branch customer is a customer who
conducts greater than 80% of monthly transactions in a branch. Virtual customer is a customer
who conducts the majority of monthly transactions at non-branch channels (i.e., ATM,
Online, Call Center, Mobile). High online usage customer is a customer with 10 or more monthly of the following: online sessions, transfers, online
bill pays and two or fewer branch transactions. Multi-channel customer is a customer who
uses all the channels including branch but is not dominant in any. (2) Monthly
transactions reflect the monthly average for transactions conducted from October 2010-November 2011. |
 DRAFT
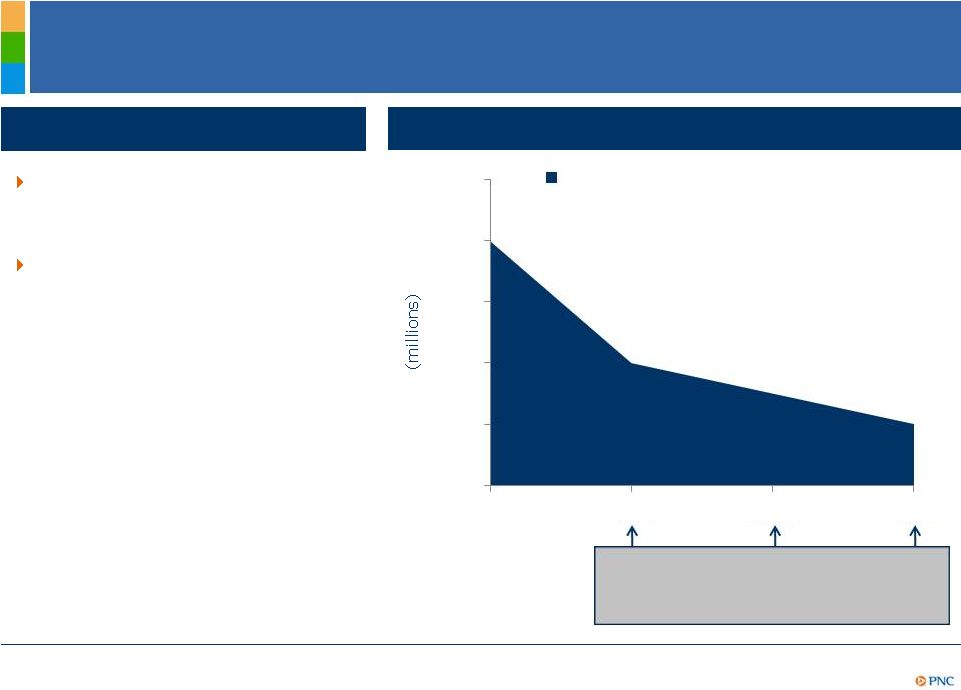
10
Revenue Potential Should Exceed Decline in Purchase
Accounting Accretion
Total revenue in 2013 expected
to increase when compared to
2012
Core NII
2
and noninterest income
growth expected to exceed the
purchase accounting decline of
approximately $400 million
Purchase accounting accretion decline
2013 highlights
(1) Refer to Cautionary Statement in the Appendix, including assumptions. (2) Core NII is
total net interest income less purchase accounting accretion.
$400
$200
$100
$0
$100
$200
$300
$400
$500
2013
2014
2015
2016
Expected year over year decline in
purchase accounting accretion
PAA decline in 2014 is less than 1.5% of total
revenue and declining going
forward
1
1
$150 |
 DRAFT
11
Disciplined Expense Management While Investing For
Growth
Highlights
Noninterest expense overview
Continuous improvement:
Select costs
All other noninterest expense
RBC Bank (USA) operating costs
2012 continuous
improvement initiatives
target of $400 million
4
has
resulted in a financial
impact of $186 million in
1H12
Continuous improvement
cost saves expected to
provide capacity for over
90% of 2012 investments
Goal of CIP is to provide
the capacity to invest in
future growth
RBC Bank (USA)
integration cost saves of
$150 million remain on
track
Components of
Noninterest Expense
1
1
1H11
1H12
Legal/mortgage
foreclosure-related/
OREO costs³
2%
6%
Integration costs
0%
4%
TPS redemption
charges
0%
2%
% of noninterest
expense
2%
12%
$4.2
$5.1
All other noninterest
expense relatively flat
1H11
1H12
2
$4.2
$4.3
(1) Further information is provided in the Appendix. (2) Select costs include legal/mortgage
foreclosure/OREO costs, integration costs and trust preferred securities redemption
charges. (3) Legal represents accruals for legal contingencies and mortgage foreclosure represents costs
to comply with regulatory consent decrees. OREO costs consist of gains/losses on sale of OREO
assets, write-downs on the assets and operating expenses. (4) Continuous improvement
initiatives related to legacy PNC’s operational and business efficiency initiatives with an
estimated 2012 impact of $400 million, which is part of the total CIP 2012 goal of $550
million.
|
 DRAFT
12
Effectively Managing Credit Risk
2Q12 credit risk metrics
PNC
Peers
Strong credit performance
0.71%
1.03%
PNC
Peers
1.92%
3.26%
PNC
Peers
1.39%
2.09%
PNC
Peers
2.30%
2.26%
3.06%
4
Net charge-offs
to average loans
Nonperforming
assets
2
to
total assets
Nonperforming
loans
2
to
total loans
Loan
loss
reserves
3
to
total loans
(1) Reflects company data for 2Q12 as of quarter-end except net charge-offs, which are
for the quarter and annualized, and average loans, which are for the quarter. Peer
source: SNL database. Peers reflects the average of the peers listed in the Appendix. (2) Nonperforming loans exclude certain government
insured or guaranteed loans, loans held for sale, loans accounted for under the fair value
option and purchased impaired loans. (3) The allowance for loan and leases losses
includes impairment reserves attributable to purchased impaired loans. (4) 2Q12 reserves/loans for PNC would have been 3.06% if both
reserves and loans had been adjusted to include the remaining marks on purchased impaired
loans. Further information is provided in the Appendix. Other peers have made
acquisitions and have marks on purchased impaired loans; however, no adjustments have been made for those peers.
1 |
 DRAFT
13
Reserves for Residential Mortgage Repurchase Demands
1
Reflect Expected Lifetime Losses
Elevated levels of residential mortgage
repurchase demands and the change in
behaviors of the GSE’s are issues impacting
the entire industry
PNC added provision of approximately $438
million to residential mortgage repurchase
reserves in 2Q12 based on expected lifetime
losses of $1.7 billion
1,3
which includes $1.2
billion of losses incurred to date
Relative to the companies listed in the table,
PNC’s reserve levels to outstanding demands
and loss coverage ratio are strong
Highlights
Reserves to outstanding demands
USB
132%
WFC
100
JPM
94
PNC
92
FITB
78
BAC
70
STI
67
Five Quarter Average Loss coverage ratio
BAC
14.3x
JPM
9.9
PNC
9.4
C
8.2
USB
6.7
WFC
5.3
STI
3.7
FITB
3.6
2
2
(1) Does not include home equity loans for PNC. (2) Reserves refer to reserves for
indemnification and repurchase liability for asserted and unasserted claims with
respect to residential mortgages sold. Source: company reports. As of June 30, 2012. (3) Barring significant changes in the future behaviors and demand
patterns of investors/guarantors or other unforeseen circumstances, we believe we are
appropriately reserved against future demands with respect to the sold residential
mortgage portfolio at June 30, 2012. Members of our peer group for which these categories of information was publicly available, plus Citigroup,
are presented. |
 DRAFT
14
Strong Capital and Liquidity Position
(1) Regulatory requirements are inclusive of the capital conservation buffer and subject to
further regulatory guidance and clarity on Basel NPRs. (2) Based on Basel III NPRs and
including application of Basel II (as modified by NPRs) and Basel II.5 rules. (3) Parent company liquidity
coverage
defined
as
liquid
assets
divided
by
funding
obligations
within
a
two
year
period.
2Q12 highlights
Basel I Tier 1 common ratio of 9.3% at June
30, 2012
Capital priorities:
–
Build capital to support client growth and
business investment
–
Maintain appropriate capital in light of
economic uncertainty
–
Return excess capital to shareholders
Basel III Tier 1 common ratio goal of 8.0-8.5%
by year-end 2013 without benefit of phase-ins² Strong
liquidity position –
Loans to deposits ratio of 87%
–
Parent company two year liquidity
coverage³
of 117%
Basel III Tier 1 common ratio
Basel
III
requirements
8.0% -
8.5%
2013 Goal
Basel III
3.5%
4.0%
4.5%
5.1%
5.8%
6.4%
7.0%
2013
2014
2015
2016
2017
2018
2019
1
–
Improved capital treatment expected on
sub-investment grade securities |
 DRAFT
15
Executing Our Business Model has Delivered Value
CMA
BAC
FITB
STI
RF
KEY
$17.58
$45.19
PNC
Staying core funded and
disciplined in our deposit
pricing
Committed to our
moderate risk philosophy
Leveraging customer
relationships and our
strong brand to grow high
quality, diverse revenue
streams
Focused on creating
positive operating leverage
while investing in
innovation
Remaining disciplined with
our capital
Executing on our strategies
PNC’s successful business model
Annualized dividend yield
% change 12/31/2007 to 6/30/2012
As of 8/31/2012
12/31/07
6/30/12
157%
112%
94%
59%
45%
28%
25%
-1%
-2%
-3%
-12%
-39%
-42%
PNC
WFC
USB
JPM
MTB
COF
BBT
3.2%
3.2%
2.6%
2.6%
2.5%
2.4%
2.3%
2.1%
2.0%
0.8%
0.6%
0.5%
0.4%
MTB
JPM
WFC
PNC
BBT
KEY
USB
FITB
CMA
STI
RF
BAC
COF
2
1
Tangible book value per share
Peer Source: SNL DataSource. (1) Tangible book value per share calculated as book value per
share less goodwill and certain other intangible assets. Further information is
provided in the Appendix. (2) Dividend yield calculated as the annualized dividend divided by the
closing stock price. |
 DRAFT
16
Cautionary Statement Regarding Forward-Looking
Information
Appendix
This presentation includes “snapshot” information about PNC used by way of
illustration and is not intended as a full business or financial review. It
should not be viewed in isolation but rather in the context of all of the information made available by PNC in its SEC filings.
We also make statements in this presentation, and we may from time to time make other
statements, regarding our outlook for earnings, revenues, expenses, capital levels and
ratios, liquidity levels, asset levels, asset quality, financial position, and other matters regarding or
affecting PNC and its future business and operations that are forward-looking statements
within the meaning of the Private Securities Litigation Reform Act.
Forward-looking statements are typically identified by words such as “believe,” “plan,” “expect,” “anticipate,” “see,”
“look,” “intend,” “outlook,” “project,”
“forecast,” “estimate,” “goal,” “will,” “should” and other similar words and expressions. Forward-
looking statements are subject to numerous assumptions, risks and uncertainties, which change
over time. Forward-looking statements speak only as of the date made. We do not assume any duty
and do not undertake to update forward-looking statements. Actual results or
future events could differ, possibly materially, from those anticipated in forward-looking statements, as well as
from historical performance.
Our forward-looking statements are subject to the following principal risks and
uncertainties.
•Our businesses, financial results and balance sheet values are affected by business and
economic conditions, including the following:
o
Changes in interest rates and valuations in debt, equity and other financial markets.
o
Disruptions in the liquidity and other functioning of U.S. and global financial markets.
o
The impact on financial markets and the economy of any changes in the credit ratings of U.S.
Treasury obligations and other U.S. government-backed debt, as well as issues
surrounding the level of U.S. and European government debt and concerns regarding the
creditworthiness of certain sovereign governments, supranationals and financial institutions
in Europe.
o
Actions by Federal Reserve, U.S. Treasury and other government agencies, including those that
impact money supply and market interest rates.
o
Changes in customers’, suppliers’ and other counterparties’ performance and
creditworthiness.
o
Slowing or failure of the current moderate economic expansion.
o
Continued effects of aftermath of recessionary conditions and uneven spread of positive
impacts of recovery on the economy and our counterparties, including adverse impacts on
levels of unemployment, loan utilization rates, delinquencies, defaults and counterparty
ability to meet credit and other obligations.
o
Changes in customer preferences and behavior, whether due to changing business and economic
conditions, legislative and regulatory initiatives, or other factors.
•Our forward-looking financial statements are subject to the risk that economic and
financial market conditions will be substantially different than we are currently
expecting. These statements are based on our current view that the moderate economic expansion will persist in 2012
and interest rates will remain very low. |
 DRAFT
17
Cautionary Statement Regarding Forward-Looking
Information (continued)
Appendix
• Legal and regulatory developments could have an impact on our ability to operate our
businesses, financial condition, results of operations, competitive position,
reputation, or pursuit of attractive acquisition opportunities. Reputational impacts could affect matters such as business
generation and retention, liquidity, funding, and ability to attract and retain
management. These developments could include:
o
Changes resulting from legislative and regulatory reforms, including major reform of the
regulatory oversight structure of the financial services industry and changes to laws
and regulations involving tax, pension, bankruptcy, consumer protection, and other industry aspects,
and changes in accounting policies and principles. We will be impacted by extensive
reforms provided for in the Dodd-Frank Wall Street Reform and Consumer Protection
Act (the “Dodd-Frank Act”) and otherwise growing out of the recent financial crisis, the precise nature,
extent and timing of which, and their impact on us, remains uncertain.
o
Changes to regulations governing bank capital and liquidity standards, including due to the
Dodd-Frank Act and to Basel-related initiatives.
o
Unfavorable resolution of legal proceedings or other claims and regulatory and other
governmental investigations or other inquiries. In addition to matters relating
to PNC’s business and activities, such matters may include proceedings, claims, investigations, or inquiries
relating to pre-acquisition business and activities of acquired companies, such as
National City. These matters may result in monetary judgments or settlements or
other remedies, including fines, penalties, restitution or alterations in our business practices and in additional
expenses and collateral costs, and may cause reputational harm to PNC.
o
Results of the regulatory examination and supervision process, including our failure to
satisfy requirements of agreements with governmental agencies.
o
Impact on business and operating results of any costs associated with obtaining rights in
intellectual property claimed by others and of adequacy of our intellectual property
protection in general.
• Business and operating results are affected by our ability to identify and effectively
manage risks inherent in our businesses, including, where appropriate, through
effective use of third-party insurance, derivatives, and capital management techniques, and to meet evolving regulatory
capital standards. In particular, our results currently depend on our ability to manage
elevated levels of impaired assets.
• Business and operating results also include impacts relating to our equity interest in
BlackRock, Inc. and rely to a significant extent on information provided to us by
BlackRock. Risks and uncertainties that could affect BlackRock are discussed in more detail by BlackRock in its SEC
filings.
• Our acquisition of RBC Bank (USA) presents us with risks and
uncertainties related to the integration of the acquired businesses into PNC,
including:
o
Anticipated benefits of the transaction, including cost savings and strategic gains, may be
significantly harder or take longer to achieve than expected or may not be achieved in
their entirety as a result of unexpected factors or events.
o
Our ability to achieve anticipated results from this transaction is dependent also on the
extent of credit losses in the acquired loan portfolios and the extent of deposit
attrition, in part related to the state of economic and financial markets. Also, litigation and regulatory
and other governmental investigations that may be filed or commenced relating to the
pre-acquisition business and activities of RBC Bank (USA) could impact the timing
or realization of anticipated benefits to PNC.
o
Integration of RBC Bank (USA)’s business and operations into PNC may take longer than
anticipated or be substantially more costly than anticipated or have unanticipated
adverse results relating to RBC Bank (USA)’s or PNC’s existing businesses. PNC’s ability to integrate RBC
Bank (USA) successfully may be adversely affected by the fact that this transaction results in
PNC entering several geographic markets where PNC did not previously have any
meaningful retail presence. |
 DRAFT
18
Cautionary Statement Regarding Forward-Looking
Information (continued)
Appendix
•In addition to the RBC Bank (USA) transaction, we grow our business in part by acquiring
from time to time other financial services companies, financial services assets and
related deposits and other liabilities. These other acquisitions often present risks and uncertainties
analogous to those presented by the RBC Bank (USA) transaction. Acquisition risks
include those presented by the nature of the business acquired as well as risks and
uncertainties related to the acquisition transactions themselves, regulatory issues, and the integration of the
acquired businesses into PNC after closing.
•Competition can have an impact on customer acquisition, growth and retention and on
credit spreads and product pricing, which can affect market share, deposits and
revenues. Industry restructuring in the current environment could also impact our business and financial
performance through changes in counterparty creditworthiness and performance and in the
competitive and regulatory landscape. Our ability to anticipate and respond to
technological changes can also impact our ability to respond to customer needs and meet competitive
demands.
•Business and operating results can also be affected by widespread
disasters, dislocations, terrorist activities or international hostilities through
impacts on the economy and financial markets generally or on us or our counterparties specifically.
We provide greater detail regarding these as well as other factors in our 2011 Form 10-K,
as amended by Amendment No. 1 thereto, and first and second quarter 2012 Form
10-Qs, including in the Risk Factors and Risk Management sections and the Legal Proceedings and
Commitments and Guarantees Notes of the Notes to Consolidated Financial Statements in those
reports, and in our subsequent SEC filings. Our forward-looking statements
may also be subject to other risks and uncertainties, including those we may discuss elsewhere in this
presentation or in SEC filings, accessible on the SEC’s website at www.sec.gov and on our
corporate website at www.pnc.com/secfilings. We have included these web addresses
as inactive textual references only. Information on these websites is not part of this document.
Any annualized, proforma, estimated, third party or consensus numbers in this presentation are
used for illustrative or comparative purposes only and may not reflect actual
results. Any consensus earnings estimates are calculated based on the earnings projections made by
analysts who cover that company. The analysts’ opinions, estimates or forecasts
(and therefore the consensus earnings estimates) are theirs alone, are not those of PNC
or its management, and may not reflect PNC’s or other company’s actual or anticipated results.
|
 DRAFT
19
Non-GAAP to GAAP Reconcilement
Appendix
In millions except per share data
Dec. 31, 2007
Jun. 30, 2012
% Change
Common shareholders' equity
$14,847
$33,884
Common shares outstanding
341
529
Book value per common share
$43.60
$64.00
47%
Goodwill and other intangible assets other than servicing rights
$8,853
$9,981
Common shareholders' equity less intangible assets
$5,994
$23,903
Common shares outstanding
341
529
Tangible book value per common share
$17.58
$45.19
157%
As of
As of
In millions
June 30, 2012
Allowance for loan and lease losses
$4,156
Remaining mark on purchased impaired loans
$1,400
Allowance for loan and lease losses, adjusted to include remaining mark
$5,556
Loans, as reported
$180,425
Loans, adjusted to include remaining mark on purchased impaired loans
$181,825
Allowance for loan and lease losses to loans
2.30%
Allowance for loan and lease losses plus remaining mark to loans plus remaining mark
3.06%
In millions
Jun. 30, 2012
Jun. 30, 2011
% Change
Total revenue, as reported
7,355
7,233
2%
Provision for residential mortgage repurchase obligation
470
35
Total revenue, as adjusted
$7,825
$7,268
8%
For the six months ended |
 DRAFT
20
Non-GAAP to GAAP Reconcilement
Appendix
In millions
Jun. 30, 2012
Jun. 30, 2011
Legal/regulatory/OREO costs
283
74
Integration costs
197
6
TPS redemption-related charges
130
-
RBC Bank (USA) operating costs
189
-
All other
4,304
4,166
Total noninterest expense
$5,103
$4,246
For the six months ended |
 DRAFT
21
Peer Group of Banks
Appendix
The PNC Financial Services Group, Inc.
PNC
BB&T Corporation
BBT
Bank of America Corporation
BAC
Capital One Financial, Inc.
COF
Comerica Inc.
CMA
Fifth Third Bancorp
FITB
JPMorgan Chase
JPM
KeyCorp
KEY
M&T Bank
MTB
Regions Financial Corporation
RF
SunTrust Banks, Inc.
STI
U.S. Bancorp
USB
Wells Fargo & Co.
WFC
Ticker |