Attached files
| file | filename |
|---|---|
| 8-K - IRET FORM 8-K CURRENT REPORT - CENTERSPACE | iretform8k-09102012.htm |
| EX-99.1 - EARNINGS RELEASE - CENTERSPACE | iretexhibit991-09102012.htm |
Exhibit 99.2

First Quarter Fiscal 2013
Supplemental Operating and Financial Data
for the Quarter Ended July 31, 2012
|
|
|
|
|
|
|
CONTACT:
Lindsey Knoop-Anderson
Director of Investor Relations
Direct Dial: 701-837-4738
E-Mail: landerson@iret.com
|
|
|
|
1400 31st Avenue SW, Suite 60
Minot, ND 58701
Tel: 701.837.4738
Fax: 701.838.7785
www.iret.com
|
Supplemental Financial and Operating Data
July 31, 2012
|
|
Page
|
|
|
|
|
Company Background and Highlights
|
2
|
|
|
|
|
Property Cost by Segment
|
5
|
|
|
|
|
Key Financial Data
|
|
|
Condensed Consolidated Balance Sheets
|
6
|
|
Condensed Consolidated Statements of Operations
|
7
|
|
Funds From Operations
|
8
|
|
Earnings Before Interest, Taxes, Depreciation and Amortization (EBITDA)
|
9
|
|
|
|
|
Capital Analysis
|
|
|
Long-Term Mortgage Debt Analysis
|
10
|
|
Long-Term Mortgage Debt Detail
|
11-13
|
|
Capital Analysis
|
14
|
|
|
|
|
Portfolio Analysis
|
|
|
Stabilized Properties Net Operating Income Summary
|
15
|
|
Net Operating Income Detail
|
16-17
|
|
Stabilized Properties and Overall Physical Occupancy Levels by Segment
|
18
|
|
|
|
|
Tenant Analysis
|
|
|
Commercial Leasing Summary
|
19-20
|
|
Multi-Family Residential Summary
|
21
|
|
10 Largest Commercial Tenants - Based on Annualized Base Rent
|
22
|
|
Lease Expirations
|
23
|
|
|
|
|
Growth and Strategy
|
|
|
Acquisition Summary
|
24
|
|
Development Summary
|
25
|
|
|
|
|
Definitions
|
26
|
1
Company Background and Highlights
First Quarter Fiscal 2013
Investors Real Estate Trust is a self-administered, equity real estate investment trust (REIT) investing in a portfolio of income-producing properties located primarily in the upper Midwest. IRET's portfolio is diversified among multi-family residential, commercial office, commercial medical (including senior housing), commercial industrial and commercial retail segments.
During the first quarter of fiscal year 2013, the Company closed on its acquisitions of:
|
·
|
a 308-unit multi-family residential property in Topeka, Kansas, on approximately 18.3 acres of land, for a purchase price of approximately $17.7 million, of which $5.2 million was paid in cash with assumed debt of $12.5 million;
|
|
·
|
a 232-unit multi-family residential property in Lincoln, Nebraska, on approximately 14.7 acres of land, for a purchase price of approximately $17.5 million, of which $14.2 million was paid in cash and the remainder in limited partnership units of the Operating Partnership valued at $3.3 million; and
|
|
·
|
a 208-unit multi-family residential property in Lincoln, Nebraska, on approximately 11.5 acres of land, for a purchase price of approximately $17.3 million, of which $13.8 million was paid in cash and the remainder in limited partnership units of the Operating Partnership valued at $3.5 million.
|
Also during the first quarter of fiscal year 2013, the Company placed in service its 159-unit Quarry Ridge Apartment Homes development in Rochester, Minnesota, and placed in service buildings 3 and 4 (totaling 73 units) of its four-building, 145-unit Williston Garden multi-family residential development in Williston, North Dakota. The Company is the majority member of the joint venture entity that owns the Williston Garden development, with a 60% interest. As of July 31, 2012, project costs incurred for the Quarry Ridge development totaled approximately $15.6 million; the total estimated construction costs (excluding the value of the land) for the project are $17.3 million. Estimated total project costs for the Williston Garden development are approximately $19.5 million, of which the joint venture entity had incurred approximately $17.8 million as of July 31, 2012.
The Company sold two small properties in the first quarter of fiscal year 2013, in Kentwood, Michigan and Fox River, Wisconsin, for sales prices of $625,000 and $330,000, respectively.
The Company's revenues in the first quarter of fiscal year 2013 continued to be affected by low occupancy levels in its commercial office segment. Despite signs of economic recovery and renewed commercial leasing interest, the Company believes the continued elevated vacancy in its commercial office segment reflects continuing challenging economic conditions in certain of the Company's markets. IRET's multi-family residential portfolio continued to improve in occupancy and real estate revenue compared to the year-earlier period.
In the first quarter of fiscal year 2013, IRET paid its 165th consecutive quarterly distribution. The $0.1300 per share/unit distribution was payable on July 2, 2012. Subsequent to the end of the first quarter of fiscal year 2013, the Company declared a quarterly distribution of $0.1300 per share and unit payable on October 1, 2012 to shareholder and unitholders of record on September 17, 2012. The Board of Trustees also declared a quarterly distribution of $0.5156 per share on the Company's Series A preferred shares, payable October 1, 2012 to Series A preferred shareholders of record on September 17, 2012, and declared an initial, pro-rated distribution of $0.3312 per share on the Company's Series B preferred shares of beneficial interest, payable October 1, 2012 to Series B preferred shareholders of record on September 17, 2012. Subsequent distributions on the Series B preferred shares are payable quarterly in arrears in the amount of $0.4968 per share.
As of July 31, 2012, IRET owns a diversified portfolio of 269 properties consisting of 87 multi-family residential properties, 68 commercial office properties, 65 commercial medical properties (including senior housing), 19 commercial industrial properties and 30 commercial retail properties. IRET's common shares are publicly traded on the NASDAQ Global Select Market (NASDAQ: IRET).
2
Company Snapshot
(as of July 31, 2012)
|
Company Headquarters
|
Minot, North Dakota
|
|||
|
Fiscal Year-End
|
April 30
|
|||
|
Reportable Segments
|
Multi-Family Residential, Commercial Office, Commercial Medical, Commercial Industrial, Commercial Retail
|
|||
|
Total Properties
|
269 | |||
|
Total Square Feet
|
||||
|
(commercial properties)
|
12.3 million
|
|||
|
Total Units
|
||||
|
(multi-family residential properties)
|
10,143
|
|||
|
Common Shares Outstanding (thousands)
|
91,812
|
|||
|
Limited Partnership Units Outstanding (thousands)
|
21,171
|
|||
|
Common Share Distribution - Quarter/Annualized
|
$0.13/$0.52
|
|||
|
Dividend Yield
|
6.4% |
|
||
|
Total Capitalization (see p.14 for detail)
|
$2.1 billion
|
|||
Investor Information
Board of Trustees
|
Jeffrey L. Miller
|
Trustee and Chairman
|
|
Stephen L. Stenehjem
|
Trustee and Vice Chairman
|
|
John D. Stewart
|
Trustee, Chair of Audit Committee
|
|
John T. Reed
|
Trustee, Chair of Nominating and Governance Committee
|
|
W. David Scott
|
Trustee, Chair of Compensation Committee
|
|
Jeffrey K. Woodbury
|
Trustee
|
|
Linda Hall Keller
|
Trustee
|
|
Thomas A. Wentz, Jr.
|
Trustee, Executive Vice President and Chief Operating Officer
|
|
Timothy P. Mihalick
|
Trustee, President and Chief Executive Officer
|
Management
|
Timothy P. Mihalick
|
President and Chief Executive Officer; Trustee
|
|
Thomas A. Wentz, Jr
|
Executive Vice President and Chief Operating Officer; Trustee
|
|
Diane K. Bryantt
|
Executive Vice President and Chief Financial Officer
|
|
Michael A. Bosh
|
Executive Vice President, General Counsel and Assistant Secretary
|
|
Mark Reiling
|
Executive Vice President of Asset Management
|
|
Charles A. Greenberg
|
Senior Vice President, Commercial Asset Management
|
|
Ted E. Holmes
|
Senior Vice President, Finance
|
|
Andrew Martin
|
Senior Vice President, Residential Property Management
|
Corporate Headquarters:
1400 31st Avenue SW, Suite 60
Post Office Box 1988
Minot, North Dakota 58702-1988
Trading Symbol: IRET
Stock Exchange Listing: NASDAQ
Investor Relations:
Lindsey Knoop-Anderson
landerson@iret.com
3
Common Share Data (NASDAQ: IRET)
|
|
1st Quarter
Fiscal Year 2013
|
4th Quarter
Fiscal Year 2012
|
3rd Quarter
Fiscal Year 2012
|
2nd Quarter
Fiscal Year 2012
|
1st Quarter
Fiscal Year 2012
|
|||||||||||||||
|
High Closing Price
|
$
|
8.31
|
$
|
7.97
|
$
|
7.64
|
$
|
8.12
|
$
|
9.69
|
||||||||||
|
Low Closing Price
|
$
|
7.05
|
$
|
7.22
|
$
|
6.89
|
$
|
6.92
|
$
|
8.07
|
||||||||||
|
Average Closing Price
|
$
|
7.57
|
$
|
7.56
|
$
|
7.27
|
$
|
7.46
|
$
|
8.87
|
||||||||||
|
Closing Price at end of quarter
|
$
|
8.16
|
$
|
7.22
|
$
|
7.42
|
$
|
7.41
|
$
|
8.13
|
||||||||||
|
Common Share Distributions—annualized
|
$
|
0.520
|
$
|
0.520
|
$
|
0.520
|
$
|
0.520
|
$
|
0.686
|
||||||||||
|
Closing Dividend Yield - annualized
|
6.4
|
%
|
7.2
|
%
|
7.0
|
%
|
7.0
|
%
|
8.4
|
%
|
||||||||||
|
Closing common shares outstanding (thousands)
|
91,812
|
89,474
|
85,744
|
83,682
|
81,259
|
|||||||||||||||
|
Closing limited partnership units outstanding (thousands)
|
21,171
|
20,332
|
19,596
|
19,534
|
19,958
|
|||||||||||||||
|
Closing market value of outstanding common shares, plus imputed closing market value of outstanding limited partnership units (thousands)
|
$
|
921,941
|
$
|
792,799
|
$
|
781,623
|
$
|
764,831
|
$
|
822,894
|
||||||||||
Certain statements in these supplemental disclosures are "forward-looking statements" within the meaning of the Private Securities Litigation Reform Act of 1995. Such statements involve known and unknown risks, uncertainties and other factors that may cause actual results to differ materially from projected results. Such risks, uncertainties and other factors include, but are not limited to: intentions and expectations regarding future distributions on our common shares and units, fluctuations in interest rates, the effect of government regulation, the availability of capital, changes in general and local economic and real estate market conditions, competition, our ability to attract and retain skilled personnel, and those risks and uncertainties detailed from time to time in our filings with the Securities and Exchange Commission, including our 2012 Form 10-K. We assume no obligation to update or supplement forward-looking statements that become untrue because of subsequent events.
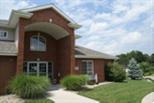
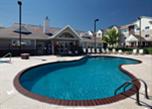
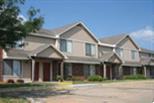
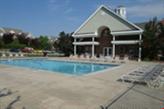
First Quarter Fiscal 2013 Acquisitions and Development Projects Placed in Service
|
|
|
 |
 |
|
Lakeside Village Apartment Homes
701 Lakeside Dr. Lincoln, NE 68528 |
Quarry Ridge Apartments
1823 Quarry Ridge Place NW Rochester, MN 55901 |
|
|
|
|
|
|
 |
 |
|
Villa West Apartment Homes
2744 SW Villa West Drive Topeka, KS 66614 |
The Colony Apartment Homes
3751 Faulkner Dr. Lincoln, NE 68516 |
|
|
|
|
|
|
4
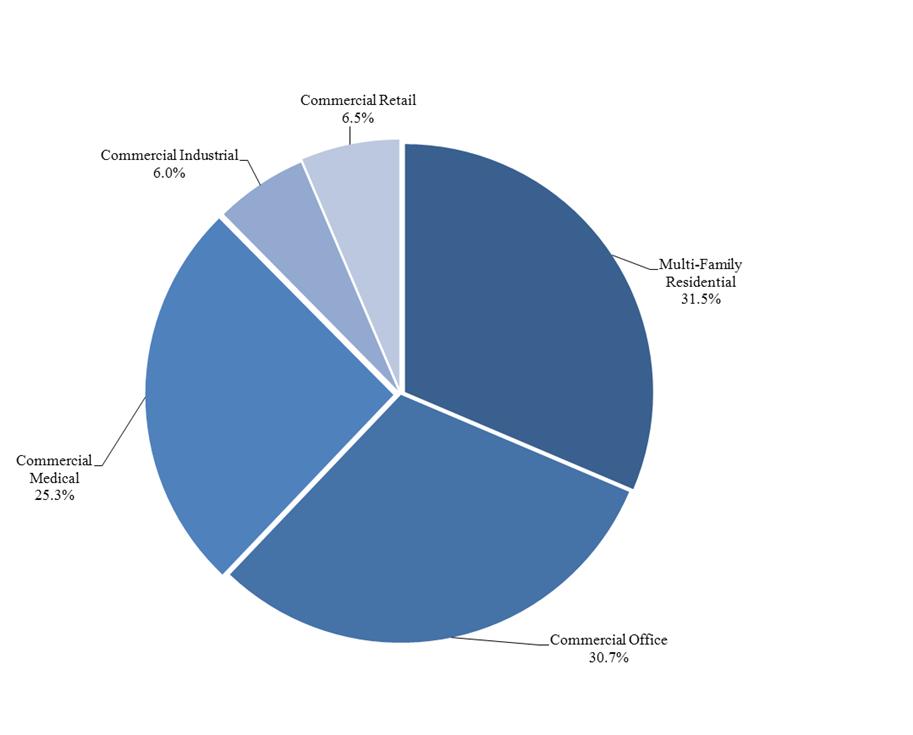
Property Cost by Segment – First Quarter Fiscal 2013
With investments in the multi-family residential and commercial office, commercial medical, commercial industrial and commercial retail segments, IRET's diversified portfolio helps to provide stability during market fluctuations in returns from specific property types.
5
INVESTORS REAL ESTATE TRUST AND SUBSIDIARIES
CONDENSED CONSOLIDATED BALANCE SHEETS (unaudited)
(in thousands)
|
|
07/31/2012
|
04/30/2012
|
01/31/2012
|
10/31/2011
|
07/31/2011
|
|||||||||||||||
|
ASSETS
|
||||||||||||||||||||
|
Real estate investments
|
||||||||||||||||||||
|
Property owned
|
$
|
1,979,099
|
$
|
1,892,009
|
$
|
1,861,321
|
$
|
1,844,654
|
$
|
1,777,485
|
||||||||||
|
Less accumulated depreciation
|
(387,286
|
)
|
(373,490
|
)
|
(364,190
|
)
|
(351,174
|
)
|
(339,293
|
)
|
||||||||||
|
|
1,591,813
|
1,518,519
|
1,497,131
|
1,493,480
|
1,438,192
|
|||||||||||||||
|
Development in progress
|
10,498
|
27,599
|
22,281
|
14,124
|
12,697
|
|||||||||||||||
|
Unimproved land
|
10,990
|
10,990
|
6,390
|
6,558
|
6,550
|
|||||||||||||||
|
Mortgage loans receivable, net of allowance
|
0
|
0
|
0
|
155
|
156
|
|||||||||||||||
|
Total real estate investments
|
1,613,301
|
1,557,108
|
1,525,802
|
1,514,317
|
1,457,595
|
|||||||||||||||
|
Real estate held for sale
|
1,131
|
2,067
|
0
|
0
|
0
|
|||||||||||||||
|
Cash and cash equivalents
|
37,002
|
39,989
|
35,502
|
32,697
|
37,307
|
|||||||||||||||
|
Other investments
|
635
|
634
|
633
|
628
|
627
|
|||||||||||||||
|
Receivable arising from straight-lining of rents, net of allowance
|
24,127
|
23,273
|
21,965
|
20,905
|
19,331
|
|||||||||||||||
|
Accounts receivable, net of allowance
|
6,448
|
7,052
|
3,977
|
8,243
|
7,935
|
|||||||||||||||
|
Real estate deposits
|
4
|
263
|
578
|
451
|
458
|
|||||||||||||||
|
Prepaid and other assets
|
3,070
|
3,703
|
4,107
|
1,718
|
1,997
|
|||||||||||||||
|
Intangible assets, net of accumulated amortization
|
43,796
|
44,588
|
49,055
|
50,322
|
48,108
|
|||||||||||||||
|
Tax, insurance, and other escrow
|
13,161
|
11,669
|
11,427
|
11,315
|
15,198
|
|||||||||||||||
|
Property and equipment, net of accumulated depreciation
|
1,332
|
1,454
|
1,464
|
1,986
|
1,687
|
|||||||||||||||
|
Goodwill
|
1,120
|
1,120
|
1,120
|
1,127
|
1,127
|
|||||||||||||||
|
Deferred charges and leasing costs, net of accumulated amortization
|
21,932
|
21,447
|
22,014
|
21,255
|
20,304
|
|||||||||||||||
|
TOTAL ASSETS
|
$
|
1,767,059
|
$
|
1,714,367
|
$
|
1,677,644
|
$
|
1,664,964
|
$
|
1,611,674
|
||||||||||
|
|
||||||||||||||||||||
|
LIABILITIES AND EQUITY
|
||||||||||||||||||||
|
LIABILITIES
|
||||||||||||||||||||
|
Accounts payable and accrued expenses
|
$
|
41,084
|
$
|
47,403
|
$
|
43,439
|
$
|
39,002
|
$
|
34,547
|
||||||||||
|
Revolving line of credit
|
44,500
|
39,000
|
49,000
|
47,000
|
34,000
|
|||||||||||||||
|
Mortgages payable
|
1,080,655
|
1,048,689
|
1,038,717
|
1,039,625
|
1,002,962
|
|||||||||||||||
|
Other
|
25,094
|
14,012
|
6,326
|
1,164
|
6,369
|
|||||||||||||||
|
TOTAL LIABILITIES
|
1,191,333
|
1,149,104
|
1,137,482
|
1,126,791
|
1,077,878
|
|||||||||||||||
|
|
||||||||||||||||||||
|
REDEEMABLE NONCONTROLLING INTERESTS – CONSOLIDATED REAL ESTATE ENTITIES
|
0
|
0
|
0
|
1,005
|
1,263
|
|||||||||||||||
|
EQUITY
|
||||||||||||||||||||
|
Investors Real Estate Trust shareholders' equity
|
||||||||||||||||||||
|
Preferred Shares of Beneficial Interest
|
27,317
|
27,317
|
27,317
|
27,317
|
27,317
|
|||||||||||||||
|
Common Shares of Beneficial Interest
|
701,431
|
684,049
|
657,304
|
643,022
|
627,722
|
|||||||||||||||
|
Accumulated distributions in excess of net income
|
(289,025
|
)
|
(278,377
|
)
|
(269,942
|
)
|
(260,535
|
)
|
(250,585
|
)
|
||||||||||
|
Total Investors Real Estate Trust shareholders' equity
|
439,723
|
432,989
|
414,679
|
409,804
|
404,454
|
|||||||||||||||
|
Noncontrolling interests – Operating Partnership
|
122,373
|
118,710
|
114,852
|
116,550
|
119,382
|
|||||||||||||||
|
Noncontrolling interests – consolidated real estate entities
|
13,630
|
13,564
|
10,631
|
10,814
|
8,697
|
|||||||||||||||
|
Total equity
|
575,726
|
565,263
|
540,162
|
537,168
|
532,533
|
|||||||||||||||
|
TOTAL LIABILITIES AND EQUITY
|
$
|
1,767,059
|
$
|
1,714,367
|
$
|
1,677,644
|
$
|
1,664,964
|
$
|
1,611,674
|
||||||||||
6
INVESTORS REAL ESTATE TRUST AND SUBSIDIARIES
CONDENSED CONSOLIDATED STATEMENTS OF OPERATIONS (unaudited)
(in thousands, except per share data)
|
|
Three Months Ended
|
|||||||||||||||||||
|
OPERATING RESULTS
|
07/31/2012
|
04/30/2012
|
01/31/2012
|
10/31/2011
|
07/31/2011
|
|||||||||||||||
|
Real estate revenue
|
$
|
62,410
|
$
|
60,621
|
$
|
60,981
|
$
|
60,629
|
$
|
59,557
|
||||||||||
|
Real estate expenses
|
25,068
|
22,851
|
24,807
|
25,761
|
24,859
|
|||||||||||||||
|
Gain on involuntary conversion
|
0
|
274
|
0
|
0
|
0
|
|||||||||||||||
|
Net operating income
|
37,342
|
38,044
|
36,174
|
34,868
|
34,698
|
|||||||||||||||
|
Depreciation/amortization
|
(16,286
|
)
|
(15,210
|
)
|
(15,245
|
)
|
(14,936
|
)
|
(14,873
|
)
|
||||||||||
|
Administrative expenses, advisory and trustee services
|
(2,096
|
)
|
(1,437
|
)
|
(1,659
|
)
|
(2,104
|
)
|
(2,181
|
)
|
||||||||||
|
Other expenses
|
(519
|
)
|
(389
|
)
|
(359
|
)
|
(835
|
)
|
(315
|
)
|
||||||||||
|
Interest
|
(16,517
|
)
|
(16,430
|
)
|
(16,511
|
)
|
(16,291
|
)
|
(15,881
|
)
|
||||||||||
|
Interest and other income
|
142
|
141
|
279
|
213
|
153
|
|||||||||||||||
|
Income from continuing operations
|
2,066
|
4,719
|
2,679
|
915
|
1,601
|
|||||||||||||||
|
(Loss) income from discontinued operations
|
(70
|
)
|
(598
|
)
|
(158
|
)
|
576
|
(28
|
)
|
|||||||||||
|
Net income
|
$
|
1,996
|
$
|
4,121
|
$
|
2,521
|
$
|
1,491
|
$
|
1,573
|
||||||||||
|
|
||||||||||||||||||||
|
Net (income) loss attributable to noncontrolling interest – Operating Partnership
|
(251
|
)
|
(636
|
)
|
(351
|
)
|
(194
|
)
|
(178
|
)
|
||||||||||
|
Net (income) loss attributable to noncontrolling interests – consolidated real estate entities
|
(66
|
)
|
(106
|
)
|
(43
|
)
|
(12
|
)
|
26
|
|||||||||||
|
Net income attributable to Investors Real Estate Trust
|
1,679
|
3,379
|
2,127
|
1,285
|
1,421
|
|||||||||||||||
|
Dividends to preferred shareholders
|
(593
|
)
|
(593
|
)
|
(593
|
)
|
(593
|
)
|
(593
|
)
|
||||||||||
|
NET INCOME (LOSS) AVAILABLE TO COMMON SHAREHOLDERS
|
$
|
1,086
|
$
|
2,786
|
$
|
1,534
|
$
|
692
|
$
|
828
|
||||||||||
|
|
||||||||||||||||||||
|
Per Share Data
|
||||||||||||||||||||
|
Earnings (loss) per common share from continuing operations – Investors Real Estate Trust – basic & diluted
|
$
|
.01
|
$
|
.04
|
$
|
.02
|
$
|
.00
|
$
|
.01
|
||||||||||
|
Earnings (loss) per common share from discontinued operations – Investors Real Estate Trust – basic & diluted
|
.00
|
(.01
|
)
|
.00
|
.01
|
.00
|
||||||||||||||
|
Net income (loss) per common share – basic & diluted
|
$
|
.01
|
$
|
.03
|
$
|
.02
|
$
|
.01
|
$
|
.01
|
||||||||||
|
|
||||||||||||||||||||
|
Percentage of Revenues
|
||||||||||||||||||||
|
Real estate expenses
|
40.2
|
%
|
37.7
|
%
|
40.7
|
%
|
42.5
|
%
|
41.7
|
%
|
||||||||||
|
Depreciation/amortization
|
26.1
|
%
|
25.1
|
%
|
25.0
|
%
|
24.6
|
%
|
25.0
|
%
|
||||||||||
|
General and administrative
|
3.4
|
%
|
2.4
|
%
|
2.7
|
%
|
3.5
|
%
|
3.7
|
%
|
||||||||||
|
Interest
|
26.5
|
%
|
27.1
|
%
|
27.1
|
%
|
26.9
|
%
|
26.7
|
%
|
||||||||||
|
(Loss) income from discontinued operations
|
0.1
|
%
|
1.0
|
%
|
0.3
|
%
|
1.0
|
%
|
0.0
|
%
|
||||||||||
|
Net income
|
3.2
|
%
|
6.8
|
%
|
4.1
|
%
|
2.5
|
%
|
2.6
|
%
|
||||||||||
|
|
||||||||||||||||||||
|
Ratios
|
||||||||||||||||||||
|
EBITDA(1)/Interest expense
|
2.09
|
x
|
2.17
|
x
|
2.07
|
x
|
1.97
|
x
|
2.03
|
x
|
||||||||||
|
EBITDA(1)/Interest expense plus preferred distributions
|
2.02
|
x
|
2.09
|
x
|
2.00
|
x
|
1.90
|
x
|
1.95
|
x
|
||||||||||
| (1) | See Definitions on page 26. EBITDA is a non-GAAP measure; see page 9 for a reconciliation of EBITDA to net income (loss). |
7
INVESTORS REAL ESTATE TRUST AND SUBSIDIARIES
FUNDS FROM OPERATIONS (unaudited)
(in thousands, except per share and unit data)
|
|
Three Months Ended
|
|||||||||||||||||||
|
|
07/31/2012
|
04/30/2012
|
01/31/2012
|
10/31/2011
|
07/31/2011
|
|||||||||||||||
|
Funds From Operations(1)
|
||||||||||||||||||||
|
Net income attributable to Investors Real Estate Trust
|
$
|
1,679
|
$
|
3,379
|
$
|
2,127
|
$
|
1,285
|
$
|
1,421
|
||||||||||
|
Less dividends to preferred shareholders
|
(593
|
)
|
(593
|
)
|
(593
|
)
|
(593
|
)
|
(593
|
)
|
||||||||||
|
Net income available to common shareholders
|
1,086
|
2,786
|
1,534
|
692
|
828
|
|||||||||||||||
|
Adjustments:
|
||||||||||||||||||||
|
Noncontrolling interests – Operating Partnership
|
251
|
636
|
351
|
194
|
178
|
|||||||||||||||
|
Depreciation and amortization
|
16,187
|
15,165
|
15,179
|
14,890
|
14,823
|
|||||||||||||||
|
Real estate impairment
|
0
|
293
|
135
|
0
|
0
|
|||||||||||||||
|
Loss (gain) on depreciable property sales
|
73
|
240
|
0
|
(589
|
)
|
0
|
||||||||||||||
|
Funds from operations applicable to common shares and Units
|
$
|
17,597
|
$
|
19,120
|
$
|
17,199
|
$
|
15,187
|
$
|
15,829
|
||||||||||
|
|
||||||||||||||||||||
|
FFO per share and unit - basic and diluted
|
$
|
0.16
|
$
|
0.18
|
$
|
0.16
|
$
|
0.15
|
$
|
0.16
|
||||||||||
|
|
||||||||||||||||||||
|
Adjusted funds from operations(1)
|
||||||||||||||||||||
|
Funds from operations applicable to common shares and Units
|
$
|
17,597
|
$
|
19,120
|
$
|
17,199
|
$
|
15,187
|
$
|
15,829
|
||||||||||
|
Adjustments:
|
||||||||||||||||||||
|
Tenant improvements
|
(2,206
|
)
|
(4,846
|
)
|
(2,007
|
)
|
(2,021
|
)
|
(1,435
|
)
|
||||||||||
|
Leasing commissions
|
(1,335
|
)
|
701
|
(1,589
|
)
|
(1,182
|
)
|
(703
|
)
|
|||||||||||
|
Recurring capital expenditures(1)
|
(1,987
|
)
|
(1,451
|
)
|
(1,411
|
)
|
(1,872
|
)
|
(1,969
|
)
|
||||||||||
|
Straight-line rents
|
(864
|
)
|
(1,330
|
)
|
(1,059
|
)
|
(1,597
|
)
|
(398
|
)
|
||||||||||
|
Non-real estate depreciation
|
136
|
78
|
114
|
90
|
127
|
|||||||||||||||
|
Adjusted funds from operations applicable to common shares and Units
|
$
|
11,341
|
$
|
12,272
|
$
|
11,247
|
$
|
8,605
|
$
|
11,451
|
||||||||||
|
|
||||||||||||||||||||
|
AFFO per share and unit - basic and diluted
|
0.10
|
0.11
|
0.11
|
0.09
|
0.11
|
|||||||||||||||
|
|
||||||||||||||||||||
|
Weighted average shares and units
|
111,292
|
107,316
|
103,935
|
101,669
|
100,844
|
|||||||||||||||
| (1) | See Definitions on page 26. |
8
INVESTORS REAL ESTATE TRUST AND SUBSIDIARIES
EARNINGS BEFORE INTEREST, TAXES, DEPRECIATION AND AMORTIZATION (EBITDA) (unaudited)
(in thousands)
|
|
Three Months Ended
|
|||||||||||||||||||
|
|
07/31/2012
|
04/30/2012
|
01/31/2012
|
10/31/2011
|
07/31/2011
|
|||||||||||||||
|
EBITDA(1)
|
||||||||||||||||||||
|
Net income attributable to Investors Real Estate Trust
|
$
|
1,679
|
$
|
3,379
|
$
|
2,127
|
$
|
1,285
|
$
|
1,421
|
||||||||||
|
Adjustments:
|
||||||||||||||||||||
|
Noncontrolling interests – Operating Partnership
|
251
|
636
|
351
|
194
|
178
|
|||||||||||||||
|
Income before noncontrolling interests – Operating Partnership
|
1,930
|
4,015
|
2,478
|
1,479
|
1,599
|
|||||||||||||||
|
Add:
|
||||||||||||||||||||
|
Interest
|
16,517
|
16,454
|
16,533
|
16,318
|
15,925
|
|||||||||||||||
|
Depreciation/amortization related to real estate investments
|
15,453
|
14,390
|
14,359
|
14,193
|
14,166
|
|||||||||||||||
|
Amortization related to non-real estate investments
|
833
|
821
|
903
|
758
|
734
|
|||||||||||||||
|
Amortization related to real estate revenues(2)
|
37
|
30
|
31
|
29
|
51
|
|||||||||||||||
|
Less:
|
||||||||||||||||||||
|
Interest income
|
(18
|
)
|
(33
|
)
|
(25
|
)
|
(37
|
)
|
(53
|
)
|
||||||||||
|
Gain on sale of real estate, land and other investments
|
73
|
240
|
0
|
(589
|
)
|
0
|
||||||||||||||
|
Gain on involuntary conversion
|
0
|
(274
|
)
|
0
|
0
|
0
|
||||||||||||||
|
EBITDA
|
$
|
34,825
|
$
|
35,643
|
$
|
34,279
|
$
|
32,151
|
$
|
32,422
|
||||||||||
|
(1)
|
See Definitions on page 26.
|
|
(2)
|
Included in real estate revenue in the Statement of Operations.
|
9
INVESTORS REAL ESTATE TRUST AND SUBSIDIARIES
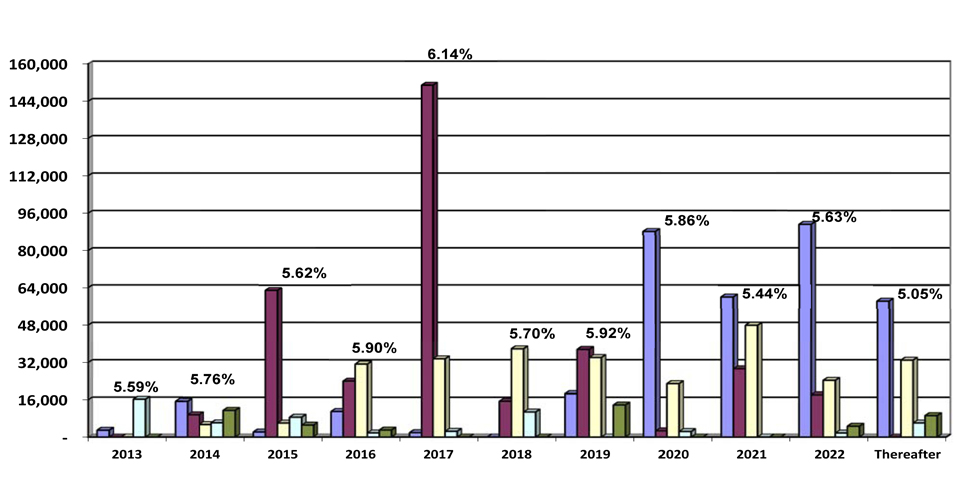
LONG-TERM MORTGAGE DEBT ANALYSIS
(in thousands)
Debt Maturity Schedule
Annual Expirations
Total Mortgage Debt
|
|
Future Maturities of Mortgage Debt
|
|||||||||||||||||||
|
Fiscal Year
|
Fixed Debt
|
Variable Debt
|
Total Debt
|
Weighted
Average(1)
|
% of
Total Debt
|
|||||||||||||||
|
2013
|
$
|
19,196
|
$
|
0
|
$
|
19,196
|
5.59
|
%
|
1.8
|
%
|
||||||||||
|
2014
|
47,383
|
677
|
48,060
|
5.76
|
%
|
4.4
|
%
|
|||||||||||||
|
2015
|
75,072
|
9,750
|
84,822
|
5.62
|
%
|
7.9
|
%
|
|||||||||||||
|
2016
|
71,178
|
0
|
71,178
|
5.90
|
%
|
6.6
|
%
|
|||||||||||||
|
2017
|
188,742
|
0
|
188,742
|
6.14
|
%
|
17.5
|
%
|
|||||||||||||
|
2018
|
64,125
|
0
|
64,125
|
5.70
|
%
|
5.9
|
%
|
|||||||||||||
|
2019
|
98,586
|
5,664
|
104,250
|
5.92
|
%
|
9.6
|
%
|
|||||||||||||
|
2020
|
116,098
|
0
|
116,098
|
5.86
|
%
|
10.7
|
%
|
|||||||||||||
|
2021
|
137,409
|
0
|
137,409
|
5.44
|
%
|
12.7
|
%
|
|||||||||||||
|
2022
|
140,138
|
0
|
140,138
|
5.63
|
%
|
13.0
|
%
|
|||||||||||||
|
Thereafter
|
106,637
|
0
|
106,637
|
5.05
|
%
|
9.9
|
%
|
|||||||||||||
|
Total maturities
|
$
|
1,064,564
|
$
|
16,091
|
$
|
1,080,655
|
5.72
|
%
|
100.0
|
%
|
||||||||||
|
(1)
|
Weighted average interest rate of debt that matures in fiscal year.
|
|
|
07/31/2012
|
04/30/2012
|
01/31/2012
|
10/31/2011
|
07/31/2011
|
|||||||||||||||
|
Balances Outstanding
|
||||||||||||||||||||
|
Mortgage
|
||||||||||||||||||||
|
Fixed rate
|
$
|
1,064,564
|
$
|
1,032,543
|
$
|
1,028,198
|
$
|
1,033,550
|
$
|
996,256
|
||||||||||
|
Variable rate
|
16,091
|
16,146
|
10,519
|
6,075
|
6,706
|
|||||||||||||||
|
Mortgage total
|
$
|
1,080,655
|
$
|
1,048,689
|
$
|
1,038,717
|
$
|
1,039,625
|
$
|
1,002,962
|
||||||||||
|
|
||||||||||||||||||||
|
Weighted Average Interest Rates
|
||||||||||||||||||||
|
Secured
|
5.72
|
%
|
5.78
|
%
|
5.84
|
%
|
5.86
|
%
|
5.90
|
%
|
||||||||||
10
INVESTORS REAL ESTATE TRUST AND SUBSIDIARIES
LONG-TERM MORTGAGE DEBT* DETAIL AS OF JULY 31, 2012
(in thousands)
(in thousands)
|
Property
|
Maturity Date
|
Fiscal 2013
|
Fiscal 2014
|
Fiscal 2015
|
Fiscal 2016
|
Thereafter
|
Total(1)
|
||||||||||||||||||
|
|
|
||||||||||||||||||||||||
|
Multi-Family Residential
|
|
||||||||||||||||||||||||
|
Monticello Village - Monticello, MN
|
3/1/2013
|
$
|
2,941
|
$
|
0
|
$
|
0
|
$
|
0
|
$
|
0
|
$
|
2,941
|
||||||||||||
|
Quarry Ridge - Rochester, MN
|
10/1/2013
|
0
|
11,808
|
0
|
0
|
0
|
11,808
|
||||||||||||||||||
|
East Park - Sioux Falls, SD
|
12/1/2013
|
0
|
1,488
|
0
|
0
|
0
|
1,488
|
||||||||||||||||||
|
Sycamore Village - Sioux Falls, SD
|
12/1/2013
|
0
|
837
|
0
|
0
|
0
|
837
|
||||||||||||||||||
|
Candlelight - Fargo, ND
|
3/1/2014
|
0
|
1,263
|
0
|
0
|
0
|
1,263
|
||||||||||||||||||
|
Evergreen II - Isanti, MN
|
11/1/2014
|
0
|
0
|
2,176
|
0
|
0
|
2,176
|
||||||||||||||||||
|
Campus Center - St Cloud, MN
|
6/1/2015
|
0
|
0
|
0
|
1,333
|
0
|
1,333
|
||||||||||||||||||
|
Campus Knoll - St Cloud, MN
|
6/1/2015
|
0
|
0
|
0
|
889
|
0
|
889
|
||||||||||||||||||
|
Landmark - Grand Forks, ND
|
8/24/2015
|
0
|
0
|
0
|
1,744
|
0
|
1,744
|
||||||||||||||||||
|
Regency Park Estates - St Cloud, MN
|
1/1/2016
|
0
|
0
|
0
|
7,065
|
0
|
7,065
|
||||||||||||||||||
|
Summary of Debt due after Fiscal 2016
|
|
0
|
0
|
0
|
0
|
318,364
|
318,364
|
||||||||||||||||||
|
Sub-Total Multi-Family Residential
|
|
$
|
2,941
|
$
|
15,396
|
$
|
2,176
|
$
|
11,031
|
$
|
318,364
|
$
|
349,908
|
||||||||||||
|
|
|
||||||||||||||||||||||||
|
Commercial Office
|
|
||||||||||||||||||||||||
|
Great Plains - Fargo, ND
|
10/1/2013
|
$
|
0
|
$
|
1,636
|
$
|
0
|
$
|
0
|
$
|
0
|
$
|
1,636
|
||||||||||||
|
Whitewater Plaza - Minnetonka, MN
|
3/1/2014
|
0
|
2,557
|
0
|
0
|
0
|
2,557
|
||||||||||||||||||
|
Whitewater Plaza - Minnetonka, MN
|
3/1/2014
|
0
|
1,326
|
0
|
0
|
0
|
1,326
|
||||||||||||||||||
|
Viromed - Eden Prairie, MN
|
4/1/2014
|
0
|
552
|
0
|
0
|
0
|
552
|
||||||||||||||||||
|
Wirth Corporate Center - Golden Valley, MN
|
4/1/2014
|
0
|
3,538
|
0
|
0
|
0
|
3,538
|
||||||||||||||||||
|
TCA Building - Eagan, MN
|
5/1/2014
|
0
|
0
|
7,424
|
0
|
0
|
7,424
|
||||||||||||||||||
|
Brenwood - Hennepin County, MN
|
7/15/2014
|
0
|
0
|
5,250
|
0
|
0
|
5,250
|
||||||||||||||||||
|
Burnsville Bluffs II - Burnsville, MN
|
8/8/2014
|
0
|
0
|
1,747
|
0
|
0
|
1,747
|
||||||||||||||||||
|
Plymouth IV - Plymouth, MN
|
8/8/2014
|
0
|
0
|
3,222
|
0
|
0
|
3,222
|
||||||||||||||||||
|
Plymouth V - Plymouth, MN
|
8/8/2014
|
0
|
0
|
3,766
|
0
|
0
|
3,766
|
||||||||||||||||||
|
Plaza VII - Boise, ID
|
9/1/2014
|
0
|
0
|
1,037
|
0
|
0
|
1,037
|
||||||||||||||||||
|
Crosstown Centre - Eden Prairie, MN
|
12/1/2014
|
0
|
0
|
3,393
|
0
|
0
|
3,393
|
||||||||||||||||||
|
Crosstown Centre - Eden Prairie, MN
|
12/1/2014
|
0
|
0
|
10,178
|
0
|
0
|
10,178
|
||||||||||||||||||
|
Northgate I - Maple Grove, MN
|
12/10/2014
|
0
|
0
|
5,296
|
0
|
0
|
5,296
|
||||||||||||||||||
|
Plymouth I - Plymouth, MN
|
12/10/2014
|
0
|
0
|
1,187
|
0
|
0
|
1,187
|
||||||||||||||||||
|
Plymouth II - Plymouth, MN
|
12/10/2014
|
0
|
0
|
1,187
|
0
|
0
|
1,187
|
||||||||||||||||||
|
Plymouth III - Plymouth, MN
|
12/10/2014
|
0
|
0
|
1,461
|
0
|
0
|
1,461
|
||||||||||||||||||
|
Benton Business Park - Sauk Rapids, MN
|
1/1/2015
|
0
|
0
|
610
|
0
|
0
|
610
|
||||||||||||||||||
|
West River Business Park - Waite Park, MN
|
1/1/2015
|
0
|
0
|
610
|
0
|
0
|
610
|
||||||||||||||||||
|
Highlands Ranch I - Highlands Ranch, CO
|
3/1/2015
|
0
|
0
|
8,383
|
0
|
0
|
8,383
|
||||||||||||||||||
|
Highlands Ranch II - Highlands Ranch, CO
|
3/1/2015
|
0
|
0
|
8,111
|
0
|
0
|
8,111
|
||||||||||||||||||
|
US Bank Financial Center - Bloomington, MN
|
7/1/2015
|
0
|
0
|
0
|
13,654
|
0
|
13,654
|
||||||||||||||||||
|
Rapid City 900 Concourse Drive - Rapid City, SD
|
8/1/2015
|
0
|
0
|
0
|
1,503
|
0
|
1,503
|
||||||||||||||||||
|
Westgate I - Boise, ID
|
8/1/2015
|
0
|
0
|
0
|
1,224
|
0
|
1,224
|
||||||||||||||||||
|
Westgate II - Boise, ID
|
8/1/2015
|
0
|
0
|
0
|
2,998
|
0
|
2,998
|
||||||||||||||||||
|
Brook Valley I - LaVista, NE
|
1/1/2016
|
0
|
0
|
0
|
1,334
|
0
|
1,334
|
||||||||||||||||||
|
Spring Valley IV - Omaha, NE
|
1/1/2016
|
0
|
0
|
0
|
794
|
0
|
794
|
||||||||||||||||||
|
Spring Valley V - Omaha, NE
|
1/1/2016
|
0
|
0
|
0
|
873
|
0
|
873
|
||||||||||||||||||
|
Spring Valley X - Omaha, NE
|
1/1/2016
|
0
|
0
|
0
|
810
|
0
|
810
|
||||||||||||||||||
|
Spring Valley XI - Omaha, NE
|
1/1/2016
|
0
|
0
|
0
|
794
|
0
|
794
|
||||||||||||||||||
|
Summary of Debt due after Fiscal 2016
|
|
0
|
0
|
0
|
0
|
254,040
|
254,040
|
||||||||||||||||||
|
Sub-Total Commercial Office
|
|
$
|
0
|
$
|
9,609
|
$
|
62,862
|
$
|
23,984
|
$
|
254,040
|
$
|
350,495
|
||||||||||||
11
INVESTORS REAL ESTATE TRUST AND SUBSIDIARIES
LONG-TERM MORTGAGE DEBT* DETAIL AS OF JULY 31, 2012 (continued)
(in thousands)
(in thousands)
|
Property
|
Maturity Date
|
Fiscal 2013
|
Fiscal 2014
|
Fiscal 2015
|
Fiscal 2016
|
Thereafter
|
Total(1)
|
||||||||||||||||||
|
|
|
||||||||||||||||||||||||
|
Commercial Medical
|
|
||||||||||||||||||||||||
|
High Pointe Health Campus - Lake Elmo, MN
|
4/1/2014
|
$
|
0
|
$
|
5,400
|
$
|
0
|
$
|
0
|
$
|
0
|
$
|
5,400
|
||||||||||||
|
Edgewood Vista - Billings, MT
|
12/10/2014
|
0
|
0
|
1,952
|
0
|
0
|
1,952
|
||||||||||||||||||
|
Edgewood Vista - East Grand Forks, MN
|
12/10/2014
|
0
|
0
|
2,974
|
0
|
0
|
2,974
|
||||||||||||||||||
|
Edgewood Vista - Sioux Falls, SD
|
12/10/2014
|
0
|
0
|
1,118
|
0
|
0
|
1,118
|
||||||||||||||||||
|
Garden View Medical - St Paul, MN
|
8/1/2015
|
0
|
0
|
0
|
1,695
|
0
|
1,695
|
||||||||||||||||||
|
2800 Medical Building - Minneapolis, MN
|
9/1/2015
|
0
|
0
|
0
|
5,540
|
0
|
5,540
|
||||||||||||||||||
|
2828 Medical Building - Minneapolis, MN
|
9/1/2015
|
0
|
0
|
0
|
8,492
|
0
|
8,492
|
||||||||||||||||||
|
Edina 6405 France Medical - Edina, MN
|
9/1/2015
|
0
|
0
|
0
|
9,002
|
0
|
9,002
|
||||||||||||||||||
|
Ritchie Medical Plaza - St Paul, MN
|
9/1/2015
|
0
|
0
|
0
|
6,631
|
0
|
6,631
|
||||||||||||||||||
|
Summary of Debt due after Fiscal 2016(2)
|
|
0
|
0
|
0
|
0
|
233,768
|
233,768
|
||||||||||||||||||
|
Sub-Total Commercial Medical
|
|
$
|
0
|
$
|
5,400
|
$
|
6,044
|
$
|
31,360
|
$
|
233,768
|
$
|
276,572
|
||||||||||||
|
|
|
||||||||||||||||||||||||
|
Commercial Industrial
|
|
||||||||||||||||||||||||
|
Dixon Avenue Industrial Park - Des Moines, IA
|
1/1/2013
|
$
|
6,959
|
$
|
0
|
$
|
0
|
$
|
0
|
$
|
0
|
$
|
6,959
|
||||||||||||
|
Bloomington 2000 West 94th Street - Bloomington, MN
|
3/1/2013
|
3,763
|
0
|
0
|
0
|
0
|
3,763
|
||||||||||||||||||
|
Roseville 2929 Long Lake Road - Roseville, MN
|
3/1/2013
|
5,533
|
0
|
0
|
0
|
0
|
5,533
|
||||||||||||||||||
|
Bodycote Industrial Building - Eden Prairie, MN
|
9/1/2013
|
0
|
1,100
|
0
|
0
|
0
|
1,100
|
||||||||||||||||||
|
Cedar Lake Business Center - St. Louis Park, MN
|
11/1/2013
|
0
|
2,320
|
0
|
0
|
0
|
2,320
|
||||||||||||||||||
|
Woodbury 1865 Woodlane - Woodbury, MN
|
11/1/2013
|
0
|
2,730
|
0
|
0
|
0
|
2,730
|
||||||||||||||||||
|
Stone Container - Roseville, MN
|
7/14/2014
|
0
|
0
|
4,500
|
0
|
0
|
4,500
|
||||||||||||||||||
|
Clive 2075 NW 94th St - Clive, IA
|
9/30/2014
|
0
|
0
|
2,204
|
0
|
0
|
2,204
|
||||||||||||||||||
|
Metal Improvement Company - New Brighton, MN
|
9/30/2014
|
0
|
0
|
1,477
|
0
|
0
|
1,477
|
||||||||||||||||||
|
Winsted Industrial Building
|
9/30/2014
|
0
|
0
|
390
|
0
|
0
|
390
|
||||||||||||||||||
|
Stone Container - Fargo, ND
|
12/1/2015
|
0
|
0
|
0
|
787
|
0
|
787
|
||||||||||||||||||
|
Stone Container - Fargo, ND
|
12/1/2015
|
0
|
0
|
0
|
994
|
0
|
994
|
||||||||||||||||||
|
Summary of Debt due after Fiscal 2016
|
|
0
|
0
|
0
|
0
|
23,477
|
23,477
|
||||||||||||||||||
|
Sub-Total Commercial Industrial
|
|
$
|
16,255
|
$
|
6,150
|
$
|
8,571
|
$
|
1,781
|
$
|
23,477
|
$
|
56,234
|
||||||||||||
12
INVESTORS REAL ESTATE TRUST AND SUBSIDIARIES
LONG-TERM MORTGAGE DEBT* DETAIL AS OF JULY 31, 2012 (continued)
(in thousands)
(in thousands)
|
Property
|
Maturity Date
|
Fiscal 2013
|
Fiscal 2014
|
Fiscal 2015
|
Fiscal 2016
|
Thereafter
|
Total(1)
|
||||||||||||||||||
|
|
|
||||||||||||||||||||||||
|
Commercial Retail
|
|
||||||||||||||||||||||||
|
Burnsville I Strip Center - Burnsville, MN
|
6/30/2013
|
$
|
0
|
$
|
377
|
$
|
0
|
$
|
0
|
$
|
0
|
$
|
377
|
||||||||||||
|
Burnsville II Strip Center - Burnsville, MN
|
6/30/2013
|
0
|
300
|
0
|
0
|
0
|
300
|
||||||||||||||||||
|
St Cloud Westgate - St Cloud, MN
|
10/10/2013
|
0
|
3,151
|
0
|
0
|
0
|
3,151
|
||||||||||||||||||
|
Eagan I Retail Center - Eagan, MN(3)
|
12/22/2013
|
0
|
1,327
|
0
|
0
|
0
|
1,327
|
||||||||||||||||||
|
Forest Lake Westlake Center - Forest Lake, MN(3)
|
12/22/2013
|
0
|
4,243
|
0
|
0
|
0
|
4,243
|
||||||||||||||||||
|
Pine City C-Store - Pine City, MN(3)
|
4/20/2014
|
0
|
295
|
0
|
0
|
0
|
295
|
||||||||||||||||||
|
Pine City Evergreen Square - Pine City, MN(3)
|
4/20/2014
|
0
|
1,812
|
0
|
0
|
0
|
1,812
|
||||||||||||||||||
|
Omaha Barnes & Noble - Omaha, NE
|
6/1/2014
|
0
|
0
|
2,525
|
0
|
0
|
2,525
|
||||||||||||||||||
|
Jamestown Buffalo Mall - Jamestown, ND
|
9/1/2014
|
0
|
0
|
693
|
0
|
0
|
693
|
||||||||||||||||||
|
Fargo Express Center - Fargo, ND
|
10/1/2014
|
0
|
0
|
978
|
0
|
0
|
978
|
||||||||||||||||||
|
Lakeville Strip Center - Lakeville, MN
|
10/1/2014
|
0
|
0
|
973
|
0
|
0
|
973
|
||||||||||||||||||
|
Grand Forks MedPark Mall - Grand Forks, ND(3)
|
5/21/2015
|
0
|
0
|
0
|
3,022
|
0
|
3,022
|
||||||||||||||||||
|
Summary of Debt due after Fiscal 2016
|
|
0
|
0
|
0
|
0
|
27,750
|
27,750
|
||||||||||||||||||
|
Sub-Total Commercial Retail
|
|
$
|
0
|
$
|
11,505
|
$
|
5,169
|
$
|
3,022
|
$
|
27,750
|
$
|
47,446
|
||||||||||||
|
|
|
||||||||||||||||||||||||
|
Total
|
|
$
|
19,196
|
$
|
48,060
|
$
|
84,822
|
$
|
71,178
|
$
|
857,399
|
$
|
1,080,655
|
||||||||||||
| * | Mortgage debt does not include the Company's multi-bank line of credit or construction loans. The line of credit has a maturity date of August 12, 2013; as of July 31, 2012, the Company had borrowings of $44.5 million outstanding under this line. Construction loans totaled $25.0 million as of July 31, 2012. |
| (1) | Totals are principal balances as of July 31, 2012. |
| (2) | Subsequent to the end of the first quarter of fiscal year 2013, the Company paid off, without penalty, $20.1 million of commercial mortgage debt with an original maturity date in fiscal year 2023. |
| (3) | Mortgage loan was paid off without penalty subsequent to the end of the first quarter of fiscal year 2013. |
13
INVESTORS REAL ESTATE TRUST AND SUBSIDIARIES
CAPITAL ANALYSIS
(in thousands, except per share and unit amounts)
|
|
Three Months Ended
|
|||||||||||||||||||
|
|
07/31/2012
|
04/30/2012
|
01/31/2012
|
10/31/2011
|
07/31/2011
|
|||||||||||||||
|
Equity Capitalization
|
||||||||||||||||||||
|
Common shares outstanding
|
91,812
|
89,474
|
85,744
|
83,682
|
81,259
|
|||||||||||||||
|
Operating partnership (OP) units outstanding
|
21,171
|
20,332
|
19,596
|
19,534
|
19,958
|
|||||||||||||||
|
Total common shares and OP units outstanding
|
112,983
|
109,806
|
105,340
|
103,216
|
101,217
|
|||||||||||||||
|
Market price per common share (closing price at end of period)
|
$
|
8.16
|
$
|
7.22
|
$
|
7.42
|
$
|
7.41
|
$
|
8.13
|
||||||||||
|
Equity capitalization-common shares and OP units
|
$
|
921,941
|
$
|
792,799
|
$
|
781,623
|
$
|
764,831
|
$
|
822,894
|
||||||||||
|
Recorded book value of preferred shares
|
$
|
27,317
|
$
|
27,317
|
$
|
27,317
|
$
|
27,317
|
$
|
27,317
|
||||||||||
|
Total equity capitalization
|
$
|
949,258
|
$
|
820,116
|
$
|
808,940
|
$
|
792,148
|
$
|
850,211
|
||||||||||
|
|
||||||||||||||||||||
|
Debt Capitalization
|
||||||||||||||||||||
|
Total debt
|
$
|
1,150,123
|
$
|
1,101,564
|
$
|
1,095,416
|
$
|
1,087,625
|
$
|
1,043,152
|
||||||||||
|
Total capitalization
|
$
|
2,099,381
|
$
|
1,621,680
|
$
|
1,604,356
|
$
|
1,879,773
|
$
|
1,893,363
|
||||||||||
|
|
||||||||||||||||||||
|
Total debt to total capitalization
|
0.55:1
|
0.57:1
|
0.58:1
|
0.58:1
|
0.55:1
|
|||||||||||||||
|
|
||||||||||||||||||||
|
|
Three Months Ended
|
|||||||||||||||||||
|
|
07/31/2012
|
04/30/2012
|
01/31/2012
|
10/31/2011
|
07/31/2011
|
|||||||||||||||
|
Earnings to fixed charges(1)
|
1.11
|
x
|
1.25
|
x
|
1.15
|
x
|
1.05
|
x
|
1.10
|
x
|
||||||||||
|
Earnings to combined fixed charges and preferred distributions(1)
|
1.07
|
x
|
1.21
|
x
|
1.11
|
x
|
1.02
|
x
|
1.06
|
x
|
||||||||||
|
Debt service coverage ratio(1)
|
1.45
|
x
|
1.49
|
x
|
1.43
|
x
|
1.37
|
x
|
1.41
|
x
|
||||||||||
|
|
||||||||||||||||||||
|
Distribution Data
|
||||||||||||||||||||
|
Common shares and units outstanding at record date
|
111,525
|
106,642
|
103,761
|
101,439
|
100,725
|
|||||||||||||||
|
Total common distribution paid
|
$
|
14,413
|
$
|
13,809
|
$
|
13,486
|
$
|
13,186
|
$
|
17,275
|
||||||||||
|
Common distribution per share and unit
|
$
|
.1300
|
$
|
.1300
|
$
|
.1300
|
$
|
.1300
|
$
|
.1715
|
||||||||||
|
Payout ratio (FFO per share and unit basis)(1)
|
81.3
|
%
|
72.2
|
%
|
81.3
|
%
|
86.7
|
%
|
107.2
|
%
|
||||||||||
|
Payout ratio (AFFO per share and unit basis)(1)
|
130.0
|
%
|
118.2
|
%
|
118.2
|
%
|
144.4
|
%
|
155.9
|
%
|
||||||||||
|
(1)
|
See Definitions on page 26.
|
14
INVESTORS REAL ESTATE TRUST AND SUBSIDIARIES
STABILIZED PROPERTIES NET OPERATING INCOME SUMMARY
(in thousands)
|
|
Stabilized Properties(1)
|
|||||||||||
|
|
Three Months Ended
July 31,
|
|||||||||||
|
Segment
|
2012
|
2011
|
%
Change
|
|||||||||
|
Multi-Family Residential
|
$
|
10,038
|
$
|
9,072
|
10.6
|
%
|
||||||
|
Commercial Office
|
9,349
|
9,871
|
(5.3
|
)%
|
||||||||
|
Commercial Medical
|
10,371
|
11,097
|
(6.5
|
)%
|
||||||||
|
Commercial Industrial
|
2,440
|
2,469
|
(1.2
|
)%
|
||||||||
|
Commercial Retail
|
2,195
|
2,145
|
2.3
|
%
|
||||||||
|
|
$
|
34,393
|
$
|
34,654
|
(0.8
|
)%
|
||||||
|
(1)
|
See list of properties excluded from stabilized properties on page ii.
|
15
INVESTORS REAL ESTATE TRUST AND SUBSIDIARIES
NET OPERATING INCOME DETAIL
(in thousands)
|
|
Three Months Ended July 31, 2012
|
|||||||||||||||||||||||||||
|
|
Reporting Segments
|
|||||||||||||||||||||||||||
|
|
Multi-Family
Residential
|
Commercial
Office
|
Commercial
Medical
|
Commercial
Industrial
|
Commercial
Retail
|
Corporate and
Other
|
Total
|
|||||||||||||||||||||
|
Real estate rental revenue
|
||||||||||||||||||||||||||||
|
Stabilized(1)
|
$
|
18,331
|
$
|
18,638
|
$
|
14,331
|
$
|
3,459
|
$
|
3,351
|
$
|
0
|
$
|
58,110
|
||||||||||||||
|
Non-Stabilized
|
3,304
|
0
|
996
|
0
|
0
|
0
|
4,300
|
|||||||||||||||||||||
|
Total
|
21,635
|
18,638
|
15,327
|
3,459
|
3,351
|
0
|
62,410
|
|||||||||||||||||||||
|
|
||||||||||||||||||||||||||||
|
Real estate expenses
|
||||||||||||||||||||||||||||
|
Stabilized(1)
|
8,293
|
9,289
|
3,960
|
1,019
|
1,156
|
0
|
23,717
|
|||||||||||||||||||||
|
Non-Stabilized
|
1,229
|
0
|
122
|
0
|
0
|
0
|
1,351
|
|||||||||||||||||||||
|
Total
|
9,522
|
9,289
|
4,082
|
1,019
|
1,156
|
0
|
25,068
|
|||||||||||||||||||||
|
|
||||||||||||||||||||||||||||
|
Gain on involuntary conversion
|
||||||||||||||||||||||||||||
|
Stabilized(1)
|
0
|
0
|
0
|
0
|
0
|
0
|
0
|
|||||||||||||||||||||
|
Total
|
0
|
0
|
0
|
0
|
0
|
0
|
0
|
|||||||||||||||||||||
|
|
||||||||||||||||||||||||||||
|
Stabilized(1)
|
10,038
|
9,349
|
10,371
|
2,440
|
2,195
|
0
|
34,393
|
|||||||||||||||||||||
|
Non-Stabilized
|
2,075
|
0
|
874
|
0
|
0
|
0
|
2,949
|
|||||||||||||||||||||
|
Net operating income
|
$
|
12,113
|
$
|
9,349
|
$
|
11,245
|
$
|
2,440
|
$
|
2,195
|
$
|
0
|
$
|
37,342
|
||||||||||||||
|
|
||||||||||||||||||||||||||||
|
Reconciliation of NOI to net income (loss) available to common shareholders
|
||||||||||||||||||||||||||||
|
Depreciation/amortization
|
$
|
(4,588
|
)
|
$
|
(5,211
|
)
|
$
|
(4,477
|
)
|
$
|
(940
|
)
|
$
|
(934
|
)
|
$
|
(136
|
)
|
$
|
(16,286
|
)
|
|||||||
|
Administrative, advisory and trustee fees
|
0
|
0
|
0
|
0
|
0
|
(2,096
|
)
|
(2,096
|
)
|
|||||||||||||||||||
|
Other expenses
|
0
|
0
|
0
|
0
|
0
|
(519
|
)
|
(519
|
)
|
|||||||||||||||||||
|
Interest expense
|
(4,909
|
)
|
(5,270
|
)
|
(4,099
|
)
|
(874
|
)
|
(707
|
)
|
(658
|
)
|
(16,517
|
)
|
||||||||||||||
|
Interest and other income
|
0
|
0
|
0
|
0
|
0
|
142
|
142
|
|||||||||||||||||||||
|
Income(loss)from continuing operations
|
2,616
|
(1,132
|
)
|
2,669
|
626
|
554
|
(3,267
|
)
|
2,066
|
|||||||||||||||||||
|
Income(loss) from discontinued operations
|
0
|
0
|
0
|
0
|
(64
|
)
|
(6
|
)
|
(70
|
)
|
||||||||||||||||||
|
Net income (loss)
|
2,616
|
(1,132
|
)
|
2,669
|
626
|
490
|
(3,273
|
)
|
1,996
|
|||||||||||||||||||
|
Net income attributable to noncontrolling interests – Operating Partnership
|
0
|
0
|
0
|
0
|
0
|
(251
|
)
|
(251
|
)
|
|||||||||||||||||||
|
Net income attributable to noncontrolling interests – consolidated real estate entities
|
0
|
0
|
0
|
0
|
0
|
(66
|
)
|
(66
|
)
|
|||||||||||||||||||
|
Net income (loss) attributable to Investors Real Estate Trust
|
2,616
|
(1,132
|
)
|
2,669
|
626
|
490
|
(3,590
|
)
|
1,679
|
|||||||||||||||||||
|
Dividends to preferred shareholders
|
0
|
0
|
0
|
0
|
0
|
(593
|
)
|
(593
|
)
|
|||||||||||||||||||
|
NET INCOME (LOSS) AVAILABLE TO COMMON SHAREHOLDERS
|
$
|
2,616
|
(1,132
|
)
|
2,669
|
626
|
490
|
$
|
(4,183
|
)
|
$
|
1,086
|
||||||||||||||||
|
(1)
|
See list of properties excluded from stabilized properties on page ii.
|
16
INVESTORS REAL ESTATE TRUST AND SUBSIDIARIES
NET OPERATING INCOME DETAIL
(in thousands)
|
|
Three Months Ended July 31, 2011
|
|||||||||||||||||||||||||||
|
|
Reporting Segments
|
|||||||||||||||||||||||||||
|
|
Multi-Family
Residential
|
Commercial
Office
|
Commercial
Medical
|
Commercial
Industrial
|
Commercial
Retail
|
Corporate and
Other
|
Total
|
|||||||||||||||||||||
|
Real estate rental revenue
|
||||||||||||||||||||||||||||
|
Stabilized(1)
|
$
|
17,387
|
$
|
18,815
|
$
|
16,617
|
$
|
3,435
|
$
|
3,208
|
$
|
0
|
$
|
59,462
|
||||||||||||||
|
Non-Stabilized
|
95
|
0
|
0
|
0
|
0
|
0
|
95
|
|||||||||||||||||||||
|
Total
|
17,482
|
18,815
|
16,617
|
3,435
|
3,208
|
0
|
59,557
|
|||||||||||||||||||||
|
|
||||||||||||||||||||||||||||
|
Real estate expenses
|
||||||||||||||||||||||||||||
|
Stabilized(1)
|
8,315
|
8,944
|
5,520
|
966
|
1,063
|
0
|
24,808
|
|||||||||||||||||||||
|
Non-Stabilized
|
51
|
0
|
0
|
0
|
0
|
0
|
51
|
|||||||||||||||||||||
|
Total
|
8,366
|
8,944
|
5,520
|
966
|
1,063
|
0
|
24,859
|
|||||||||||||||||||||
|
|
||||||||||||||||||||||||||||
|
Net Operating Income (NOI)
|
||||||||||||||||||||||||||||
|
Stabilized(1)
|
9,072
|
9,871
|
11,097
|
2,469
|
2,145
|
0
|
34,654
|
|||||||||||||||||||||
|
Non-Stabilized
|
44
|
0
|
0
|
0
|
0
|
0
|
44
|
|||||||||||||||||||||
|
Net operating income
|
$
|
9,116
|
$
|
9,871
|
$
|
11,097
|
$
|
2,469
|
$
|
2,145
|
$
|
0
|
$
|
34,698
|
||||||||||||||
|
|
||||||||||||||||||||||||||||
|
Reconciliation of NOI to net income (loss) available to common shareholders
|
||||||||||||||||||||||||||||
|
Depreciation/amortization
|
$
|
(3,519
|
)
|
$
|
(5,361
|
)
|
$
|
(4,193
|
)
|
$
|
(880
|
)
|
$
|
(821
|
)
|
$
|
(99
|
)
|
$
|
(14,873
|
)
|
|||||||
|
Administrative, advisory and trustee services
|
0
|
0
|
0
|
0
|
0
|
(2,181
|
)
|
(2,181
|
)
|
|||||||||||||||||||
|
Other expenses
|
0
|
0
|
0
|
0
|
0
|
(315
|
)
|
(315
|
)
|
|||||||||||||||||||
|
Interest expense
|
(4,521
|
)
|
(5,198
|
)
|
(3,940
|
)
|
(936
|
)
|
(768
|
)
|
(518
|
)
|
(15,881
|
)
|
||||||||||||||
|
Interest and other income
|
0
|
0
|
0
|
0
|
0
|
153
|
153
|
|||||||||||||||||||||
|
Income (loss) from continuing operations
|
1,076
|
(688
|
)
|
2,964
|
653
|
556
|
(2,960
|
)
|
1,601
|
|||||||||||||||||||
|
Income from discontinued operations
|
0
|
0
|
(24
|
)
|
0
|
(4
|
)
|
0
|
(28
|
)
|
||||||||||||||||||
|
Net income (loss)
|
1,076
|
(688
|
)
|
2,940
|
653
|
552
|
(2,960
|
)
|
1,573
|
|||||||||||||||||||
|
Net income attributable to noncontrolling interests – Operating Partnership
|
0
|
0
|
0
|
0
|
0
|
(178
|
)
|
(178
|
)
|
|||||||||||||||||||
|
Net loss attributable to noncontrolling interests – consolidated real estate entities
|
0
|
0
|
0
|
0
|
0
|
26
|
26
|
|||||||||||||||||||||
|
Net income (loss) attributable to Investors Real Estate Trust
|
1,076
|
(688
|
)
|
2,940
|
653
|
552
|
(3,112
|
)
|
1,421
|
|||||||||||||||||||
|
Dividends to preferred shareholders
|
0
|
0
|
0
|
0
|
0
|
(593
|
)
|
(593
|
)
|
|||||||||||||||||||
|
NET INCOME (LOSS) AVAILABLE TO COMMON SHAREHOLDERS
|
$
|
1,076
|
$
|
(688
|
)
|
$
|
2,940
|
$
|
653
|
$
|
552
|
$
|
(3,705
|
)
|
$
|
828
|
||||||||||||
|
(1)
|
See list of properties excluded from stabilized properties on page ii.
|
17
INVESTORS REAL ESTATE TRUST AND SUBSIDIARIES
STABILIZED PROPERTIES AND ALL PROPERTIES PHYSICAL OCCUPANCY LEVELS BY SEGMENT
1st Quarter Fiscal 2013 vs. 1st Quarter Fiscal 2012
|
Segments
|
Stabilized Properties
|
All Properties
|
||
|
|
1st Quarter
|
1st Quarter
|
1st Quarter
|
1st Quarter
|
|
|
Fiscal 2013
|
Fiscal 2012
|
Fiscal 2013
|
Fiscal 2012
|
|
Multi-Family Residential
|
93.5%
|
91.5%
|
92.8%
|
91.5%
|
|
Commercial Office
|
78.8%
|
78.4%
|
78.8%
|
78.4%
|
|
Commercial Medical
|
95.0%
|
95.7%
|
95.3%
|
95.7%
|
|
Commercial Industrial
|
90.0%
|
94.7%
|
90.0%
|
94.7%
|
|
Commercial Retail
|
87.5%
|
86.0%
|
87.5%
|
86.0%
|
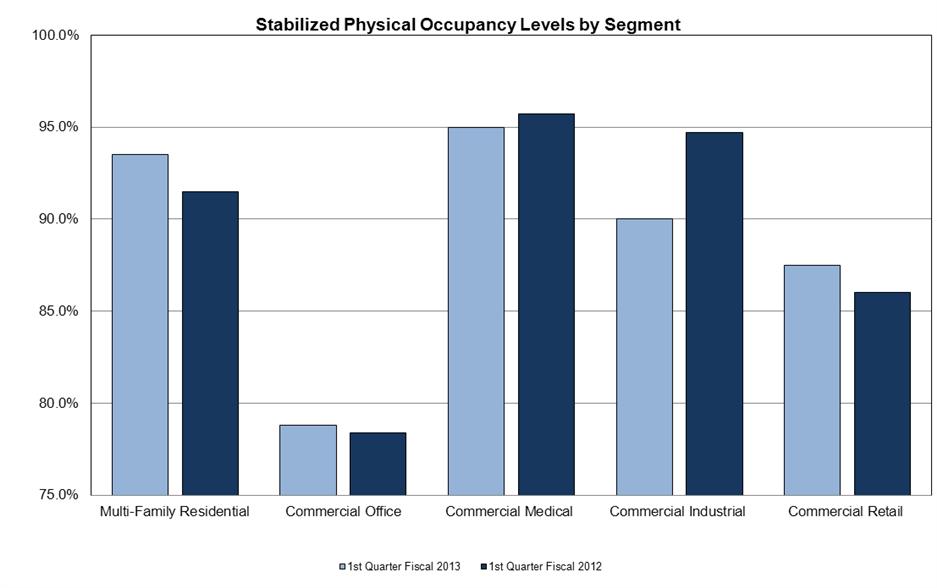
18
INVESTORS REAL ESTATE TRUST AND SUBSIDIARIES
COMMERCIAL LEASING SUMMARY
for the three months ended July 31, 2012
|
|
Three Months Ended July 31, 2012
|
|||||||||||||||||||||||
|
|
New(1)
|
Renew(2)
|
Total
|
Expiring(3)
|
Net Change
|
Percentage
Change
|
||||||||||||||||||
|
Gross Square Footage
|
||||||||||||||||||||||||
|
Commercial Office
|
34,640
|
64,179
|
98,819
|
243,502
|
(144,683
|
)
|
||||||||||||||||||
|
Commercial Medical
|
6,887
|
1,468
|
8,355
|
9,803
|
(1,448
|
)
|
||||||||||||||||||
|
Commercial Industrial
|
0
|
9,702
|
9,702
|
32,717
|
(23,015
|
)
|
||||||||||||||||||
|
Commercial Retail
|
9,070
|
2,420
|
11,490
|
23,292
|
(11,802
|
)
|
||||||||||||||||||
|
Total All Segments
|
50,597
|
77,769
|
128,366
|
309,314
|
(180,948
|
)
|
||||||||||||||||||
|
|
||||||||||||||||||||||||
|
Weighted Average Rental Rates(3)
|
||||||||||||||||||||||||
|
Commercial Office
|
$
|
15.71
|
$
|
16.10
|
$
|
15.96
|
$
|
13.51
|
$
|
2.45
|
18.2
|
%
|
||||||||||||
|
Commercial Medical
|
22.41
|
23.16
|
22.54
|
21.83
|
0.71
|
3.3
|
%
|
|||||||||||||||||
|
Commercial Industrial
|
0.00
|
5.84
|
5.84
|
3.88
|
1.96
|
50.5
|
%
|
|||||||||||||||||
|
Commercial Retail
|
12.40
|
16.62
|
13.29
|
9.37
|
3.92
|
41.8
|
%
|
|||||||||||||||||
|
Total All Segments
|
$
|
16.03
|
$
|
14.97
|
$
|
15.39
|
$
|
12.44
|
$
|
2.95
|
23.7
|
%
|
||||||||||||
|
|
||||||||||||||||||||||||
|
|
Three Months Ended July 31, 2012
|
|||||
|
|
New(1)
|
Renew(2)
|
Total
|
|||
|
Weighted Average Term of New/Renewed Leased(4)
|
|
|
|
|
|
|
|
Commercial Office
|
|
3.5
|
|
2.9
|
|
3.1
|
|
Commercial Medical
|
|
5.4
|
|
5.0
|
|
5.3
|
|
Commercial Industrial
|
|
0.0
|
|
3.3
|
|
3.3
|
|
Commercial Retail
|
|
3.7
|
|
4.0
|
|
3.8
|
|
Total All Segments
|
|
4.1
|
|
3.2
|
|
3.6
|
|
(1)
|
Does not include leases in place on acquired properties.
|
|
(2)
|
Renewals may include leases that have renewed prior to expiration date. Square footage or rental rate changes on renewals are included in calculation.
|
|
(3)
|
Expired leases include leases with tenants who have vacated or renewed. Excluded from expired leases are leases that have been amended to extend the term, including leases on a month-to-month basis.
|
| (4) | Term in years. |
19
INVESTORS REAL ESTATE TRUST AND SUBSIDIARIES
COMMERCIAL LEASING COMMITMENTS
for the three months ended July 31, 2012
|
|
1st Quarter Fiscal 2013 Total
|
|||||||||||
|
|
(dollars in thousands)
|
|||||||||||
|
|
New
|
Renew
|
Total Dollars
|
|||||||||
|
Tenant Improvements
|
||||||||||||
|
Commercial Office
|
$
|
489
|
$
|
121
|
$
|
610
|
||||||
|
Commercial Medical
|
373
|
37
|
410
|
|||||||||
|
Commercial Industrial
|
0
|
5
|
5
|
|||||||||
|
Commercial Retail
|
3
|
0
|
3
|
|||||||||
|
Subtotal
|
$
|
865
|
$
|
163
|
$
|
1,028
|
||||||
|
|
||||||||||||
|
Tenant Improvements per square foot
|
||||||||||||
|
Commercial Office
|
$
|
14.12
|
$
|
1.89
|
$
|
6.18
|
||||||
|
Commercial Medical
|
54.15
|
25.00
|
49.03
|
|||||||||
|
Commercial Industrial
|
0.00
|
0.52
|
0.52
|
|||||||||
|
Commercial Retail
|
0.33
|
0.00
|
0.26
|
|||||||||
|
All Segments
|
$
|
17.10
|
$
|
2.09
|
$
|
8.01
|
||||||
|
|
||||||||||||
|
Leasing Costs
|
||||||||||||
|
Commercial Office
|
$
|
264
|
$
|
108
|
$
|
372
|
||||||
|
Commercial Medical
|
48
|
4
|
52
|
|||||||||
|
Commercial Industrial
|
0
|
19
|
19
|
|||||||||
|
Commercial Retail
|
6
|
3
|
9
|
|||||||||
|
Subtotal
|
$
|
318
|
$
|
134
|
$
|
452
|
||||||
|
|
||||||||||||
|
Leasing Costs per square foot
|
||||||||||||
|
Commercial Office
|
$
|
7.62
|
$
|
1.68
|
$
|
3.76
|
||||||
|
Commercial Medical
|
7.05
|
2.85
|
6.31
|
|||||||||
|
Commercial Industrial
|
0.00
|
1.98
|
1.98
|
|||||||||
|
Commercial Retail
|
0.62
|
1.21
|
0.74
|
|||||||||
|
All Segments
|
$
|
6.29
|
$
|
1.72
|
$
|
3.52
|
||||||
|
|
||||||||||||
|
Tenant Improvements and Leasing Costs
|
||||||||||||
|
Commercial Office
|
$
|
753
|
$
|
229
|
$
|
982
|
||||||
|
Commercial Medical
|
421
|
41
|
462
|
|||||||||
|
Commercial Industrial
|
0
|
24
|
24
|
|||||||||
|
Commercial Retail
|
9
|
3
|
12
|
|||||||||
|
Total
|
$
|
1,183
|
$
|
297
|
$
|
1,480
|
||||||
|
|
||||||||||||
|
Tenant Improvements and Leasing Costs per square foot
|
||||||||||||
|
Commercial Office
|
$
|
21.74
|
$
|
3.57
|
$
|
9.94
|
||||||
|
Commercial Medical
|
61.20
|
27.85
|
55.34
|
|||||||||
|
Commercial Industrial
|
0.00
|
2.50
|
2.50
|
|||||||||
|
Commercial Retail
|
0.95
|
1.21
|
1.00
|
|||||||||
|
All Segments
|
$
|
23.38
|
$
|
3.82
|
$
|
11.53
|
||||||
20
INVESTORS REAL ESTATE TRUST AND SUBSIDIARIES
MULTI-FAMILY RESIDENTIAL SUMMARY
|
|
Three Months Ended
|
|||||||||||||||||||
|
|
07/31/2012
|
04/30/2012
|
01/31/2012
|
10/31/2011
|
07/31/2011
|
|||||||||||||||
|
Number of Units
|
10,143
|
9,161
|
8,921
|
8,885
|
8,664
|
|||||||||||||||
|
Average Investment Per Unit
|
||||||||||||||||||||
|
Stabilized
|
$
|
57,255
|
$
|
56,983
|
$
|
56,955
|
$
|
56,615
|
$
|
56,151
|
||||||||||
|
Non-Stabilized
|
83,113
|
81,277
|
75,465
|
65,675
|
55,365
|
|||||||||||||||
|
|
$
|
60,724
|
$
|
58,518
|
$
|
57,762
|
$
|
56,926
|
$
|
56,140
|
||||||||||
|
|
||||||||||||||||||||
|
Average Scheduled Rent(1) per Unit
|
||||||||||||||||||||
|
Stabilized
|
$
|
721
|
$
|
713
|
$
|
711
|
$
|
705
|
$
|
700
|
||||||||||
|
Non-Stabilized
|
889
|
887
|
841
|
949
|
785
|
|||||||||||||||
|
|
$
|
743
|
$
|
724
|
$
|
716
|
$
|
714
|
$
|
701
|
||||||||||
|
|
||||||||||||||||||||
|
Total Receipts per Unit
|
||||||||||||||||||||
|
Stabilized
|
$
|
711
|
$
|
704
|
$
|
700
|
$
|
696
|
$
|
674
|
||||||||||
|
Non-Stabilized
|
831
|
831
|
826
|
814
|
793
|
|||||||||||||||
|
|
$
|
727
|
$
|
712
|
$
|
705
|
$
|
700
|
$
|
675
|
||||||||||
|
|
||||||||||||||||||||
|
Total Recurring Capital Expenditures per Unit(1)
|
||||||||||||||||||||
|
Stabilized
|
$
|
207
|
$
|
156
|
$
|
155
|
$
|
213
|
$
|
228
|
||||||||||
|
Non-Stabilized
|
123
|
119
|
179
|
110
|
320
|
|||||||||||||||
|
|
$
|
194
|
$
|
154
|
$
|
156
|
$
|
209
|
$
|
229
|
||||||||||
|
|
||||||||||||||||||||
|
Physical Occupancy%
|
||||||||||||||||||||
|
Stabilized
|
93.5
|
%
|
94.2
|
%
|
93.9
|
%
|
95.2
|
%
|
91.4
|
%
|
||||||||||
|
Non-Stabilized
|
88.7
|
%
|
86.8
|
%
|
77.4
|
%
|
82.2
|
%
|
97.0
|
%
|
||||||||||
|
|
92.8
|
%
|
93.7
|
%
|
93.2
|
%
|
94.6
|
%
|
91.5
|
%
|
||||||||||
|
|
||||||||||||||||||||
|
Operating Expenses as a % of Scheduled Rent
|
||||||||||||||||||||
|
Stabilized
|
44.9
|
%
|
46.4
|
%
|
45.9
|
%
|
47.1
|
%
|
46.3
|
%
|
||||||||||
|
Non-Stabilized
|
34.8
|
%
|
39.0
|
%
|
40.5
|
%
|
36.5
|
%
|
43.1
|
%
|
||||||||||
|
Total
|
43.3
|
%
|
45.8
|
%
|
45.6
|
%
|
46.6
|
%
|
46.2
|
%
|
||||||||||
| (1) | See Definitions on page 26. |
21
INVESTORS REAL ESTATE TRUST AND SUBSIDIARIES
10 LARGEST COMMERCIAL TENANTS – BASED ON ANNUALIZED BASE RENT(1)
as of July 1, 2012
|
Tenant
|
Number of
Properties
|
Average
Remaining
Lease Term
in Months
|
% of Total
Commercial
Segments'
Minimum
Rents
|
Aggregate
Rentable
Square Feet
|
% of Aggregate
Occupied
Square
Feet
|
|
Affiliates of Edgewood Vista
|
32
|
94
|
12.4%
|
1,450,585
|
13.6%
|
|
St. Luke's Hospital of Duluth, Inc.
|
6
|
42
|
3.5%
|
198,775
|
1.9%
|
|
Fairview Health Services
|
9
|
75
|
3.4%
|
243,581
|
2.3%
|
|
Applied Underwriters
|
3
|
55
|
2.2%
|
141,724
|
1.3%
|
|
Affiliates of Siemens USA (NYSE: SI)
|
2
|
56
|
1.6%
|
112,848
|
1.1%
|
|
HealthEast Care System
|
1
|
79
|
1.6%
|
114,316
|
1.1%
|
|
Nebraska Orthopedic Hospital
|
1
|
200
|
1.3%
|
61,758
|
0.6%
|
|
Microsoft (NASDAQ: MSFT)
|
1
|
77
|
1.3%
|
122,040
|
1.1%
|
|
Arcadis Corporate Services, Inc.
|
1
|
48
|
1.2%
|
71,430
|
0.7%
|
|
State of Idaho Department of Health and Welfare
|
2
|
67
|
1.1%
|
103,342
|
1.0%
|
|
Total/Weighted Average
|
|
80
|
29.6%
|
2,620,399
|
24.7%
|
| (1) | See Definitions on page 26. |
22
INVESTORS REAL ESTATE TRUST AND SUBSIDIARIES
LEASE EXPIRATIONS
as of July 31, 2012
|
|
(dollars in thousands except average rental rates)
|
|||||||||||||||||||||||
|
Fiscal Year
|
Number of
Leases
|
Rentable
Square Feet
|
% of Rentable
Square Feet
|
Annualized
Rent*
|
Average
Rental
Rate
|
% of
Annualized
Base Rent
|
||||||||||||||||||
|
Commercial Office
|
||||||||||||||||||||||||
|
2013
|
35
|
255,473
|
6.7
|
%
|
$
|
3,474
|
$
|
13.60
|
6.3
|
%
|
||||||||||||||
|
2014
|
57
|
547,111
|
14.4
|
%
|
6,919
|
12.65
|
12.6
|
%
|
||||||||||||||||
|
2015
|
74
|
506,293
|
13.4
|
%
|
7,333
|
14.48
|
13.3
|
%
|
||||||||||||||||
|
2016
|
42
|
559,085
|
14.8
|
%
|
8,854
|
15.84
|
16.1
|
%
|
||||||||||||||||
|
2017
|
44
|
827,259
|
21.8
|
%
|
13,828
|
16.72
|
25.2
|
%
|
||||||||||||||||
|
2018 and thereafter
|
47
|
1,093,541
|
28.9
|
%
|
14,565
|
13.32
|
26.5
|
%
|
||||||||||||||||
|
|
299
|
3,788,762
|
100.0
|
%
|
$
|
54,973
|
$
|
14.51
|
100.0
|
%
|
||||||||||||||
|
|
||||||||||||||||||||||||
|
Commercial Medical
|
||||||||||||||||||||||||
|
2013
|
19
|
111,711
|
4.0
|
%
|
$
|
2,335
|
$
|
20.90
|
4.9
|
%
|
||||||||||||||
|
2014
|
24
|
395,597
|
14.3
|
%
|
6,856
|
17.33
|
14.4
|
%
|
||||||||||||||||
|
2015
|
15
|
59,362
|
2.2
|
%
|
1,428
|
24.06
|
3.0
|
%
|
||||||||||||||||
|
2016
|
24
|
175,113
|
6.3
|
%
|
3,590
|
20.50
|
7.6
|
%
|
||||||||||||||||
|
2017
|
20
|
133,237
|
4.8
|
%
|
2,812
|
21.11
|
5.9
|
%
|
||||||||||||||||
|
2018 and thereafter
|
85
|
1,893,228
|
68.4
|
%
|
30,475
|
16.10
|
64.2
|
%
|
||||||||||||||||
|
|
187
|
2,768,248
|
100.0
|
%
|
$
|
47,496
|
$
|
17.16
|
100.0
|
%
|
||||||||||||||
|
|
||||||||||||||||||||||||
|
Commercial Industrial
|
||||||||||||||||||||||||
|
2013
|
4
|
193,988
|
7.5
|
%
|
$
|
505
|
$
|
2.60
|
4.9
|
%
|
||||||||||||||
|
2014
|
10
|
321,629
|
12.5
|
%
|
1,217
|
3.78
|
11.8
|
%
|
||||||||||||||||
|
2015
|
6
|
344,493
|
13.4
|
%
|
1,398
|
4.06
|
13.5
|
%
|
||||||||||||||||
|
2016
|
9
|
689,564
|
26.7
|
%
|
2,976
|
4.32
|
28.8
|
%
|
||||||||||||||||
|
2017
|
5
|
311,141
|
12.1
|
%
|
1,175
|
3.78
|
11.4
|
%
|
||||||||||||||||
|
2018 and thereafter
|
7
|
716,095
|
27.8
|
%
|
3,060
|
4.27
|
29.6
|
%
|
||||||||||||||||
|
|
41
|
2,576,910
|
100.0
|
%
|
$
|
10,331
|
$
|
4.01
|
100.0
|
%
|
||||||||||||||
|
|
||||||||||||||||||||||||
|
Commercial Retail
|
||||||||||||||||||||||||
|
2013
|
23
|
125,275
|
10.8
|
%
|
$
|
801
|
$
|
6.39
|
8.2
|
%
|
||||||||||||||
|
2014
|
41
|
209,011
|
18.0
|
%
|
1,320
|
6.32
|
13.6
|
%
|
||||||||||||||||
|
2015
|
34
|
296,123
|
25.5
|
%
|
2,269
|
7.66
|
23.4
|
%
|
||||||||||||||||
|
2016
|
23
|
97,266
|
8.4
|
%
|
1,160
|
11.93
|
11.9
|
%
|
||||||||||||||||
|
2017
|
22
|
102,084
|
8.8
|
%
|
1,094
|
10.72
|
11.3
|
%
|
||||||||||||||||
|
2018 and thereafter
|
24
|
331,120
|
28.5
|
%
|
3,070
|
9.27
|
31.6
|
%
|
||||||||||||||||
|
|
167
|
1,160,879
|
100.0
|
%
|
$
|
9,714
|
$
|
8.37
|
100.0
|
%
|
||||||||||||||
|
|
||||||||||||||||||||||||
|
Commercial Total
|
||||||||||||||||||||||||
|
2013
|
81
|
686,447
|
6.7
|
%
|
$
|
7,115
|
$
|
10.36
|
5.8
|
%
|
||||||||||||||
|
2014
|
132
|
1,473,348
|
14.3
|
%
|
16,312
|
11.07
|
13.3
|
%
|
||||||||||||||||
|
2015
|
129
|
1,206,271
|
11.7
|
%
|
12,428
|
10.30
|
10.2
|
%
|
||||||||||||||||
|
2016
|
98
|
1,521,028
|
14.8
|
%
|
16,580
|
10.90
|
13.5
|
%
|
||||||||||||||||
|
2017
|
91
|
1,373,721
|
13.3
|
%
|
18,909
|
13.76
|
15.4
|
%
|
||||||||||||||||
|
2018 and thereafter
|
163
|
4,033,984
|
39.2
|
%
|
51,170
|
12.68
|
41.8
|
%
|
||||||||||||||||
|
|
694
|
10,294,799
|
100.0
|
%
|
$
|
122,514
|
$
|
11.90
|
100.0
|
%
|
||||||||||||||
| * | Annualized Base Rent is monthly scheduled rent as of July 1, 2012 (cash basis), multiplied by 12. |
23
INVESTORS REAL ESTATE TRUST AND SUBSIDIARIES
FISCAL 2013 ACQUISITION SUMMARY
as of July 31, 2012
($'s in thousands)
|
Property
|
Location
|
Segment Type
|
Acquisition
Date
|
Square
Feet/Units
|
Leased
Percentage
At
Acquisition
|
July 31,
2012 Leased
Percentage
|
Acquisition
Cost
|
||||||||||||
|
|
|
|
|
||||||||||||||||
|
Villa West
|
Topeka, KS
|
Multi-Family Residential
|
May 8, 2012
|
308
|
98.1
|
%
|
94.8
|
%
|
$
|
17,650
|
|||||||||
|
Colony
|
Lincoln, NE
|
Multi-Family Residential
|
June 4, 2012
|
232
|
98.3
|
%
|
99.1
|
%
|
17,500
|
||||||||||
|
Lakeside Village
|
Lincoln, NE
|
Multi-Family Residential
|
June 4, 2012
|
208
|
86.5
|
%
|
83.7
|
%
|
17,250
|
||||||||||
|
Quarry Ridge II(1)
|
Rochester, MN
|
Multi-Family Residential
|
June 29, 2012
|
161
|
33.3
|
%
|
50.0
|
%
|
3,543
|
||||||||||
|
Williston Garden Buildings 3 and 4(2)
|
Williston, ND
|
Multi-Family Residential
|
July 31, 2012
|
72
|
98.6
|
%
|
98.6
|
%
|
4,158
|
||||||||||
|
Total Square Feet
|
0 | $ | 60,101 | ||||||||||||||||
|
Total Units
|
981 | ||||||||||||||||||
|
(1)
|
Development property placed in service June 29, 2012. Additional costs paid in fiscal years 2012 and 2011, and land acquired in fiscal year 2007, totaled $13.0 million, for a total project cost at July 31, 2012 of $16.5 million.
|
|
(2)
|
Development property placed in service July 31, 2012. Buildings 1 and 2 were placed in service in fiscal year 2012. Additional costs paid in fiscal year 2012 totaled $12.1 million, for a total project cost at July 31, 2012 of $16.2 million.
|
24
INVESTORS REAL ESTATE TRUST AND SUBSIDIARIES
FISCAL 2013 DEVELOPMENT IN PROGESS SUMMARY
as of July 31, 2012
($'s in thousands)
|
Property and Location
|
Total Rentable
Square Feet
or # of Units
|
Percentage
Leased
or Committed
|
Anticipated
Total
Cost
|
Cost to
Date
|
Anticipated
Construction
Completion
|
|||||||||
|
Spring Wind - Laramie, WY
|
29 assisted living units and 16 memory care units
|
100
|
%
|
3,800
|
3,107
|
2nd Quarter Fiscal 2013
|
||||||||
|
Industrial-Office Build-to-Suit - Minot, ND
|
28,000 sf. commercial industrial building
|
100
|
%
|
5,799
|
3,647
|
2nd Quarter Fiscal 2013
|
||||||||
|
Jamestown Medical Office Building – Jamestown, ND(1)
|
45,000 square foot medical office building
|
88
|
%
|
9,200
|
3,022
|
3rd Quarter Fiscal 2013
|
||||||||
|
Multi-Family Conversion - Minot, ND
|
Convert 15,000 sf. commercial office to 20 multi-family residential units
|
0
|
%
|
3,000
|
647
|
4th Quarter Fiscal 2013
|
||||||||
|
Branch Bank Building – Minot, ND
|
3,700 square foot commercial office building
|
100
|
%
|
1,700
|
75
|
4th Quarter Fiscal 2013
|
||||||||
|
|
|
$
|
23,499
|
$
|
10,498
|
|
||||||||
|
(1)
|
The Company is a 51% partner in the joint venture entity constructing this property; the anticipated total cost amount given is the total cost to the joint venture entity.
|
25
Definitions
July 31, 2012
Adjusted funds from operations (AFFO) is calculated by subtracting from Funds from operations (FFO) (1) tenant improvements and leasing commissions and recurring capital expenditures that are capitalized and amortized and are necessary to maintain our properties and revenue stream and (2) straight line rents, then adding (3) non-real estate depreciation and amortization. AFFO is included herein because we consider it to be a measure of a REIT's ability to incur and service debt and to pay distributions to its shareholders. AFFO is a non-GAAP and non-standardized measure, and may be calculated differently by other REITs.
Annualized base rent (ABR) is calculated as monthly base rent (cash basis) per the lease, as of the reporting period, multiplied by 12.
Debt to total market capitalization is total debt from the balance sheet divided by the sum of total debt from the balance sheet plus the market value of shares outstanding at the end of the period.
Debt service coverage ratio is computed by dividing earnings before interest income and expense, depreciation, amortization and gain on sale of real estate by interest expense and principal amortization.
EBITDA is earnings before interest, taxes, depreciation and amortization. We consider EBITDA to be an appropriate supplemental performance measure because it eliminates depreciation, interest and the gain/loss from property dispositions, which permits investors to view income from operations without the effect of non-cash depreciation or the cost of debt; however, EBIDTA as we calculate it has not been adjusted for the effect of nonrecurring events such as asset impairment and gain/loss on involuntary conversion. EBITDA is a non-GAAP measure. EBITDA as calculated by us is not comparable to EBITDA reported by other REITs that do not define EBITDA exactly as we do.
Funds from operations (FFO) - The National Association of Real Estate Investment Trusts, Inc. (NAREIT) defines FFO as "net income (computed in accordance with generally accepted accounting principles, excluding gains (or losses) from sales of property, plus real estate depreciation and amortization, and adjustments for unconsolidated partnerships and joint ventures. Adjustments for unconsolidated partnerships and joint ventures will be calculated to reflect funds from operations on the same basis." In addition, NAREIT recently clarified its computation of FFO to exclude impairment charges for all periods presented. FFO is a non-GAAP measure1. We consider FFO, which is a standard supplemental measure for equity real estate investment trusts, helpful to investors because it facilitates an understanding of the operating performance of properties without giving effect to impairment write-downs and to real estate depreciation and amortization, which assumes that the value of real estate assets diminishes predictably over time. Since real estate values instead historically rise or fall with market conditions, we believe that FFO provides investors and management with a more accurate indication of our financial and operating results.
Net Operating Income is total real estate revenues less real estate expenses (which consist of utilities, maintenance, real estate taxes, insurance and property management expenses).
Payout ratio (FFO per share and unit basis) - The ratio of the current quarterly or annual distribution rate per common share and unit divided by quarterly or annual FFO per share and unit.
Ratio of earnings to fixed charges - The ratio of earnings to fixed charges is computed by dividing earnings by fixed charges. For this purpose, earnings consist of income from continuing operations plus fixed charges and preferred distributions, less adjustments for noncontrolling interests - consolidated real estate entities, capitalized interest and preferred distributions. Fixed charges consist of mortgage and loan interest expense, whether expensed or capitalized, the amortization of debt expense and capitalized interest.
Ratio of earnings to combined fixed charges and preferred distributions - The ratio of earnings to combined fixed charges and preferred distributions is computed by dividing earnings by combined fixed charges and preferred distributions. For this purpose, earnings consist of income from continuing operations plus fixed charges and preferred distributions, less adjustments for noncontrolling interests - consolidated real estate entities, capitalized interest and preferred distributions. Combined fixed charges and preferred distributions consist of fixed charges (mortgage and loan interest expense, whether expensed or capitalized, the amortization of debt expense and capitalized interest) and preferred distributions.
Recurring capital expenditures are expenditures (excluding capital expenditures recoverable from tenants) made on a regular or recurring basis to maintain a property's competitive position within its market, generally with a depreciable life of 5 to 12 years, but excluding (a) capital expenditures made in the year of acquisition and the following two years (i.e., excluding capital expenditures on non-stabilized properties), (b) improvements associated with the expansion or re-development of a building, (c) renovations to a building which change the underlying classification of the building (for example, from industrial to office or Class C office to Class A office) or (d) capital improvements that represent the addition of something new to a property, rather than the replacement of an existing item.
Scheduled rent revenue is the total possible revenue from all leasable units and square footage, with occupied space valued at contract rates pursuant to leases and vacant units or square footage at market rates.
Stabilized properties are those properties owned for the entirety of both periods being compared, and, in the case of development or re-development properties, which have achieved a target level of occupancy.
26