Attached files
| file | filename |
|---|---|
| 8-K - FORM 8-K - Yellow Corp | d407081d8k.htm |
 1
YRC Worldwide Inc.
Deutsche Bank Transportation Conference
September 6, 2012
Exhibit 99.1 |
 2
Forward-looking Statements
This presentation contains forward-looking statements within the meaning of Section
27A of the Securities Act of 1933, as amended, and Section 21E of the Securities
Exchange Act of 1934, as amended. Words such as “
will,
” “
expect,
” “
intend,
” “
anticipate,
” “
believe,
”
“
project,
” “
forecast,
” “
propose,
” “
plan,
” “
designed,
” “
enable
”
and similar expressions are intended to identify forward-looking
statements. Forward-looking statements are inherently uncertain and are
subject to significant business, economic, competitive, regulatory and other
risks, uncertainties and contingencies, known and unknown, many of which are beyond our
control. Our future financial condition and results could differ materially from
those predicted in such forward-looking statements because of a number of factors, including (without
limitation) our ability to generate sufficient cash flows and liquidity to fund
operations and satisfy our obligations related to our substantial indebtedness
and lease and pension funding requirements; our ability to finance the maintenance, acquisition and replacement of revenue
equipment and finance other necessary capital expenditures; changes in equity and debt
markets; general or regional economic activity, including (without limitation)
customer demand in the retail and manufacturing sectors; the success of our management team in
implementing its strategic plan and operational and productivity improvements,
including (without limitation) our continued ability to meet high on-time
and quality delivery performance standards, and the impact of those improvements on our future liquidity and profitability;
inclement weather; price and availability of fuel; sudden changes in the cost of fuel
or the index upon which we base our fuel surcharge and the effectiveness of our
fuel surcharge program in protecting us against fuel price increases; competition and competitive pressure on
service and pricing; expense volatility, including (without limitation) expense
volatility due to changes in rail service or pricing for rail service our ability
to comply and the cost of compliance with federal, state, local and foreign laws and regulations, including (without limitation) laws
and regulations for the protection of employee safety and health and the environment;
terrorist attack; labor relations, including (without limitation) the continued
support of our union employees with respect to our strategic plan, the impact of work rules, work stoppages,
strikes or other disruptions, our obligations to multi-employer health, welfare and
pension plans, wage requirements and employee satisfaction; the impact of claims
and litigation to which we are or may become exposed; and other risks and contingencies, including
(without limitation) the risk factors that are included in our reports filed with the
Securities and Exchange Commission, including those described under “Risk Factors” in our annual report on Form 10-K and quarterly reports on
Form 10-Q. |
 3
I.
Introduction
i.
Company Overview and History
ii.
Operating Company Descriptions
II.
July 2011 Transaction
i.
Transaction Details
ii.
Board of Directors / Management Team
iii.
Organizational and Operational Changes
iv.
YRC Freight “Flywheel”
III.
2Q12 Financial Update
i.
Financial Performance
ii.
Liquidity
IV.
Conclusion
V.
Appendix
Table of Contents |
 4
I. Introduction |
 5
YRC Worldwide is one of the largest less-than-truckload (LTL) carriers in
North America and generates approximately $5B of revenue by
providing services under a portfolio of four subsidiaries
Introduction
Approximately 23% of the public carrier market share,
providing the broadest coverage and more service capability
throughout North America than any competitor |
 6
Revenue
$5.0B
Locations
431 U.S. and Canada
Trucks
15,000
Trailers
51,000
Annual tons
14.1M
Annual shipments
21.9M
Annual miles
1.1B
YRC Worldwide Tearsheet |
 7
1919
Reddaway founded
1924
Yellow Cab and Transit Company founded
1929
Holland Motor Express founded
1930
Roadway Express launched
1931
New Penn begins operations
1952
Reimer Express begins service in Winnipeg
1959
Yellow Transit becomes a public company
1986
Glen Moore begins operations
1997
Roadway acquires Reimer Express in Canada
2001
Roadway acquires New Penn
2002
Meridian IQ launched
2003
Yellow acquires Roadway, Reimer and New Penn
2005
Yellow Roadway Corp. acquires USF which includes Holland and Reddaway
2005
Joint venture with Jin Jiang for JHJ International
2006
Corporation’s name changed to YRC Worldwide to reflect scope of services
2007
Meridian IQ renamed YRC Logistics
2008
Company acquires Jiayu China ground network
2010
Disposition of YRC Logistics
2011
July 2011 Transaction –
new board and management team
2011
Disposition of Glen Moore assets
2011
Headquarter consolidation –
one company, one culture, one vision with one mission
2012
Disposition of Jiayu (pending Chinese regulatory approvals)
2012
Excess real estate auction
Company History |
 8
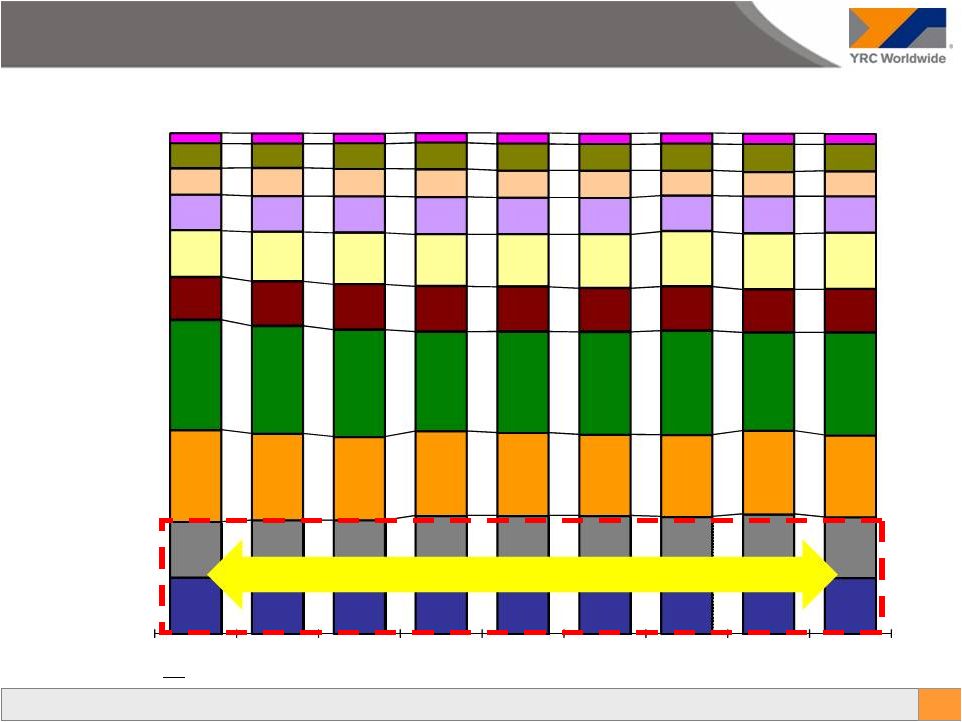
Source: Public filings (Form 10-K, Form 10-Q and earnings releases)
11.2%
11.3%
11.1%
11.6%
11.7%
11.7%
11.6%
11.6%
11.1%
11.2%
11.4%
11.6%
12.0%
11.9%
11.9%
11.8%
12.3%
12.2%
18.3%
17.3%
16.6%
16.9%
16.5%
16.2%
16.3%
16.7%
16.4%
22.0%
21.5%
21.4%
19.9%
20.2%
20.5%
20.8%
19.6%
20.5%
8.6%
9.0%
9.1%
9.1%
9.0%
8.8%
8.9%
8.7%
8.7%
9.3%
9.8%
10.3%
10.3%
10.4%
10.7%
11.0%
11.1%
11.2%
7.1%
7.1%
7.3%
7.4%
7.3%
7.2%
7.1%
7.4%
7.3%
5.3%
5.7%
5.6%
5.6%
5.5%
5.5%
5.0%
4.9%
5.0%
4.9%
4.8%
5.0%
5.3%
5.4%
5.2%
5.3%
5.5%
5.4%
2.1%
2.1%
2.0%
2.0%
2.1%
2.2%
2.1%
2.1%
2.1%
2Q10
3Q10
4Q10
1Q11
2Q11
3Q11
4Q11
1Q12
2Q12
Market Share Among Public Carriers
(Total Tonnage per Day)
Vitran
ABF
SAIA
ODFL
UPS Freight
Fed Ex Freight
Con-way
YRC Regional
YRC Freight
Roadrunner
23-24% Market Share
Market Share –
Stabilized and Holding Steady
Note: YRC Regional amounts exclude Glen Moore for all periods. FedEx
Freight amounts include Watkins for all periods and Vitran includes PJAX for all periods |
 9
Segment Descriptions
YRC
Freight
is
comprised
of
the
merged
Yellow
Transportation
and
Roadway.
YRC
Freight
(YRCF)
offers
a
range
of
services
for
the
transportation
of
industrial,
commercial and retail goods in regional, national and international markets, primarily
through the operation of owned or leased equipment. YRC Freight also includes
YRC Reimer, a subsidiary located in Canada that specializes in shipments into,
across and out of Canada. In addition to the United States and Canada, YRC
Freight also serves parts of Mexico, Puerto Rico and Guam
YRC
Regional
is
comprised
of
Holland,
Reddaway
and
New
Penn.
These
companies
each provide regional, next-day ground services in their respective regions
through a network of facilities located across the United States; Quebec,
Canada; Mexico; and Puerto Rico. Approximately 98% of Regional
Transportation shipments are completed in two days or less
YRCW has two
major segments
serving domestic as
well as international
customers |
 10
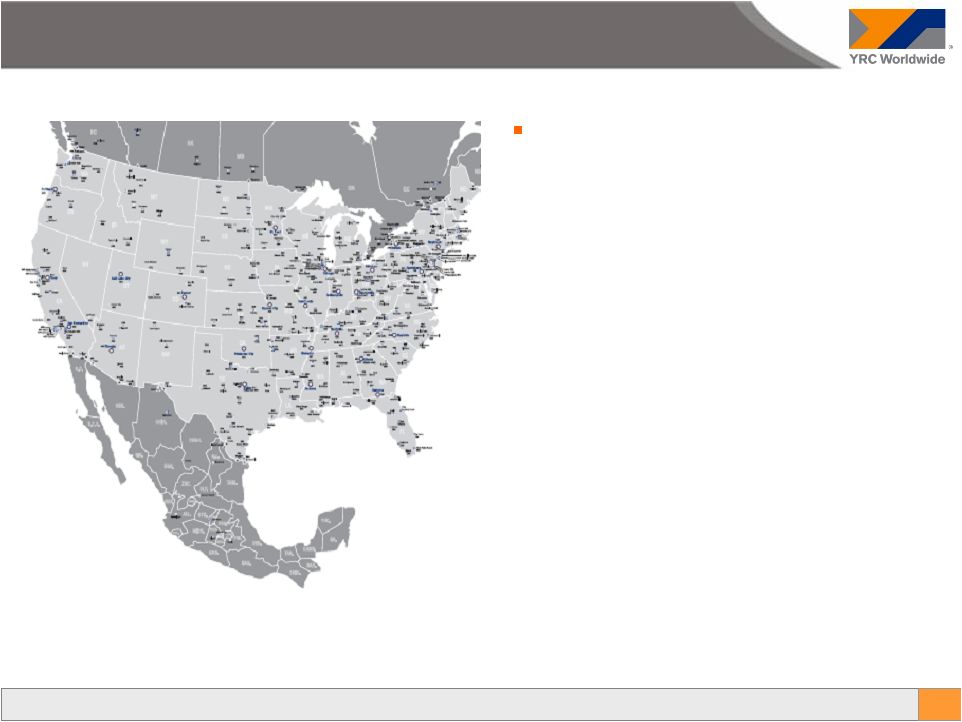
YRC
Freight
was
created
through
the
March
2009
•
Customers:
~ 200,000*
•
Service Centers:
282**
•
Dock doors:
~ 15,600
•
Average Length of Haul:
~ 1,300 miles
•
Average LTL Weight/Shipment:
~ 950 pounds
•
Total Active Employees:
~ 22,000
•
Average days in transit
3.7
•
Business by days in transit:
Next day
4%
Two days
25%
Three days
29%
Four or more days
42%
** Includes Canada and Mexico
* Represents the number of unique payer locations
YRC Freight
integration of the Yellow Transportation and
Roadway networks, combining two companies with
more than 80 years experience each |
 11
•
Customers:
~ 200,000*
•
Service Centers:
114
•
Dock Doors:
~ 3,900
•
Average Length of Haul:
~ 500 miles
•
Average LTL Weight/Shipment:
~ 1,300 pounds
•
Total Active Employees:
~ 11,000
•
Average Days in Transit
98% in less than 2
days
* Represents the number of unique payer locations
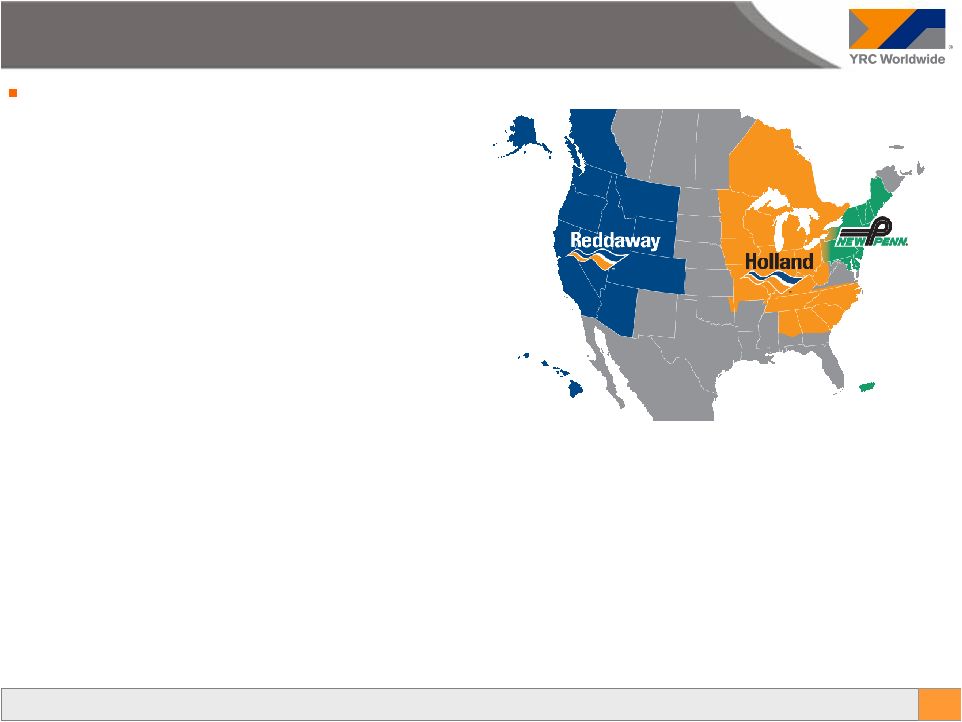
Regional Transportation
Regional Transportation provides transportation service
to customers in the regional and next-day markets and
is comprised of Holland, Reddaway and New Penn
–
Holland provides local next-day, regional and
expedited services through a network located in the
Central, Southeastern, and portions of the
Northeastern, United States. Holland also provides
service to the provinces of Ontario and Quebec,
Canada
–
Reddaway provides local next-day, regional and
expedited services through a network located in
California, the Pacific Northwest, the Rocky Mountain
States and the Southwest. Additionally, Reddaway
provides services to Alaska and to the provinces of
Alberta and British Columbia, Canada
–
New Penn provides local next-day, day-definite, and
time-definite services through a network located in
the Northeastern United States; Quebec, Canada;
and Puerto Rico |
 12
II. July 2011 Transaction |
 13
In July 2011, the restructuring was completed
–
New Board seated
–
New CEO placed
•
New Management structure / team followed
–
Additional liquidity provided
–
Extended maturities on all major credit facilities to late 2014 / early 2015
New Management team changed strategic focus and implemented new business plan
–
Singularly focusing on North American LTL operations
–
Closed the former legacy Roadway headquarters to create one company with
•
one vision
•
one culture and
•
one mission
–
Divesting non-core, non-strategic assets (e.g. Glen Moore, Jiayu, excess real
estate) –
Investing
via
the
P&L
to
improve
customer
experience
/
service
at
YRC
Freight
the
“Flywheel”
–
Streamlining the holding company, driving responsibility and autonomy to the
OpCos Since taking over and preparing a forecast based on the simplified and
focused strategic direction, the new management has exceeded its internally
prepared forecast July 2011 Transaction |
 14
NAME
POSITION
DIRECTOR
SINCE
COMMITTEE(S)
COMPANY
James E. Hoffman
Retired President
2011
Compensation +
Alliant Energy Resources
James L. Welch
Chief Executive Officer
2011
YRC Worldwide Inc.
Raymond J. Bromark
Retired Partner
2011
Audit/Ethics *
PricewaterhouseCoopers LLP
Matthew A. Doheny
President
2011
Compensation
North Country Capital LLC
Finance *
Robert L. Friedman
Sr. Managing Director
2011
Audit/Ethics
The Blackstone Group, LP
Finance
Michael J. Kneeland
President and CEO
2011
Compensation *
United Rentals Inc.
Governance
Harry Wilson
Chairman and CEO
2011
Finance
MAEVA Advisors, LLC
James Winestock, Jr.
Retired Sr. Vice President for U.S. Operations
2011
Governance *
United Parcel Services, Inc.
Douglas A. Carty
Chairman
2011
Audit/Ethics
Switzer-Carty Transportation Inc.
Governance
North Country
Capital LLC
MAEVA Advisors,
LLC
+ =Chairman of the Board
* = Committee Chairman
Board of Directors |
 15
James L. Welch Chief Executive Officer
–
As chief executive officer, James Welch leads YRC Worldwide and its operating
companies. During his 33-year tenure in the transportation and logistics
industry, Welch has established a proven track record of leading organizations
through difficult challenges and moving them to positions of improved operational
efficiency and profitability. –
Welch is the former president and chief executive officer of Dynamex Inc., a position
he took following a 29-year career at Yellow Transportation, a YRC
Worldwide subsidiary. Welch began his career with Yellow when he was 23; he rose
through the ranks and served from 2000-2007 as president and CEO.
–
He has a bachelor of science degree in psychology with a minor in business from West
Texas A&M University. In addition, he attended the Executive Development
Program at Yale University and is a regular attendee at the Center for Service
Leadership at Arizona State University. Jamie G. Pierson Executive Vice
President and Chief Financial Officer –
As the leader of the company’s financial organization, Jamie Pierson is
responsible for the areas of corporate finance, treasury, cash management,
accounting, tax, risk management and employee benefits. In addition to supporting the
holding company, Pierson’s team also assists the individual operating companies
when and where needed. Pierson joined YRC Worldwide in 2011, after
serving as interim CFO. –
Previously, Pierson was a managing director with Alvarez & Marsal North America
where he focused on out-of-court restructurings and company-side
senior management advisory. It was in this role that Pierson first worked with YRC
Worldwide,
and
subsequently
was
involved
with
all
aspects
of
the
company’s
financial
operations
and
ensuing
restructuring. Prior to A&M, Pierson was vice president, Corporate Development and
Integration with Greatwide Logistics Services. He also was a managing
director with FTI Capital Advisors, and in the finance advisory group of
Houlihan Lokey Howard & Zukin.
–
Pierson
graduated
from
the
University
of
Texas
where
he
earned
a
bachelor’s
degree
in
business
administration,
with
concentrations in finance and accounting and later a master’s degree in business
administration with concentrations in finance and entrepreneurship.
33 years
5+ years
Management Team |
 16
Jeffrey A. Rogers President, YRC Freight
–
Jeff Rogers is president of YRC Freight, a leading transporter of industrial,
commercial and retail goods that specializes in
less-than-truckload
solutions
for
businesses
across
North
America.
A
28-year
veteran
of
the
freight
transportation
industry, Rogers has brought to YRC Freight a simple and direct approach to leadership
that is results-oriented. –
Prior
to
assuming
that
role
in
September
2011,
Rogers
served
for
three
years
as
president
of
another
YRC
Worldwide
company,
Holland,
which
provides
regional
transportation
service
in
12
states
and
two
Canadian
provinces.
His
previous assignments include serving as chief financial officer for YRC Worldwide
regional companies, and various operations
and
finance
roles
at
Yellow
Transportation
and
United
Parcel
Service.
–
A native of Wichita, Kansas, Rogers is a decorated military veteran. He holds a
bachelor's degree in accounting from Newman University in Wichita and a
master’s degree in business administration from Baker University. Scott D.
Ware President, Holland –
Scott Ware leads Holland, a YRC Worldwide subsidiary, that has long been recognized
for delivering the most next-day service lanes in its territory. Holland
provides industry leading, on-time reliability for less-than-truckload (LTL)
shipments
in
the
central
and
southeastern
US.
Before
being
named
president
in
May
2012,
Scott
served
as
vice
president
of Operations at Holland where he was responsible for the management and execution of
major operational initiatives focused on specific performance improvements.
Ware has more than 27 years of industry experience. –
Prior to joining Holland in 2007, Ware was director of LineHaul Operations at Saia,
Inc. He was previously director of Line
Haul
at
Jevic
Transportation
and
prior
to
that
a
manager
of
Freight
Flow
Operations
at
Con-way,
Inc.
28 years
Management Team
27 years |
 17
Thomas J. “TJ”
O’Connor President, Reddaway
–
T.J.
O’Connor
leads
Reddaway,
a
YRC
Worldwide
subsidiary
that
has
built
a
long-standing
tradition
of
reliable,
next-
day and two-day delivery services for less-than-truckload shipments in the
western United States and Canada, including Alaska and Hawaii. He was named
president in 2007 after serving as president and CEO of USF Bestway.
–
A tenured member of the YRC Worldwide team, O’Connor joined Roadway in 1982.
While at Roadway, he served in various management positions including Western
Division vice president, district manager for Texas and Louisiana, and district
manager of Mountain Time Zone states. Steven D. Gast President, New
Penn –
Steve Gast leads New Penn, a YRC Worldwide subsidiary that is highly regarded as one
of the most efficiently operated less-than-truckload transportation
providers and has one of the lowest claim ratios in the industry. New Penn
provides reliable, next-day service through a network of 25 service centers in the
northeastern U.S., Quebec, Canada and
Puerto
Rico.
Gast
was
named
president
in
2006.
He
joined
the
company
in
1997
and
held
positions
of
increasing
responsibility in the areas of pricing, finance, administration and strategic
planning. –
Gast has more than 35 years of experience in the transportation industry. Starting as
a management trainee with McLean
Trucking
Company,
Gast
later
worked
for
Sun
Carriers,
Red
Star
and
Plymouth
Rock
before
joining
New
Penn
.
30 years
35 years
Management Team |
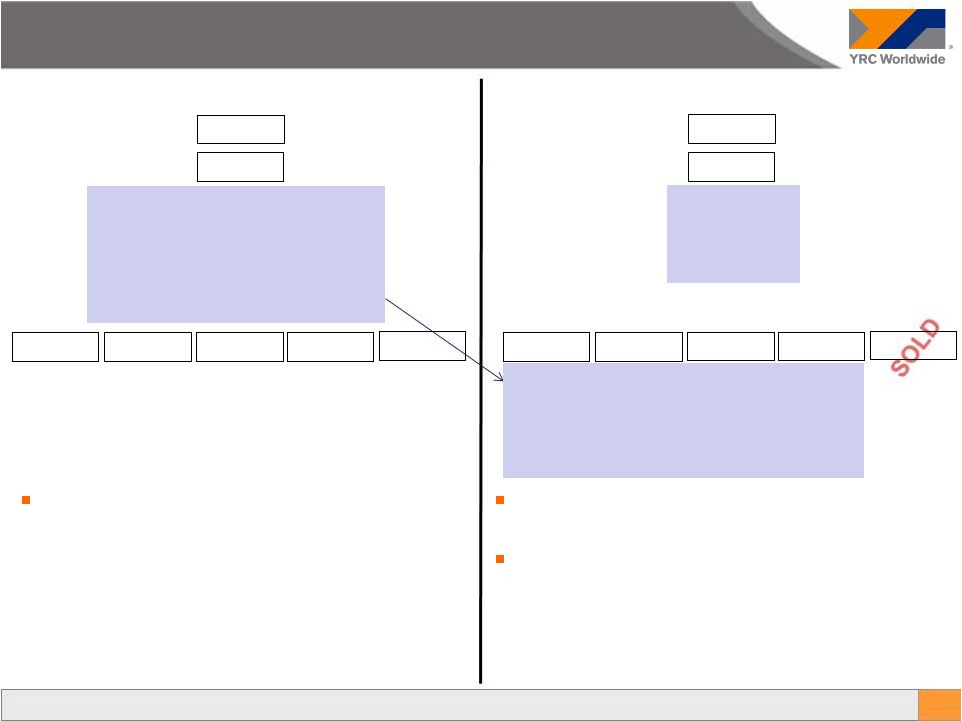 18
Eliminated:
–
Chief Operations Officer
–
Chief Marketing Officer
–
Chief Administrative Officer
–
President of Customer Care
YRCW
Holland
Reddaway
New Penn
YRC Freight
Glen Moore
Corporate
Former Structure
•
CEO / CFO team
•
Legal team
•
Quality team
•
Security team
•
Sales
•
Customer Care
•
HR
•
IT
•
Equipment Services
YRCW
Holland
Reddaway
New Penn
YRC Freight
Glen Moore
Corporate
New Structure
•
CEO / CFO team
•
Sales
•
Customer Care
•
HR
•
IT
•
Equipment Services
•
Legal team
•
Security team
Moved Sales, Customer Care, HR, IT and Equipment
Services
functions
from
“corporate”
down
to
the
OpCos
Decreased the number of corporate / shared service
employees from approximately 2,000 to < 400. The
1,600 employees were reallocated to the OpCos and
the individual OpCos are responsible for justifying their
value / existence within their respective companies
Streamlined Holding Company |
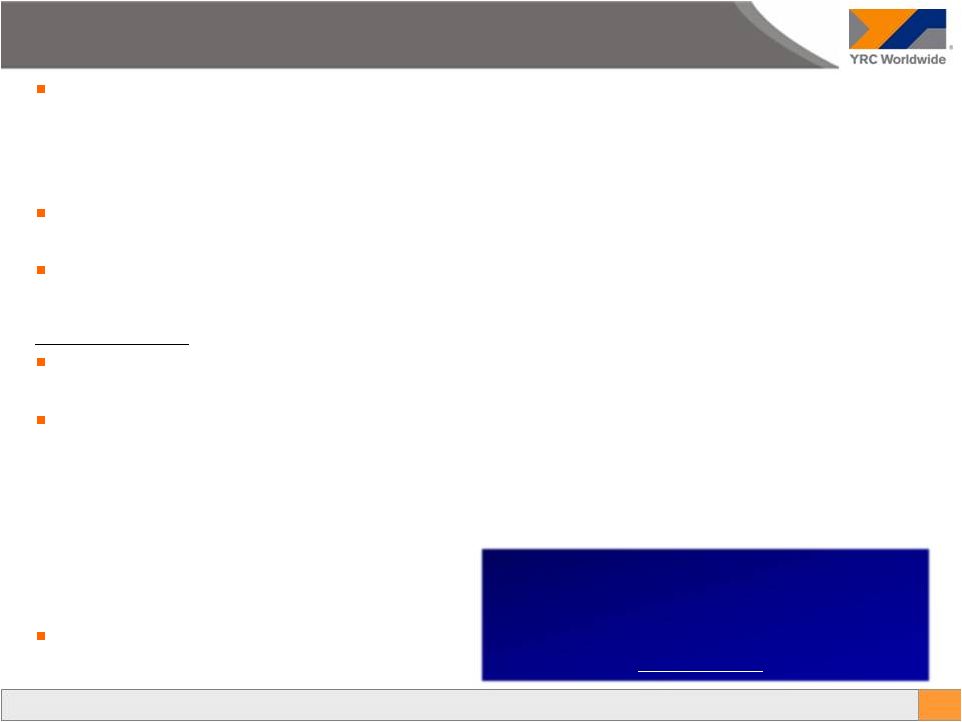 19
The last several years of activities have largely been focused on
–
The integration of Yellow and Roadway into YRCF in March 2009
–
Dramatic capacity and cost reductions to right-size the company (facilities,
equipment and employees) –
Financial restructuring efforts, including communication challenges with our
customers One result of these activities was that our service quality had been
damaged and was in need of improvement
Re-branded YRC to YRC Freight to give the company a sense of direction and
identity The Path Forward:
Under new leadership, focus shifted dramatically toward improving the customer
experience, resulting in increased shipment levels, improved business mix and
operational efficiency This will happen in stages (detail on the following
page) –
Improve service quality and win the hearts and minds of our employees
•
Introduce a new employee mantra and service promise, while maintaining steady
costs –
Productivity
improves
as
we
are
“in
cycle”
operationally
(fluid
and
efficient)
–
Costs associated with service failures decline
–
Volume picks up, customer churn slows down
–
Yield and business mix improve
The new employee mantra is simple
Pick it up on time.
Deliver it on time.
Don’t bust it.
Consistently!
YRCF –
Strategic Direction |
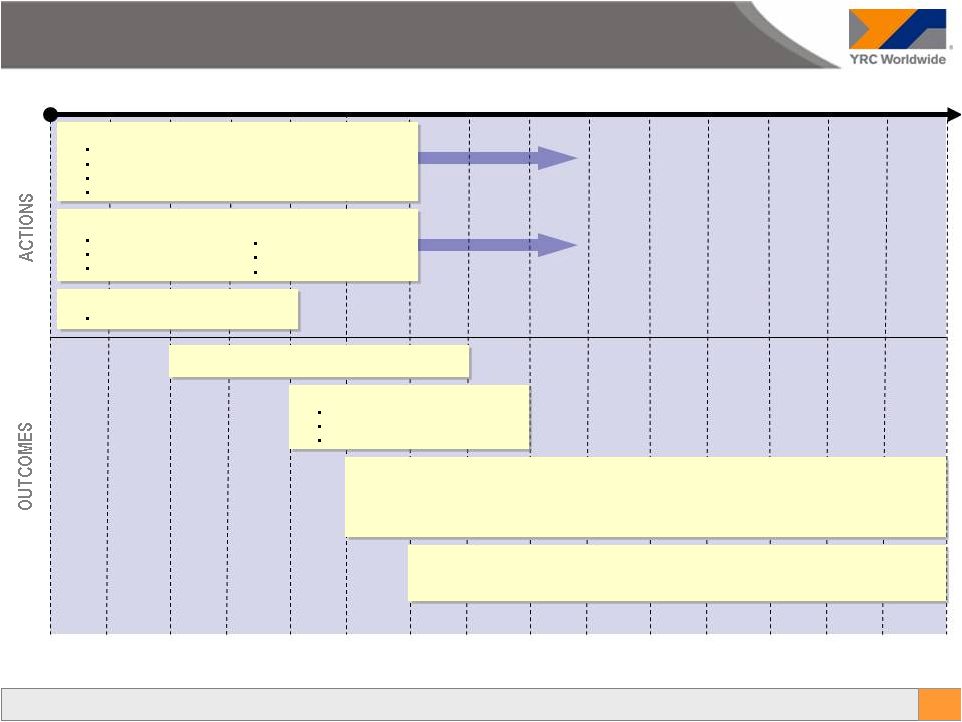 20
Month
Improve service quality
Consistent performance (on-time P&D, undamaged, recover quickly)
Get “in cycle”
Perform on Time-Critical shipments
TQM
Maintain productivity and cost
(No increase or decrease)
Volume picks up, churn goes down
•
Service
improvement
drives
sales/customer
confidence,
leading
to
increased
shipping
levels
•
Local channel churn slows down
•
Time-Critical shipments increase
Yield improves
•
Customer mix improves as local channel grows through improved service and better
pricing decisions •
Customers willing to pay more for better service; increase in high-yielding
Time-Critical shipments Productivity improves as we remain “in
cycle” Failure-related costs decline
Cargo claims
Service recoveries
Other
“Win hearts and minds”
Service quality tools
Introduce mantra, brand promise
Employee survey
Sep 11
Oct 11
Nov 11
Dec 11
Jan 12
Feb 12
Mar 12
Apr 12
May 12
Jun 12
Jul 12
Aug 12
Sep 12
Oct 12
Nov 12
1
2
3
4
5
6
7
8
9
10
11
12
13
14
15
Line of sight objectives
Training & education
Rewards & recognition, respect
YRCF –
Path Forward “The Flywheel” |
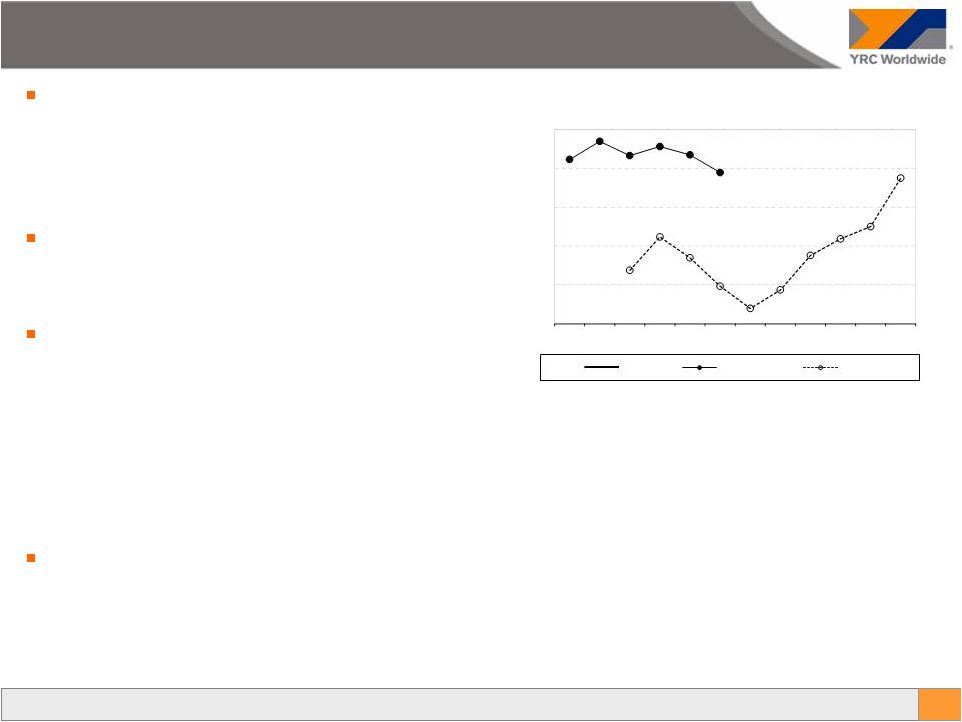 21
On-Standard Service Percent
YRCF –
On-Standard Service
60.0%
65.0%
70.0%
75.0%
80.0%
85.0%
Jan
Feb
Mar
Apr
May
Jun
Jul
Aug
Sep
Oct
Nov
Dec
Focus is on maintaining momentum created in
the first quarter of 2012
-
Mantra: “Pick it up on time, deliver it on time
and don’t bust it. Consistently.”
On-Standard Service Percent appears to have
stabilized at or above 80.0% which is well
above the levels seen in 2011
Improving the customer experience is
anticipated to lead to
-
Higher shipment volume
-
Lower customer churn
-
Increased pricing power
-
Reduced service failure cost
In June 2012, the company raised service
standards (i.e. decreased the time to delivery) in
20K lanes causing a slight decrease in service
percent compared to earlier months in 2012
Goal
2012 Actual
2011 Actual |
 22
III.
2Q12 Financial Update |
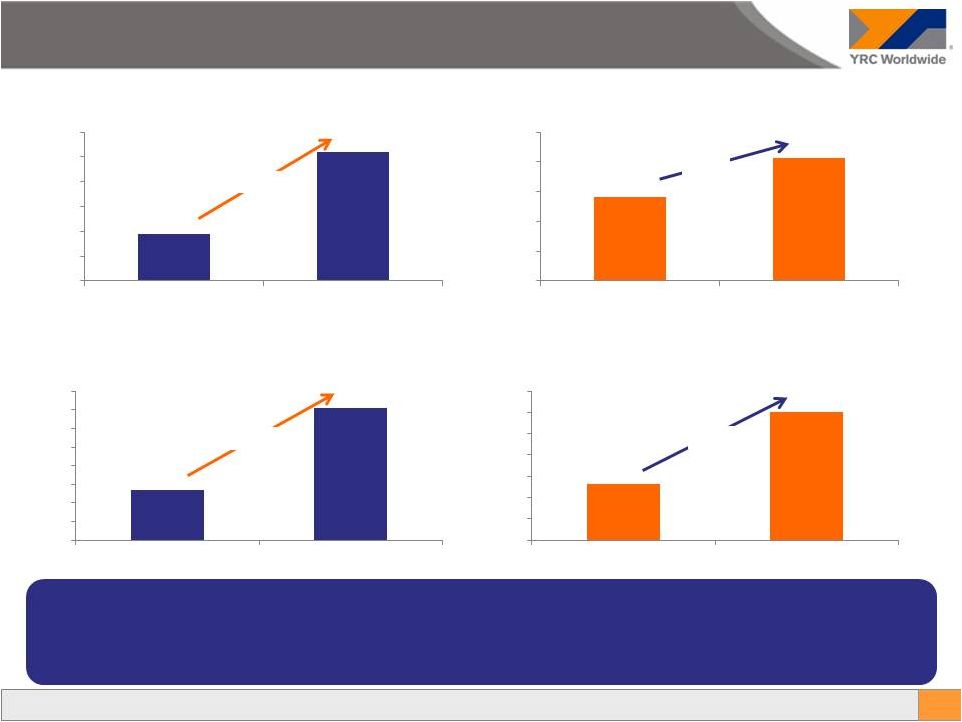
 49.44K
48.41K
30.00
35.00
40.00
45.00
50.00
55.00
2Q11
2Q12
YRC Freight Shipments per Day
-2.1%
40.25K
41.25K
30.00
35.00
40.00
45.00
50.00
55.00
2Q11
2Q12
Regional Shipments per Day
+2.5%
29.14K
30.42K
20.00
22.00
24.00
26.00
28.00
30.00
32.00
2Q11
2Q12
Regional Tonnage per Day
+4.4%
28.66K
27.72K
20.00
22.00
24.00
26.00
28.00
30.00
32.00
2Q11
2Q12
YRC Freight Tonnage per Day
YOY Volume –
Down at YRC Freight, Up at Regional
23
Decline in volume at YRCF largely attributable to more active customer mix management
(increasing price on low margin accounts) and softening economy as the quarter
progressed
Increase in volume at Regional due to continued high-quality service and increasing
market share
-3.3% |
 24
Improved
revenue
per
cwt
and
revenue
per
shipment
at
YRCF
attributable
to
“flywheel”
investment
in
service, more active customer mix management and industry-wide pricing discipline
Regional
increases
due
to
continued
superior
service
/
value
and
industry
pricing
discipline
$22.57
$23.24
$22.20
$22.40
$22.60
$22.80
$23.00
$23.20
$23.40
2Q11
2Q12
YRC Freight Revenue per cwt
+2.9%
$10.86
$11.12
$10.30
$10.50
$10.70
$10.90
$11.10
$11.30
2Q11
2Q12
Regional Revenue per cwt
+2.4%
$157
$164
$152
$154
$156
$158
$160
$162
$164
$166
2Q11
2Q12
Regional Revenue per Shipment
+4.3%
$262
$266
$259
$260
$261
$262
$263
$264
$265
$266
$267
2Q11
2Q12
YRC Freight Revenue per Shipment
+1.7%
YOY Yield –
Improved across the board |
 25
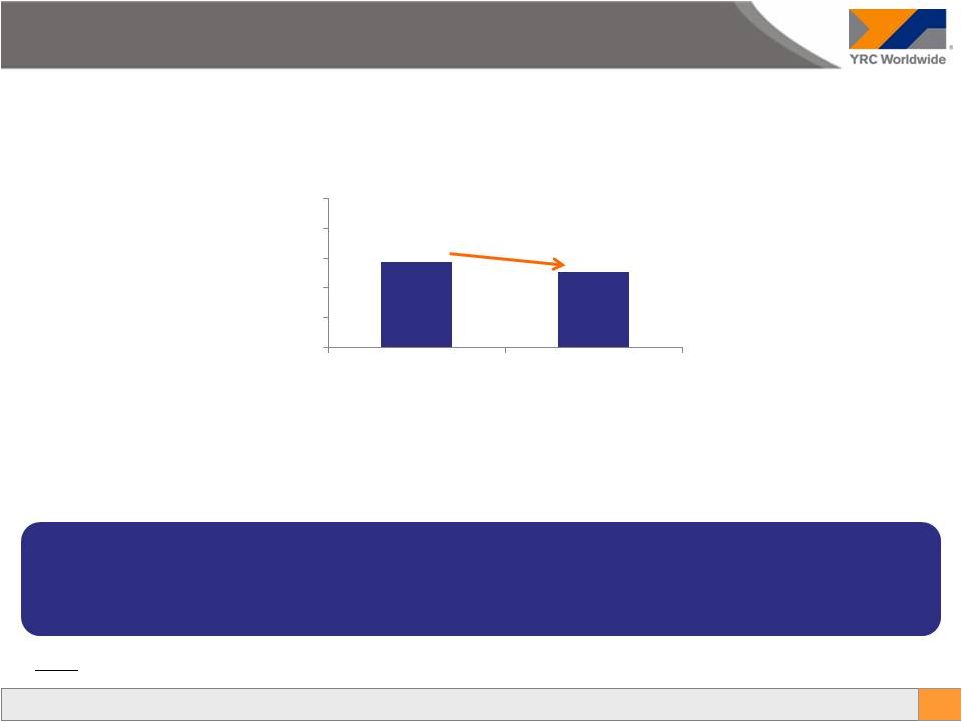
(0.5%)
($ in millions)
Footnotes:
(1)
$1,257.2
$1,250.8
$1,200.0
$1,220.0
$1,240.0
$1,260.0
$1,280.0
$1,300.0
2Q11
2Q12
2Q Comparison
Lower volume at YRCF, lower FSC and the inclusion of disposed truckload operations in
2Q11 offset by modestly higher yield led to a slight decline in YOY revenue
YRCW Revenue
1) 2Q11 includes revenue from the operations of Glen Moore. Excluding the $25.6M from
those disposed operations in 2Q11, revenue would have been $1,231.6M and would have resulted in a 1.6% YOY increase in 2Q12. |
 26
($ in millions)
Reconciliation of Operating Income to Adjusted EBITDA
2Q11
2Q12
Operating revenue
1,257.2
$
1,250.8
$
Adjusted operating ratio
99.0%
98.3%
Reconciliation of operating income to adjusted EBITDA:
Operating income (loss)
(5.6)
$
15.5
$
(Gains) losses on property disposals, net
(7.3)
(6.5)
Union Equity Awards
Letter of credit expense
8.2
9.6
Restructuring professional fees
16.9
2.5
Gain (loss) on permitted dispositions and other
1.0
(0.2)
Adjusted operating income (loss)
13.2
20.9
Depreciation and amortization
48.1
45.7
Equity based compensation (benefit) expense
0.4
1.0
Restructuring professional fees, included in nonoperating
loss 1.2
-
Other nonoperating, net
0.3
2.5
Add: Truckload EBITDA income
1.3
-
Adjusted EBITDA
64.5
$
70.1
$
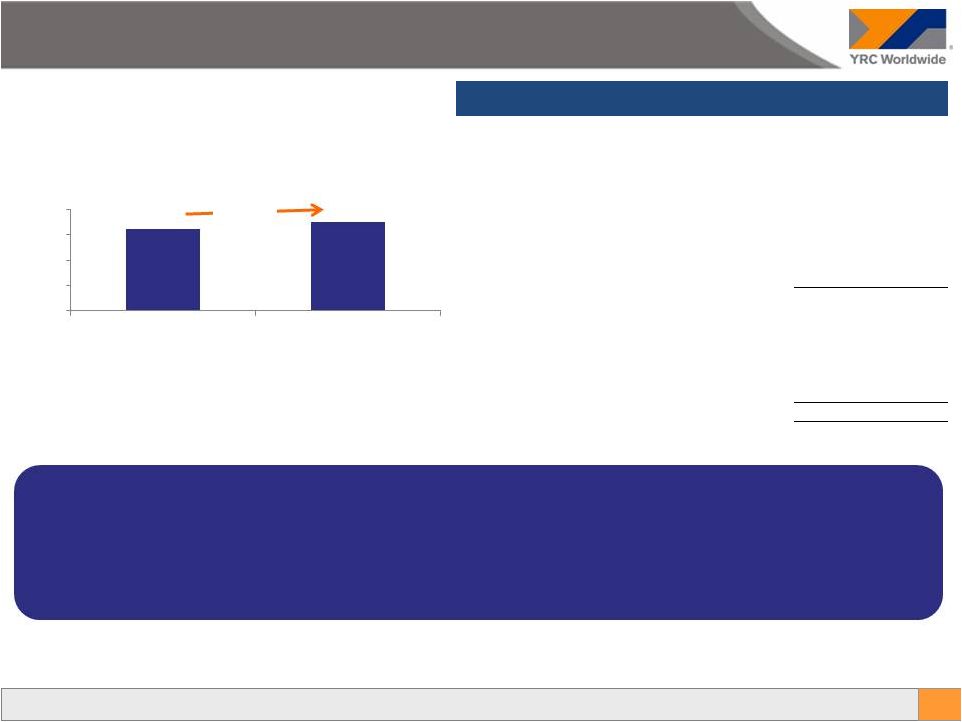
Consolidated Adjusted EBITDA increased $5.6M in 2Q12
Margin continues to expand as the quality of revenue at YRCF improves and cost management
inclusive of safety and workers comp / BIPD continue to pay dividends even
as pension contributions increased YOY
Regional segment pricing improvement leading to increased profitability and margin
expansion $64.5
$70.1
$.0
$20.0
$40.0
$60.0
$80.0
2Q11
2Q12
2Q Adjusted EBITDA
+8.7%
YRCW Adjusted EBITDA |
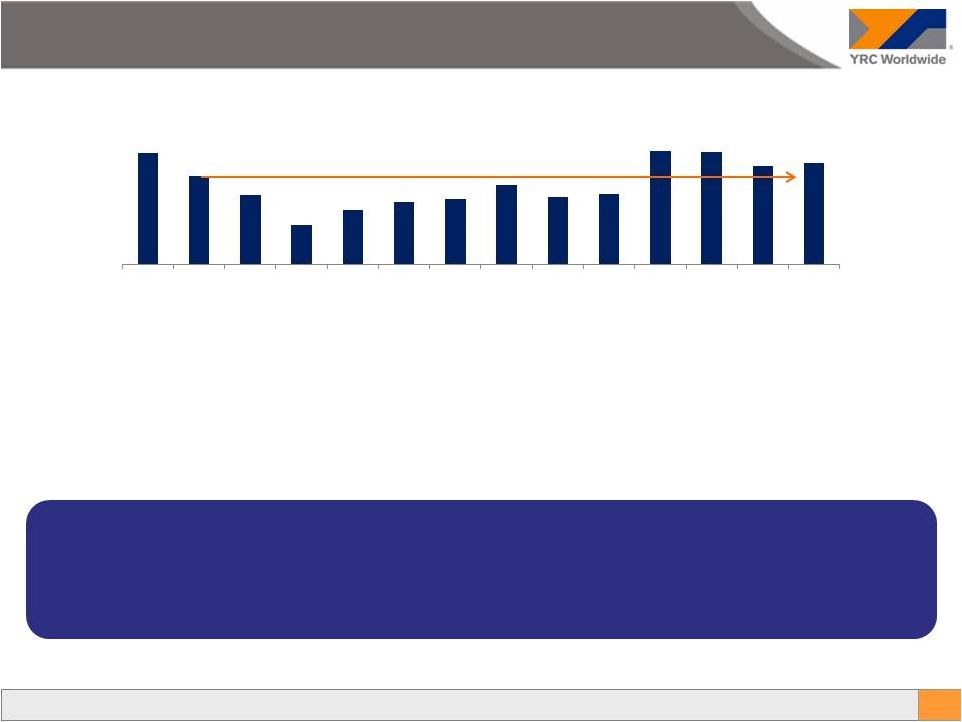
 27
($ in thousands)
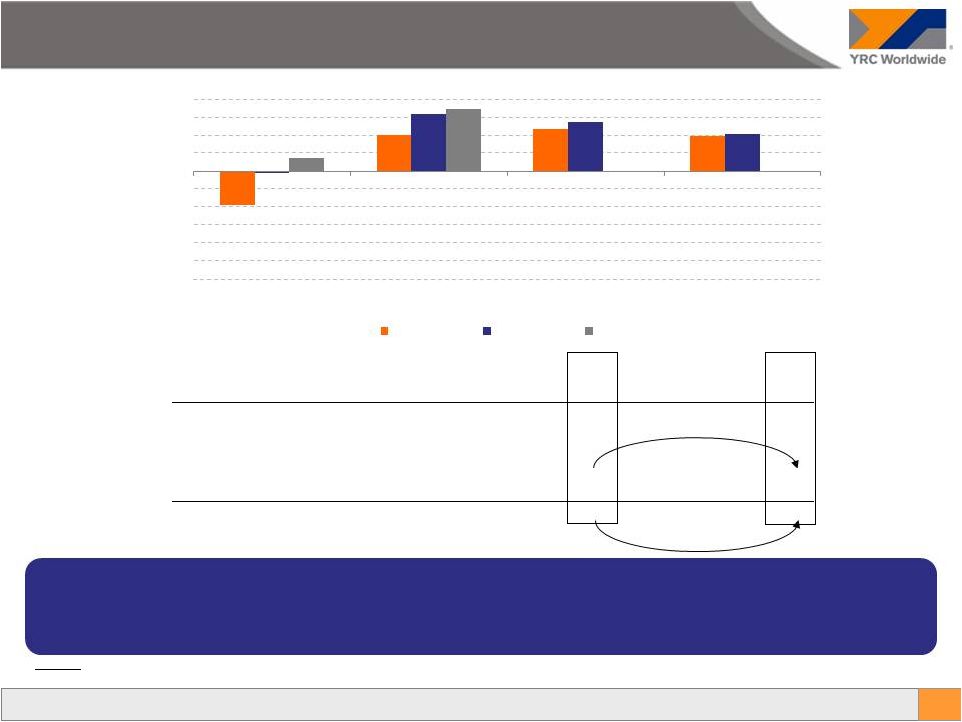
+21%
+2.5x
Footnotes:
1) See Appendix for reconciliation of Operating Income to Adjusted EBITDA.
(37,239)
40,400
47,287
39,878
(1,305)
64,528
54,648
41,286
15,318
70,098
($120)
($100)
($80)
($60)
($40)
($20)
$
$20
$40
$60
$80
1Q
2Q
3Q
4Q
2010
2011
2012
Highest quarterly EBITDA in 3 years and positive comping trend continuing
Reported 21% LTM increase
Proforma for pension = 2.5x LTM increase
YRCW Adjusted EBITDA (pro forma for Pension)
1Q10
2Q10
3Q10
4Q10
1Q11
2Q11
3Q11
4Q11
1Q12
2Q12
Adj. EBITDA Reported
1
(37,239)
40,400
47,287
39,878
(1,305)
64,528
54,648
41,286
15,318
70,098
Union Pension Cessation Benefit
(21,000)
(21,000)
(21,000)
(21,000)
(21,000)
(14,000)
-
-
-
-
Pro forma Adj. EBITDA*
(58,239)
19,400
26,287
18,878
(22,305)
50,528
54,648
41,286
15,318
70,098
Pension Months Included above
3
3
3
3
3
2
Last Twelve Months:
Adj. EBITDA Reported
90,326
126,260
150,388
157,749
159,157
175,780
181,350
Union Pension Cessation Benefit
(84,000)
(84,000)
(77,000)
(56,000)
(35,000)
(14,000)
-
Pro forma Adj. EBITDA*
6,326
42,260
73,388
101,749
124,157
161,780
181,350
* Pro forma assumes $7M of union pension per month for all periods prior to June
2011 |
 28
Three months
2012
2011
Change
Adjusted EBITDA
70.1
$
64.5
$
5.6
$
Total restructuring professional fees
(2.5)
(18.1)
15.6
Cash paid for interest
(28.8)
(10.3)
(18.5)
Cash paid for letter of credit fees
(9.5)
-
(9.5)
Working capital cash flows excluding income tax, net
(29.7)
(40.9)
11.2
Net cash used in operating activities before income taxes
(0.4)
(4.8)
4.4
Cash received from income taxes, net
0.9
(10.2)
11.1
Net cash used in operating activities
0.5
(15.0)
15.5
Acquisition of property and equipment
(15.6)
(12.7)
(2.9)
Free cash flow (deficit)
(15.1)
(27.7)
12.6
Total restructuring professional fees
2.5
18.1
(15.6)
Adjusted free cash flow (deficit)
(12.6)
$
(9.6)
$
(3.0)
$
Pro Forma Adjusted Free Cash Flow
Adjusted free cash flow (deficit)
(12.6)
(9.6)
(3.0)
Union Pension Cessation
-
(21.5)
21.5
Cash Interest
-
(18.4)
18.4
Lender Cash LC fees
-
(9.5)
9.5
Pro Forma adjusted free cash flow (deficit)
(12.6)
$
(59.0)
$
46.4
$
Quarterly Adjusted FCF declined by $3.0M to ($12.6M) in 2Q12 from ($9.6M) in 2Q11
largely due to resuming cash payment of interest and LC fees that exceeded the
increase in Adjusted EBITDA and decline in changes in Working Capital
However, on a pro forma basis after taking into account the Union Pension Cessation and
Cash Interest / LC Fees benefit in 2011, Adjusted FCF improved by $46.4M
Total Liquidity improved $76M to $249M at the end of 2Q12 from $173M in 2Q11 as the
July 2011 restructuring brought incremental cash and liquidity from new credit
facilities and debt issuances Footnotes:
($ in millions)
$173
$249
2Q11
2Q12
Total Liquidity
+44.0%
Free Cash Flow and Liquidity
1
1) Represents balance sheet liquidity, which includes amounts such as restricted and
foreign cash that are disallowed under our credit agreements in determining compliance with our “minimum cash “ covenant
|
 29
July 2011 transaction significantly enhanced liquidity via
Series B Notes proceeds and increased ABL availability
Best second quarter liquidity since 2008
($ in millions)
$275
$218
$171
$96
$134
$154
$161
$194
$165
$173
$279
$277
$241
$249
1Q09
2Q09
3Q09
4Q09
1Q10
2Q10
3Q10
4Q10
1Q11
2Q11
3Q11
4Q11
1Q12
2Q12
Liquidity |
 30
IV. Conclusion |
 31
Subsequent to the July 2011 transaction
–
A new Board was seated
–
A new Management team was placed
–
Laser-like focus on North American LTL operations
–
One corporate headquarters with one culture, one vision and one mission
–
Reorganizing “corporate”
to support overall strategy and increase accountability across the organization
–
The new Management team made some strategic yet difficult decisions to refocus the
business and shed some non-core assets and has successfully executed against
those decisions / objectives •
Sold substantially all of the assets of truckload operations (Glen Moore)
•
Sold one of the company’s remaining two Chinese JVs (Jiayu); waiting on
regulatory approval to close •
Conducted auction of excess real estate; now moving to close sold properties
–
–
The recent credit agreement amendment to modify financial covenants provided the
company with increased financial flexibility for the foreseeable future
Conclusion
Management’s concept of the “Flywheel” is gaining traction as
On-Standard Service has increased approximately 20% points at YRC Freight
and the Regionals continue to deliver industry standard -- if not
better -- service
|
 32
On a year-over-year basis
Revenue
increased 1.6%
reported highest quarterly EBITDA in four years
New management team executing on non-quantitative commitments AND exceeding
forecast Overall, much progress has been achieved year-over-year; have been
able to absorb resumption of both multi-employer pension expense and cash
interest and LC expense but still more to do Liquidity ended 2Q12 at $249M which
is the highest second quarter since 2008 Conclusion –
2Q12 Financial Results
Footnote
1) On a pro forma basis excluding Glen Moore revenue from 2011
1
Adjusted
EBITDA
positively
comping
for
the
3
rd
consecutive
year
and |
 33
V. Appendix |
 34
Operating Income to Adjusted EBITDA
Reconciliation of Operating Income to Adjusted EBITDA
1Q10
2Q10
3Q10
4Q10
1Q11
2Q11
3Q11
4Q11
1Q12
2Q12
Operating income (loss)
(232.2)
$
49.5
$
(17.3)
$
(27.9)
$
(68.4)
$
(5.6)
$
(26.1)
$
(38.1)
$
(48.8)
$
15.5
$
(Gains) losses on property disposals, net
8.5
(2.8)
(4.0)
2.6
(3.0)
(7.3)
(10.8)
12.9
8.4
(6.5)
Union Equity Awards
108.0
(83.0)
-
14.9
Letter of credit expense
8.4
8.3
8.3
8.3
8.1
8.2
9.3
9.6
8.1
9.6
Restructuring professional fees
12.1
9.3
6.6
6.0
8.5
16.9
12.4
4.3
0.5
2.5
Gain (loss) on permitted dispositions and other
5.3
-
-
-
2.2
1.0
-
(0.3)
(1.9)
(0.2)
Adjusted operating income (loss)
(89.9)
(18.7)
(6.4)
(10.9)
(52.7)
13.2
(0.3)
(11.6)
(33.8)
20.9
Depreciation and amortization
51.2
50.7
50.4
48.6
49.8
48.1
46.7
51.1
49.0
45.7
Equity based compensation (benefit) expense
1.9
1.4
2.2
0.7
(1.1)
0.4
0.6
0.7
1.1
1.0
Restructuring professional fees, included in nonoperating
loss 0.2
0.2
0.2
0.9
0.5
1.2
0.2
-
-
-
Other nonoperating, net
(0.8)
6.8
0.9
(0.2)
0.5
0.3
6.9
(0.7)
(0.9)
2.5
Add: Truckload EBITDA income
0.1
(0.0)
(0.0)
0.9
1.5
1.3
0.5
1.8
-
-
Adjusted EBITDA
(37.2)
$
40.4
$
47.3
$
39.9
$
(1.3)
$
64.5
$
54.6
$
41.3
$
15.3
$
70.1
$
|