Attached files
| file | filename |
|---|---|
| 8-K - 8-K - ARCH RESOURCES, INC. | a12-20223_28k.htm |
Exhibit 99.1
|
|
Barclays Capital 2012 CEO Energy/Power Conference New York | September 2012 John Eaves President and CEO, Arch Coal, Inc. |
|
|
Slide 2 Forward-Looking Information This presentation contains “forward-looking statements” – that is, statements related to future, not past, events. In this context, forward-looking statements often address our expected future business and financial performance, and often contain words such as “expects,” “anticipates,” “intends,” “plans,” “believes,” “seeks,” or “will.” Forward-looking statements by their nature address matters that are, to different degrees, uncertain. For us, particular uncertainties arise from changes in the demand for our coal by the domestic electric generation industry; from legislation and regulations relating to the Clean Air Act and other environmental initiatives; from operational, geological, permit, labor and weather-related factors; from fluctuations in the amount of cash we generate from operations; from future integration of acquired businesses; and from numerous other matters of national, regional and global scale, including those of a political, economic, business, competitive or regulatory nature. These uncertainties may cause our actual future results to be materially different than those expressed in our forward-looking statements. We do not undertake to update our forward-looking statements, whether as a result of new information, future events or otherwise, except as may be required by law. For a description of some of the risks and uncertainties that may affect our future results, you should see the risk factors described from time to time in the reports we file with the Securities and Exchange Commission. |
|
|
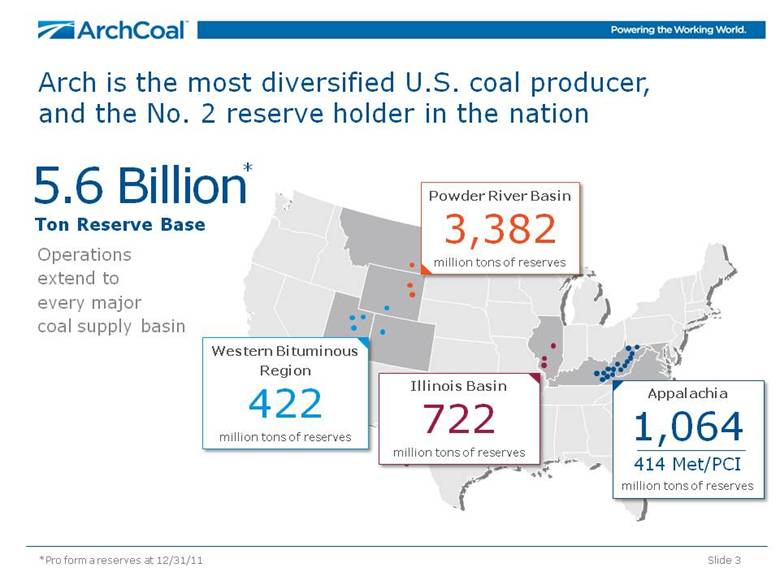
Arch is the most diversified U.S. coal producer, and the No. 2 reserve holder in the nation Operations extend to every major coal supply basin Slide 3 *Pro forma reserves at 12/31/11 5.6 Billion Ton Reserve Base Western Bituminous Region 422 million tons of reserves Illinois Basin 722 million tons of reserves Powder River Basin 3,382 million tons of reserves Appalachia 1,064 414 Met/PCI million tons of reserves * |
|
|
Arch leads the coal industry in safety and environmental compliance Arch’s safety performance is four times better than the U.S. coal industry average Arch is deeply committed to further improving its industry-leading safety and environmental performances since integrating ICG into the fold Slide 4 Sources: ACI, MSHA, State environmental agencies ACI Environmental Compliance (SMCRA violations based on state reports) Lost-Time Safety Incident Rate (per 200,000 employee-hours worked) Arch 5-year avg. = 0.62 Industry 5-year avg. = 2.64 ICG Acquisition ICG Acquisition 15 |
|
|
24% Arch has a balanced and diversified mine portfolio While Arch’s sales volumes are weighted toward low-cost Powder River Basin coal, the company’s revenue stream is diversified between eastern (increasingly metallurgical) and western regions – and cash margins are very well balanced among all core operating regions. Slide 5 Sales Volumes (1H12, in percent) Revenues (1H12, in percent) Cash Margins (1H12, in percent) 73% Powder River Basin Appalachia Western Bituminous & other thermal 46% 33% 43% |
|
|
Arch is holding the line on cost escalation despite running at lower volume levels Controlling consumable costs (i.e. diesel, explosives) Reducing headcount, contractors and labor costs Decreasing parts & supplies expense as well as repair costs due to idled equipment Working with alliance and strategic suppliers Right-sizing operations Idling high-cost thermal capacity (Appalachia) Slide 6 Powder River Basin Cost Guidance* (2012E, cash costs per ton) *As given on 7/27/12 $11.50-$12.50 $11.25-$11.75 $0.50 per ton reduction Appalachian Cost Guidance* (2012E, cash costs per ton) $68-$73 $68-$72 $0.50 per ton reduction |
|
|
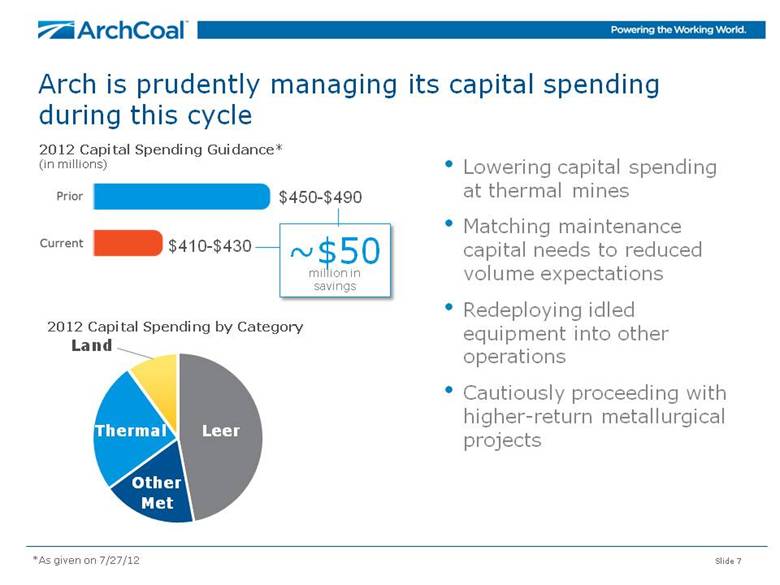
Arch is prudently managing its capital spending during this cycle Lowering capital spending at thermal mines Matching maintenance capital needs to reduced volume expectations Redeploying idled equipment into other operations Cautiously proceeding with higher-return metallurgical projects Slide 7 2012 Capital Spending Guidance* (in millions) 2012 Capital Spending by Category $410-$430 $450-$490 ~$50 million in savings Leer Thermal Land *As given on 7/27/12 Other Met |
|
|
Sources: Peer earnings and SEC filings, ACI Arch’s Appalachian portfolio is low in cost — and is geared toward higher-margin met assets Slide 8 Appalachian Metallurgical Sales Mix (Based on 2011 production) Appalachian Cash Costs (1H12 reported costs, $/ton) +50% expected future met sales mix |
|
|
Slide 9 Arch’s long-term growth plans are focused on higher-return organic expansions Leer metallurgical mine adds 3.5 million tons, starting in mid-2013 414 million tons of low-cost met reserves support incremental and greenfield expansion, should market conditions warrant 2012E* 2020 7.5 2015 14-15 15-20 *As given on 7/27/12 |
|
|
Slide 10 Arch’s metallurgical coal build-out will expand platform and upgrade overall product slate With the acquisition of ICG in 2011, Arch gained low-vol and high-vol A met assets, immediately upgrading its product slate With the build-out of Leer, Shelby Run and other reserves in Tygart Valley, Arch’s met coal quality mix will increase further U.S. Metallurgical Coal Quality Grades (based on volatile & other quality characteristics) Blue Creek Beckley Buchanan Vindex Leer Mountain Laurel Sentinel Pardee Lone Mountain Sawmill Tygart Valley reserves Bailey Panther Wells LOW-VOLS Pinnacle Legacy Arch Former ICG Peers INCREASING QUALITY SPECTRUM THE A’s THE B’s PCI/COKING BLENDS |
|
|
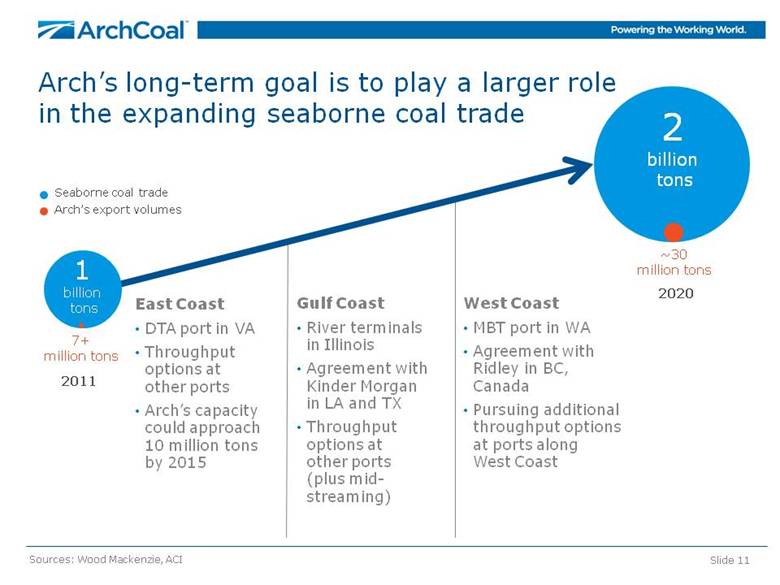
Slide 11 Arch’s long-term goal is to play a larger role in the expanding seaborne coal trade East Coast DTA port in VA Throughput options at other ports Arch’s capacity could approach 10 million tons by 2015 Sources: Wood Mackenzie, ACI 2020 2 billion tons 7+ million tons 1 billion tons 2011 ~30 million tons Seaborne coal trade Arch’s export volumes West Coast MBT port in WA Agreement with Ridley in BC, Canada Pursuing additional throughput options at ports along West Coast Gulf Coast River terminals in Illinois Agreement with Kinder Morgan in LA and TX Throughput options at other ports (plus mid-streaming) |
|
|
Arch has increased its financial flexibility and enhanced its liquidity Arch has no long-term debt maturities until 2016 Relaxed financial maintenance covenants until late 2014 $860 million of liquidity available, which includes cash on hand Slide 12 Short-term debt Unsecured bonds Term loan Cash on Hand* $513 million *Balances as of 6/30/2012 Debt Maturity Profile* (in millions) |
|
|
Slide 13 Arch maintains very low legacy liabilities versus major peers Legacy Liabilities of Largest U.S. Coal Companies (12/31/11, in millions) Net Debt-to-Capital Ratio Including Legacy Liabilities (6/30/12)* Annual Expense of Legacy Liabilities (12/31/11, in millions) Source: SEC filings *Legacy liabilities as of 12/31/11 |
|
|
Outlook for Coal Markets |
|
|
Slide 15 Metallurgical coal markets represent a compelling long-term opportunity CURRENT GLOBAL MARKET Met markets are soft currently due to global macro uncertainty Year-to-date global steel production is up slightly — but down in Europe Utilization rates at U.S. steel mills have fallen to ~75% Seaborne coal markets were modestly oversupplied by roughly 25 million tonnes in the first half of 2012 Sources: World Steel Association, Wood Mackenzie, ACI and other public sources LONG-TERM GLOBAL MARKET World steel consumption is projected to increase +50% by 2020 World population to top 8 billion by 2030 — with substantial growth in the middle class China and India are expected to import 1.5 billion tonnes by 2030 Long-term met market strength driven by demand growth — and supply constraints |
|
|
Slide 16 As pressures mount in the fastest growing supply regions, U.S. coal should become even more competitive on the global stage. With Arch’s exceptional reserve base, we expect far lower capital requirements for incremental met and thermal volumes. New Australian Metallurgical Coal Capacity* (Capital cost per tonne, in A$) Sources: Wood Mackenzie, ACI *Projects that began construction prior to 2010 versus post-2010 (or expected post-2010) U.S. coal should become increasingly competitive in world markets over time $149 $199 New Australian Thermal Coal Capacity* (Capital cost per tonne, in A$) $88 $187 $134 capital cost per tonne for Leer |
|
|
Slide 17 In seaborne coal markets, the trend line is clear... with little reason to believe it will change soon Sources: ACI, McCloskey and India Coal Market Watch Data China net imports (in millions of tonnes) India net imports (in millions of tonnes) 37 42 48 61 74 89 120 (46) (25) 0 (3) 103 147 174 27 20 (68) (83) Thermal Met |
|
|
Opportunities in the Atlantic Basin are promising Even with sluggish economic growth, Europe will require more imported coal in the coming decade Demand is growing in Germany, Turkey and Eastern Europe — as well as other countries — and indigenous supply is falling across the continent Slide 18 Atlantic Basin European Region* South America North America 570 million tonnes by 2020 +150 million tonnes annually by 2020 +50 million tonnes annually by 2020 *Includes Turkey and Israel |
|
|
Planned U.S. port expansions will support a more than doubling of coal exports over the next five years or so NS/Lamberts 32 DTA 20 CNX Marine 16 Pier IX 14 PA 9 CSX/Curtis Bay 9 Ridley** 4 Westshore** 4 MBT 15 SSA Marine 15 Other Northwest 10 CA 2 Mobile 18 Other AL 5 Charleston 8 U.S. Exports (in millions of tons) Sources: ACI, NMA, Port Terminal Presentations *Includes overland shipments to Canada/Mexico **Capacity available for U.S. sourced volumes Slide 19 Deepwater 10 Other Texas 5 IMT 17 United 11 Burnside 10 Convent 8 Mid-streaming 20 Great Lakes 8 West Coast 50 Southwest 15 Gulf Coast 66 East Coast 100 Midwest 8 Southeast 31 Actual Projected Capacity |
|
|
Slide 20 U.S. thermal market has reached an inflection point — and coal stockpiles are beginning to liquidate Sources: ACI and Energy Venture Analysis Estimated Coal Stockpile Levels at U.S. Power Generators (in million of tons) Stockpiles peaked in May 2012, slightly above the record set in 2009 Hot weather and modestly higher natural gas prices have drawn down stocks meaningfully Domestic thermal market is trending toward better balance in the second half of the year Normal Draw by August Projected Draw by Aug. 2012 20 million tons is the normal drawdown |
|
|
Powder River Basin coal has a compelling story when compared to natural gas Slide 21 Sources: ACI, EIA, Ventyx PRB Parity with Natural Gas* (coal = $ per ton; gas = $ per million Btu) *Assumes transportation charge of $20 to $25 per ton; incremental VOM non-fuel costs; and appropriate heat rate differentials for NGCC plants and coal plants. PRB is the most cost competitive fossil fuel source in the U.S. Opportunity for PRB prices to increase even in a low-priced natural gas environment Natural Gas PRB 8800 |
|
|
Slide 22 EPA regulations will force coal plant retirements — but at-risk plants are already operating at very low capacity factors Sources: ACI, Ventyx and EIA *Projected 2012 consumption based on 1Q12 data U.S. Coal Fleet (in gigawatts of capacity) Coal Consumption by At-Risk Plants (in millions of tons) Capacity at risk of retiring Expected capacity to remain online |
|
|
Growing U.S. population trends should boost retail/commercial power demand. A manufacturing renaissance in the U.S. could also spark industrial load again. These demand drivers should increase coal plant capacity utilization to levels achieved in the past, offsetting any impact from coal plant retirements. Over the long-term, growth in U.S. coal consumption should offset the impact of coal plant retirements Slide 23 U.S. Population (in millions of people) U.S. Industrial Load (in million megawatt hours) U.S. Coal Plant Utilization (Remaining 280 gigawatts) 300 325 2010 2020 Sources: Ventyx , U.S. Census Bureau and ACI 1.0 0.8 ? +100-150 million tons |
|
|
Arch has optimized its capital structure to weather tough conditions, and will benefit from improving coal markets Current downturn is primarily cyclical, and Arch’s diversified operations and competitive cost position will allow us to emerge as an even stronger player Slide 24 Flexible Capital Structure Current Focus Manage capital Control costs Rationalize supply Continue met development Maximize value of asset base As Cycle Turns Reduce leverage Return capital to stakeholders Invest in the business via organic and strategic growth |