Attached files
| file | filename |
|---|---|
| 8-K - FORM 8-K - SEALED AIR CORP/DE | d406198d8k.htm |
 BAML
2012 Industrials & Materials Conference SEALED AIR UPDATE
September 5, 2012
Carol Lowe, SVP & CFO
Amanda Butler, IR
Exhibit 99.1 |
 1
SAFE HARBOR AND REGULATION G STATEMENT
•
This
presentation
contains
“forward-looking
statements”
within
the
meaning
of
the
Private
Securities
Litigation
Reform
Act
of
1995.
Forward-looking
statements
can
be
identified
by
such
words
as
“anticipates,”
“believes,”
“plan,”
“assumes,”
“could,”
“estimates,”
“expects,”
“intends,”
“may,”
“plans to,”
“will”
and similar expressions.
Examples of these forward-looking statements include preliminary 2012
financial performance and expectations and assumptions associated with our
2011-2014 Integration & Optimization Program, availability and pricing of raw
materials, success of our growth programs, economic conditions, and the success of
pricing actions. These statements reflect our beliefs and expectations as
to future events and trends affecting our business, our consolidated
financial
position
and
our
results
of
operations.
A
variety
of
factors
may
cause
actual
results
to
differ
materially from these expectations, including general domestic and international
economic and political conditions affecting
packaging
utilization;
changes
in
our
raw
material
and
energy
costs;
credit
ratings;
timing
of
future
costs,
cash payments and benefits related to the 2011-2014 Integration &
Optimization Program, competitive conditions and contract terms; currency
translation and devaluation effects, including Venezuela; the success of our financial
growth, profitability and manufacturing strategies and our cost reduction and
productivity efforts; the effects of animal and food-related health
issues; pandemics; environmental matters; regulatory actions and legal matters;
and
the
successful
integration
of
Diversey.
For
more
extensive
information,
see
“Risk
Factors”
and
“Cautionary
Notice
Regarding
Forward-Looking
Statements,”
which
appear
in
our
most
recent
Annual
Report
on
Form
10-K,
as
filed with the Securities and Exchange Commission, and as revised and updated by
our Quarterly Reports on Form 10-Q and Current Reports on Form 8-K.
While we may elect to update these forward-looking statements at some
point in the future, we specifically disclaim any obligation to do so, whether as a result of new information,
future events, or otherwise.
•
Our
management
uses
non-U.S.
GAAP
financial
measures
to
evaluate
the
Company’s
performance,
which
exclude items we consider unusual or special items. We believe the use of such
financial measures and information may be useful to investors. We believe
that the use of non-U.S. GAAP measures helps investors to gain
a
better
understanding
of
core
operating
results
and
future
prospects,
consistent
with
how
management
measures and forecasts the Company's performance, especially when comparing such
results to previous periods or
forecasts.
For
important
information
on
our
use
of
non-U.S.
GAAP
financial
measures
and
information,
including
reconciliations of such non-U.S. GAAP financial measures and information to
comparable U.S. GAAP measures and information, please refer to the appendix
of this presentation. |
 2
WHO WE ARE
We protect what’s important -
-
helping people live
healthier, eat better and ship products safely
around the world.
We deliver consistent, superior solutions in:
Our customers rely on our solutions to improve
safety, efficiency and sustainability.
A COMPANY FOCUSED ON PROTECTION
FOOD SAFETY & SECURITY
FACILITY HYGIENE
PRODUCT PROTECTION
What you eat & drink +
Where you go +
What you ship +
Food
Div
PP
Note:
Food=
Food
businesses
(to
be
“Food
&
Beverage”),
DIV=Diversey
(to
be
“Institutional
&
Laundry”), PP= Protective Packaging |
 3
UNIQUELY POSITIONED WITH A SOLID BUSINESS
PROFILE
•
Premium global provider with #1 or #2 position in our principal applications
•
Diversified $8.0B* revenue
•
Unique and inventive Total System
Solutions
equipment + consumables + services = operational efficiency,
lower costs and less waste •
Scale, service and
reach
62-country presence, 8,200 market-facing team, reach customers in 175
countries •
Solid free cash flow generation
* Pro forma LTM net sales as of 6/30/2012
37% N. Am
36% EMEA
17% Asia-Pac
9% L. Am
25% Food Pkg
13% Food Sol
40% Diversey
17% Protective
5% Other
Geography
Businesses |
 OUR
VALUE PROPOSITIONS FOCUS ON REDUCING CUSTOMERS’
TOTAL COSTS
Protect customers’
products from farm to fork and add
value through operational efficiency and waste reduction
•
Expand among protein and beverage processors, developing regions
•
R&D development that incorporates joint solutions with Diversey
Provide innovative, integrated hygiene and infection
control solutions that reduce the “total cost to clean”
•
Exploit strengths by region, end-sector, and distribution (ie: Staples)
•
Continue to globalize solutions
Packaging solutions that provide efficiency and
sustainability from factory floor to the customer’s door
•
Leverage broadest sales/service/distribution network to grow
•
Product development focused on minimizing material use
4
Where you go
Diversey
(~40%)
What you ship
Protective
Packaging
(~20%)
What you eat & drink
Food
Businesses
(~40%
of
sales) |
 5
Financial Overview
Carol Lowe, CFO |
 6
2012 OUTLOOK ASSUMES SEQUENTIAL GROWTH
14.6%
$8,105
1H: $4,022
Constant $
1H: $3,980
F/X $(400)
2H: $4,125
Net Sales
PF 2011
2012
(2H Guidance)
2H-2012 Net Sales (+$61 v. 1H)
•
Seasonality
•
Growth programs and new customers
•
Stabilization in Europe
•
Normalized North American demand (DIV)
~$7,700 Reported
2H: ~$4,083
Constant $
~$8,105
Constant
$
($ millions) |
 7
2012 OUTLOOK ASSUMES SEQUENTIAL GROWTH
14.6%
PF 2011
2012
(2H Guidance**)
$1,083*
1H: $541
13.6%
F/X $(40)
2H: $542
13.1%
2H-2012 Adjusted EBITDA (+$111 v. 1H)
•
Seasonality and improved mix
•
Growth programs/new customers
•
Cost synergy benefits
•
Incremental expense control
•
Operational improvements, productivity
•
Elimination and/or reduction of 2Q-12
“one-time”
and “recurring”
items
* Pro forma 2011 Adjusted EBITDA reflects an approximate $40 million benefit from
the reversal of incentive compensation accruals at Diversey due to
performance **
Illustrates
using
the
low
end
of
the
Adjusted
EBITDA
guidance
range
of
$1,050
to
$1,075
million
Note: please find the reconciliations in the appendix.
Adjusted EBITDA
~$1,050
Reported
1H: $489
Constant $
~$1,090
Constant
$
($ millions)
Reported U.S. GAAP Net Earnings:
1H-2011 (pro forma) =
$124.7 1H-2012 = $(19.6)
2H-2011 (pro forma) = $ 5.3
2H: ~$600
Constant $ |
 8
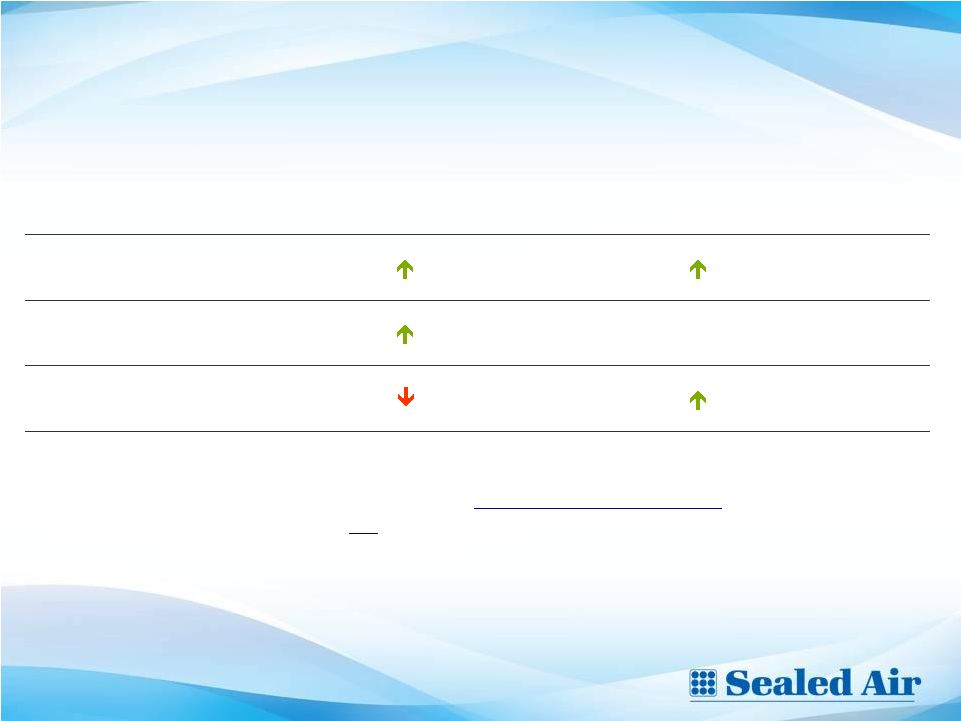
PRELIMINARY JULY PERFORMANCE
•
Preliminary
July
adjusted
operating
profit
up
mid
single-digit
percent
versus
prior
year
(excludes
impact
of
F/X),
or
flat
versus
prior
year
including
the
impact
of
unfavorable
foreign exchange.
2Q-2012
Constant $ Sales Growth vs. PY
July-2012
Preliminary
Constant $ Sales Growth vs. PY
Food Businesses
+3%
+6% to +7%
Protective Packaging
+1%
=
Flat
Diversey
-1%
+1% to +2%
Note: please find the reconciliations in the appendix.
|
 9
INTEGRATION & OPTIMIZATION PROGRAM ON TRACK
•
2011-2014 Integration & Optimization Program benefits now $195-$200
million by
2014
(vs.
initial
$50
million
estimate):
–
Results running ahead of initial plan and new actions taken to address
macro’s and further reduce our cost structure:
•
Targeting $90 million of cost synergies in 2012, $38 million achieved in
1H-12 •
Incremental $95 million to be generated in 2013
•
Examples of our 2012 targets:
($ in millions)
2011 Base
2012 Target
Employees
26,300
25,400
Manufacturing & warehouse facilities
245
235
Customer service centers & sales offices
294
247
Business units
11
5 |
 10
TARGETING $4.95 BILLION NET DEBT BY 12/31/2012
COMPONENTS
OF
NET
DEBT
REDUCTION:
•
Free cash flow guidance*: $425-$450 million
•
Increasing working capital improvements to drive
higher source of cash by year-end
•
Contribution from divestitures
•
Uses
of
cash
(figures
are
approximate):
•
$100 million: Dividends
•
$125 million: Restructuring payments
•
$380
million: Debt reduction
PORTFOLIO RATIONALIZATION TO ALIGN THE CORE:
•
Portfolio rationalization could generate up to $500 million
over next 12 months (gross proceeds)
•
Creates opportunity to accelerate deleveraging
* Free cash flow guidance reflects pre-restructuring and dividend
payments 6/30/2012
Target
12/31/2012
~$4,950
$5,337
($ millions)
Net Debt |
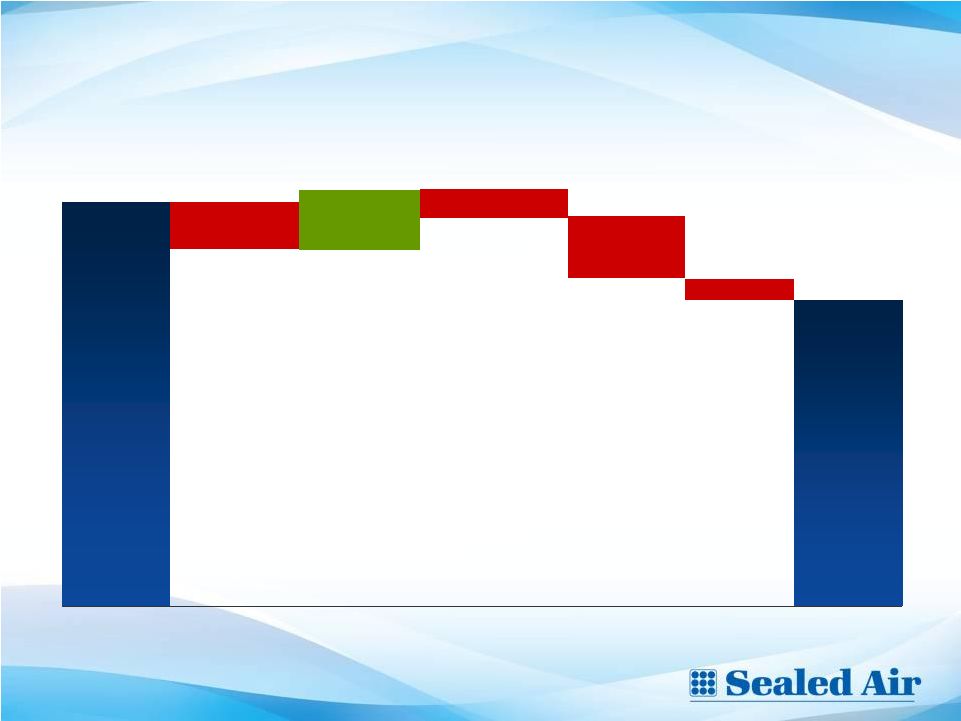
 11
$1.3 BILLION IN LIQUIDITY TO FUND OBLIGATIONS
163
356
425
400
750
750
450
877
30
12
1121
150
400
2012
2013
2014
2015
2016
2017
2018
2019
2020
2021
2033
= Senior Secured Credit Facilities (term loans)
=
W.
R.
Grace
Settlement
*
= Bonds (associated interest rate)
Debt Maturity Schedule
($ millions)
PROCEEDS
FROM
PORTFOLIO
RATIONALIZATION
OFFER
UP-SIDE
5.625%
12.0%
7.875%
8.125%
8.375%
6.875%
*Reflects estimated cash liability at December 31, 2012. Exact timing of the
settlement is unknown. |
 12
GRACE PROCEEDINGS SUMMARY UPDATE
•
W. R. Grace facing several appeals
in the Third Circuit Court of Appeals
and is awaiting a court schedule
•
W. R. Grace publicly stated that it would seek consents and waivers from
several parties to allow Grace to emerge from bankruptcy with these
appeals outstanding
•
Sealed Air is prepared to make its settlement payment once all funding
conditions are met but has not waived any condition, including that Grace's
plan not be subject to appeal
•
We continue to monitor the bankruptcy process |
 13
FOCUSED ON SOLID EXECUTION TO…
•
Continue integration of Diversey and align the platform for more
profitable
growth
•
Expand our market position: customer and developing region penetration
•
Achieve up-sized cost synergy targets
•
Prioritize capital deployment to:
–
Fund integration cash payments
–
Accelerate pay down of debt
–
Return cash to shareholders via dividend |
 14
Q&A |
 15
Appendix |
 16
Appendix
Components of Change in Net Sales –
Business Segments and Other
(Unaudited)
(In Millions)
Note:
Please
refer
to
the
earnings
release
dated
August
2,
2012
filed
with
the
SEC
on
Form
8-K
for important information on our use of non-U.S. GAAP financial measures and
information, as well as footnote information.
Volume -
Units
7.1
$
0.7
%
(2.4)
$
(0.5)
%
11.2
$
1.6
%
-
$
-
%
10.1
$
5.5
%
26.0
$
1.1
%
Volume -
Acquired businesses,
net of (dispositions)
0.6
0.1
-
-
-
-
1,567.2
#
1.3
0.7
1,569.1
67.0
Product
price/mix
(1)
25.2
2.6
7.7
1.6
3.5
0.5
-
-
0.8
0.4
37.2
1.6
Foreign currency translation
(21.8)
(2.2)
(10.7)
(2.2)
(13.1)
(1.9)
-
-
(5.8)
(3.1)
(51.4)
(2.2)
Total change (U.S. GAAP)
11.1
$
1.2
%
(5.4)
$
(1.1)
%
1.6
$
0.2
%
1,567.2
$
#
%
6.4
$
3.5
%
1,580.9
$
67.5
%
Impact of foreign currency
translation
21.8
2.2
10.7
2.2
13.1
1.9
-
-
5.8
3.1
51.4
2.2
Total constant dollar change
(Non-U.S.
GAAP)
(2)
32.9
$
3.4
%
5.3
$
1.1
%
14.7
$
2.1
%
1,567.2
$
#
%
12.2
$
6.6
%
1,632.3
$
69.7
%
Diversey
Packaging
Solutions
Packaging
Company
Total
Other
Six Months Ended June 30, 2012
Food
Food
Protective
Volume -
Units
2.6
$
0.5
%
(4.6)
$
(1.8)
%
1.4
$
0.4
%
-
$
-
%
5.8
$
6.1
%
5.2
$
0.4
%
Volume -
Acquired businesses,
net of (dispositions)
0.3
0.1
-
-
-
-
816.3
#
0.7
0.7
817.3
67.4
Product
price/mix
(1)
14.5
2.9
0.3
0.1
0.7
0.2
-
-
(0.1)
(0.1)
15.4
1.3
Foreign currency translation
(19.6)
(3.9)
(10.5)
(4.0)
(11.0)
(3.1)
-
-
(5.0)
(5.2)
(46.1)
(3.8)
Total change (U.S. GAAP)
(2.2)
$
(0.4)
%
(14.8)
$
(5.7)
%
(8.9)
$
(2.5)
%
816.3
$
#
%
1.4
$
1.5
%
791.8
$
65.3
%
Impact of foreign currency
translation
19.6
3.9
10.5
4.0
11.0
3.1
-
-
5.0
5.2
46.1
3.8
Total constant dollar
change
(Non-U.S.
GAAP)
(2)
17.4
$
3.5
%
(4.3)
$
(1.7)
%
2.1
$
0.6
%
816.3
$
#
%
6.4
$
6.7
%
837.9
$
69.1
%
Company
Diversey
Packaging
Food
Food
Solutions
Total
Packaging
Other
Protective
Three Months Ended June 30, 2012 |
 17
Food
Packaging
Food
Solutions
Protective
Packaging
Diversey
Other
Segments
and Other
Net Sales
499.7
$
247.1
$
344.6
$
816.3
$
96.7
$
2,004.4
$
Operating profit
(1)
46.4
$
26.3
$
42.8
$
29.8
$
2.9
$
148.2
$
Add: Special items
(2)
1.9
1.4
0.2
10.7
0.2
14.4
Adjusted operating profit
48.3
27.7
43.0
40.5
3.1
162.6
as a % of net sales
9.7%
11.2%
12.5%
5.0%
3.2%
8.1%
Add: Depreciation and amortization on property and
equipment, net of special items
15.9
7.6
5.5
9.3
3.9
42.2
Add: Amortization expense of acquired intangible assets
0.1
0.3
0.3
33.2
1.4
35.3
Total
64.3
$
35.6
$
48.8
$
83.0
$
8.4
$
240.1
$
as a % of net sales
12.9%
14.4%
14.2%
10.2%
8.7%
12.0%
Three Months Ended June 30, 2012
Food
Packaging
Food
Solutions
Protective
Packaging
Diversey
(3)
Other
Total
Segments
Net Sales
501.9
$
261.9
$
353.5
$
876.1
$
95.3
$
2,088.7
$
Operating profit
(1)
62.3
$
25.2
$
46.3
$
66.6
$
1.9
$
202.3
$
Add: Special items
(2)
-
-
(0.1)
10.2
-
10.1
Adjusted operating profit
62.3
25.2
46.2
76.8
1.9
212.4
as a % of net sales
12.4%
9.6%
13.1%
8.8%
2.0%
10.2%
Add: Depreciation and amortization on property and
16.6
7.5
5.9
11.6
4.4
46.0
Add: Amortization expense of acquired intangible assets
0.3
0.7
0.5
31.5
1.0
34.0
Total
79.2
$
33.4
$
52.6
$
119.9
$
7.3
$
292.4
$
as a % of net sales
15.8%
12.8%
14.9%
13.7%
7.7%
14.0%
Three Months Ended June 30, 2011
Reconciliation of U.S. GAAP Operating Profit to Non-U.S. GAAP Adjusted Operating
Profit & Pro Forma Results (Unaudited)
(In Millions)
Note: Please refer to the earnings release dated August 2, 2012 filed with the SEC on
Form 8-K for important information on our use of non-U.S. GAAP
financial measures and information, as well as footnote information.
|
 18
Reconciliation of Net (Loss) Earnings Available to Common Stockholders to Non-U.S.
GAAP EBIT, EBITDA and Adjusted EBITDA
(Unaudited)
(In Millions)
Note: Please refer to the earnings release dated August 2, 2012 filed with the SEC on
Form 8-K for important information on our use of non-U.S. GAAP
financial measures and information, as well as footnote information.
2012
2011
(1)
2012
2011
(1)
U.S. GAAP net (loss) earnings available to common stockholders
$
(13.7)
$
65.0
(19.6)
$
124.7
Add: Interest expense
97.6
36.9
195.4
73.9
Add: Income tax provision (benefit)
7.0
25.2
(1.4)
47.4
Non-U.S. GAAP EBIT
90.9
127.1
174.4
246.0
Depreciation and amortization on property, plant and equipment and intangible
assets acquired 77.8
36.9
160.1
72.9
Non-U.S. GAAP EBITDA
168.7
164.0
334.5
318.9
Add: Share-based incentive compensation and profit sharing expense
7.8
12.1
20.1
22.6
Add: 2011-
2014 Integration and Optimization Program restructuring charges
27.1
-
74.4
-
Add: Other restructuring charges
(0.6)
-
0.2
-
Add: Costs related to the acquisition of Diversey
1.7
6.6
3.5
6.6
accelerated depreciation and amortization expense of $5.3 million in the six months
ended June 30, 2012)
1.6
-
2.1
-
Add: Non-recurring associated costs from legacy Diversey restructuring programs
(less accelerated depreciation and amortization expense of $0.3
million.) 10.4
-
17.7
-
Add: Impairment of equity investment and related provisions for bad debt
25.8
-
25.8
-
Add: European manufacturing facility closure charges
0.1
(0.1)
0.1
0.2
Add: Foreign currency exchange losses related to Venezuelan subsidiary
0.2
-
0.2
0.2
Add: Settlement agreement related costs
0.1
0.2
0.2
0.6
Non-U.S. GAAP adjusted EBITDA
$
242.9
$
182.8
478.8
$
349.1
Total net sales
$
2,004.4
$
1,212.6
3,922.0
$
2,341.1
Non-U.S. GAAP adjusted EBITDA as a percentage of total net sales
12.1%
15.1%
12.2%
14.9%
Six Months Ended
June 30,
Three Months Ended
June 30, |
 19
2012
2011
(1)
2012
2011
(1)
Non-U.S. GAAP adjusted cash net earnings
$
112.5
$
89.7
$
146.4
$
150.2
Add: Depreciation expense on property, plant and equipment, net of special items
42.2
34.3
85.0
67.8
Add: Share-based incentive compensation and profit sharing expense
7.8
12.1
20.1
22.6
Less: Capital expenditures
(38.6)
(27.0)
(67.8)
(46.5)
Changes in working capital items:
Receivables, net
(29.3)
(35.4)
25.9
(34.4)
Inventories, net
7.7
(42.8)
(85.2)
(106.0)
Accounts payable
(0.3)
(1.9)
2.2
31.6
Non-U.S. GAAP Free Cash Flow
(2)
$
102.0
$
29.0
$
126.6
$
85.3
Six Months Ended
June 30,
June 30,
Three Months Ended
Non-U.S. GAAP Free Cash Flow
(Unaudited)
(In Millions)
Note: Please refer to the earnings release dated August 2, 2012 filed with the SEC on
Form 8-K for important information on our use of non-U.S. GAAP
financial measures and information, as well as footnote information.
|
 20
2Q-2011
2Q-2012
48
62
Price/Cost
Spread
1X
Items
Recurring
in 2H/12
~17
~(10)
~(20)
FX
~(2)
•
labor agreement
•
other 1x items
•
volume
•
cost absorption
•
start up costs
•
f/x on imports
Reported U.S. GAAP Operating Profit: 2Q-2011: $62 million, 2Q-2012: $46
million Please see the “Reconciliation of U.S. GAAP Operating Profit to
Non-U.S. GAAP Adjusted Operating
Profit
&
Pro
Forma
Results”
in
the
appendix
for
reconciliations
Food Packaging Segment Adjusted Operating Profit 2Q-2012 Bridge
(Unaudited)
(In Millions) |
 21
2Q-2011
2Q-2012
41
77
Benefits
1X Items
Recurring
in 2H/12
~35
~(7)
~(35)
FX
~(7)
•
synergies
•
SARs
•
price/cost
•
mix
•
compensation
•
volume
•
inventory
‘11 comp
~(23)
Reported U.S. GAAP Operating Profit (pro forma): 2Q-2011: $67 million,
2Q-2012: $30 million Please see the “Reconciliation of U.S. GAAP
Operating Profit to Non-U.S. GAAP Adjusted Operating
Profit
&
Pro
Forma
Results”
in
the
appendix
for
reconciliations
Diversey Segment Adjusted Operating Profit 2Q-2012 Bridge
(Unaudited)
(In Millions) |