Attached files
| file | filename |
|---|---|
| 8-K - 8-K - RALCORP HOLDINGS INC /MO | d406497d8k.htm |
 Exhibit 99.1 |
 Ralcorp Holdings, Inc.
Barclays Back to School Conference
September 5th, 2012 |
 2
Forward Looking Statements
Forward Looking Statements
Please note that this presentation contains forward-looking statements as
defined in the Private Securities Litigation Reform
Act
of
1995.
The
words
“anticipate,”
“plan,”
“estimate,”
“expect,”
“intend,”
“will,”
“should”
and
similar
expressions, as they relate to us, are intended to identify forward-looking
statements. These statements reflect management’s current beliefs,
assumptions and expectations and are subject to a number of factors and risks that may
cause actual results to differ materially. These factors and risks include but are
not limited to: (i) changes in actual or expected results of operations;
(ii) our ability to effectively manage future sales growth along with the growth from
acquisitions or continue to make acquisitions at the rate at which we have been
acquiring in the past; (iii) significant increases in the costs of certain
commodities, packaging or energy used to manufacture our products; (iv) our ability to
continue to compete in our business segments and our ability to retain our market
position; (v) our ability to maintain a meaningful price gap between our
products and those of our competitors, successfully introduce new products or
successfully manage costs across all parts of the Company; (vi) significant
competition within the private brand business; (vii) the timing and expected
costs and benefits associated with restructuring initiatives and cost reduction
programs; (viii) the loss of a significant customer; (ix) allegations that our
products cause injury or illness, product recalls and product liability
claims and other litigation; (x) our ability to anticipate changes in consumer preferences and
trends; (xi) our ability to service our outstanding debt or obtain additional
financing; (xii) disruptions in the U.S. and global capital and credit
markets; (xiii) fluctuations in foreign currency exchange rates; (xiv) the termination or
expiration of current co-manufacturing agreements; (xv) consolidations among
the retail grocery and foodservice industries; (xvi) change in estimates in
critical accounting judgments and changes to or new laws and regulations
affecting our business; (xvii) termination of existing anti-dumping measures
imposed against certain foreign imports of dry pasta; (xviii) losses or
increased funding and expenses related to our qualified pension plan; (xix) labor strikes or
work stoppages by our employees; (xx) bankruptcy of a significant customer; (xxi)
impairment in the carrying value of goodwill or other intangibles; (xxii)
our ability to integrate acquisitions and achieve the expected amount of accretion;
and
(xxiii)
changes
in
weather
conditions,
natural
disasters
and
other
events
beyond
our
control;
and
other
risks
and
uncertainties described from time to time in our periodic reports filed with the
Securities and Exchange Commission. Ralcorp does not assume any obligation to
update any forward-looking statements or the information contained
herein
as
a
result
of
new
information
or
future
events
or
developments,
except
as
required
by
law.
This presentation includes certain non-GAAP financial measures. The required
reconciliations from these non-GAAP financial measures to their comparable
GAAP financial measures are included in the appendix to this presentation.
|
 3
Additional Information
Additional Information
Market and Industry
This presentation includes industry and trade association data, forecasts and
information that we have prepared based, in part, upon data, forecasts and
information obtained from independent trade associations, industry publications and
surveys
and
other
independent
sources
available
to
us.
Some
data
also
are
based
on
our
good
faith
estimates,
which
are derived from management’s knowledge of the industry and from independent
sources. These third-party publications and surveys generally state that
the information included therein is believed to have been obtained from
sources believed to be reliable. We have not independently verified any of the data
from third-party sources nor have we
ascertained
the
underlying
economic
assumptions
on
which
such
data
are
based.
Similarly,
we
believe
our
internal
research is reliable, even though such research has not been verified by any
independent sources. Other Data
Financial data regarding the Sara Lee private-brand dough business have been
prepared based upon information provided
by
Sara
Lee
Company.
We
have
not
independently
verified
any
of
the
data
nor
have
we
ascertained
the
underlying economic assumptions on which such data are based.
|
 Agenda
About Ralcorp
The Private-Brand Opportunity
Positioning Ralcorp for Long-Term Sustainable Growth
Growth-Through-Acquisition Strategy
Fiscal 2013 Headwinds / Tailwinds
The Ralcorp Cash Story
Conclusion
4 |
 5
Ralcorp Today
Ralcorp Today
The leader in private-brand food production and a major producer of foodservice
products in North America
Completed Post spin-off on Feb 3, 2012
Sales: $4.2 billion
(1)
Categories: 22 major product categories
Geographies: United States, Canada, Italy
Employees: 10,000
Plants: 41
Note:
(1) Management estimates based on FY 2011; excludes Post; Includes Refrigerated
Dough. |
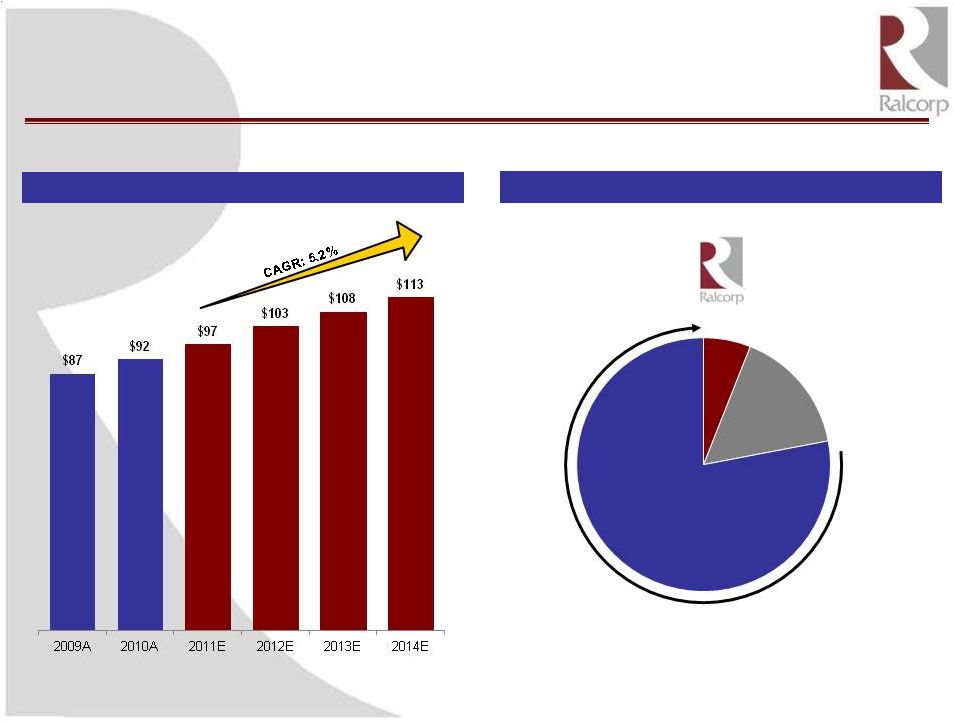
 $114
$127
$140
$165
$179
$193
$244
$256
$324
$396
$536
2001
2002
2003
2004
2005
2006
2007
2008
2009
2010
2011
$1,178
$1,280
$1,304
$1,558
$1,675
$1,850
$2,233
$2,644
$2,821
$3,061
$3,787
2001
2002
2003
2004
2005
2006
2007
2008
2009
2010
2011
6
Consistent Private-Brand Operating Performance
Consistent Private-Brand Operating Performance
Margin
Source:
Company filings for 2002-2011.
Note: Excludes non-cash unusual and non-recurring items. Net Sales and
Adjusted EBITDA pro forma for separation of Post. (1) Adjusted EBITDA is
defined as earnings before interest, income taxes, depreciation, and amortization, excluding Post separation costs, merger and integration costs, provision for legal settlement,
adjustments
for
economic
hedges,
accelerated
depreciation,
gains
/
losses
on
forward
sale
contracts,
gain
on
sale
of
securities,
acquired
inventory
valuation
adjustments,
goodwill
and
trademark
impairment losses, merger termination fees, and equity method earnings in Vail
Resorts, Inc. A reconciliation from Adjusted EBITDA to the comparable GAAP financial measure is included in the
appendix. A reconciliation from Adjusted EBITDA to the comparable GAAP
financial measure is included in the appendix. Adjusted EBITDA metrics not pro forma for acquisitions. FY 2008-FY 2011.
($ in millions)
Net Sales
Adjusted EBITDA
(1)
10%
10%
11%
11%
11%
10%
11%
10%
12%
13%
14%
Average Organic Growth = 3.6% |
 7
Source: FactSet (includes dividends), Post treated as special dividend.
Note: Reflects shareholder return since August 31, 2002 through August 31,
2012. Note:
Large
Cap
Food:
Campbell,
ConAgra,
General
Mills,
Heinz,
Hershey,
Kellogg,
Kraft;
Mid
Cap
Food:
B&G
Foods,
Flowers
Foods,
Hain,
Lancaster,
McCormick,
Snyder’s-Lance,
TreeHouse.
Total Shareholder Return
Proven Record of Delivering Strong Returns to Shareholders
Proven Record of Delivering Strong Returns to Shareholders
54%
27%
193%
263%
Ralcorp
Mid Cap Food
Large Cap Food
S&P 500 |
 8
The Private-Brand Opportunity
The Private-Brand Opportunity |
 9
Private-Brand Food Key Takeaways
Private-Brand Food Key Takeaways
U.S. private-brand market has $100 billion in annual sales and remains
highly fragmented
Private-brand has grown steadily and is expected to continue growing
Private-brands deliver greater profitability to retailers than branded
products Ralcorp is uniquely positioned to capitalize on the
private-brand opportunity with leading positions in key product
categories |
 Highly Fragmented Market With Substantial Growth
Opportunities
Opportunities
EBITD
A
Margin
U.S. Private-Brand Market Growth
10
2011 U.S. Private-Brand Market Share
78%
6%
16%
Consolidated
Competitors
($ in billions)
All Others
Source: Company filings, presentations and other materials; Packaged Facts – The Future of Food
Retailing in the U.S., 3rd Edition.
Note: Consolidated competitors include Dean Foods, Cott, TreeHouse and Smithfield. Market share
calculations based on LTM Sep 2011 sales as a percentage of estimated 2011
total U.S. private label sales (food and beverage). |
 Private-Brand Food Has Grown Throughout the
Economic Cycle
Economic Cycle
11
Source: A.C. Nielsen.
4%
4%
4%
2%
3%
3%
3%
3%
5%
3%
3%
4%
3%
1%
5%
10%
4%
9%
5%
7%
7%
4%
6%
5%
10%
7%
6%
4%
(6)%
(4)%
(2)%
0%
2%
4%
6%
0%
2%
4%
6%
8%
10%
12%
1998
1999
2000
2001
2002
2003
2004
2005
2006
2007
2008
2009
2010
2011
Branded
Private Brand
Y-O-Y GDP Growth |
 12
Retailer Concentration a Major Driver in Private-Brand
Retailer Concentration a Major Driver in Private-Brand
Growth
Growth
Source: Symphony
IRI
Special
Report
–
Private
Label
in
Europe;
Wall
Street
estimates. |
 13
Private-Brand Food Economics Are Powerful for
Private-Brand Food Economics Are Powerful for
Retailers and Consumers
Retailers and Consumers
Source: Wall Street research.
National Brand
Private-Brand
$10.00
Price to
Consumer
$7.00
Price to
Consumer
$7.50
Retailer's
Cost
$4.00
Retailer's
Cost
$2.50
Retailer's Gross
Profit
$3.00
Retailer's Gross
Profit
Consumer saves 30%
Retailer’s gross profit increases 20%
and inventory costs are lower
Significant Margin Opportunity for Retailers and Price Benefit for Consumers
|
 Ralcorp Leads Private-Brands in Attractive Categories
14
Source: IRI FDMx 52-weeks ending October 2, 2011.
#1
#2
#1
#1
#1
#1
#1
#1
60%
30%
65%
45%
70%
90%
50%
70%
Cereal
Cookies
Crackers
Snack Nuts
Pasta
Refrigerated
Dough
Peanut
Butter
Jams
Ralcorp
Position: |
 15
Positioning Ralcorp for Long-term
Positioning Ralcorp for Long-term
Sustainable Growth
Sustainable Growth |
 16
Strategic Restructuring Background
Strategic Restructuring Background
Cereal
Products
Legacy private-brand ready-to-eat and hot cereal business
Operationally linked to Post branded cereals when Ralcorp owned Post
Became a standalone business following spin-off of Post in February
2012
Snacks,
Sauces &
Spreads
Pasta
The result of 16 acquisitions and integrations
Competes in 14 dry grocery categories
In the fall of 2011, completed the consolidation of five different sub-
segment into St. Louis, MO headquarters
Acquired American Italian Pasta Company in July 2010
Operates as a standalone business headquartered in Kansas City, MO
Effective October 1, 2012, the three businesses will be combined
into one business
headquartered in St. Louis; AIPC’s Kansas City office will be closed by calendar
year end |
 17
Ralcorp Center Store Strategy
Ralcorp Center Store Strategy
Vision
World class Private-Brand Company, with superior Sales, Marketing,
R & D and Operations capabilities across 20 food categories
One voice to our customers
Highly efficient supply chain with superior service capabilities
Superior logistics network
Superior sales and marketing value-added capabilities
Best-in-class Research and Development capabilities
Efficient divisional and corporate support infrastructure
Key Elements |
 18
The Ralcorp Center Store Food Business
The Ralcorp Center Store Food Business
$3.2 billion private-brand food business
Significant Savings Due to Consolidation
$26
-
$31
million
in
Fiscal
2013
Leading market positions overall and within our categories
# 1 private-brand share in 14 categories
# 2 private-brand share in 3 categories
Led by Rich Koulouris
33 years experience
Experienced leadership team |
 19
Growth-through-Acquisition Strategy
Growth-through-Acquisition Strategy |
 20
We Have Completed 30 Acquisitions Since 1997, Totaling
We Have Completed 30 Acquisitions Since 1997, Totaling
Over $3.3 Billion in Combined Annual Sales
Over $3.3 Billion in Combined Annual Sales
($ in millions)
Flavorhouse
Apr-98
$62 Sales
Sugarkake
Aug-98
$30 Sales
Nutcracker
Sep-98
$42 Sales
Martin Gillet
Mar-99
$70 Sales
Cascade Cookies
Jan-00
$19 Sales
Southern Roasted
Mar-99
$28 Sales
Linette
May-00
$28 Sales
Ripon Foods
Oct-99
$64 Sales
Red Wing
Jul-00
$348 Sales
Wortz
Apr-97
$69 Sales
Lofthouse
Jan-02
$70 Sales
Bakery Chef
Dec-03
$171 Sales
Concept 2 Bakers
Feb-04
$34 Sales
Medallion Foods
Jun-05
$43 Sales
Western Waffles
Nov-2005
$75 Sales
Parco Foods
Feb-06
$50 Sales
Cottage Bakery
Nov-06
$125 Sales
Bloomfield Bakers
Mar-07
$188 Sales
Torbitt & Castleman
Jan-01
$80 Sales
Beta Brands
Jan-07
$10 Sales
J.T.Bakeries
May-10
$39 Sales
N.A.B. / PL Floods
May-10
$57 Sales
Sepp’s
Jun-10
$29 Sales
Harvest Manor
Mar-09
$180 Sales
AIPC
Jul-10
$569 Sales
Pastries Plus
Aug-07
$10 Sales
Refrigerated Dough
Oct-11
$306 Sales
Refrigerated
Dough
Pastificio Annoni
Dec-11
$13 Sales
Petri
May-12
$50 Sales
Gelit S.r.l.
June-12
$40 Sales
Ralcorp Management Has a Successful Track Record of Identifying and Integrating
Acquisitions |
 21
Ralcorp’s Acquisition Pipeline is Robust with Nearly 50
Ralcorp’s Acquisition Pipeline is Robust with Nearly 50
Potential Private-Brand M&A Targets
Potential Private-Brand M&A Targets
($ in millions)
Category growth potential
Attractive margins or
margin expansion
opportunities
Strong cash flow
characteristics
Earnings accretion
Attractive returns
Acquisition Criteria
High
Low
Synergies
>$500
Revenue
Scale:
>$100
<$500
<$100 |
 (1)
Based on FY 2011 Frozen Bakery products segment profit plus depreciation and amortization.
(2) Based on 9.5x LTM EBITDA multiple.
Total Price Paid
$ 725 million
Implied EBITDA
Multiple
(1)
5.7x
Implied Value at
Current Multiple
(2)
$ 1,208 million
Implied Value
Creation (%)
22
Case Study: Building Platform –
Case Study: Building Platform –
Frozen Bakery Division
Frozen Bakery Division
($ in millions)
Target
Revenue
Cascade Cookie
Company
$19
Lofthouse Foods
70
Bakery Chef
171
C2B
34
Western Waffles
75
Parco
50
Cottage Bakery
125
Pastries Plus
10
Sepp’s
29
Total
$583 |
 23
Fiscal 2013
Fiscal 2013 |
 Fiscal 2013 Headwinds / Tailwinds
Volume
Loss of Bloomfield customer
Higher tax rate (35.25%)
Lower commodity costs (slight deflation in base business)
Restructuring impact ($26-$31 million)
Oklahoma plant closure ($10-$12 million)
Bloomfield inefficiencies
Refrigerated Dough synergies ($6-$8 million)
Petri / Gelit acquisition accretion ($0.10 / share)
24
Headwinds
Tailwinds |
 25
The Ralcorp Cash Story
The Ralcorp Cash Story |
 26
The Ralcorp Cash Story –
The Ralcorp Cash Story –
“50 / 50”
“50 / 50”
Utilizing free cash flow to drive balanced revenue, EPS, and EBITDA growth through
acquisitions and share repurchases to enhance organic growth
Free Cash Flow
EPS Growth
and Shareholder Returns
50%
50%
Share Repurchases
Acquisitions |
 27
Key Economics of “50 / 50”
Key Economics of “50 / 50”
Model
Model
Annual cash flow of $250 -
$300 million*
Cash deployed as follows
•
50% to acquisitions (illustrative 8x purchase multiple)
•
50% to stock repurchases
*Estimate
assumes
maintenance
capital
expenditures
of
$40
-
$50
million
2.5x –
3.0x leverage |
 Illustration of Model in Practice
50% Cash Flow Toward Acquisitions
28
50% Cash Flow Toward Share Repurchases
Note: Mid-point of acquisition model assumes 1) 8x EBITDA purchase multiple, 2)
7x EBITDA post-synergy purchase multiple, 3) EBIT at 75% of EBITDA, 4)
new amortization expense at 30% of EBITDA, 5) tax rate of 35.25%, 6) shares outstanding of
56.5 million. Mid-point of repurchase model assumes share price of $70
and shares outstanding of 56.5 million. $150 million
$150 million
$0.10 -
$0.15 GAAP accretion
$0.15 -
$0.25 cash accretion
3% -
5% shares retired
Leverage Acquired EBITDA for
Additional Growth |
 Ralcorp Long-Term Growth Objectives
Revenue
Cash EPS
Combination of continued
organic growth in private-brand
coupled with flow of acquisitions
Driven by acquisition-based
growth model (excludes
acquisition based intangible
amortization)
Long-Term Goal
Commentary
Low double digit
Mid single digit
GAAP EPS
High single digit
29
Driven by acquisition-based
growth model
Enhanced by productivity gains,
share repurchases and
acquisition synergies |
 Our
Perspective on Shareholder Value Our Perspective on Shareholder Value
Proven record of delivering strong returns to shareholders
Post spin-off has unlocked shareholder value
Long term private-brand fundamentals remain strong and outlook for next year
has more tailwinds than headwinds
Executional issues largely behind us
Commitment to utilizing free cash flow to drive balanced growth through
acquisitions and share repurchases
Compelling total shareholder return opportunity
30 |
 31
Appendix
Appendix |
 32
Ralcorp –
Ralcorp –
Adjusted EBITDA Reconciliation
Adjusted EBITDA Reconciliation
Source: Company filings and management estimates.
($ in millions)
FY 2001
FY 2002
FY 2003
FY 2004
FY 2005
FY 2006
FY 2007
FY 2008
FY 2009
FY 2010
FY 2011
LTM
12/31/11
Net Earnings
$ 39.9
$ 53.8
$ 7.4
$ 65.1
$ 71.4
$ 68.3
$ 31.9
$ 167.8
$ 290.4
$ 208.8
$ (187.2)
$ (193.2)
Interest expense, net
$ 15.9
$ 5.9
$ 3.3
$ 13.1
$ 16.5
$ 27.3
$ 42.3
$ 54.6
$ 99.0
$ 107.8
$ 134.0
$ 132.7
Income taxes
22.1
30.7
16.9
37.2
36.6
29.9
7.5
86.7
156.9
105.3
83.0
78.9
Depreciation and amortization
41.6
35.8
38.7
47.5
55.8
66.8
82.4
99.5
144.7
166.8
226.5
234.0
Adjustments for economic hedges
-
-
-
-
-
-
-
-
-
-
28.9
39.5
Post separation costs
-
-
-
-
-
-
-
-
-
-
2.8
5.5
Merger and integration costs
-
-
-
-
-
-
-
7.9
31.6
33.1
2.5
7.9
Impairment of intangible assets
-
-
59.0
-
-
-
-
-
-
39.9
503.5
503.5
Provision for legal settlement
-
-
-
-
-
-
-
-
-
7.5
2.5
-
Restructuring/plant closures (excluding depreciation)
2.6
-
14.3
2.4
2.7
0.1
0.9
1.7
0.5
2.5
3.7
3.7
Acquired inventory valuation adjustment
-
-
-
-
-
-
-
23.4
0.4
-
-
-
(Gain) loss on forward sale contracts
-
-
-
-
-
10.6
87.7
(111.8)
(17.6)
-
-
-
Gain on sale of securities
-
-
-
-
-
(2.6)
-
(7.1)
(70.6)
-
-
-
Merger termination fee, net of related expenses
(4.2)
-
-
-
-
-
-
-
-
-
-
-
Equity earnings in Vail Resorts, Inc.
(3.9)
0.8
0.4
(0.4)
(4.5)
(7.0)
(8.9)
(14.0)
(9.8)
-
-
-
Adjusted EBITDA
$ 114.0
$ 127.0
$ 140.0
$ 164.9
$ 178.5
$ 193.4
$ 243.8
$ 308.7
$ 625.5
$ 671.7
$ 800.2
$ 812.5
Pro Forma Acquisition Adjusted Food EBITDA
2.1
1.4
-
8.8
8.9
2.9
12.5
223.7
6.8
143.9
-
37.0
Pro Forma Adjusted EBITDA
$ 116.1
$ 128.4
$ 140.0
$ 173.7
$ 187.4
$ 196.3
$ 256.3
$ 532.4
$ 632.3
$ 815.6
$ 800.2
$ 849.5
Post Segment Profit
$ -
$ -
$ -
$ -
$ -
$ -
$ -
$ 43.3
$ 250.6
$ 220.6
$ 206.0
$ 191.2
Post Depreciation and Amortization
-
-
-
-
-
-
-
9.8
50.6
55.4
58.7
59.0
Post Adjusted EBITDA
$ -
$ -
$ -
$ -
$ -
$ -
$ -
$ 53.1
$ 301.2
$ 276.0
$ 264.7
$ 250.2
Private Brand Adjusted Food EBITDA
$ 114.0
$ 127.0
$ 140.0
$ 164.9
$ 178.5
$ 193.4
$ 243.8
$ 255.6
$ 324.3
$ 395.7
$ 535.5
$ 562.3
Private Brand Pro Forma Adjusted EBITDA
$ 116.1
$ 128.4
$ 140.0
$ 173.7
$ 187.4
$ 196.3
$ 256.3
$ 255.6
$ 331.1
$ 539.6
$ 535.5
$ 599.3 |
 Higher D&A Driven By Amortization of Acquired
Intangibles
Intangibles
33
AIPC (July 2010)
Post Foods RMT (Aug 2008)
Cash
$
39.4
Receivables
42.9
Inventories
48.1
Other current assets
21.0
Property
252.2
Goodwill
534.1
Other intangible assets
568.2
Other assets
1.1
Total assets acquired
$
1,507.0
Accounts payable
(24.1)
Other current liabilities
(29.9)
Deferred income taxes
(238.3)
Other liabilities
(4.9)
Total liabilities assumed
(297.2)
Net assets acquired
$
1,209.8
Cash
$
73.3
Receivables
2.6
Inventories
103.9
Other current assets
-
Property
470.5
Goodwill
1,794.1
Other intangible assets
946.8
Other assets
-
Total assets acquired
$
3,391.2
Accounts payable
-
Other current liabilities
(17.0)
Long-term debt
(964.5)
Deferred income taxes
(448.0)
Other liabilities
(74.0)
Total liabilities assumed
(1,503.5)
Net assets acquired
$
1,887.7
Definite Lived Assets
Amount Amortizable
$259.6
$384.4
$245.1
% of Total Assets
Acquired
45%
26%
7%
Annual Amortization
Impact per Share (1)
($0.20)
($0.28)
($0.14)
Transaction Value
~$545mm
~$1.2bn
~$2.6bn
(1) Assumes 36% tax rate and shares outstanding as of end of respective fiscal
year. Cash
$
0.9
Receivables
14.7
Inventories
23.1
Other current assets
0.1
Property
62.6
Goodwill
216.6
Other intangible assets
259.6
Total assets acquired
$
577.6
Accounts payable
(14.1)
Other current liabilities
(8.8)
Other liabilities
(3.2)
Total liabilities assumed
(26.1)
Net assets acquired
$
551.5
Refrigerated Dough (Oct 2011) |
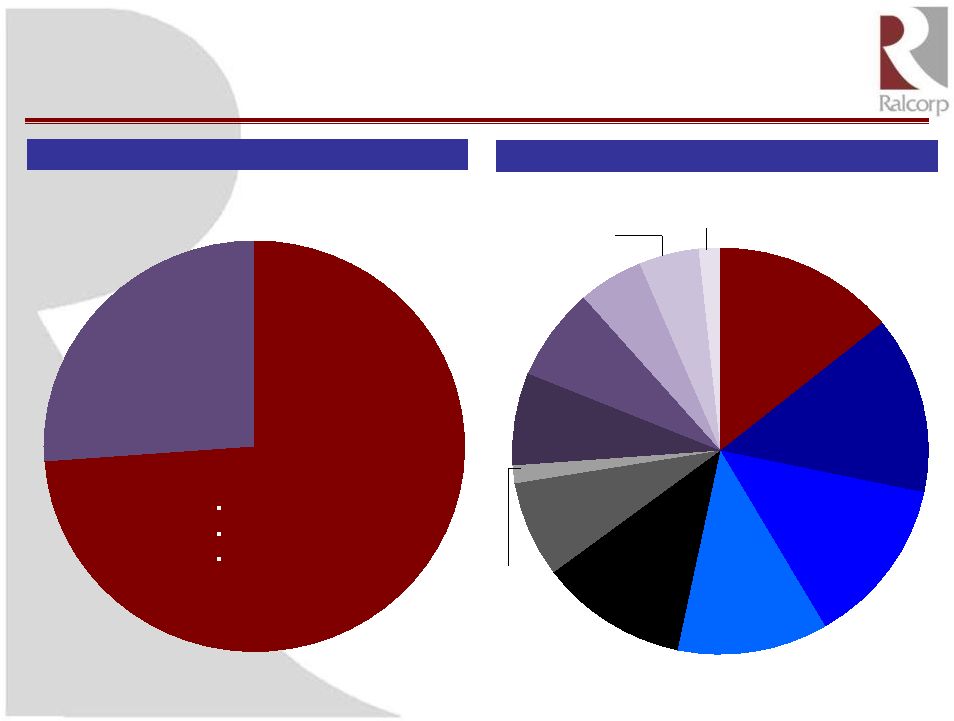 Ralcorp Segment and Product Overview
Pro
Forma
Net
Sales
by
Segment
Pro
Forma
Net
Sales
by
Product
Pasta
14%
Crackers &
Cookies
12%
Nutritional
Bars, Other
8%
Snack Nuts,
Candy & Chips
14%
Sauces &
Spreads
13%
Ready-to-Eat
Cereal
11%
Refrigerated
Dough
7%
Griddle
7%
Hot Cereal
1%
Cookies
5%
Breads
5%
Frozen, Other
2%
Center Store
Private Brand
74%
Frozen
Bakery
26%
34
Source: Company filings.
Note: Reflects trailing 12 months as of September 30, 2011. Pro forma for
acquisition of Sara Lee Dough. Numbers may not add to 100% due to rounding.
Includes:
Pasta
Snacks, Sauces & Spreads
Cereal Products |
 Ralcorp Ingredients and Packaging Overview
Base business 2013 Estimate
35
Source: Management estimates
Nuts
24%
Wheat
19%
Packaging
19%
Fruit & Veg
4%
Cocoa
2%
Flavoring
2%
Sweeteners
9%
Oil
8%
All Other
19%
Oats
2%
Corn
2% |