Attached files
| file | filename |
|---|---|
| 8-K - FORM 8-K - PATTERSON UTI ENERGY INC | d405372d8k.htm |
 Patterson-UTI Energy, Inc.
Barclays CEO Energy-Power Conference
Barclays CEO Energy-Power Conference
September 4, 2012
September 4, 2012
Exhibit 99.1 |
 2
2
Forward Looking Statements
This material and any oral statements made in connection with this material
This material and any oral statements made in connection with this
material include "forward-looking statements" within the
meaning of the Securities Act of include "forward-looking
statements" within the meaning of the Securities Act of 1933 and the
Securities Exchange Act of 1934. Statements made which provide
1933 and the Securities Exchange Act of 1934. Statements made which
provide the Company’s or management’s intentions, beliefs,
expectations or predictions for the Company’s or management’s
intentions, beliefs, expectations or predictions for the future are
forward-looking statements and are inherently uncertain. The the
future are forward-looking statements and are inherently uncertain. The
opinions, forecasts, projections or other statements other than statements of
opinions, forecasts, projections or other statements other than
statements of historical fact, including, without limitation, plans and
objectives of management of historical fact, including, without
limitation, plans and objectives of management of the Company are
forward-looking statements. It is important to note that actual
the Company are forward-looking statements. It is important to note
that actual results could differ materially from those discussed in such
forward-looking results could differ materially from those discussed
in such forward-looking statements. Important factors that
could cause actual results to differ materially statements.
Important factors that could cause actual results to differ materially
include the risk factors and other cautionary statements contained from time to
include the risk factors and other cautionary statements contained from
time to time in the Company’s SEC filings, which may be obtained by
contacting the time in the Company’s SEC filings, which may be
obtained by contacting the Company
Company
or
or
the
the
SEC.
SEC.
These
These
filings
filings
are
are
also
also
available
available
through
through
the
the
Company’s
Company’s
web
web
site at http://www.patenergy.com
site at http://www.patenergy.com
or through the SEC’s Electronic Data Gathering
or through the SEC’s Electronic Data Gathering
and
and
Analysis
Analysis
Retrieval
Retrieval
System
System
(EDGAR)
(EDGAR)
at
at
http://www.sec.gov.
http://www.sec.gov.
We
We
undertake
undertake
no
no
obligation to publicly update or revise any forward-looking
statement. Statements obligation to publicly update or revise any
forward-looking statement. Statements made in this
presentation include non-GAAP financial measures. The required
made in this presentation include non-GAAP financial measures. The
required reconciliation to GAAP financial measures are included on our
website and at the reconciliation to GAAP financial measures are
included on our website and at the end of this presentation.
end of this presentation. |
 3
Why Invest now in U.S. Oil Services?
•
•
Shale gas and oil fundamentally changed the North American
Shale gas and oil fundamentally changed the North American
production outlook for natural gas and oil
production outlook for natural gas and oil
–
–
Horizontal drilling and completion techniques
Horizontal drilling and completion techniques
•
•
Major new investments over the past five years in North
Major new investments over the past five years in North
American land projects by many of the largest U.S. and
American land projects by many of the largest U.S. and
International Oil Companies
International Oil Companies
–
–
Major opportunities to produce hydrocarbons at attractive
Major opportunities to produce hydrocarbons at attractive
world market prices
world market prices
–
–
Increased issues in other politically-challenged areas
Increased issues in other politically-challenged areas
–
–
Return to North America land; a major shift!
Return to North America land; a major shift!
•
•
U.S. now expected to supply approximately 60% of domestic
U.S. now expected to supply approximately 60% of domestic
petroleum consumption; was 40% six years ago.
petroleum consumption; was 40% six years ago. |
 4
Why Invest now in U.S. Oil Services?
•
•
The timing looks good:
The timing looks good:
–
–
Attractive oil prices have kept oil directed activity high
Attractive oil prices have kept oil directed activity high
•Increased oil activity has largely absorbed the spare
•Increased oil activity has largely absorbed the spare
capacity from the more than 50% decrease in natural
capacity from the more than 50% decrease in natural
gas drilling
gas drilling
–
–
Natural gas market looks poised for a “modest”
Natural gas market looks poised for a “modest”
recovery
recovery
•Inventories filling slower than previously expected with
•Inventories filling slower than previously expected with
weekly injections averaging approximately 65% of prior
weekly injections averaging approximately 65% of prior
year levels
year levels
•U.S. natural gas rig count at the lowest level in more than
•U.S. natural gas rig count at the lowest level in more than
13 years
13 years
•Increased planned industrial usage
•Increased planned industrial usage |
 Key Takeaways –
PTEN Advantages
•
•
Operational Strength
Operational Strength
–
–
High quality equipment
High quality equipment
–
–
Term contract backlog / customer relationships
Term contract backlog / customer relationships
–
–
Strong operational and financial flexibility
Strong operational and financial flexibility
•
•
Flexible operating model
Flexible operating model
–
–
Maximizes earnings growth during periods of increased
Maximizes earnings growth during periods of increased
activity
activity
–
–
Minimizes costs during periods of low activity
Minimizes costs during periods of low activity
–
–
Strong cash flow generation
Strong cash flow generation
•
•
History of returning capital to shareholders
History of returning capital to shareholders
–
–
Share buybacks
Share buybacks
–
–
Dividends
Dividends
5 |
 Contract Drilling
•
One of the “Big 3”
U.S. Land
drillers
•
High quality fleet including 100
APEX™
rigs
•
Strong term contract coverage
Who We Are >> Operational Strength >>
Financial Flexibility Patterson-UTI reported results for the
six months ended June 30, 2012 6
Components of Revenue
Pressure
Pumping
31%
Contract
Drilling
67%
Oil &
Natural
Gas
2% |
 Pressure Pumping
•
Industry expertise needed for
sophisticated customers and
substantial local knowledge
•
High quality fleet of modern
pressure pumping equipment
•
Strong reputation for safe and
efficient operations
Who We Are >> Operational Strength >>
Financial Flexibility Patterson-UTI reported results for the
six months ended June 30, 2012 7
Components of Revenue
Pressure
Pumping
31%
Contract
Drilling
67%
Oil &
Natural
Gas
2% |
 Operational Strength –
Contract Drilling
Contract Drilling |
 9
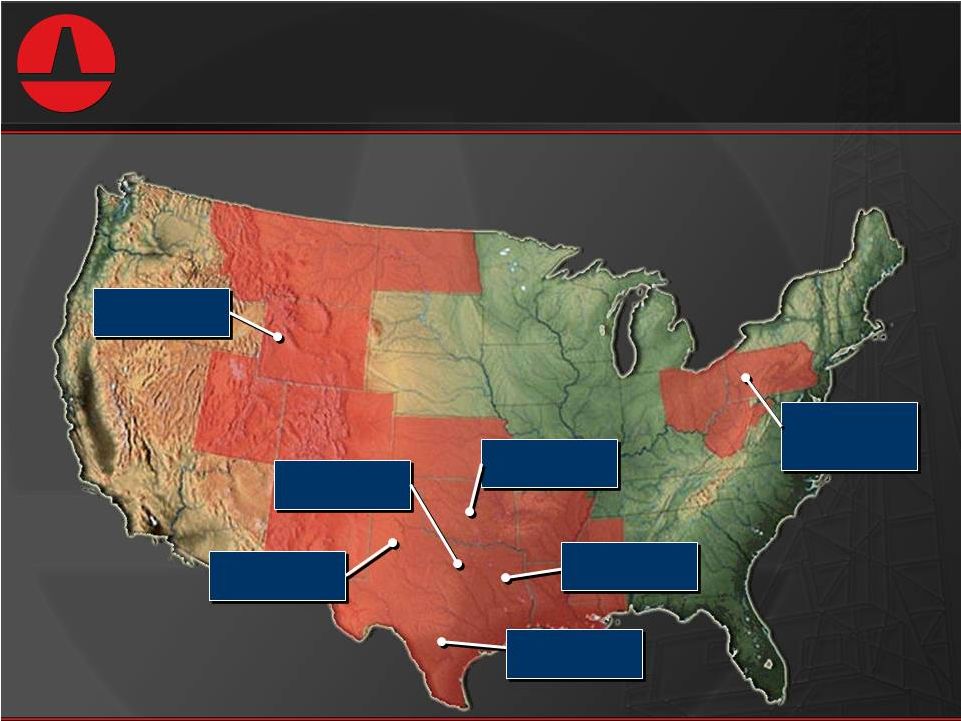
PTEN’s Active U.S. Land Drilling Rigs
as of August 2012
Large Geographic Footprint
Who We Are >> Operational Strength
>> Financial Flexibility Appalachia
& Midwest
Rockies
28 Rigs
23 Rigs
44 Rigs
14 Rigs
11 Rigs
52 Rigs
Mid-Continent
North Texas
East Texas
South Texas
36 Rigs
Permian Basin |
 10
PTEN’s Active Rigs in Unconventional Areas
as of August 2012
18 Rigs
2 Rigs
7 Rigs
9 Rigs
30 Rigs
6 Rigs
6 Rigs
Active in Unconventional Plays
Who We Are >> Operational Strength
>> Financial Flexibility 1 Rig
3 Rigs
Bakken
Pinedale
Piceance
Barnett
Eagle Ford
Niobrara
Woodford
Utica
Haynesville
Marcellus
21 Rigs |
 11
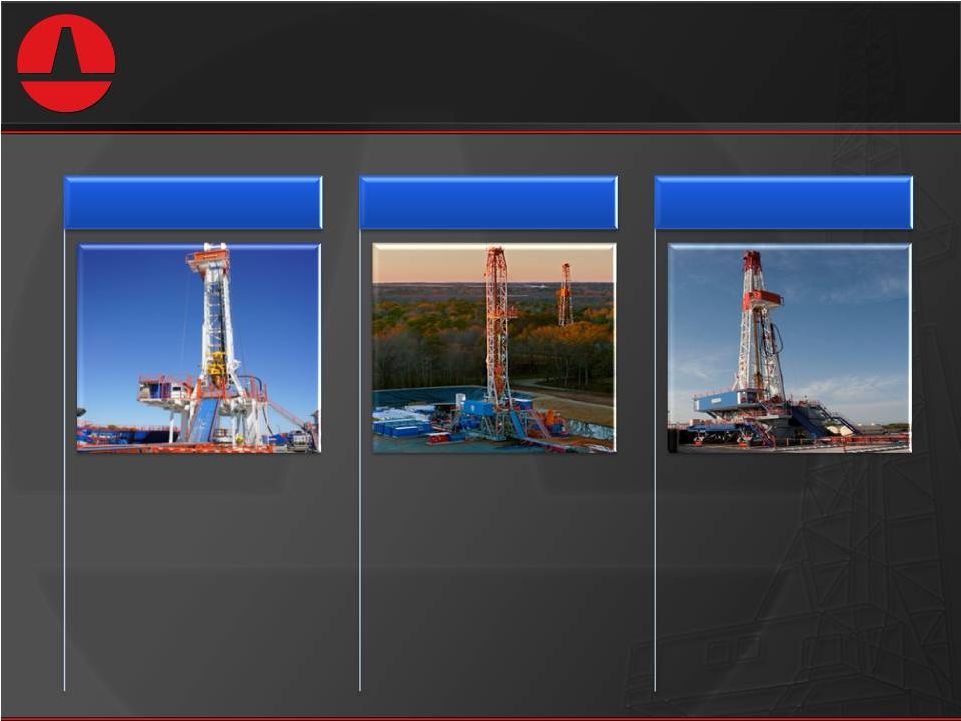
•
1000 HP drawworks
•
Small footprint, big rig
capability
•
Fast move & rig-up
•
Walking system is an
optional feature
APEX 1000™
•
1500 HP drawworks
•
Great all purpose rig
•
Fast move & rig-up
•
Ideal for Eagle Ford,
Barnett, and
Haynesville
APEX 1500™
•
Able to move in all
directions
•
Able to “walk”
with
mast up and drill
pipe/collars in the
derrick
•
A leadership position in
this “fit-for-purpose”
rig
category
APEX Walking™
Innovative Rig Designs
Who We Are >> Operational Strength
>> Financial Flexibility |
 12
New APEX™
Rigs Have Significantly
Increased Fleet Quality.
115
24 new APEX™
24 new APEX™
rigs expected to be added in 2012
rigs expected to be added in 2012
Increasing Fleet Quality
Who We Are >> Operational Strength
>> Financial Flexibility 0
20
40
60
80
100
120
2008
2009
2010
2011
2012E
27 |
 …and Expected as of December 31, 2012
APEX
APEX 1500
TM
APEX
APEX 1000
TM
APEX
APEX Walking
TM
Total New Rigs
Total New Rigs
Other Electric Rigs
Other Electric Rigs
Class
Class
13
Preferred Rigs as of June 30, 2012
Preferred Rigs as of June 30, 2012
54
54
15
15
46
46
115
115
54
54
12/31/2012
12/31/2012
24 new APEX™
24 new APEX™
rigs planned in 2012
rigs planned in 2012
~170 by the end of 2012
~170 by the end of 2012
42
42
13
13
45
45
100
100
54
54
6/30/2012
6/30/2012
PTEN has approximately 150 of these preferred rigs
Who We Are >> Operational Strength
>> Financial Flexibility Increasing Fleet Quality
|
 Who We Are >> Operational Strength
>> Financial Flexibility Preferred rigs account for more
than Preferred rigs account for more than
75% of Contract Drilling EBITDA
75% of Contract Drilling EBITDA
Contribution From High Quality Rigs
PTEN Contract Drilling EBITDA by Rig Class
Six Months Ended June 30, 2012
14 |
 •
•
Mechanical Rigs
Mechanical Rigs
–
–
More than 180 in fleet
More than 180 in fleet
–
–
Upgraded
Upgraded
to
to
meet
meet
customers’
customers’
diverse
diverse
needs
needs
–
–
Ideally suited for certain markets and wells
Ideally suited for certain markets and wells
–
–
Favorable return profiles given low book values
Favorable return profiles given low book values
–
–
Even better returns if drilling activity accelerates
Even better returns if drilling activity accelerates
Who We Are >> Operational Strength
>> Financial Flexibility Mechanical rigs are a low cost
option Mechanical rigs are a low cost option
Mechanical Rigs
15
•
•
roughnecks
roughnecks
and
and
other
other
automation
automation
•
•
mobility
mobility
Iron
Iron
Enhanced
Enhanced
•
•
systems
systems
Improved mud
Improved mud |
 •
•
Based on term contracts in place*
Based on term contracts in place*
–
–
An average of 141 rigs expected under term contract in the
An average of 141 rigs expected under term contract in the
third quarter
third quarter
–
–
An average of 131 rigs expected under term contract during
An average of 131 rigs expected under term contract during
the second half of 2012
the second half of 2012
•
•
PTEN expects to continue signing term contracts
PTEN expects to continue signing term contracts
Who We Are >> Operational Strength
>> Financial Flexibility Term Contract Coverage
Improving earnings visibility and returns stability
Improving earnings visibility and returns stability
* Term contracts in place as of July 26, 2012
16
•
•
Drilling
Drilling
term
term
contract
contract
revenue
revenue
backlog
backlog
of
of
$1.5
$1.5
billion
billion |
 17
PTEN’s U.S. Rig Count Remains Firm
Who We Are >> Operational Strength
>> Financial Flexibility PTEN’s U.S. Rig Count
|
 Operational Strength –
Pressure Pumping
Pressure Pumping |
 19
Recent Investments in Pressure Pumping…
…Have Increased Fleet Size and Quality
Who We Are >> Operational Strength
>> Financial Flexibility Growing Pressure Pumping
Business 65
770
0
200
400
600
800
2006
2007
2008
2009
2010*
2011
2012E
Year End
Fracturing Horsepower
Other Horsepower
* Includes acquisition of approximately 210,000 pressure pumping horsepower
in October 2010 |
 20
Northeast
Region:
Fracturing horsepower: 377,650
Other horsepower: 20,270
Frac Crews under contract : 3
Fracturing horsepower: 290,750
Other horsepower: 61,000
Frac Crews under contract: 2
A Significant Player in Growing Markets
Approximately 155,000 HP under term contract
Who We Are >> Operational Strength >> Financial Flexibility
Pressure Pumping Areas of Operation
Southwest
Region:
43%
57%
Fracturing Horsepower |
 21
PTEN Pressure Pumping Fleet by Age
as of December 2011
Who We Are >> Operational Strength
>> Financial Flexibility Modern Pressure Pumping
Fleet More than two-thirds of fracturing
horsepower is less than five years old
>10
Years
14%
5 -
10
Years
19%
< 5
Years
67% |
 Financial
Flexibility |
 23
Capital Expenditures and Acquisitions
($ in thousands)
Investing in Our Company
Who We Are >> Operational Strength >>
Financial Flexibility |
 24
•
•
History of returning capital to investors
History of returning capital to investors
–
–
Stock Buyback
Stock Buyback
•$70 million during second quarter of 2012
•$70 million during second quarter of 2012
•Increased authorization to $150 million in July 2012
•Increased authorization to $150 million in July 2012
•Total of $671 million repurchased between 2006 and
•Total of $671 million repurchased between 2006 and
2012
2012
–
–
Cash Dividend
Cash Dividend
•Initiated cash dividend in 2004
•Initiated cash dividend in 2004
•Quarterly dividend currently $0.05 per share
•Quarterly dividend currently $0.05 per share
•
•
Returned nearly $1 billion to shareholders since
Returned nearly $1 billion to shareholders since
2005
2005
Who We Are >> Operational Strength >>
Financial Flexibility Strong Financial
Position |
 •
•
Total liquidity of approximately $435 million
Total liquidity of approximately $435 million
–
–
$75 million of cash at June 30, 2012
$75 million of cash at June 30, 2012
–
–
$360 million revolver availability at June 30, 2012
$360 million revolver availability at June 30, 2012
•
•
No principal payments required until 2020
No principal payments required until 2020
–
–
$300 million Series A notes due October 5, 2020
$300 million Series A notes due October 5, 2020
–
–
$300 million Series B notes due June 14, 2022
$300 million Series B notes due June 14, 2022
•
•
$525 million net debt at June 30, 2012
$525 million net debt at June 30, 2012
–
–
16.6% Net Debt/Total Capitalization
16.6% Net Debt/Total Capitalization
•
•
No equity sales in last 12 years
No equity sales in last 12 years
•
•
Reduced
Reduced
share
share
count
count
by
by
5.4
5.4
million
million
shares
shares
over
over
last
last
five years
five years
Who We Are >> Operational Strength >>
Financial Flexibility Strong Financial
Position 25 |
 Strong Financial Returns
Growth in Shareholder Equity
Growth in Shareholder Equity
The Warren Buffett Standard
The Warren Buffett Standard
26 |
 Patterson-UTI Energy, Inc.
Barclays CEO Energy-Power Conference
Barclays CEO Energy-Power Conference
September 4, 2012
September 4, 2012 |
 Non-GAAP Financial Measures
28
Patterson-UTI Energy, Inc.
EBITDA Reconciliation
(dollars in thousands)
2012
2011
2010
2009
2008
Earnings Before Interest, Taxes, Depreciation and Amortization (EBITDA):
Net income (loss)
$ 189,812
$ 322,413
$ 116,942
$ (38,290)
$ 347,069
Income tax expense (benefit)
53,340
187,938
72,856
(17,595)
193,490
Net interest expense (income)
4,872
15,465
11,098
3,767
(923)
Depreciation, depletion, amortization and impairment
128,477
437,279
333,493
289,847
275,990
Cumulative effect of change in accounting principle
-
-
-
-
-
Results of discontinued operations:
Income tax expense (benefit)
-
(209)
(543)
(2,208)
2,389
Net interest expense (income)
-
-
-
-
7
Depreciation
-
-
166
2,287
2,830
Impairment of assets held for sale
-
-
2,155
1,900
-
Impairment of goodwill
-
-
-
-
9,964
EBITDA
$ 279,227
$ 962,886
$ 536,167
$ 239,708
$ 830,816
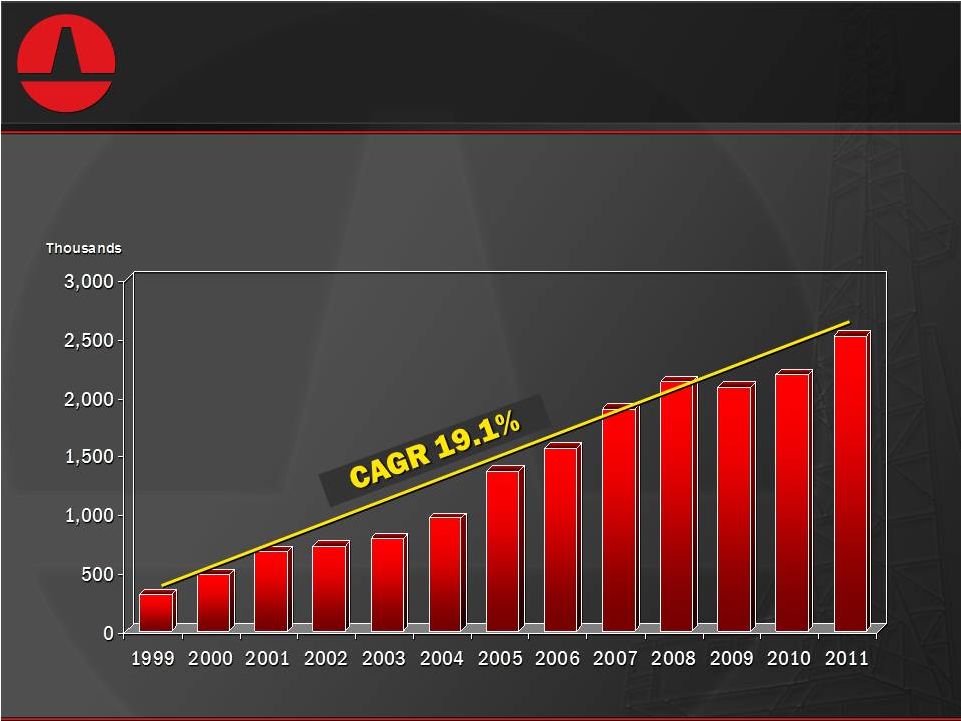
Total Revenue
$ 681,112
$ 2,565,943
$ 1,462,931
$ 781,946
$ 2,063,880
EBITDA Margin (EBITDA/Total Revenue)
41.00%
37.53%
36.65%
30.66%
40.26% |