Attached files
| file | filename |
|---|---|
| 8-K - FORM 8-K - LANTRONIX INC | lantronix_8k-082312.htm |
| EX-99.1 - PRESS RELEASE - LANTRONIX INC | lantronix_8k-ex9901.htm |
Exhibit 99.2

Company Overview August 2012

Page 2 Safe Harbor This presentation contains forward - looking statements, including statements concerning financial results, anticipated market growth, market size, market vision, product features and availability timing, competitive assessments, the Company’s expectations concerning its operating results for fiscal year 2012, future revenues, margins and operating expenses. These forward - looking statements are based on current management expectations and are subject to risks and uncertainties that could cause actual reported results and outcomes to differ materially from those expressed in the forward - looking statements, including but not limited to: quarterly fluctuations in operating results; changing market conditions; government and industry standards; market acceptance of the Company’s products by its customers; pricing trends; actions by competitors; future revenues and margins; changes in the cost or availability of critical components; unusual or unexpected expenses; cash usage; and other factors that may affect financial performance. For a more detailed discussion of these and other risks and uncertainties, see the Company's recent SEC filings, including its Form 10 - Qs filed for the fiscal quarter ended September 30, 2011, December 31, 2011, March 31, 2012 and Form 10 - K filed for the fiscal year ended June 30, 2012 . You are cautioned not to place undue reliance on these forward - looking statements, which speak only as of the date hereof, and the company undertakes no obligation to update these forward - looking statements to reflect subsequent events or circumstances. Lantronix®, Inc. believes that the presentation of non - GAAP financial information provides important supplemental information to management and investors regarding financial and business trends relating to the Company's financial condition and results of operations. The non - GAAP financial measures disclosed by the Company should not be considered a substitute for, or superior to, financial measures calculated in accordance with GAAP, and the financial results calculated in accordance with GAAP and reconciliations to those financial statements should be carefully evaluated. The non - GAAP financial measures used by the Company may be calculated differently from, and therefore may not be comparable to, similarly titled measures used by other companies.
| 2 |

Page 3 Lantronix Overview ( Nasdaq: LTRX ) • Global provider of smart machine - to - machine (“M2M”) connectivity solutions over wired and wireless networks • New product strategy expands addressable market by ~4x • Industry leadership and brand name recognition • B lue chip customers in 5 key verticals including Bosch, Rockwell, HP, Intel, Abbott, Verifone , etc. • N ew , energized team with over 150 years of experience in M2M, communication and electronics • Gross margins returned to our corporate target range of 49% to 51% in FQ4’12; 4 consecutive quarters of improvement • Recently completed secondary offering of ~$9.5MM • U.S. p atents : 18 issued, 4 provisional, and 24 pending Computer World’s Top 100 Innovative M2M Companies M2M Magazine’s Top 100 Most Influential M2M Companies Electronic Product Design Magazine’s “Contribution to Security” Award for WiFi Solutions
| 3 |
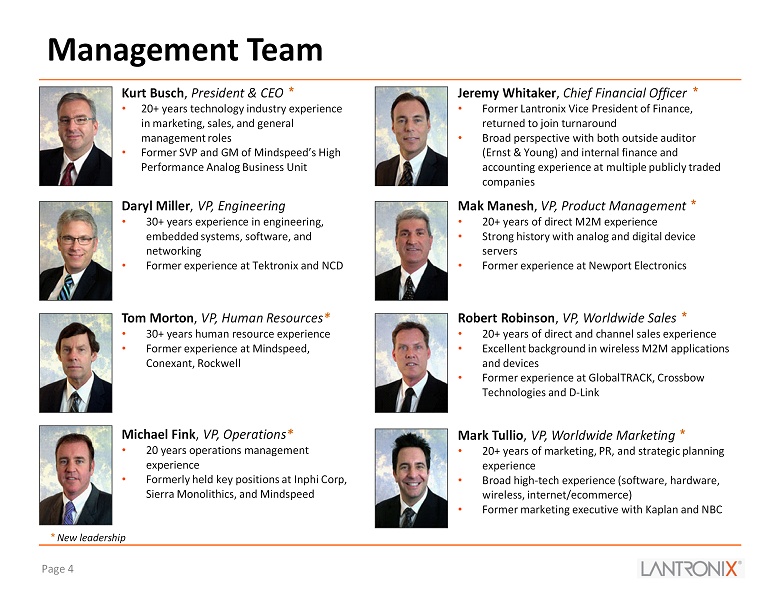
Page 4 Management Team Jeremy Whitaker , Chief Financial Officer * • Former Lantronix Vice President of Finance, returned to join turnaround • Broad perspective with both outside auditor (Ernst & Young) and internal finance and accounting experience at multiple publicly traded companies Tom Morton , VP, Human Resources * • 30+ years human resource experience • Former experience at Mindspeed , Conexant, Rockwell Mak Manesh , VP, Product Management * • 20+ years of direct M2M experience • Strong history with analog and digital device servers • Former experience at Newport Electronics Robert Robinson , VP, Worldwide Sales * • 20+ years of direct and channel sales experience • Excellent background in wireless M2M applications and devices • Former experience at GlobalTRACK , Crossbow Technologies and D - Link Kurt Busch , President & CEO * • 20+ years technology industry experience in marketing, sales, and general management roles • Former SVP and GM of Mindspeed’s High Performance Analog Business Unit Daryl Miller , VP, Engineering • 30+ years experience in engineering, embedded systems, software, and networking • Former experience at Tektronix and NCD * New leadership Michael Fink , VP, Operations * • 20 years operations management experience • Formerly held key positions at Inphi Corp, Sierra Monolithics , and Mindspeed Mark Tullio , VP, Worldwide Marketing * • 20+ years of marketing, PR, and strategic planning experience • Broad high - tech experience (software, hardware, wireless, internet/ecommerce) • Former marketing executive with Kaplan and NBC
| 4 |

Page 5 Lantronix Ecosystem Enabling the smart network and flow of actionable data . . .
| 5 |

Page 6 The World of M2M M2M is using a device sensor or meter t o capture an event temperature, level, status relayed through a network wireless, wired or hybrid t o an application software program that translates the event into capture performance, need to be meaningful information restocked, temp is too high Source: Wikipedia: Machine to Machine
| 6 |

Page 7 M2M Connectivity is Growing Rapidly Commercial and consumer M2M device connections by industry sector, worldwide, 2020 Source : “Imagine an M2M world with 2.1 billion connected things …” Analysys Mason, 2011 M2M device c onnections expected to grow at a CAGR of 36% from 2010 to 2020
| 7 |

Page 8 Current Product Lines: External and Embedded • Simple and cost effective machine to cellular, wired and wireless Ethernet networks FY’12 Revenue: $ 35.8MM • Manage multiple mission critical machines from one location; plug and play print solution for iPad and iPhone FY’12 Revenues: $9.6MM Clean Room Data Center Medical Energy Security Device Enablement Device Management
| 8 |

Page 9 Growth Strategy Capitalize on trends in the M2M connectivity market by leveraging our existing platforms to expand addressable markets and gain share in current segments • Expand addressable market by introducing innovative new products and organizing resources to release on average one new product per quarter • Enable different price points, applications, network connectivity, form factors, and revive and refresh product lines Bring to market o ne n ew p roduct e ach q uarter
| 9 |

Page 10 Production Shipments Product Name Description Q3 CY12 xPrintServer ™ – Home Edition iPad /iPhone printing to network and USB printers xSenso ™ Network enable analog sensors Q2 CY12 xPico ™ World’s smallest embedded device server to network enable machines PremierWave ® XC Cellular connectivity for machines Q1 CY12 xPrintServer ™ – Network Edition iPad /iPhone printing to network printers PremierWave - XN™ Industrial wireless for machines Q4 CY 11 EDS - MD™ Next generation medical device aggregator New Product Releases – 7 Launched in 8 Months
| 10 |

Page 11 New Product Family: x PrintServer ™ First new p roduct i nitiated by new management team xPrintServer ™ – Network and Home Editions • CONNECT: – Designed specifically for networked and/or USB printers – Print wirelessly from any iPad ®, iPhone® or iPod® to virtually any networked and/or USB printer • SMART: – Seamless integration: plug and print! – Use native Apple iOS ® commands – no additional programming or apps required – Patent pending, first of its kind – Cost effective • DO MORE: – Increase usability of iOS devices
| 11 |

Page 12 x PrintServer : Product Reviews “It’s truly plug - and - play. And it just works!” “The xPrintServer make me giddy with glee!” “xPrintServer overcomes Apple’s printing gap, with amazing simplicity.” “You’re going to love this product!” “Set - up is drop - dead simple!” “xPrintServer is fantastic for novices, yet will keep any network administrator happy .” “5 out of 5 Gears rating!” “This has to be one of the simplest, cleanest, and most painless products to use that I’ve seen in a long time. ” Macworld 2012 “Best - in - Show” xPrintServer CES 2012 “Top 25 Must See Products” xPrintServer Engadget 2011 “Peripheral of the Year” xPrintServer
| 12 |

Page 13 Accelerate Growth: Expanding Lantronix Addressable Market New p roduct s trategy expands e stimated addressable market by over 4x Source: Primarily based upon internal estimates using source data from IDC & Harbor Research $ - $500 $1,000 $1,500 $2,000 $2,500 $3,000 2011 2012 2013 2014 2015 2016 New - xPrintServer New - Cellular and Analog Device Enablement Current - Device Management Current - Device Enablement $MM
| 13 |

Page 14 World Class Global Customer Base Security Industrial Automation IT / Data Center Medical Energy Over 3 million devices connected
| 14 |

Page 15 Global Sales & Distribution Network Lantronix Offices (California HQ, Netherlands, Hong Kong, and Japan) Major Distributors (Ingram Micro, Arrow, CDW, Tech Data, Symmetry, Mouser, Sphinx, ACAL, Atlantik , Nissin and others) Lantronix Regional Sales Offices (San Francisco, Chicago, Boston, New York) Extensive network of value added resellers, resellers and e - tailers worldwide Online Sales Channel (Amazon, New Egg, MacMall , PCMall , Provantage , Buy.com, Lantronix eCommerce Store and others) @
| 15 |

Page 16 Progress During the Past Year x New CEO, CFO and recruited and retained experienced management team x Implemented strategy to expand both existing market share and new market segments x Revitalized focus on expanding IP portfolio x Reduced operating expenses, lowered breakeven point x Non - GAAP profitability for two quarters in a row x Capital raise strengthened cash position x Improved balance sheet x EDS - MD™: next generation medical aggregator x xPrintServer ™ Network Edition: plug and play printing for iOS devices x PremierWave - XN™: high performance WiFi device server x xPico™: the world’s smallest embedded device server x xPrintServer ™ Home Edition : plug and play printing for iOS devices x PremierWave - XC™ : high performance cellular device server x xSenso ™: network enable analog sensors Recruited Experienced Management Team Deployed New Growth Strategy Launched Seven New Products Improved Financial Discipline
| 16 |

Tuesday, August 28, 2012 | Page 17 | Confidential. © 2010 Lantroni x . FINANCIAL INFORMATION
| 17 |
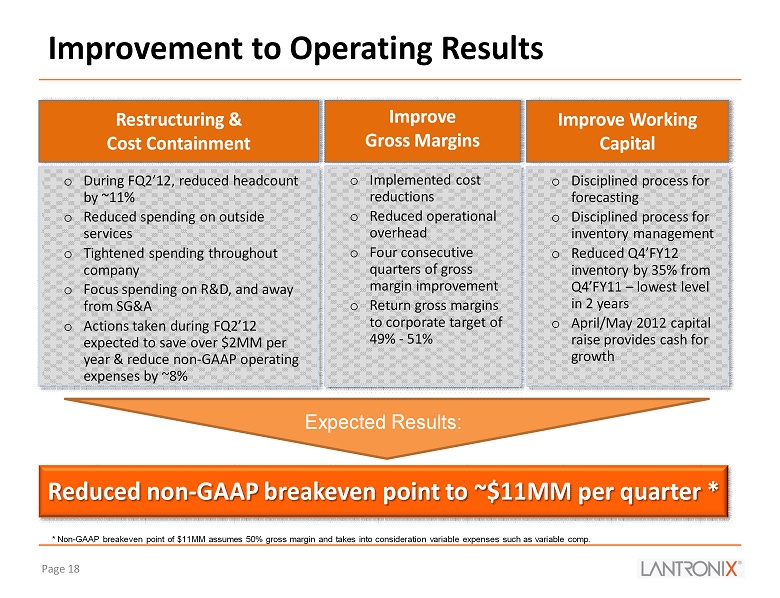
Page 18 Improvement to Operating Results Restructuring & Cost Containment o During FQ2’12, reduced headcount by ~11% o Reduced spending on outside services o Tightened spending throughout company o Focus spending on R&D, and away from SG&A o Actions taken during FQ2’12 expected to save over $2MM per year & reduce non - GAAP operating expenses by ~8% Improve Gross Margins Improve Working Capital o Implemented cost reductions o Reduced operational overhead o Four consecutive quarters of gross margin improvement o Return gross margins to corporate target of 49% - 51% o Disciplined process for forecasting o Disciplined process for inventory management o Reduced Q4’FY12 inventory by 35% from Q4’FY11 – lowest level in 2 years o April/May 2012 capital raise provides cash for growth Reduced non - GAAP breakeven point to ~$11MM per quarter * Expected Results: * Non - GAAP breakeven point of $11MM assumes 50% gross margin and takes into consideration variable expenses such as variable com p.
| 18 |
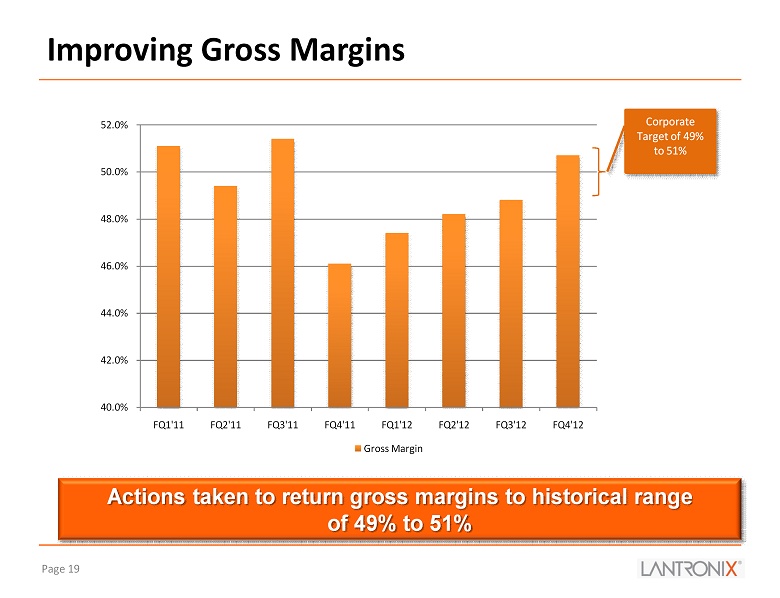
Page 19 Improving Gross Margins Actions taken to return gross margins to historical range of 49% to 51% 40.0% 42.0% 44.0% 46.0% 48.0% 50.0% 52.0% FQ1'11 FQ2'11 FQ3'11 FQ4'11 FQ1'12 FQ2'12 FQ3'12 FQ4'12 Gross Margin Corporate Target of 49% to 51%
| 19 |

Page 20 Target Model Highly leveraged operating model provides for accelerated income growth FQ1’12 FQ2’12 FQ3’12 FQ4’12 Target Model (1 - 2 year) Target Model (3 year) Gross Margin % 47.4% 48.2% 48.8% 50.7% 49% - 51% 49% - 51% GAAP Operating Income (Loss) % (12%) (13%) 0% (1%) 0% - 3% 5% - 7% Non - GAAP Operating Income (Loss)/ Non - GAAP Net Income (Loss) % (6%) (6%) 4% 3% 3% - 6% 8% - 10% * Target Model assumes total revenue growth rate from low to mid teens. Note: Please see Appendix A to this presentation for a reconciliation of non - GAAP measures. Non - GAAP operating income (loss) exc ludes share - based compensation, amortization & depreciation.
| 20 |

Page 21 Selected Condensed Balance Sheet Information ( i ) LTRX sold 3.9MM common shares during Q4 FY’12 generating approximately $9.5MM in net cash proceeds. Fiscal Year Ends on June 30th (In millions, except price per share data) Q4FY11 Q1FY12 Q2FY12 Q3FY12 Q4FY12 Cash and Cash Equivalents 5.8$ 4.0$ 3.3$ 1.8$ 11.4$ (i) Accounts Receivable, Net 2.9 2.1 1.4 2.7 2.7 Inventories, Net 9.2 9.3 8.5 6.8 6.0 Prepaid Expenses, Other A/R and Deferred Tax Assets 1.8 1.4 1.3 1.8 1.7 Total Current Assets 19.7 16.8 14.5 13.1 21.8 Total Non-Current Assets 11.5 11.4 11.2 11.2 11.2 Total Assets 31.2$ 28.2$ 25.7$ 24.3$ 33.0$ Accounts Payable 8.4$ 6.9$ 4.8$ 4.4$ 3.6$ Other Accrued Liabilities and Payroll 5.4 5.5 6.6 5.6 5.6 Short-term Debt 0.7 0.7 0.7 0.7 0.7 Total Current Liabilities 14.5 13.1 12.1 10.7 9.9 Total Non-Current Liabilities 2.0 1.7 1.4 1.2 1.2 Total Liabilities 16.5 14.8 13.5 11.9 11.1 Total Stockholders' Equity 14.7 13.4 12.2 12.4 21.9 Total Liabilities and Stockholders' Equity 31.2$ 28.2$ 25.7$ 24.3$ 33.0$ Common Shares Outstanding 10.55 10.58 10.58 10.59 14.55 (i) Stock Options Outstanding 1.82 2.35 2.31 2.19 2.14 Weighted Average Exercise Price Per Share 4.50$ 3.80$ 3.35$ 3.22$ 3.20$
| 21 |

Page 22 Selected Income Statement Information Fiscal Year Ends on June 30th (In millions) FY'11 Q1FY12 Q2FY12 Q3FY12 Q4FY12 FY'12 Net Revenue $49.3 $11.2 $10.5 $12.1 $11.6 $45.4 Y/Y Change 6% (8%) (18%) (2%) (4%) (8%) Gross Profit $24.4 $5.3 $5.0 $5.9 $5.9 $22.1 % of Net Revenue 49.5% 47.4% 48.2% 48.8% 50.7% 48.8% GAAP Operating Expenses $29.5 $6.7 $6.4 $5.9 $6.0 $24.9 % of Net Revenue 60% 60% 61% 49% 52% 55% Non-GAAP Operating Expenses $23.6 $6.1 $5.8 $5.6 $5.7 $23.1 % of Net Revenue 48% 55% 55% 46% 49% 51% GAAP Operating Income (Loss) ($5.1) ($1.4) ($1.3) $0.0 ($0.1) ($2.8) % of Net Revenue (10%) (12%) (13%) 0% (1%) (6%) Non-GAAP Operating Income (Loss)/ Non-GAAP Net Income (Loss) $1.3 ($0.7) ($0.6) $0.5 $0.4 ($0.5) % of Net Revenue 3% (6%) (6%) 4% 3% (1%) Note: Please see Appendix A to this presentation for a reconciliation of non - GAAP measures. Non - GAAP operating income (loss) exc ludes share - based compensation, amortization & depreciation.
| 22 |
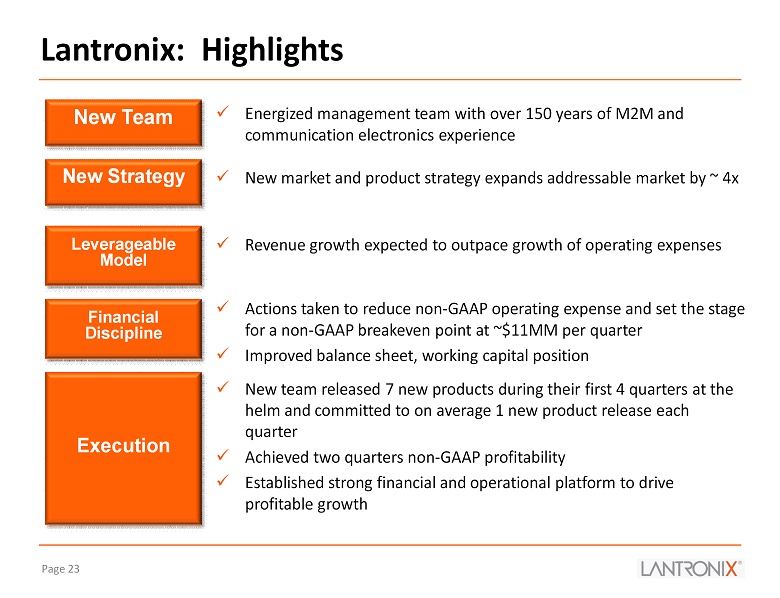
Page 23 x Energized management team with over 150 years of M2M and communication electronics experience x New market and product strategy expands addressable market by ~ 4x x Revenue growth expected to outpace growth of operating expenses x Actions taken to reduce non - GAAP operating expense and set the stage for a non - GAAP breakeven point at ~$11MM per quarter x Improved balance sheet, working capital position x New team released 7 new products during their first 4 quarters at the helm and committed to on average 1 new product release each quarter x Achieved two quarters non - GAAP profitability x Established strong financial and operational platform to drive profitable growth Lantronix: Highlights New Team New Strategy Execution Leverageable Model Financial Discipline
| 23 |

Page 24 THANK YOU
| 24 |
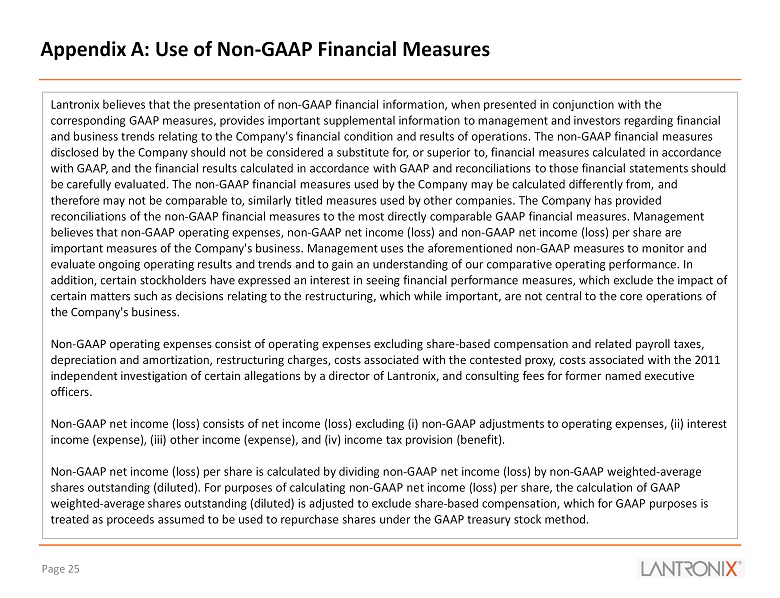
Page 25 Appendix A: Use of Non - GAAP Financial Measures Lantronix believes that the presentation of non - GAAP financial information, when presented in conjunction with the corresponding GAAP measures, provides important supplemental information to management and investors regarding financial and business trends relating to the Company's financial condition and results of operations. The non - GAAP financial measures disclosed by the Company should not be considered a substitute for, or superior to, financial measures calculated in accordan ce with GAAP, and the financial results calculated in accordance with GAAP and reconciliations to those financial statements sho uld be carefully evaluated. The non - GAAP financial measures used by the Company may be calculated differently from, and therefore may not be comparable to, similarly titled measures used by other companies. The Company has provided reconciliations of the non - GAAP financial measures to the most directly comparable GAAP financial measures. Management believes that non - GAAP operating expenses, non - GAAP net income (loss) and non - GAAP net income (loss) per share are important measures of the Company's business. Management uses the aforementioned non - GAAP measures to monitor and evaluate ongoing operating results and trends and to gain an understanding of our comparative operating performance. In addition, certain stockholders have expressed an interest in seeing financial performance measures, which exclude the impact of certain matters such as decisions relating to the restructuring, which while important, are not central to the core operation s o f the Company's business. Non - GAAP operating expenses consist of operating expenses excluding share - based compensation and related payroll taxes, depreciation and amortization, restructuring charges, costs associated with the contested proxy, costs associated with the 20 11 independent investigation of certain allegations by a director of Lantronix, and consulting fees for former named executive officers. Non - GAAP net income (loss) consists of net income (loss) excluding ( i ) non - GAAP adjustments to operating expenses, (ii) interest income (expense), (iii) other income (expense), and (iv) income tax provision (benefit). Non - GAAP net income (loss) per share is calculated by dividing non - GAAP net income (loss) by non - GAAP weighted - average shares outstanding (diluted). For purposes of calculating non - GAAP net income (loss) per share, the calculation of GAAP weighted - average shares outstanding (diluted) is adjusted to exclude share - based compensation, which for GAAP purposes is treated as proceeds assumed to be used to repurchase shares under the GAAP treasury stock method.
| 25 |
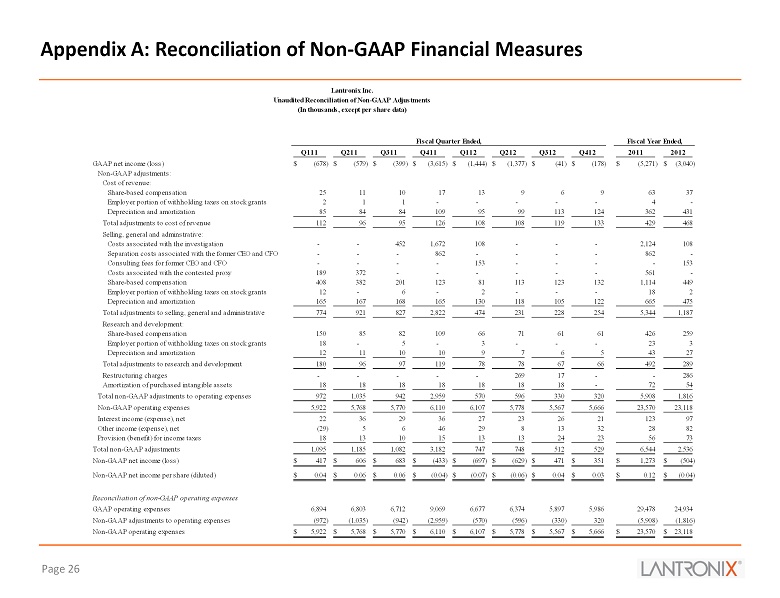
Page 26 Appendix A: Reconciliation of Non - GAAP Financial Measures Q111 Q211 Q311 Q411 Q112 Q212 Q312 Q412 2011 2012 GAAP net income (loss) (678)$ (579)$ (399)$ (3,615)$ (1,444)$ (1,377)$ (41)$ (178)$ (5,271)$ (3,040)$ Non-GAAP adjustments: Cost of revenue: Share-based compensation 25 11 10 17 13 9 6 9 63 37 Employer portion of withholding taxes on stock grants 2 1 1 - - - - - 4 - Depreciation and amortization 85 84 84 109 95 99 113 124 362 431 Total adjustments to cost of revenue 112 96 95 126 108 108 119 133 429 468 Selling, general and adminstrative: Costs associated with the investigation - - 452 1,672 108 - - - 2,124 108 Separation costs associated with the former CEO and CFO - - - 862 - - - - 862 - Consulting fees for former CEO and CFO - - - - 153 - - - - 153 Costs associated with the contested proxy 189 372 - - - - - - 561 - Share-based compensation 408 382 201 123 81 113 123 132 1,114 449 Employer portion of withholding taxes on stock grants 12 - 6 - 2 - - - 18 2 Depreciation and amortization 165 167 168 165 130 118 105 122 665 475 Total adjustments to selling, general and administrative 774 921 827 2,822 474 231 228 254 5,344 1,187 Research and development: Share-based compensation 150 85 82 109 66 71 61 61 426 259 Employer portion of withholding taxes on stock grants 18 - 5 - 3 - - - 23 3 Depreciation and amortization 12 11 10 10 9 7 6 5 43 27 Total adjustments to research and development 180 96 97 119 78 78 67 66 492 289 Restructuring charges - - - - - 269 17 - - 286 Amortization of purchased intangible assets 18 18 18 18 18 18 18 - 72 54 Total non-GAAP adjustments to operating expenses 972 1,035 942 2,959 570 596 330 320 5,908 1,816 Non-GAAP operating expenses 5,922 5,768 5,770 6,110 6,107 5,778 5,567 5,666 23,570 23,118 Interest income (expense), net 22 36 29 36 27 23 26 21 123 97 Other income (expense), net (29) 5 6 46 29 8 13 32 28 82 Provision (benefit) for income taxes 18 13 10 15 13 13 24 23 56 73 Total non-GAAP adjustments 1,095 1,185 1,082 3,182 747 748 512 529 6,544 2,536 Non-GAAP net income (loss) 417$ 606$ 683$ (433)$ (697)$ (629)$ 471$ 351$ 1,273$ (504)$ Non-GAAP net income per share (diluted) 0.04$ 0.06$ 0.06$ (0.04)$ (0.07)$ (0.06)$ 0.04$ 0.03$ 0.12$ (0.04)$ Reconciliation of non-GAAP operating expenses GAAP operating expenses 6,894 6,803 6,712 9,069 6,677 6,374 5,897 5,986 29,478 24,934 Non-GAAP adjustments to operating expenses (972) (1,035) (942) (2,959) (570) (596) (330) 320 (5,908) (1,816) Non-GAAP operating expenses 5,922$ 5,768$ 5,770$ 6,110$ 6,107$ 5,778$ 5,567$ 5,666$ 23,570$ 23,118$ Lantronix Inc. Unaudited Reconciliation of Non-GAAP Adjustments (In thousands, except per share data) Fiscal Quarter Ended, Fiscal Year Ended,