Attached files
| file | filename |
|---|---|
| EX-99.1 - EXHIBIT 99.1 - DYCOM INDUSTRIES INC | exhibit991.htm |
| 8-K - FORM 8-K - DYCOM INDUSTRIES INC | form8k.htm |
Exhibit 99.2

Fiscal 2012
4th Quarter Presentation
August 29, 2012

1
Participants
|
Steven E. Nielsen
President & Chief Executive Officer Timothy R. Estes
Chief Operating Officer
H. Andrew DeFerrari
Chief Financial Officer Richard B. Vilsoet
General Counsel |

2
Forward-Looking Statements and
Non-GAAP Information
Non-GAAP Information
Forward-Looking Statements and
Non-GAAP Information
Non-GAAP Information
Fiscal 2012 fourth quarter results are unaudited. This presentation contains “forward-looking statements” which
are statements relating to future events, future financial performance, strategies, expectations, and competitive
environment. All statements, other than statements of historical facts, contained in this presentation, including
statements regarding our future financial position, future revenue, prospects, plans and objectives of
management, are forward-looking statements. Words such as “believe,” “expect,” “anticipate,” “estimate,”
“intend,” “forecast,” “may,” “should,” “could,” “project,” “looking ahead” and similar expressions, as well as
statements in future tense, identify forward-looking statements. You should not read forward looking statements
as a guarantee of future performance or results. They will not necessarily be accurate indications of whether or
at what time such performance or results will be achieved. Forward-looking statements are based on
information available at the time those statements are made and/or management’s good faith belief at that time
with respect to future events. Such statements are subject to risks and uncertainties that could cause actual
performance or results to differ materially from those expressed in or suggested by the forward-looking
statements. Important factors that could cause such differences include, but are not limited to factors described
under Item 1A, “Risk Factors” of the Company’s Annual Report on Form 10-K for the year ended July 30, 2011,
and other risks outlined in the Company’s periodic filings with the Securities and Exchange Commission
(“SEC”). The forward-looking statements in this presentation are expressly qualified in their entirety by this
cautionary statement. Except as required by law, the Company may not update forward-looking statements
even though its situation may change in the future.
This presentation includes certain “Non-GAAP” financial measures as defined by SEC rules. We believe that the
presentation of certain Non-GAAP financial measures provides information that is useful to investors because it
allows for a more direct comparison of our performance for the period with our performance in the comparable
prior-year periods. As required by the SEC, we have provided a reconciliation of those measures to the most
directly comparable GAAP measures on the Regulation G slides included as slides 11 through 14 of this
presentation. We caution that Non-GAAP financial measures should be considered in addition to, but not as a
substitute for, our reported GAAP results.

3
Q4-2012 Overview
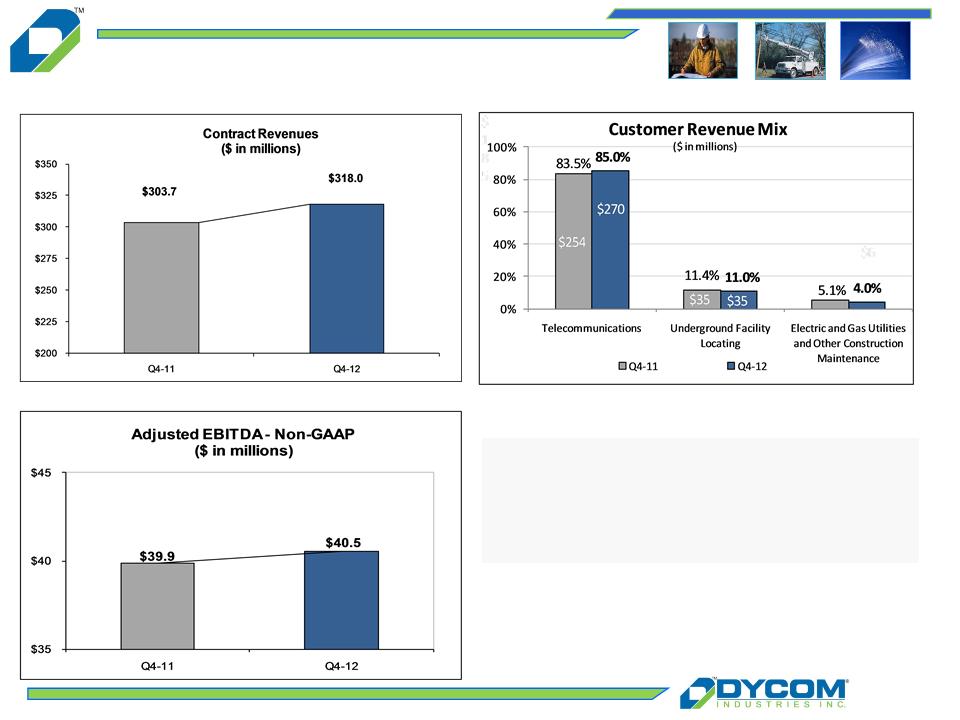
n Contract revenue of $318.0 million as compared to $303.7 million in the prior
year quarter
year quarter
n Contract revenue grew organically 9.0%, excluding storm restoration services
of $2.3 million from the current quarter and $14.1 million from Q4-11
of $2.3 million from the current quarter and $14.1 million from Q4-11
n Adjusted EBITDA of $40.5 million at 12.7% of revenue in Q4-12
n Net income of $0.39 per share diluted compared to $0.38 per share diluted in
Q4-11
Q4-11
n Repurchased 102,200 common shares at an average price of $19.75 per
share
share
See “Regulation G Disclosure” slides 11-14 for a reconciliation of GAAP to Non-GAAP financial measures.
4
Note: See “Regulation G Disclosure” slides 11 -14 for reconciliation of GAAP to Non-GAAP financial measures.
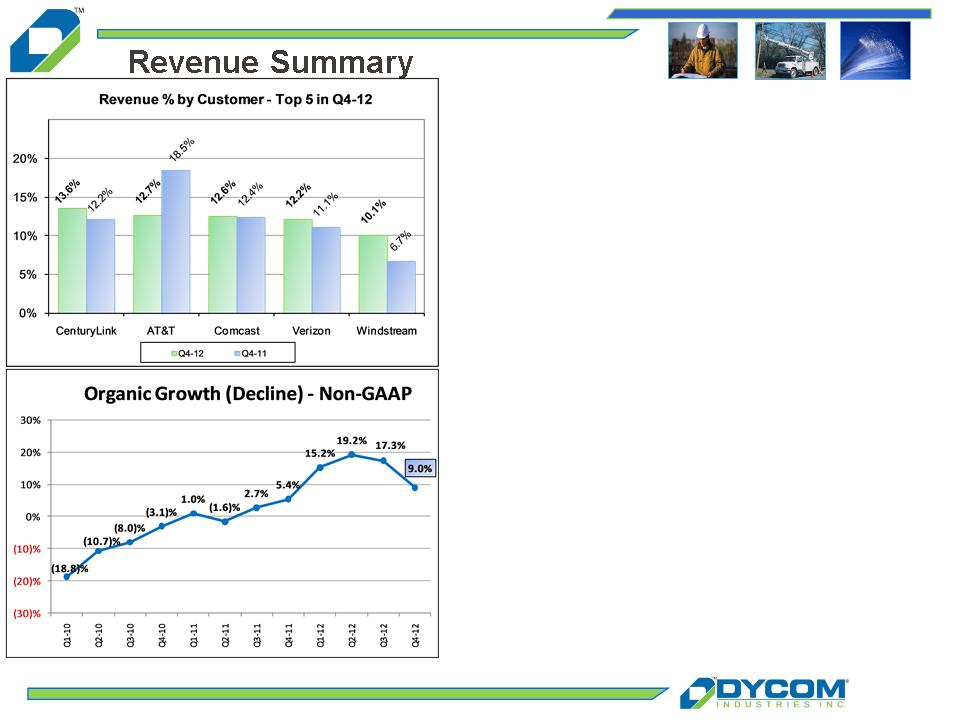
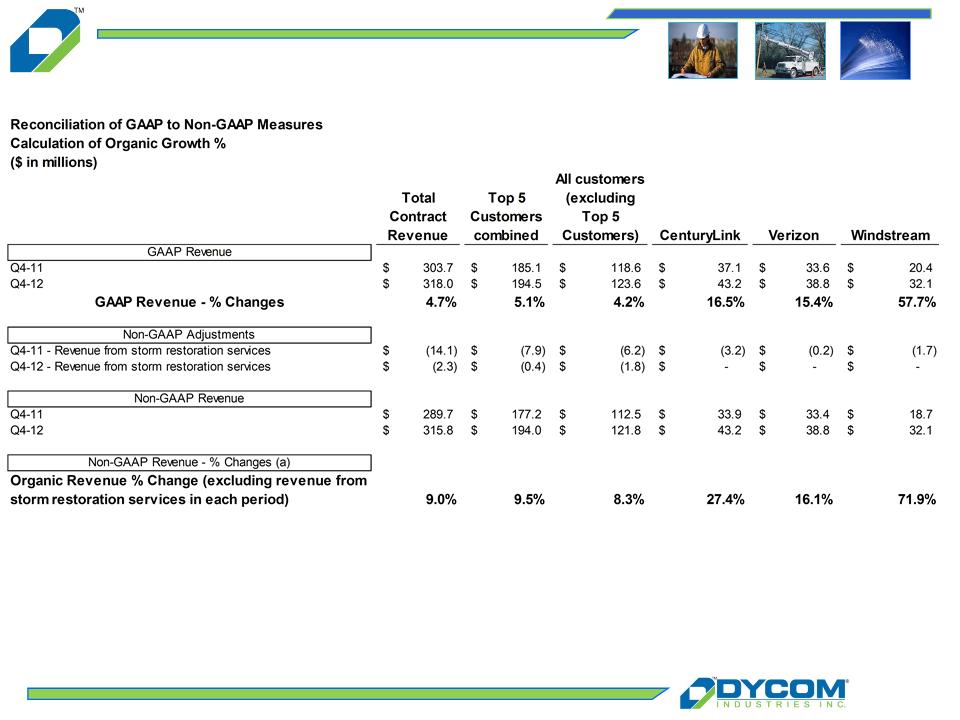
n Top 5 customers represented 61.1% of revenue in
Q4-12 and Q4-11
Q4-12 and Q4-11
Ø CenturyLink, Dycom’s largest customer, grew
organically 27.4% year over year
organically 27.4% year over year
Ø Verizon, Dycom’s fourth largest customer, grew in
excess of 16% organically year over year
excess of 16% organically year over year
Ø Windstream, Dycom’s fifth largest customer,
exceeded 71% organic growth year over year
exceeded 71% organic growth year over year
n Organic revenue growth of 9.0%, excluding revenue from
storm restoration services in each period
storm restoration services in each period
Ø Revenue from Top 5 customers up 9.5%
organically
organically
Ø Combined revenue from other customers up 8.3%
organically
organically
5
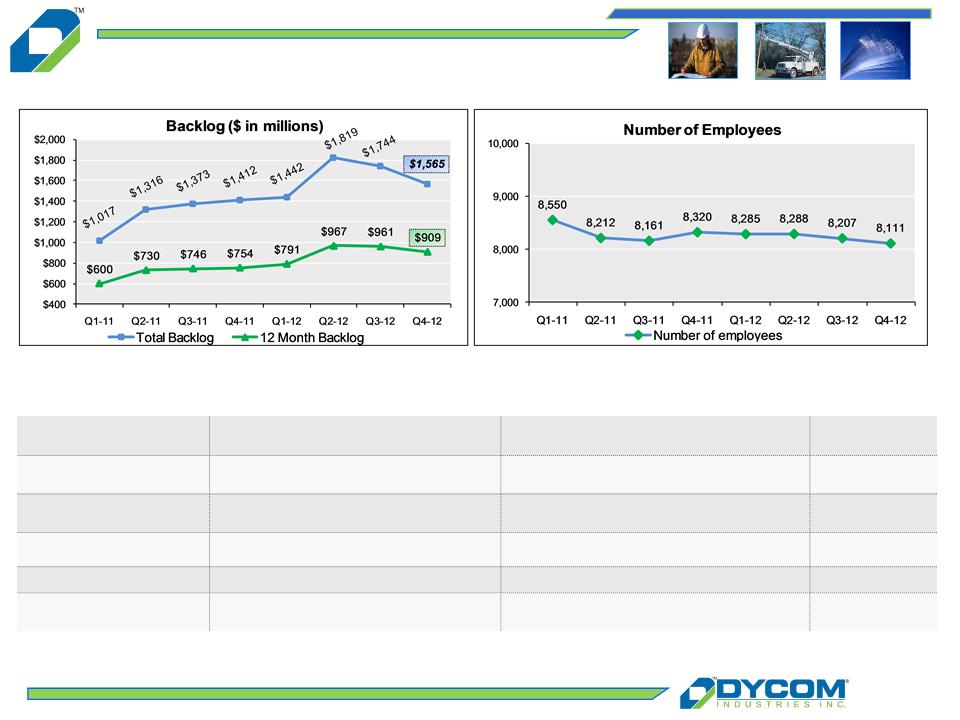
Backlog and Awards
Current Awards and Extensions
|
Customers
|
Description
|
Area
|
Approximate Term
(in years) |
|
nCharter Communications
|
Construction and Maintenance Services
|
Illinois, Missouri, Tennessee, Alabama,
Massachusetts |
1
|
|
nComcast
|
Construction and Maintenance Services
& Cable Installation Services |
Illinois
|
3
|
|
nVerizon
|
Facility Locating Services
|
California
|
3
|
|
nCrown Castle
|
Network Construction Project
|
Florida
|
1
|
|
nVarious
|
Rural broadband
|
Oregon, New Mexico, Kentucky, West
Virginia, Vermont, Virginia, South Carolina |
1
|
6
Summary Results
|
($ in millions,
except per share data)
|
Q4-11
|
Q4-12
|
|
Net Income
|
$ 13.0
|
$ 13.3
|
|
Fully Diluted EPS
|
$0.38
|
$0.39
|
Organic revenue growth of 9.0%, after adjusting for storm work
in each period
in each period
Adjusted EBITDA grows to $40.5 million from increased operations
EPS of $0.39 per common share diluted as compared to $0.38 in
the prior year quarter
the prior year quarter
Revenue from Telecommunications customers 85.0% of total
Note: The organic revenue percentage of 9.0% excludes storm restoration
services of $2.3 million and $14.1 million in Q4-12 and Q4-11, respectively.
See “Regulation G Disclosure” slides 11-14 for a reconciliation of GAAP to
Non GAAP financial measures.
services of $2.3 million and $14.1 million in Q4-12 and Q4-11, respectively.
See “Regulation G Disclosure” slides 11-14 for a reconciliation of GAAP to
Non GAAP financial measures.

7
Selected Information
(a) Amounts may not foot due to rounding.
(b) Percentages disclosed under the financial amounts for Q4-12 and Q4-11 represent the percentage of contract revenues for the applicable
period.
period.
|
|
|
Q4-12
|
Q4-11
|
Change (a)
|
|||
|
($ in millions)(b)
|
|||||||
|
Contract Revenues
|
$
|
318.0
|
$
|
303.7
|
$
|
14.3
|
|
|
Cost of Earned
Revenues |
$
|
252.1
79.3%
|
$
|
239.1
78.7%
|
$
|
13.0
|
|
|
General & Administrative
|
$
|
27.4
8.6%
|
$
|
26.3
8.7%
|
$
|
1.2
|
|
|
Depreciation &
Amortization |
$
|
15.6
4.9%
|
$
|
15.6
5.1%
|
$
|
-
|
|
|
Interest Expense, net
|
$
|
4.2
1.3%
|
$
|
4.1
1.3%
|
$
|
0.1
|
|
|
Other Income, net
|
$
|
2.9
0.9%
|
$
|
3.6
1.2%
|
$
|
(0.8)
|
|
|
Net Income
|
$
|
13.3
4.2%
|
$
|
13.0
4.3%
|
$
|
0.3
|
|
|
Adjusted EBITDA - Non-
GAAP |
$
|
40.5
12.7%
|
$
|
39.9
13.1%
|
$
|
0.7
|
|
Organic Revenue growth of 9.0%,
excluding revenues from storm restoration services
in each period
excluding revenues from storm restoration services
in each period
nGrowth within existing contracts
nRural broadband projects
Adjusted EBITDA of $40.5 million
nGrowth in operations
nMaintained cost discipline
Note: See “Regulation G Disclosure” slides 11-14 for a reconciliation of GAAP to Non-GAAP financial measures.

8
Cash Flow and Liquidity
Operating cash flows and targeted
capital spending support growth
capital spending support growth
nCash flow supported growth in operations
during the quarter
during the quarter
nCapital expenditures, net of disposals, of
$10.6 million
$10.6 million
Balance Sheet Strength
nAmple liquidity from cash on hand of $52.6
million and $186.5 million of availability under
Senior Credit Agreement
million and $186.5 million of availability under
Senior Credit Agreement
nRepurchased 102,200 shares of common
stock at an average price of $19.75 per share
stock at an average price of $19.75 per share

9
Summary
n Firm end market opportunities
} Industry participants aggressively extending or deploying
fiber networks to provide wireless backhaul services
fiber networks to provide wireless backhaul services
} Broadband stimulus funding meaningfully increasing network
construction for rural service providers
construction for rural service providers
} Cable operators continuing to deploy fiber to small and
medium businesses
medium businesses
} Wireless carriers upgrading from 3G to 4G technologies
} Telephone companies deploying FTTX to enable video
offerings
offerings
n Increased market share as our customers consolidate vendor
relationships and reward scale
relationships and reward scale

10
Looking Ahead
n Revenues which are slightly down to approximately flat year over year, excluding storm
restoration services
restoration services
n Margins which increase slightly year over year
n General and administrative expenses which increase modestly on an annual basis, including
approximately $2.0 million of incremental stock-based compensation expense
approximately $2.0 million of incremental stock-based compensation expense
n Other income that decreases approximately 25% compared to fiscal 2012
n Strong cash flows dedicated, as projected returns direct, to accretive acquisition opportunities
and share repurchases
and share repurchases
n Confident that solid operations will continue for a sustained period
Q1 - 2013:
n Revenues which range from slightly down to flat year over year, after excluding approximately
$3.7 million from Q1-12 of storm restoration revenues
$3.7 million from Q1-12 of storm restoration revenues
n Gross margins which are sequentially in-line as a percentage of revenue
n General and administrative expenses which increase slightly on a sequential basis reflecting
higher stock-based compensation expense
higher stock-based compensation expense
n Depreciation and amortization which is flat on a sequential basis
n Other income which decreases sequentially by approximately $1.0 million from Q4-12
11
Appendix: Regulation G Disclosure
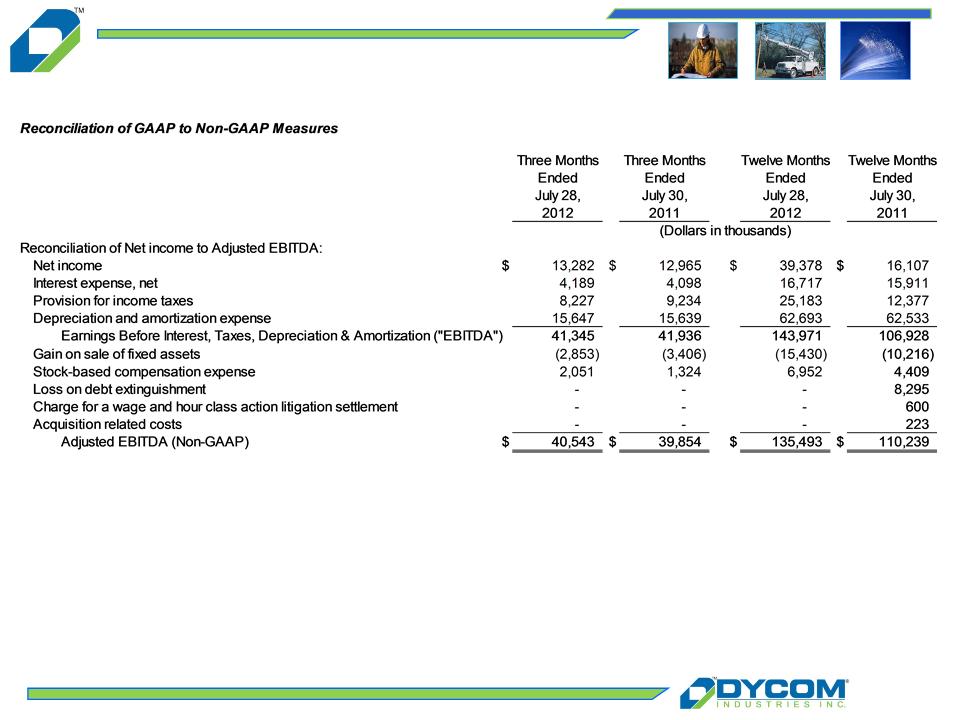
The above table presents the Non-GAAP financial measure of Adjusted EBITDA for the three and twelve months ended July 28, 2012 and July 30,
2011 and a reconciliation of Adjusted EBITDA to the most directly comparable GAAP measure. Adjusted EBITDA is a Non-GAAP financial measure
within the meaning of Regulation G promulgated by the Securities and Exchange Commission. The Company defines Adjusted EBITDA as earnings
before interest, taxes, depreciation and amortization, gain on sale of fixed assets, stock-based compensation expense, loss on debt extinguishment,
charges for a wage and hour class action settlement, and acquisition-related costs. The Company believes this Non-GAAP financial measure
provides information that is useful to the Company’s investors. The Company believes that this information is helpful in understanding period-over-
period operating results separate and apart from items that may, or could, have a disproportionate positive or negative impact on the Company’s
results of operations in any particular period. Additionally, the Company uses this Non-GAAP financial measure to evaluate its past performance and
prospects for future performance. Adjusted EBITDA is not a recognized term under GAAP and does not purport to be an alternative to net income,
operating cash flows, or a measure of earnings. Because all companies do not use identical calculations, this presentation of Non-GAAP financial
measures may not be comparable to other similarly titled measures of other companies.
12
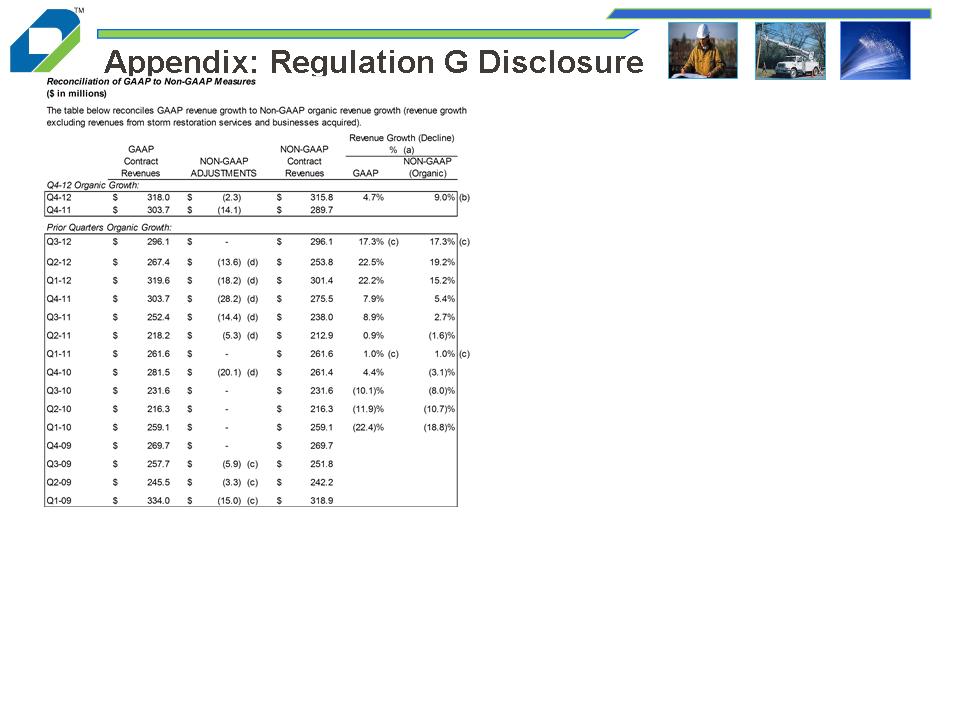
(a) Year-over-year growth (decline) percentage is calculated as follows: (i) revenues in the quarterly period less (ii) revenues in the comparative prior year quarter
period; divided by (ii) revenues in the comparative prior year quarter period.
period; divided by (ii) revenues in the comparative prior year quarter period.
(b) Q4-12 organic growth excludes storm restoration revenues of $2.3 million in Q4-12 and $14.1 million in Q4-11.
(c) For Q3-12, GAAP and Non-GAAP revenue growth percentages are the same as revenues from business acquired in 2011 were included for the full quarter in each
period and there were no other Non-GAAP adjustments in either period. For Q1-11, GAAP and Non-GAAP revenue growth percentages are the same as there were no
Non-GAAP adjustments in either period.
period and there were no other Non-GAAP adjustments in either period. For Q1-11, GAAP and Non-GAAP revenue growth percentages are the same as there were no
Non-GAAP adjustments in either period.
(d) Non-GAAP adjustments in Q2-12, Q3-11 and Q2-11 reflect revenues from businesses acquired during Q2-11. Non-GAAP adjustments in Q1-12 reflect storm
restoration revenues ($3.7 million) and revenues from businesses acquired during Q2-11 ($14.5 million). Non-GAAP adjustments in Q4-11 for fiscal 2011 fourth
quarter year-over-year organic growth reflects storm restoration revenues ($14.1 million) and revenues from businesses acquired during Q2-11 ($14.1 million). Non-
GAAP adjustments in Q4-10 result from the Company’s 52/53 week fiscal year. The Q4-10 Non-GAAP adjustments reflect the impact of the additional week in Q4-10
and are calculated by dividing contract revenues by 14 weeks. The result, representing one week of contract revenues, is subtracted from the GAAP-contract revenues
to calculate 13 weeks of revenue for Q4-10 on a Non-GAAP basis for comparison purposes. Non-GAAP adjustments in Q3-09, Q2-09, and Q1-09 reflect storm
restoration revenues recognized during those periods.
Amounts may not foot due to rounding.
13
Appendix: Regulation G Disclosure
(a) Year-over-year growth percentage is calculated as follows: (i) revenues in the quarterly period less (ii) revenues in the comparative prior year quarter period; divided
by (ii) revenues in the comparative prior year quarter period.
by (ii) revenues in the comparative prior year quarter period.
Amounts may not foot due to rounding.
14
Appendix: Regulation G Disclosure
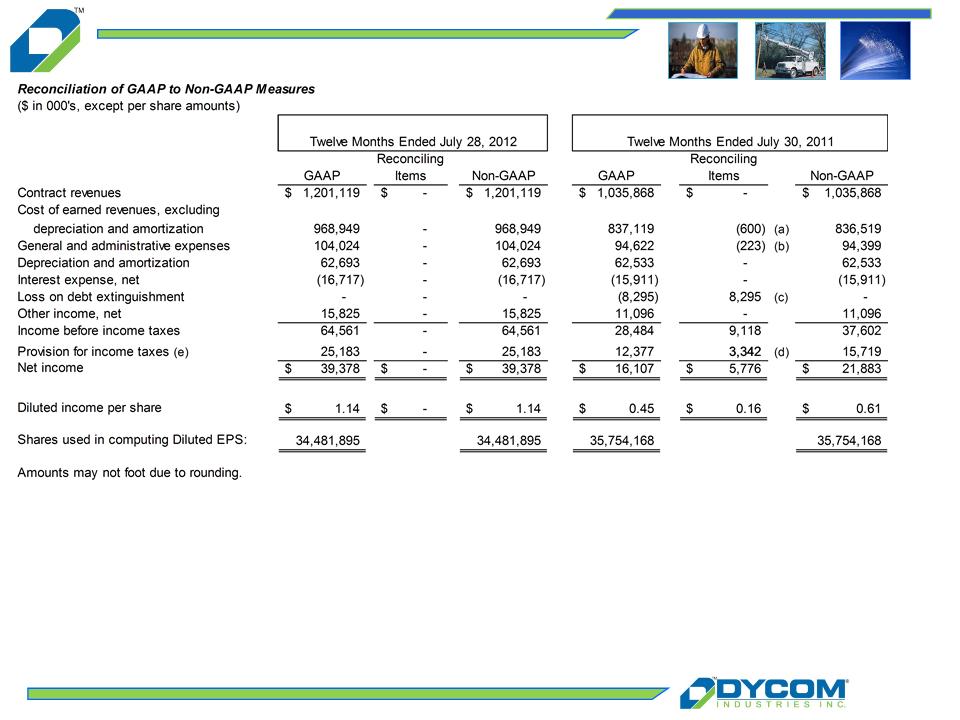
The items reconciling "GAAP" to “Non-GAAP” financial measures are specifically described below:
(a) Charge for a wage and hour class action litigation settlement.
(b) Acquisition related costs.
(c) Loss on debt extinguishment associated with the tender offer and redemption of $135.4 million in aggregate principal amount of the Company’s 8.125% senior
subordinated notes due 2015.
subordinated notes due 2015.
(d) Provision for income taxes includes the tax effect of the other reconciling items identified herein.
(e) The provision for income taxes, divided by income before income taxes, represents the effective tax rate. On a GAAP basis, this rate was 39.0% and 43.5% for the twelve
months ended July 28, 2012 and July 30, 2011, respectively. On a Non-GAAP basis, this rate was 41.8% for the twelve months ended July 30, 2011.
months ended July 28, 2012 and July 30, 2011, respectively. On a Non-GAAP basis, this rate was 41.8% for the twelve months ended July 30, 2011.

Fiscal 2012
4th Quarter Presentation
August 29, 2012