Attached files
| file | filename |
|---|---|
| 8-K - FORM 8-K - ALTERRA CAPITAL HOLDINGS Ltd | d403763d8k.htm |
 Investor Presentation
Quarter Ended June 30, 2012
Exhibit 99.1 |
 2
Cautionary Note Regarding Forward-Looking Statements
This presentation may include forward-looking statements that reflect Alterra’s current views
with respect to future events and financial performance. Statements that include the words
“expect,” “intend,” “plan,” “believe,” “project,”
“anticipate,” “will,” “may” and similar statements of a future or
forward-looking nature identify forward-looking statements. All forward-looking
statements address matters that involve risks and uncertainties. Accordingly, there are
important factors that could cause actual results to differ materially from those indicated in such
statements and you should not place undue reliance on any such statements.
These factors include, but are not limited to, the following: (1) the adequacy of loss and benefit
reserves and the need to adjust such reserves as claims develop over time; (2) the failure of
any of the loss limitation methods employed; (3) the effect of cyclical trends, including with
respect to demand and pricing in the insurance and reinsurance markets; (4) changes in general
economic conditions, including changes in capital and credit markets; (5) any lowering or loss
of financial ratings; (6) the occurrence of natural or man-made catastrophic events with a
frequency or severity exceeding expectations; (7) actions by competitors, including
consolidation; (8) the effects of emerging claims and coverage issues; (9) the loss of business
provided to Alterra by its major brokers; (10) the effect on Alterra’s investment
portfolio of changing financial market conditions, including inflation, interest rates, liquidity and other
factors; (11) tax and regulatory changes and conditions; (12) retention of key personnel; (13) the
integration of new business ventures Alterra may enter into; and (14) management’s
response to any of the aforementioned factors. The foregoing review of important factors should not be construed as exhaustive and should be read in
conjunction with the other cautionary statements that are included herein and elsewhere,
including the Risk Factors included in Alterra’s most recent reports on Form 10-K and
Form 10-Q and other documents on file with the Securities and Exchange Commission. Any
forward-looking statements made in this presentation are qualified by these cautionary
statements, and there can be no assurance that the actual results or developments anticipated by
Alterra will be realized or, even if substantially realized, that they will have the expected
consequences to, or effects on, Alterra or it business or operations. Alterra undertakes no
obligation to update publicly or revise any forward-looking statement, whether as a result
of new information, future developments or otherwise.
|
 3
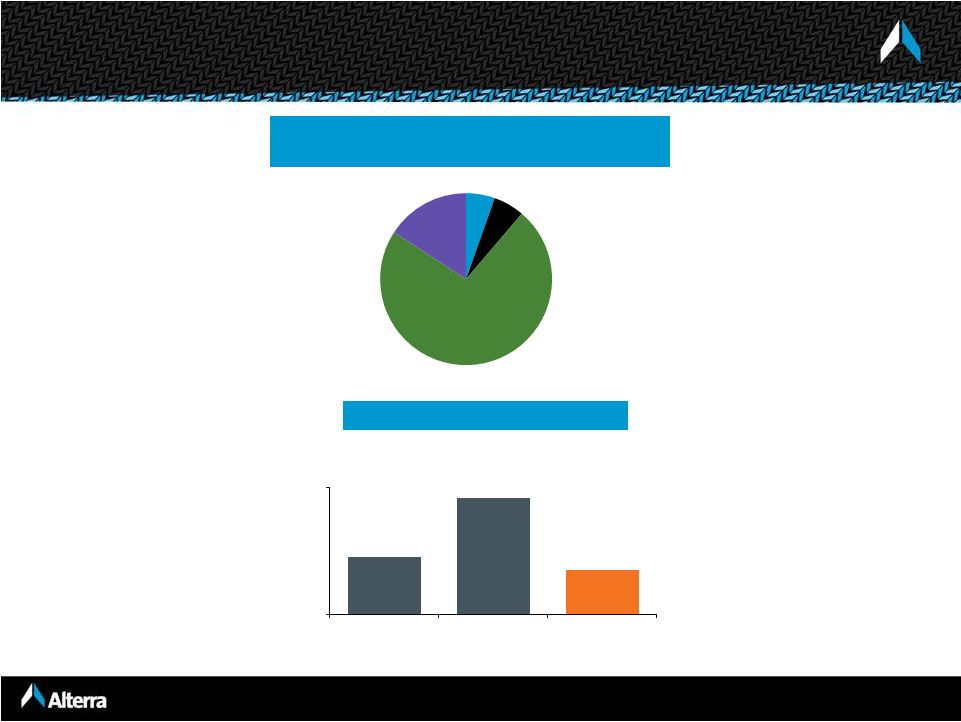
Alterra’s Franchise Is Well Positioned for Success
Global underwriter of specialty insurance and reinsurance
Multiple
operating
platforms
-
Bermuda,
Ireland,
United
States, Lloyd's and Latin America
Strong franchise positions across multiple specialty
classes of business
Opportunistic and disciplined underwriting strategy
Strong culture of risk management
Analytical and quantitative underwriting orientation
Business mix shift towards shorter-tail lines
5 year average combined ratio (including cats) of 90.8%
Liquid balance sheet with conservative reserving track record
Shareholders’
equity ~ $2.9 billion at 6/30/12
Low operating and financial leverage
S&P and AM Best ratings of “A”
Proven track record of active capital management
H1 2012 repurchases of $136.9 million and dividends of
$27.8
million,
or
5.9%
of
1/1/12
shareholders’
equity
2011 repurchases of $223.3 million and dividends of $54.5
million,
or
9.5%
of
1/1/11
shareholders’
equity
Increased quarterly dividend in August 2012 to $0.16 per
share
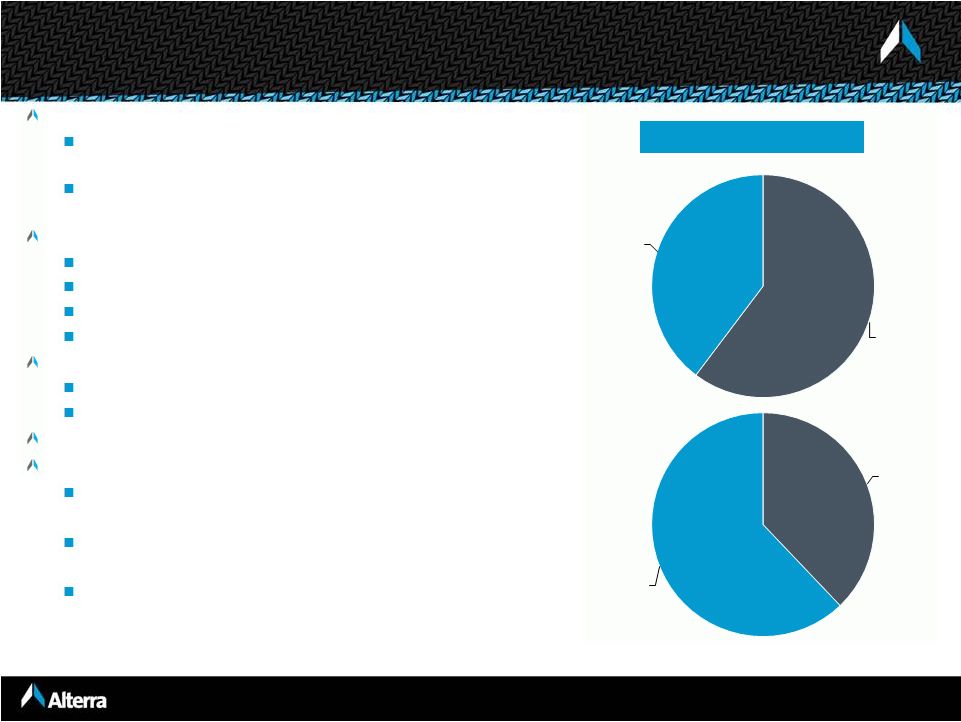
H1 2012 GPW
Short-
Tail
60%
Long-Tail
40%
Insurance
38%
Reinsurance
62% |
 4
Second Quarter 2012 Results
Q2 2012 net operating diluted EPS of $0.68 per
share
Overall P&C gross premiums written grew 0.5%
to $565.8 million
Premium growth in US Insurance and
shorter-tail lines offset by declines in longer-
tail reinsurance lines
P&C net premiums written decreased 11.8% to
$376.1 million
Driven by increased reinsurance purchases
to manage aggregate exposures
Net investment income of $54.7 million compared
to $59.7 million in Q2 2011
Combined ratio of 86.6% compared to 93.7% in
Q2 2011
Diluted book value per share of $28.68 at 6/30/12
up from $26.91 at 12/31/11. Additional $1.58 per
diluted share of unrecorded unrealized
gains
in
the
held
to
maturity
investment
portfolio
.
Q2 2012 impacted by $7.4 million of equity
earnings and fee income from New Point Re IV.
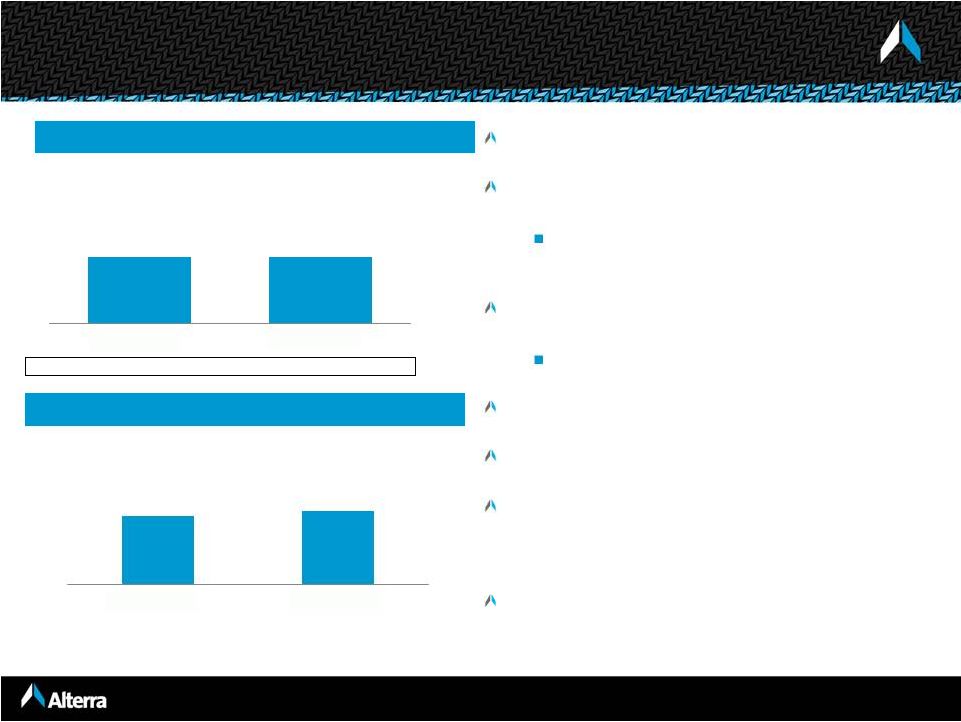
P&C GPW
(0.5% increase)
Growth in Book Value
93.7%
86.6%
Combined Ratio
$563.0
$565.8
Diluted Book Value per Share
(7.6% increase
1
)
$26.91
$28.68
Expansion into new lines and regions
2
Unrealized gains on the held to maturity fixed maturity investments are not
included in equity as the investments are carried on the balance sheet at
amortized cost. Jun 30, 2011
Jun 30, 2012
Dec 31, 2011
Jun 30, 2012
2
1
Including adding back $0.28 per share of dividends. |
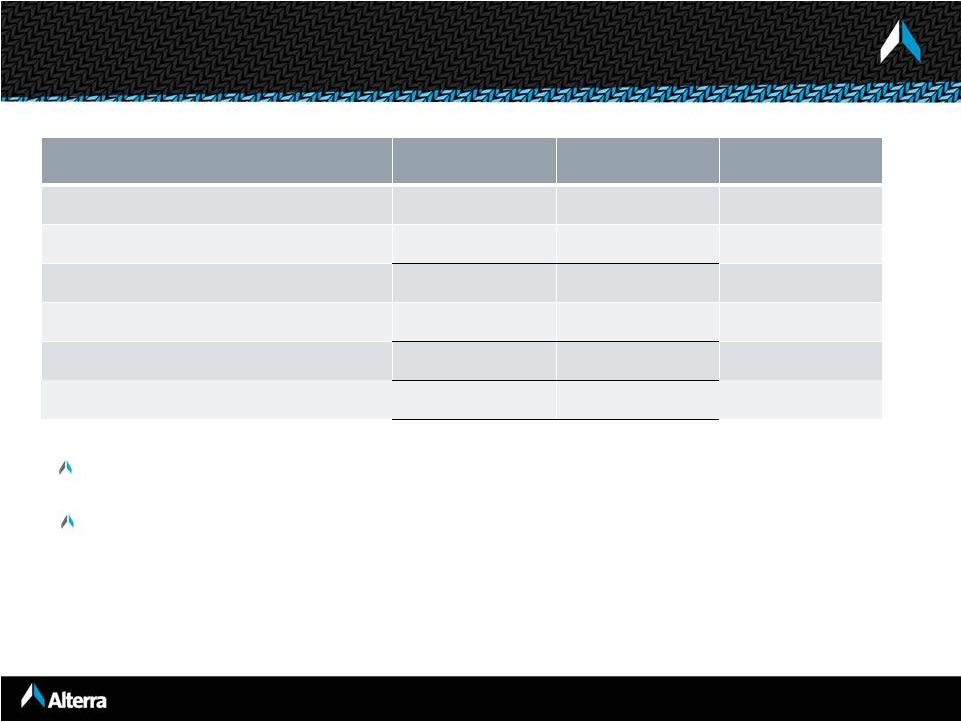 5
GPW $’millions
H1 2012
H1 2011
Period over Period
Growth %
Bermuda/ Dublin
221.9
182.2
US Reinsurance
39.1
42.4
GPW
on
contracts
bound
by
Alterra
in
the
period
1
261.0
224.6
20.8%
Alterra’s
share
of
New
Point
Re
IV
premiums
2
29.3
-
Total property reinsurance gross premiums
290.3
224.6
29.3%
Total
property
reinsurance
net
premiums
4
189.2
152.3
24.2%
Growth in Reinsurance Segment Property Premiums
1
Excluding premium adjustments and reinstatement premiums.
2
34.8% share of New Point Re IV gross premiums written. These premiums are not
included in Alterra’s reported gross premiums written as the investment in New
Point Re IV is accounted for under the equity method.
3
H1 2011 includes $13.4 million of New Point Re III gross premiums written. These
premiums are included in Alterra’s reported gross premiums written as Alterra owns
100% of New Point Re III.
4
Includes Alterra’s 34.8% share of New Point Re IV net premiums written.
20.8% growth in Alterra’s reinsurance segment property premiums reflects
improved market conditions
Participation
in
New
Point
Re
IV
increased
year
over
year
growth
to
29.3%
3 |
 6
New Point IV and V
Sidecar vehicles formed to create additional capacity for the
property catastrophe collateralized marketplace
“Just in time”
capital as it is called down and utilized when needed
New
Point
IV
-
$200
million
of
capital
fully
deployed
in
2012
Alterra has a 34.8% equity interest
GPW was $84.3 million for the six months ended June 30, 2012
Income
of
$16.6
million
recognized
for
the
six
months
ended
June
30,
2012
New
Point
V
-
$210
million
of
available
capacity
New Point vehicles allow us to leverage our underwriting skills to earn fees
while providing additional capacity to brokers and clients
|
 7
2011 global industry cat losses were over $105 billion
Market stressed by historic low returns on invested assets
Cash flow levels deteriorating
Industry reserve redundancies diminishing
Property cat rate increases have slowed
Casualty lines continue to show modest improvement
Pricing poised to positively move further with the next catalyst
Market Transitioning. . .
Alterra is positioned to be a beneficiary of improving market conditions
|
 8
Pricing Is Improving for the First Time Since 1999. . .
More Rate Improvement Is Needed To Meaningfully Increase Exposure
------------------------------------------------------------------------------------------
Source: RBC Capital Markets and CIAB Commercial Property and Casualty
Market Index Survey Large Accounts:
Rates Remain Below 1999
Medium Accounts:
Rates ~3% Above 1999
Small Accounts:
Rates ~13% Above 1999 |
 9
2004
Insurance
Property
2003
Insurance
Excess Liability
Professional Liability
2005
Reinsurance
Property / Property Cat
Harbor Point formed
2006
Insurance
Aviation
2008
Lloyd's Insurance
Financial Institutions
Prof. Indemnity
Lloyd's Reinsurance
Accident / Health
Property
2007
U.S. E&S Insurance
Property
Inland Marine
U.S. Casualty
Reinsurance
Multi Peril Crop
Experienced &
highly quantitative
underwriting teams
Lead underwriters average over 20 years in the
business
High percentage of employees hold
professional designations
2009
Lloyd's
Casualty (non U.S.)
A&H Insurance
U.S. Specialty
Professional Liability
Latin
America
Reinsurance
2002
Traditional Re
Workers' Comp
Medical Malpractice
GL / PL
Aviation
Identifying & Recruiting "Franchise Players" Has Been
Instrumental in Our Success
2010
Alterra formed
by the merger of Max
Capital and Harbor Point
2011
Lloyd’s
Property Direct &
Facultative
U.S. Specialty
Excess Casualty |
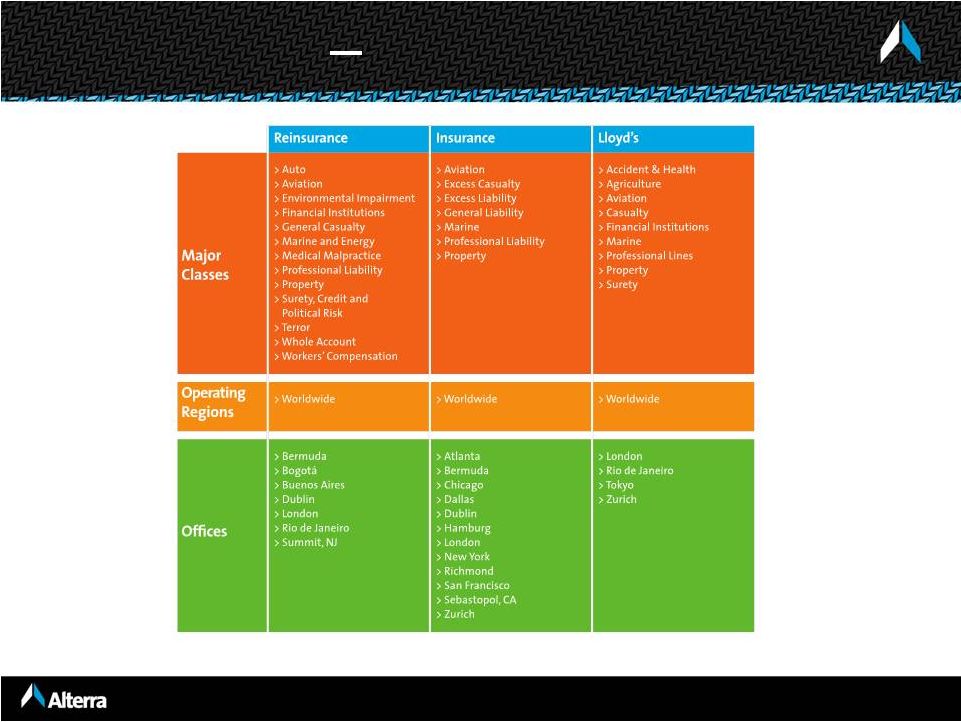 10
Local Knowledge
Global Reach |
 11
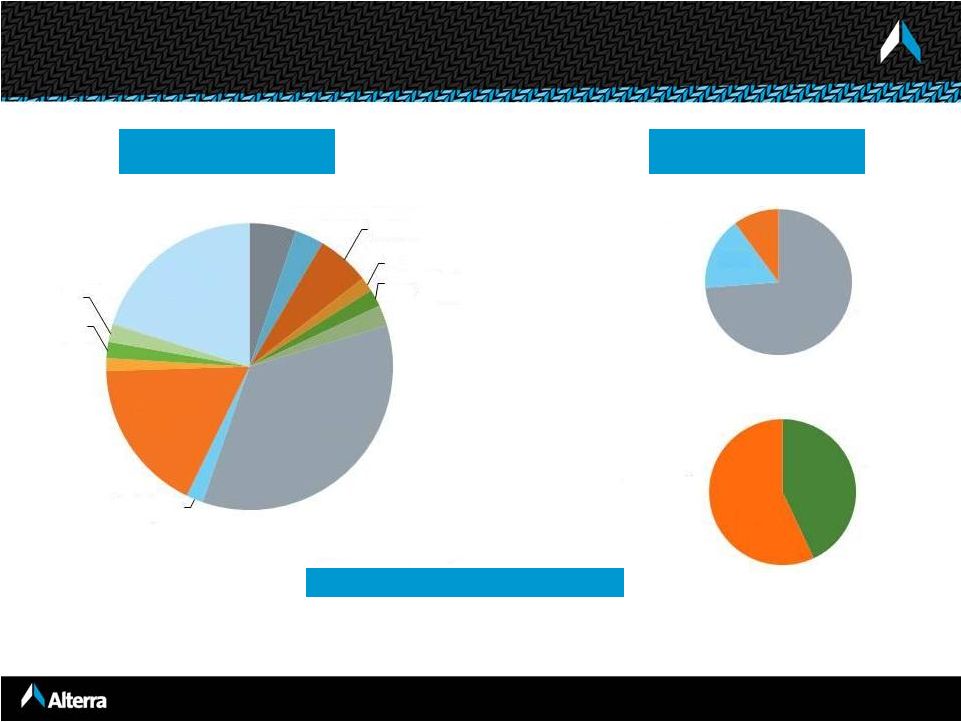
____________________
Note:
Pro forma gross premium written (“GPW”) represents the combined GPW of Max Capital
and Harbor Point net of intercompany eliminations of GPW. Global
Insurance (15.7% of H1 2012 P&C GPW)
Reinsurance
(46.1% of H1 2012 P&C GPW)
Professional
Liability
Property
Excess
Liability
Aviation
General Casualty
Property
Aviation
Workers Comp.
Professional Liability
Other
Med. Mal.
Marine & Energy
Agriculture
H1 2012 GPW: $192.0 million
= pro forma
$1,060.4
$815.4
Alterra Has a Strong Market Position in Specialty Classes …
Credit/ Surety
H1 2012 GPW: $565.2 million
$870.4
Auto
$382.9
$389.4
$447.3
$370.1
$365.8
$192.0
$0.0
$100.0
2007
2008
2009
2010
2011
H1 2012
$200.0
$300.0
$400.0
$500.0
$423.6
$345.2
$419.5
$487.1
$0.0
$200.0
$400.0
$600.0
$1,000.0
2007
2008
2009
2010
2011
H1 2012
$998.3
$900.4
$565.2
$800.0
$1,200.0
4%
2%
7%
3%
3%
1%
17%
45%
7%
5%
6%
3%
30%
43%
24% |
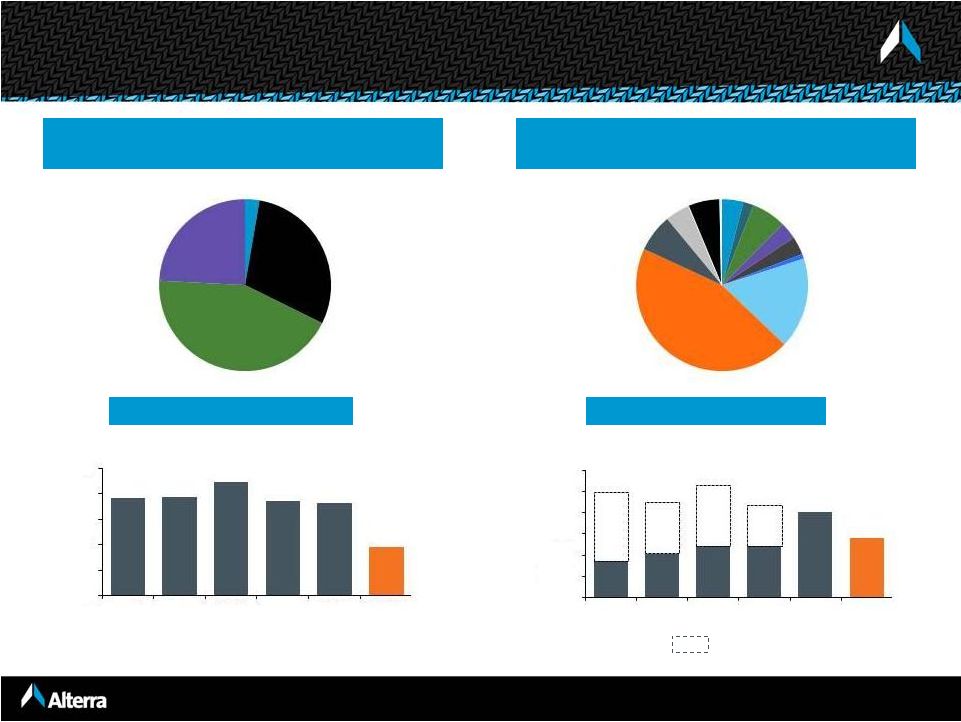
 12
…With an Attractive Position in the U.S. Market and Lloyd’s
Professional
Liability
Property
Marine
Excess/
General
Liability
Property
Agriculture
Aviation
Financial Institutions
Accident & Health
Int’l Casualty
Marine
Professional Liability
U.S. Insurance
(17.6% of H1 2012 P&C GPW)
Alterra at Lloyd’s
(17.8% of H1 2012 P&C GPW)
H1 2012 GPW: $216.5 million
H1 2012 GPW: $218.2 million
21%
25%
12%
42%
12%
10%
3%
6%
26%
2%
5%
36%
$194.3
$265.9
$324.0
$374.7
$216.5
$0.0
$100.0
$200.0
$300.0
$400.0
2008
2009
2010
2011
H1 2012
$8.8
$129.0
$179.8
$253.1
$218.2
$0.0
$100.0
$200.0
$300.0
2008
2009
2010
2011
H1 2012 |
 13
…and Latin America
Latin America
(2.8% of H1 2012 P&C GPW)
5%
6%
73%
16%
Property
Surety
Marine
General Liability
H1 2012 GPW: $34.8 million
$44.8
$91.8
$34.8
$0.0
$100.0
2010
2011
H1 2012 |
 14
North America
Europe
Other
Reinsurance
Insurance
(1)
2011 GPW = $1,904.1 million
____________________
(1)
Includes
Reinsurance
segment,
Life
&
Annuity
reinsurance
and
reinsurance
written
through
Lloyd’s
platform.
Diversified and Balanced Business Mix
Global Platform
2011
Line of Business
2011
Auto
5%
Aviation
3%
Marine & Energy
6%
Agriculture
2%
Accident & Health
2%
Other Short
-Tail
2%
Property
35%
Whole Account
2%
General Casualty
17%
Financial
Institutions
2%
Workers' Comp
2%
Medical
Malpractice
2%
Professional
Liability
20%
74%
16%
10%
57%
43% |
 15
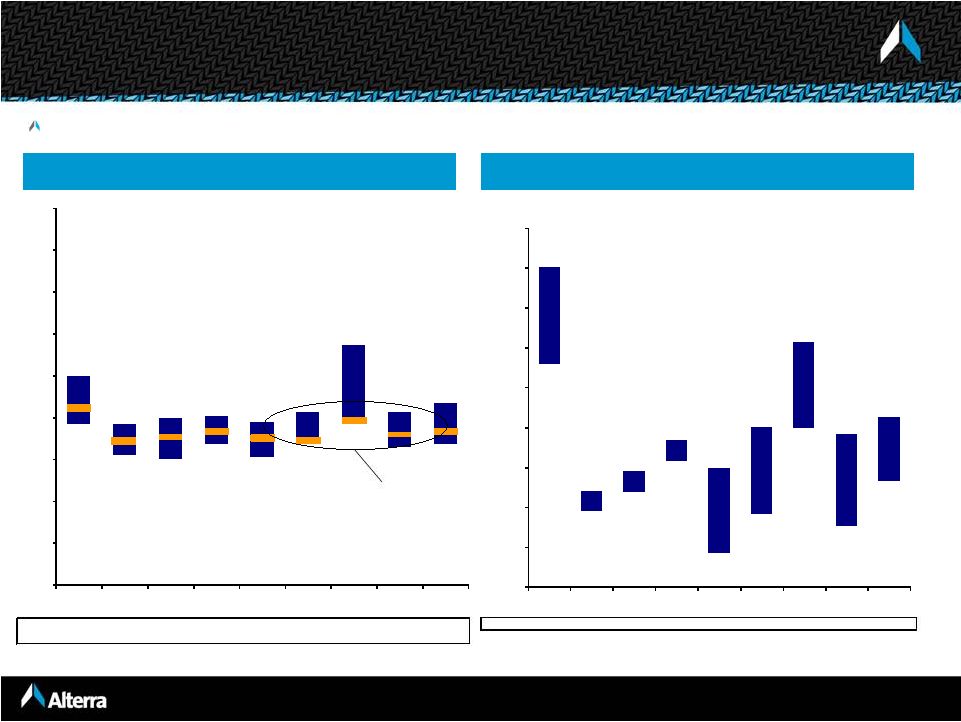
____________________
Source: Company filings, SNL Financial.
Diversified reinsurers include RE, AXS, ACGL, TRH, PRE, AWH, ENH, AHL, PTP, AGII and ALTE.
Property focused reinsurers include RNR, VR, MRH and FSR. Diversified
Reinsurers Property Focused Reinsurers
Diversified Platforms Generate More Consistent Margins
Alterra has performed well within its diversified peer group with less volatility
than property focused reinsurers Alterra has had one of
the lowest combined
ratios of its peer group
Median
115%
84%
83%
94%
84%
93%
115%
89%
95%
Alterra
106%
86%
88%
92%
88%
86%
98%
90%
92%
96%
77%
75%
84%
76%
85%
96%
82%
84%
124%
96%
99%
101%
97%
103%
143%
103%
108%
0%
25%
50%
75%
100%
125%
150%
175%
200%
225%
2005
2006
2007
2008
2009
2010
2011
H1 2012
Average
Median
170%
56%
62%
90%
66%
84%
125%
71%
90%
140%
48%
59%
79%
21%
45%
99%
38%
66%
201%
60%
73%
92%
75%
100%
154%
96%
106%
0%
25%
50%
75%
100%
125%
150%
175%
200%
225%
2005
2006
2007
2008
2009
2010
2011
H1 2012
Average |
 16
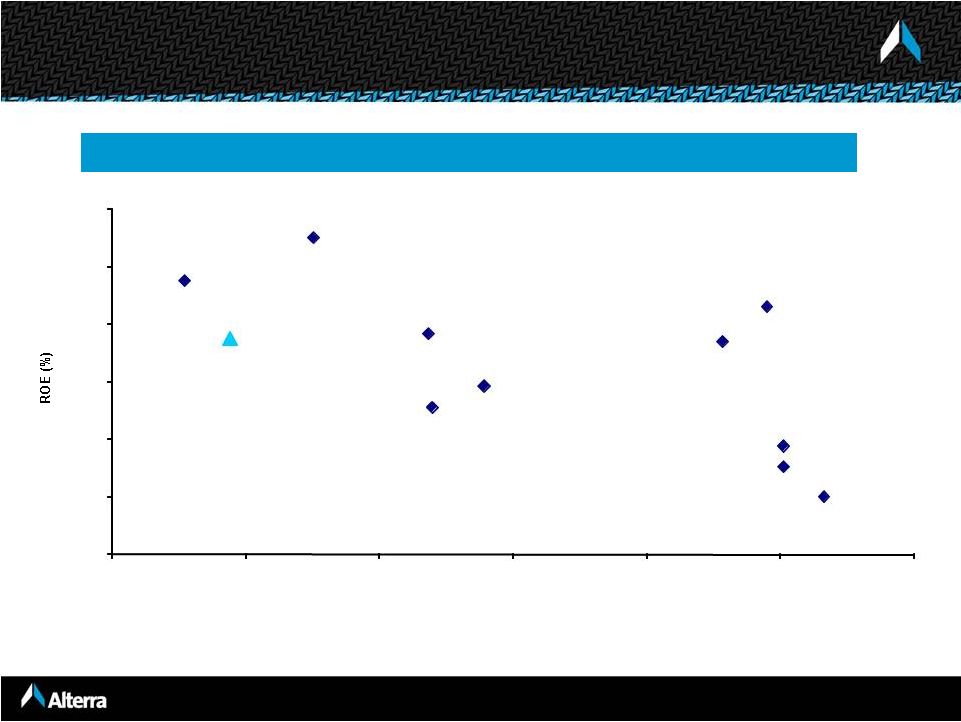
3 Year Return on Equity
Alterra’s
ROEs
Have
Been
More
Consistent
Than
Most
Peers
____________________
Source: JMP
Research,
SNL
Financial.
Three
years
ended
December
31,
2011.
Alterra ROE reflects Pro-Forma data for Max and Harbor Point prior to the merger in May
2010. ACGL
AHL
AXS
AWH
MRH
PRE
PTP
RNR
VR
ALTE
ENH
2.0%
4.0%
6.0%
8.0%
10.0%
12.0%
14.0%
4%
6%
8%
10%
12%
14%
16%
Std. Dev. |
 17
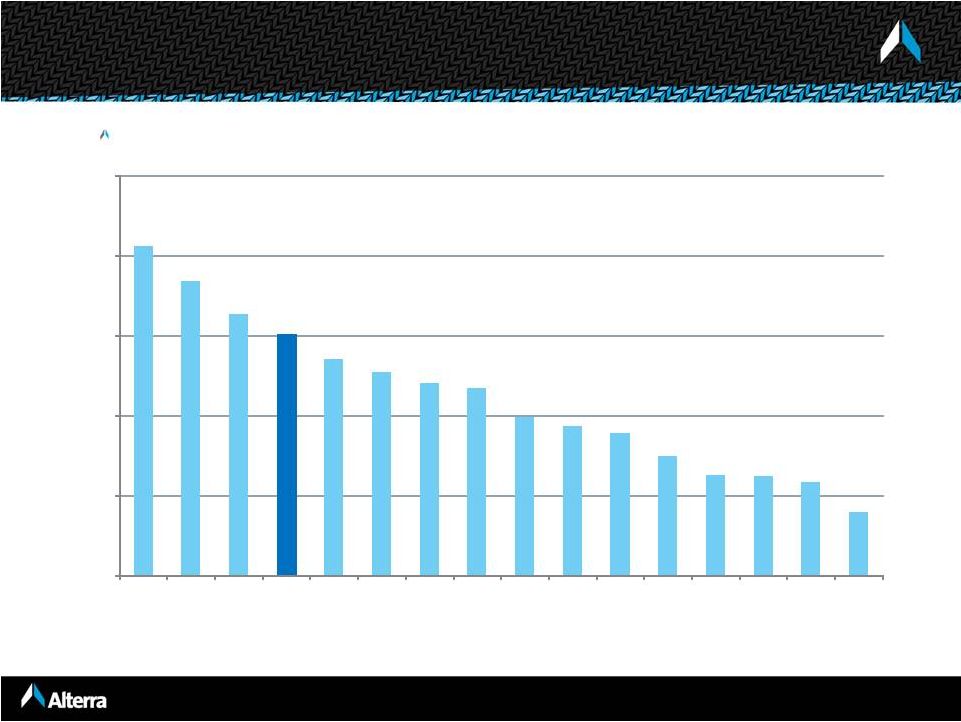
Active Capital Management
____________________
Source: SNL Financial and FactSet
Note: Capital returned to shareholders includes dividends and share
repurchases. For the three years ended December 31, 2011
Average Annual Capital Returned to Shareholders as a % of Opening
Shareholders’ Equity
20.6%
18.4%
16.3%
15.1%
13.6%
12.7%
12.0%
11.7%
9.9%
9.3%
8.9%
7.5%
6.3%
6.3%
5.8%
4.0%
0.0%
5.0%
10.0%
15.0%
20.0%
25.0%
ACGL
AWH
AHL
ALTE
PTP
ENH
VR
MRH
PRE
RNR
AXS
AGII
FSR
XL
RE
ACE |
 18
Our strategy is to diversify our book of business so that property cat
is one of many components of our business
Results demonstrate our successful risk management
Our reserving process has been tested by large, recent loss events
including:
2011 Australia floods, New Zealand earthquake, Japan
earthquake and tsunami, U.S. spring storms, Hurricane Irene,
Thai floods
2010 Chile earthquake, New Zealand earthquake
2008 Hurricanes Ike/Gustav
Superior Risk Management
Alterra’s losses from catastrophe events as a % of equity are
below our peer group average |
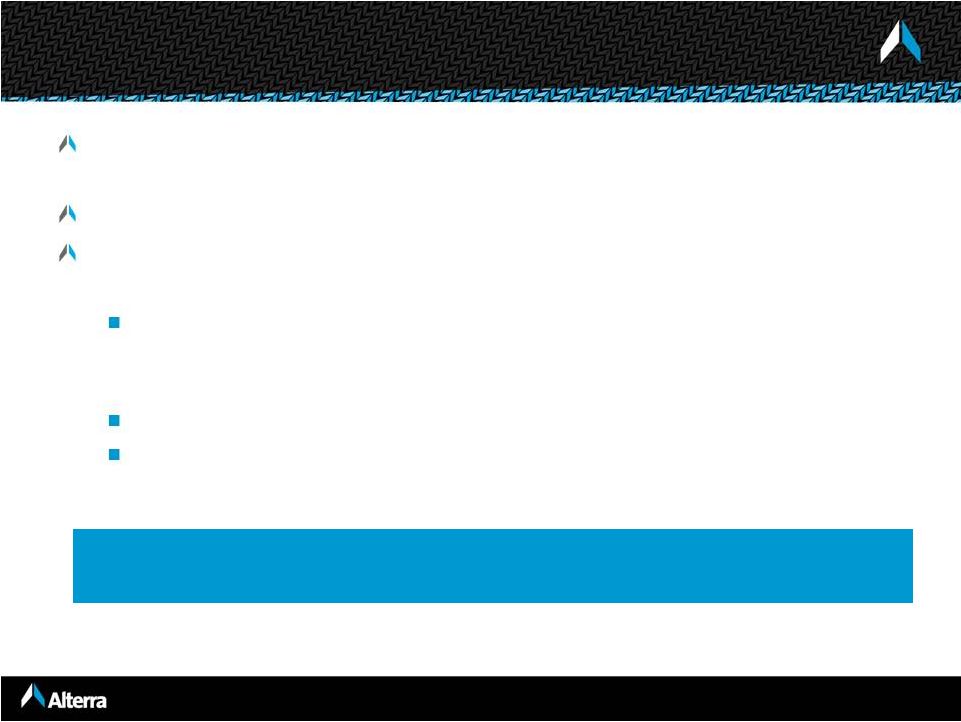
 19
Peer PML’s as a Percentage of Shareholder’s Equity
____________________
Source: Dowling & Partners Research
Note: ALTE includes proportionate share of New Point Re IV. RNR and PRE do not disclose their
PMLs for either 1-in-100 year events or 1-in-250 year events. All data
is based on RMS 11 except RE which is based on AIR.
0%
5%
10%
15%
20%
25%
30%
35%
VR
ENH
MRH
ALTE
AWH
AHL
FSR
ACGL
AXS
Y
RE
PTP
As of July 1, 2012
1 in 100
1 in 250 |
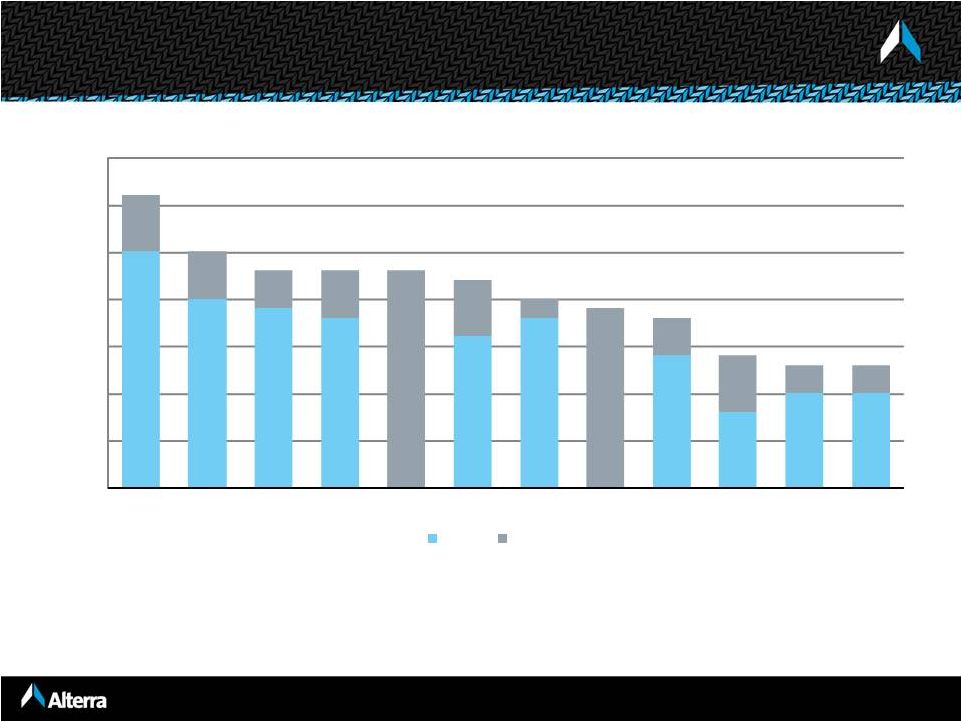
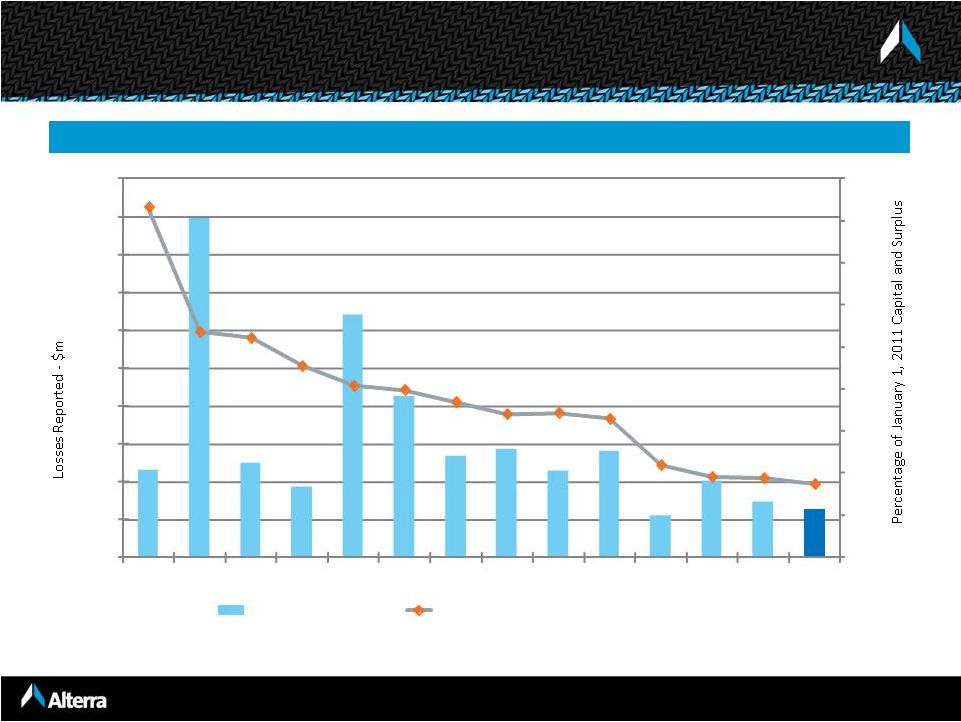 20
2011 –
“The Year of the Cat”
Alterra’s Ratio Of Losses to Equity Are Below Peer Group
__________________
Source: Company reports and SNL Financial
0%
5%
10%
15%
20%
25%
30%
35%
40%
45%
0
200
400
600
800
1,000
1,200
1,400
1,600
1,800
2,000
FSR
PRE
PTP
MRH
RE
TRH
AHL
VR
ENH
RNR
AGII
ACGL
AWH
ALTE
Losses
Percentage of January 1, 2011 Capital and Surplus |
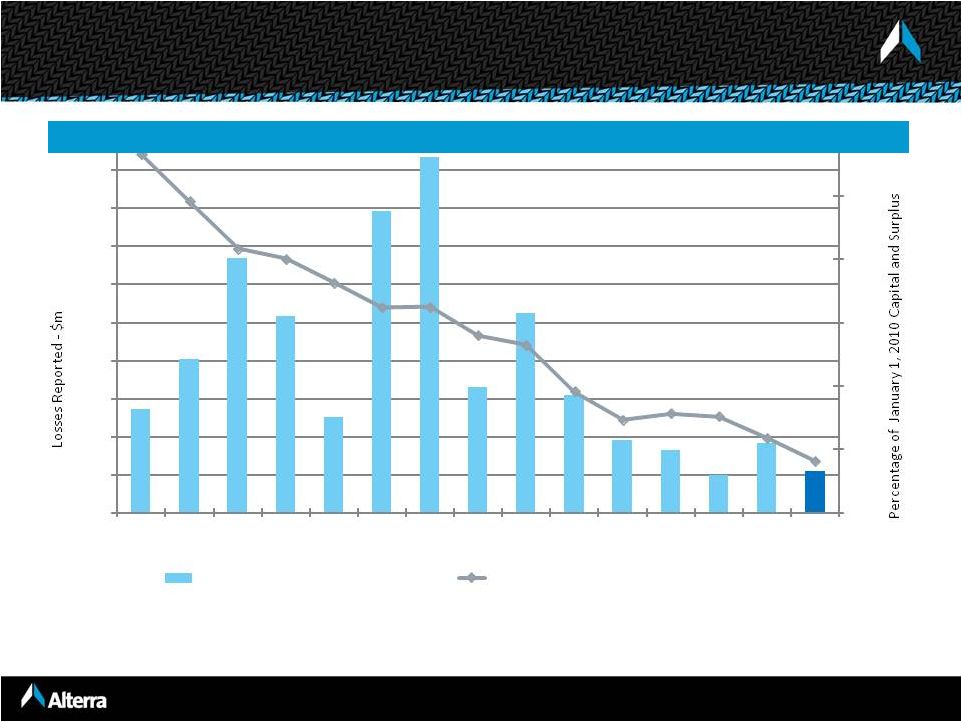 21
2010 –
Chile Earthquake / Windstorm Xynthia/
September New Zealand Earthquake
____________________
(2)
Q2 net losses reflect only losses from the Chile earthquake. Initial losses
include the Chile earthquake and Windstorm Xynthia. (3)
Initial loss estimate reflects 50% to 90% of Reuters consensus net operating earnings
prior to the earthquake, based on disclosure that net income would remain positive for the quarter.
(4)
Initial estimates based on Chile and Xynthia, ultimate losses include the Chile, Haiti,
and Baja earthquakes, Xynthia and the Australia hailstorms. Based on international catastrophe losses being two-thirds of total catastrophe losses as
disclosed in the earnings conference call.
(5)
Initial estimate is as of the first quarter conference call. Both initial and
revised estimates reflect only the Chile earthquake. (6)
Pro forma; includes losses from Harbor Point and Max Capital prior to the merger.
Expressed as a percentage of combined 12/31/09 equity prior to the special dividend.
0%
2%
4%
6%
8%
10%
0
50
100
150
200
250
300
350
400
450
FSR
PTP (1)
VR (2)
RNR (3)
MRH
RE
PRE
AHL
AXS (2)
TRH (2)
AWH
(2)(4)
ENH
AGII
(1)(5)
ACGL(1)
ALTE (6)
Ultimate Net Losses Reported
Percentage of January 1, 2010 Capital and Surplus
Alterra’s 2010 Losses Are Below Peer Group
Source: Company filings and press releases; losses are generally disclosed net of tax
and net of reinstatement premiums.
(1) Q2 net losses reflect Q1 estimates
plus reported development, if any. |
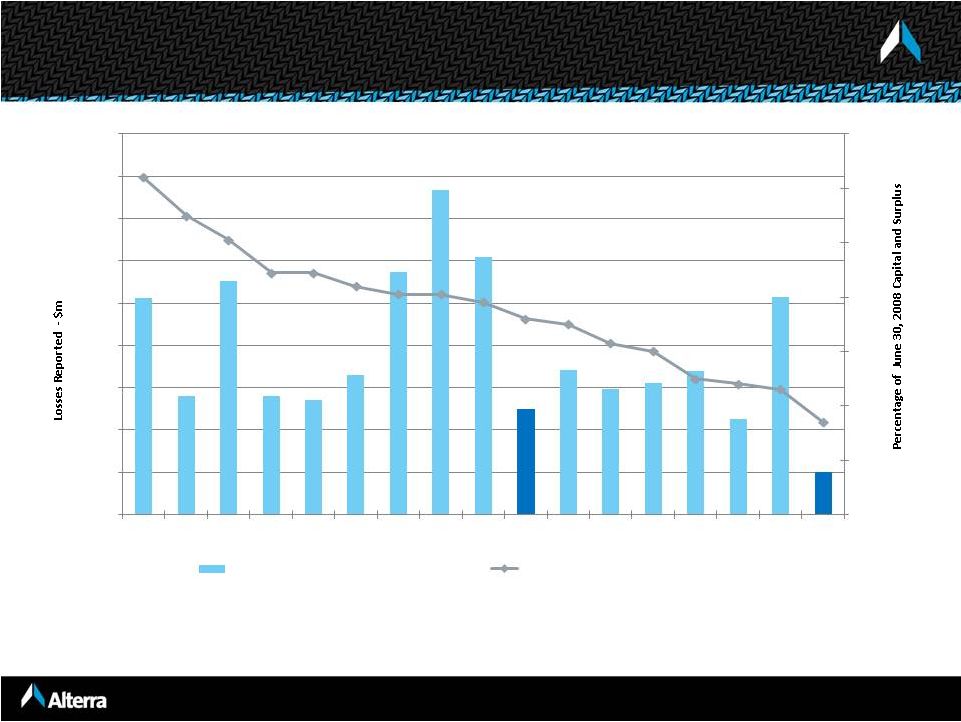 22
2008 –
Hurricanes Ike / Gustav
____________________
Source: Company filings, as of 12/31/08. Losses are generally disclosed net of reinstatement
premiums. (1)
Equity includes preferred shares, which subsequently converted to common shares.
(2)
Results reflect Ike only.
(3)
Equity includes preferred shares, which subsequently converted to common shares.
(4)
TRH does not disclose specific losses but did lose "$169.7 million principally relating to
Hurricane Ike." 0%
2%
4%
6%
8%
10%
12%
14%
0
50
100
150
200
250
300
350
400
450
VR
FSR
RNR
MRH
IPCR(1)
PTP(1)
ACGL
AXS
PRE(2)
HP(3)
AHL
ENH
ORH
TRH(4)
AWH
RE
MXGL
Ultimate Net Losses Reported
Percentage of June 30, 2008 Capital and Surplus |
 23
PML goal of no more than 25% of starting capital in 1 in 250 year event
Adjust position as market pricing makes risk/reward attractive
Use RMS with “all switches on”
and gross-up factors on standard model
Incorporate AIR, market share, industry and client historical loss data
Capture detailed location data and put a premium on data quality
Historically, our losses for events have been close to expected ranges
PML and aggregate usage is incorporated into our pricing models
Key In-force PMLs as of July 1, 2012
U.S. wind
1 in 100 year event -
$498 million net loss (17.7% of 1/1/12 shareholders’
equity)
California earthquake
1 in 250 year event -
$360 million net loss (12.8% of 1/1/12 shareholders’
equity)
Europe wind
1 in 100 year event -
$145 million net loss (5.2% of 1/1/12 shareholders’
equity)
Cat Aggregate & PML Management |
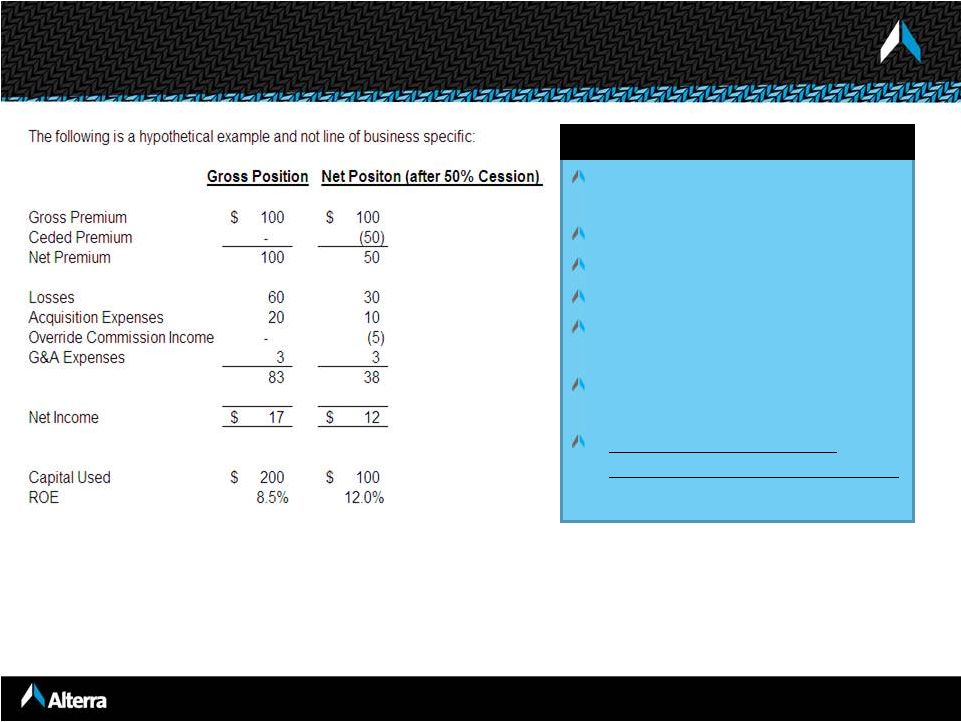 24
Disciplined Underwriting Management
Expands our market clout and
footprint
Reduces underwriting risk
Increases fee income
Earlier profit recognition
Assists in the risk
management process
Can dial down as market
pricing improves
Benefits of Ceding Premium Include:
Reduces Volatility and
Improves the Near term ROE |
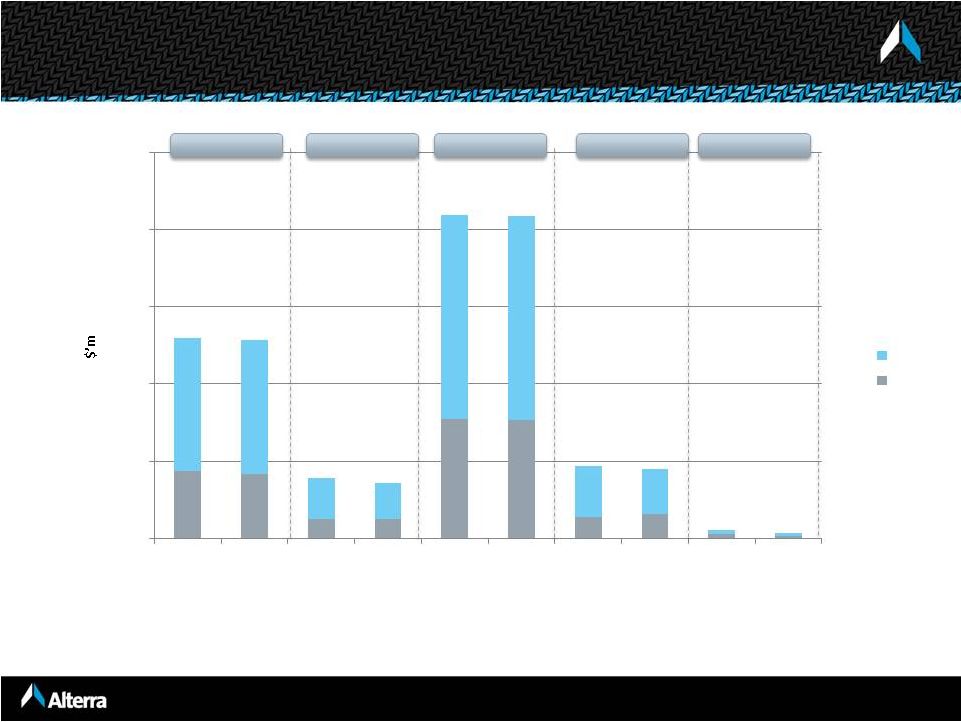 Reserve for Losses and Loss Expenses
25
As of June 30, 2012 and December 31, 2011
Global Insurance
Reinsurance
U.S. Insurance
Alterra at Lloyd’s
Latin America
IBNR
Case
0
500
1,000
1,500
2,000
2,500
$1,297
$1,286
$467
$451
$56
$34
$2,094
$2,088
66%
67%
67%
64%
63%
63%
70%
65%
$ 394
$357
34%
33%
33%
36%
37%
37%
30%
35%
Q2 2012
Q4 2011
Q2 2012
Q4 2011
Q2 2012
Q4 2011
Q2 2012
Q4 2011
Q2 2012
Q4 2011 |
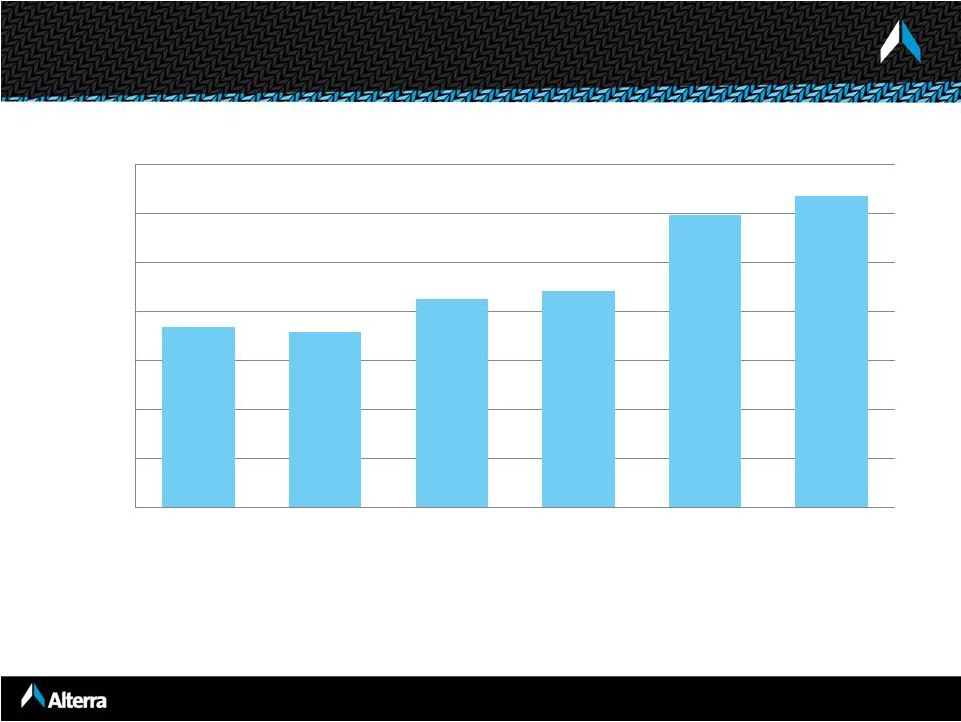 26
Favorable Reserve
Development
$5.9
$45.1
$90.8
$77.2
$105.5
$153.3
Development as a
% of Net Reserves
prior to
development
0.3%
2.5%
4.1%
3.4%
3.4%
4.6%
Reserve Development History
($ in millions)
____________________
$1,840
$1,796
$2,128
$2,213
$2,985
$3,182
500
1,000
1,500
2,000
2,500
3,000
3,500
2006
2007
2008
2009
2010
2011
-
Net Loss Reserves
Note: Reserve development and net reserves prior to May 12, 2010 are for Max Capital
only. Reserve development excludes changes in reserves resulting from changes in
premium estimates on prior years’ contracts. |
 27
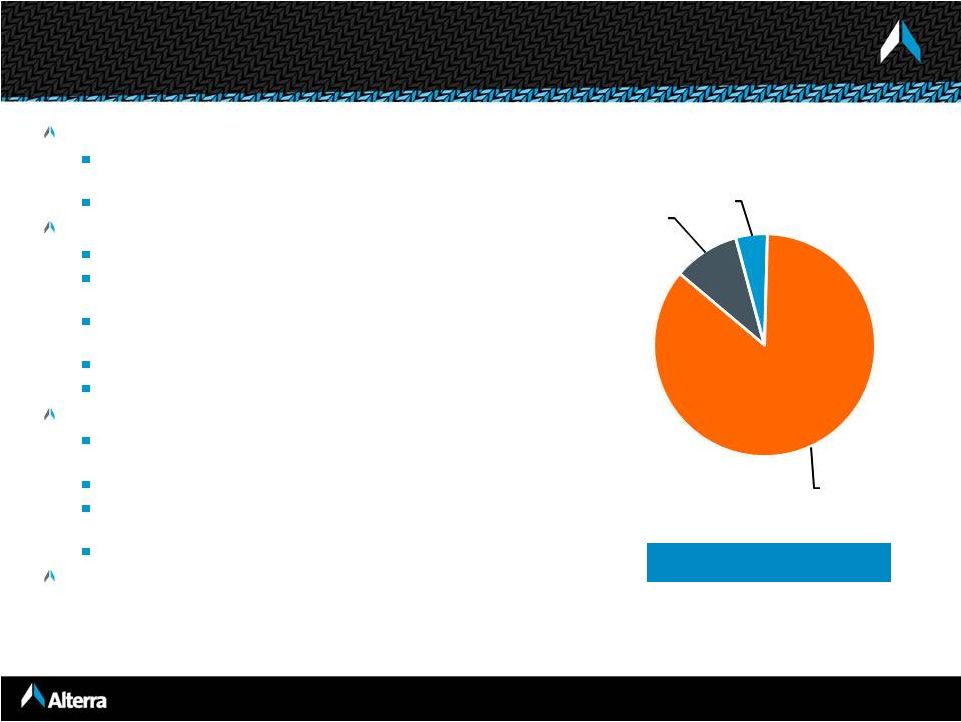
High Quality, Liquid Investment Portfolio
Alterra maintains a high quality, liquid portfolio
95.4% of portfolio in fixed income/cash, which consists of highly
rated securities
Assets are generally matched to liabilities
Cycle management extends to investments
Cash balance $764.0 million or 9.7% of portfolio
Average fixed income duration of approximately 4.1 years, including
cash
60.7% of the cash and fixed maturities portfolio is held in cash,
government
/
agency-backed
securities
and
“AAA”
securities
71.8%
of
fixed
income
portfolio
rated
“AA”
or
better
Hedge fund investments are marked-to-market
Minimal exposure to selected asset classes
CMBS
of
$399.0
million
(5.9%
of
portfolio)
–
average
rating
of
AA+/Aa1
ABS of $350.6 million (5.2% of portfolio)
RMBS
of
$1,322.8
million
(19.6%
of
portfolio)
–
93.9%
agency-
backed
No CDO’s, CLO’s, SIV’s or other highly structured securities
Less than $13 million of OTTI losses over the last eight
quarters
Carrying Value $7.9 billion
As of June 30, 2012
Cash
Other
Investments
4%
Fixed Income
10%
86% |
 European government holdings
Total European government holdings
represent $750.4 million, or 9.5%, of the
$7.9 billion investment portfolio.
No direct exposure in Greece, Portugal,
Italy, Ireland or Spain.
European banking institutions
Total European banking institution
holdings represent $437.6 million, or
5.5%, of the $7.9 billion investment
portfolio.
Two largest holdings, which total $126.7
million, are with government-backed
banking institutions.
European Exposure
As of June 30, 2012
France
36%
Germany
34%
Netherlands
19%
Belgium
3%
United
Kingdom
6%
Denmark
1%
Other
Norway
1%
1%
European
Investment
Bank
16%
KFW
14%
Credit Suisse
8%
Lloyds
6%
UBS
6%
BNP Paribas
4%
HSBC
4%
Barclays
7%
Other
35%
28 |
 29
____________________
Note:
Price / diluted book value multiple as of August 27, 2012.
Well Positioned to Build Shareholder Value
Franchise positions in attractive specialty markets
Established operating platforms provide global access to business
Diversified business portfolio across casualty and property lines
Opportunistic
approach
–
nimble
and
responsive
to
market
trends
High-quality, liquid investment portfolio
Invested asset leverage intended to drive more consistent returns
Balance sheet strength with low leverage / financial flexibility
Attractive entry point –
price / diluted book value of 0.81x |
 30
Appendices |
 31
June 30,
December 31,
2012
2011
Cash & Fixed Maturities
7,520
$
7,528
$
Other Investments
366
287
Premium Receivables
992
715
Losses Recoverable
1,084
1,068
Other Assets
735
588
Total Assets
10,697
$
10,186
$
Property & Casualty Losses
4,308
$
4,217
$
Life & Annuity Benefits
1,148
1,191
Deposit Liabilities
158
151
Funds Withheld
94
112
Unearned Premium
1,281
1,021
Senior Notes
441
441
Other Liabilities
415
244
Total
Liabilites 7,845
$
7,377
$
Shareholders' Equity
2,852
2,809
10,697
$
10,186
$
Strong Balance Sheet
($ in millions) |
 32
YTD Results Comparison
($ in millions)
Six months ended
June 30,
June 30,
2012
2011
Gross Premiums Written
1,228
$
1,192
$
Net Premiums Earned
689
729
Net Investment Income
113
117
Net Realized and Unrealized Gains (Losses) on Investments
39
(25)
Other Than Temporary Impairment Charges
(6)
(1)
Other Income
7
2
Total Revenues
842
822
Total Losses, Expenses & Taxes
684
836
Net Income (Loss)
158
$
(14)
$
Net Operating Income
137
$
15
$
Property & Casualty Underwriting
Loss Ratio
58.6%
70.9%
Expense Ratio
31.0%
32.7%
Combined Ratio
89.5%
103.5% |
 33
Six months ended June 30, 2012
($ in millions)
Totals in table may not add due to rounding. (1) Property and Casualty
only. Diversified Operating Platform
Property & Casualty
Global
Insurance
U.S.
Insurance
Reinsurance
Alterra at
Lloyd's
Latin
America
Total
Life & Annuity
Reinsurance
Corporate
Consolidated
Gross premiums written
$192.0
$216.5
$565.2
$218.2
$34.8
$1,226.7
$1.5
-
$
1,228.2
$
Reinsurance premiums ceded
(96.5)
(122.0)
(112.7)
(65.7)
(17.3)
(414.2)
(0.2)
-
(414.4)
Net premiums written
$95.6
$94.5
$452.5
$152.5
$17.5
$812.5
$1.3
-
$
813.8
$
Earned premiums
$186.9
$196.5
$405.1
$142.2
$42.5
$973.2
$1.5
-
$
974.7
$
Earned premiums ceded
(92.5)
(84.9)
(55.9)
(43.2)
(9.1)
(285.6)
(0.2)
-
(285.8)
Net premiums earned
94.4
111.6
349.2
99.1
33.3
687.6
1.3
-
689.0
Net losses and loss expenses
(40.8)
(74.9)
(190.8)
(71.7)
(24.6)
(402.8)
-
-
(402.8)
Claims and policy benefits
-
-
-
-
-
-
(26.7)
-
(26.7)
Acquisition costs
(0.3)
(13.9)
(81.4)
(16.9)
(9.2)
(121.6)
(0.3)
-
(121.9)
General and administrative expenses
(13.4)
(24.5)
(31.4)
(17.0)
(5.0)
(91.2)
(0.2)
-
(91.4)
Other income
0.8
0.1
6.3
-
-
7.2
-
-
7.2
Underwriting income (loss)
40.7
(1.6)
52.0
(6.5)
(5.4)
79.3
n/a
-
n/a
Net investment income
28.2
85.2
113.4
39.0
39.0
(5.9)
(5.9)
Corporate other income
0.1
0.1
Interest expense
(18.3)
(18.3)
Net foreign exchange gains
-
-
Corporate general and administrative expenses
(27.5)
(27.5)
Income before taxes
$2.4
$72.5
$154.1
Loss ratio
43.2%
67.1%
54.6%
72.4%
73.7%
58.6%
Acquisition cost ratio
0.3%
12.4%
23.3%
17.0%
27.6%
17.7%
14.2%
21.9%
9.0%
17.1%
14.9%
13.3%
Combined ratio
(1)
57.7%
101.5%
86.9%
106.5%
116.3%
89.5%
Net realized and unrealized gains on
investments
Net impairment losses recognized in
earnings
General and administrative expense
ratio |