Attached files
| file | filename |
|---|---|
| EX-21 - EXHIBIT 21 - AEROFLEX HOLDING CORP. | v322428_ex21.htm |
| EX-32.2 - EXHIBIT 32.2 - AEROFLEX HOLDING CORP. | v322428_ex32-2.htm |
| EX-31.2 - EXHIBIT 31.2 - AEROFLEX HOLDING CORP. | v322428_ex31-2.htm |
| EX-14.1 - EXHIBIT 14.1 - AEROFLEX HOLDING CORP. | v322428_ex14-1.htm |
| EX-23.1 - EXHIBIT 23.1 - AEROFLEX HOLDING CORP. | v322428_ex23-1.htm |
| EX-32.1 - EXHIBIT 32.1 - AEROFLEX HOLDING CORP. | v322428_ex32-1.htm |
| EX-31.3 - EXHIBIT 31.3 - AEROFLEX HOLDING CORP. | v322428_ex31-3.htm |
| EX-31.1 - EXHIBIT 31.1 - AEROFLEX HOLDING CORP. | v322428_ex31-1.htm |
UNITED STATES
SECURITIES AND EXCHANGE COMMISSION
Washington, D.C. 20549
FORM 10-K
(Mark One)
| x | ANNUAL REPORT PURSUANT TO SECTION 13 OR 15(d) OF THE SECURITIES EXCHANGE ACT OF 1934 |
For the fiscal year ended June 30, 2012
OR
| ¨ | TRANSITION REPORT PURSUANT TO SECTION 13 OR 15(d) OF THE SECURITIES EXCHANGE ACT OF 1934 |
Commission File No. 001-34974
| Aeroflex Holding Corp. |
| (Exact name of registrant as specified in its charter) |
| Delaware | 01-0899019 |
| (State or other jurisdiction of | (I.R.S. Employer |
| incorporation or organization) | Identification No.) |
| 35 South Service Road, Plainview, New York | 11803 |
| (Address of principal executive offices) | (Zip Code) |
Registrant’s telephone number, including area code: (516) 694-6700
Securities registered pursuant to Section 12(b) of the Act:
| Title of Class | Name of Each Exchange on Which Registered |
| Common Stock, $.01 par value | New York Stock Exchange |
Securities registered pursuant to Section 12(g) of the Act: None
Indicate by check mark if the registrant is a well-known seasoned issuer, as defined in Rule 405 of the Securities Act. Yes ¨ No x
Indicate by check mark if the registrant is not required to file reports pursuant to Section 13 or Section 15(d) of the Exchange Act. Yes ¨ No x
Indicate by check mark whether the registrant (1) has filed all reports required to be filed by Section 13 or 15(d) of the Securities Exchange Act of 1934 during the preceding 12 months (or for such shorter period that the registrant was required to file such reports), and (2) has been subject to such filing requirements for the past 90 days. Yes x No ¨
Indicate by check mark whether the registrant has submitted electronically and posted on its corporate Web site, if any, every Interactive Data File required to be submitted and posted pursuant to Rule 405 of Regulation S-T (§232.405 of this chapter) during the preceding 12 months (or for such shorter period that the registrant was required to submit and post such files). Yes x No ¨
Indicate by check mark if disclosure of delinquent filers pursuant to Item 405 of Regulation S-K is not contained herein, and will not be contained, to the best of registrant’s knowledge, in definitive proxy or information statements incorporated by reference in Part III of this Form 10-K or any amendment to this Form 10-K x.
Indicate by check mark whether the registrant is a large accelerated filer, an accelerated filer, a non-accelerated filer, or a smaller reporting company. See definitions of “large accelerated filer,” “accelerated filer” and “smaller reporting company” in Rule 12b-2 of the Exchange Act. (Check one): Large accelerated filer ¨ Accelerated filer x
Non-accelerated filer ¨ (Do not check if a smaller reporting company) Smaller reporting company ¨
Indicate by check mark whether the registrant is a shell company (as defined in Rule 12b-2 of the Exchange Act). Yes ¨ No x
State the aggregate market value of the voting and non-voting common equity held by non-affiliates computed by reference to the price at which the common equity was last sold, or the average bid and asked price of such common equity, as of the last business day of the registrant’s most recently completed second fiscal quarter. As of December 31, 2011 – approximately $202,473,000.
Indicate the number of shares outstanding of each of the registrant’s classes of common stock, as of the latest practicable date. Common Stock, par value $.01 per share; outstanding as of August 29, 2012: 84,851,868 shares.
Documents incorporated by reference: Part III (Items 10, 11, 12, 13 and 14) – registrant’s definitive proxy statement to be filed pursuant to Regulation 14A of the Securities Act of 1934.
TABLE OF CONTENTS
| PAGE | ||
| PART I | ||
| Item 1. | Business | 2 |
| Item 1A. | Risk Factors | 13 |
| Item 1B. | Unresolved Staff Comments | 32 |
| Item 2. | Properties | 33 |
| Item 3. | Legal Proceedings | 34 |
| Item 4. | Mine Safety Disclosures | 34 |
| PART II | ||
| Item 5. | Market for Registrant’s Common Equity, Related Stockholder Matters and Issuer Purchases of Equity Securities | 35 |
| Item 6. | Selected Financial Data | 37 |
| Item 7. | Management’s Discussion and Analysis of Financial Condition and Results of Operations | 43 |
| Item 7A. | Quantitative and Qualitative Disclosures About Market Risk | 71 |
| Item 8. | Financial Statements and Supplementary Data | 72 |
| Item 9. | Changes in and Disagreements with Accountants on Accounting and Financial Disclosure | 112 |
| Item 9A. | Controls and Procedures | 112 |
| Item 9B. | Other Information | 112 |
| PART III | ||
| Item 10. | Directors, Executive Officers and Corporate Governance | 112 |
| Item 11. | Executive Compensation | 112 |
| Item 12. | Security Ownership of Certain Beneficial Owners and Management and Related Stockholder Matters | 112 |
| Item 13. | Certain Relationships and Related Transactions and Director Independence | 112 |
| Item 14. | Principal Accounting Fees and Services | 112 |
| PART IV | ||
| Item 15. | Exhibits and Financial Statement Schedules | 113 |
| - 1 - |
PART I
In this Form 10-K, unless the context requires otherwise, (i) “Aeroflex Holding” refers to the issuer, Aeroflex Holding Corp., a holding company that was formerly known as AX Holding Corp., (ii) “Aeroflex” refers to Aeroflex Incorporated, a direct wholly owned subsidiary of Aeroflex Holding, together with its consolidated subsidiaries, (iii) “we”, “our”, “us” or the “Company” refer to Aeroflex Holding Corp. and its consolidated subsidiaries, including Aeroflex, (iv) the term “parent LLC” refers to VGG Holding LLC, which as of June 30, 2012 owned 76.6% of Aeroflex Holding’s common stock, (v) the term “Veritas Capital” refers to The Veritas Capital Fund III, L.P. and its affiliates, (vi) the term “Golden Gate Capital” refers to Golden Gate Private Equity, Inc. and its affiliates, (vii) the term “GS Direct” refers to GS Direct, L.L.C., (viii) the term “Sponsors” refers collectively to Veritas Capital, Golden Gate Capital and GS Direct, and to affiliates of and funds managed by these entities, (ix) the term “Going Private Transaction” refers to the acquisition of Aeroflex by the Sponsors on August 15, 2007, (x) the term “IPO” refers to the initial public offering of 19,789,180 shares of our common stock at a price of $13.50 per share, which was consummated in November 2010, (xi) the term “Sponsor Advisory Agreement” refers to our advisory agreement with affiliates of the Sponsors, under which we paid $2.8 million and $2.5 million during the years ended June 30, 2011 and 2010, respectively, prior to it being terminated in connection with the IPO, (xii) the term “senior secured credit facility” refers to the credit facility that we entered into on May 9, 2011 in connection with our debt refinancing as of such date, and which we amended on May 24, 2012, and (xiii) any “fiscal” year refers to the twelve months ended June 30 of the applicable year (for example, “fiscal 2012” refers to the twelve months ended June 30, 2012).
Because the Company’s market position and related matters have been determined based on management’s good faith reasonable estimates, statements about such items are noted in this report as a belief or as an estimate.
ITEM 1. BUSINESS
Our Company
We are a leading global provider of radio frequency, or RF, and microwave integrated circuits, components and systems used in the design, development and maintenance of technically demanding, high-performance wireless communication systems. Our solutions include highly specialized microelectronic components and test and measurement equipment used by companies in the (i) space, avionics and defense; (ii) commercial wireless communications; and (iii) medical and other markets. We have targeted customers in these end markets because we believe our solutions address their technically demanding requirements. We were founded in 1937 and have proprietary technology that is based on the extensive know-how of our approximately 675 engineers and experienced management team.
We provide a broad range of high margin products for specialized, high-growth end markets. The products we manufacture include a range of RF, microwave and millimeter wave microelectronic components, with a focus on high reliability, or HiRel, and radiation hardened, or RadHard, integrated circuits, or ICs, and analog and mixed-signal devices. We also manufacture a range of RF and microwave wireless radio and avionics test equipment and solutions particularly for the wireless, avionics and radio test markets. We believe that we have a top three global position on the basis of sales in product categories representing the majority of our revenue.
| - 2 - |
We believe that the combination of our leading market positions, broad product portfolio, engineering capabilities, and years of experience enables us to deliver differentiated, high value products to our customers and provides us with a sustainable competitive advantage. We believe most of our market segments have high barriers to entry due to the need for specialized design and development expertise, the differentiation provided by our proprietary technology and the significant switching and requalifying costs that our customers would incur to change vendors. We often design and develop solutions through a collaborative process with our customers whereby our microelectronic products or test solutions are designed, or "spec'd", into our customers' products or test procedures. Our major customers often use our products in multiple systems or programs, sometimes developed by different business units within the customer's organization. We have long standing relationships with a geographically diverse base of leading global companies including Alcatel Lucent, BAE Systems, Boeing, Cisco Systems, Ericsson, General Dynamics, ITT Exelis, Lockheed Martin, Motorola, Nokia, Northrop Grumman and Raytheon. For the fiscal year ended June 30, 2012, our largest customer represented approximately 7% of our net sales. In aggregate, for the fiscal year ended June 30, 2012, our top ten customers accounted for approximately 37% of our net sales.
We compete predominantly in the space, avionics, defense and commercial wireless communications markets. For the fiscal year ended June 30, 2012, approximately 67% of our net sales came from space, avionics and defense, 23% from commercial wireless communications and 10% from medical and other markets. Approximately 33% of sales for the fiscal year ended June 30, 2012 were to agencies of the U.S. government or to prime defense contractors or subcontractors of the U.S. government. Our products are sold primarily to customers in (i) the United States; (ii) Europe and the Middle East; and (iii) Asia, with sales to each of these regions accounting for 60%, 21% and 16%, respectively, of our net sales for fiscal year ended June 30, 2012. The information on sales based on our customers’ geographical location, sales by end markets, and sales and operating profits of our two industry segments for each of the three fiscal years in the period ended June 30, 2012, as well as information regarding total assets, is set forth in Note 21 of the notes to the consolidated financial statements.
After 46 years as a public company, we were acquired on August 15, 2007 in the Going Private Transaction by the Sponsors and certain members of our management. In November 2010, we consummated the IPO, in which we sold 19,789,180 shares of our common stock at a price of $13.50 per share.
Our backlog was $272.7 million as of June 30, 2012, compared to $294.3 million as of June 30, 2011. The majority of our backlog is expected to be recognized as revenue within one year.
| - 3 - |
Our Segments
We operate through two business segments: Aeroflex Microelectronic Solutions, or AMS, and Aeroflex Test Solutions, or ATS. We engineer, manufacture and market a diverse range of products in each of our segments.
| Aeroflex Microelectronic Solutions | Aeroflex Test Solutions | |||||
|
% of Net Sales in Fiscal 2012 |
54.5% | 45.5% | ||||
|
% of Gross Profit in Fiscal 2012 |
55.7% | 44.3% | ||||
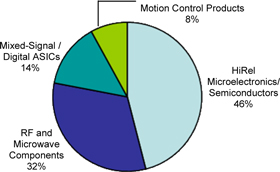
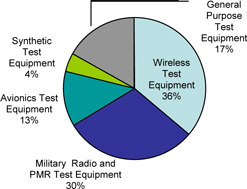
| Products | § | HiRel microelectronics/semiconductors | § | Wireless test equipment | ||
| § | RF and microwave components | § | Military radio and Private Mobile Radio, | |||
| § | Mixed-signal/digital ASICs | or PMR, test equipment | ||||
| § | Motion control products | § | Avionics test equipment | |||
| § | Synthetic test equipment | |||||
| § | General purpose test equipment | |||||
| Competitive Advantages | § | Leadership in microelectronic specialty products within our end markets, with a long history and proven track record | § | Leadership positions in specialty communications test equipment market segments with a long history and proven track record | ||
| § | Fabless semiconductor manufacturing model | § | High-performance products and technologies optimized for our target markets | |||
| § | High-performance, high reliability products optimized for our target markets | § | Integrated hardware/software design focus | |||
| § | Proprietary technologies in RF, microwave and millimeter wave development | § | Pioneer in synthetic testing market | |||
| § | Established long-term blue chip customer relationships | § | Established long-term blue chip customer relationships | |||
| § | High switching costs | |||||
| § | Class K and Class V certified by Defense Supply Center Columbus, or DSCC | |||||
| § | State-of-the-art design, test and assembly capabilities |
| Diverse Product Portfolio (% of Fiscal 2012 Net Sales by Segment) | ||
|
Aeroflex Microelectronic Solutions |
Aeroflex Test Solutions | |
 |
 | |
| - 4 - |
Aeroflex Microelectronic Solutions
AMS offers a broad range of microelectronics products and is a leading provider of high-performance, high reliability specialty products for the space, avionics, defense, commercial wireless communications, medical and other markets. Our strength in these markets stems from our success in the design and development of HiRel and RadHard products. RadHard products are specifically designed to tolerate high radiation level environments, which otherwise can degrade electronic components. The process by which electronic components for these harsh environments are designed, developed and manufactured differs materially from other established semiconductor manufacturing practices. As a result, we believe we are among a very limited number of vendors globally who have the expertise, proven history and established relationships to compete and win in our target markets.
We principally operate a fabless semiconductor manufacturing model, outsourcing virtually all front-end semiconductor fabrication activities to commercial foundries. We believe our fabless semiconductor manufacturing model provides us with a competitive advantage by significantly reducing our capital expenditures and labor costs, as well as enhancing our ability to respond quickly, in scope and scale, to changes in technology and customer needs. We utilize a variety of foundries that incorporate our proprietary design specifications and packaging techniques in the manufacturing of our products.
In order to meet our customers' needs, AMS' Plainview, New York and Colorado Springs, Colorado facilities are space certified and have been manufacturing Class K and Class V products for space, avionics and defense programs for approximately 20 years. Class K device manufacturing utilizes the highest quality and reliability for electronic parts through a number of specifications, standards and test methods. The additional requirements that define Class K address the specific needs of space users and are intended to provide more confidence to the customers that the device is of the highest initial quality and that any defective parts have been removed. To enhance access to customers in the European space market, we acquired Gaisler Research, in June 2008. Gaisler Research, located in Gothenburg, Sweden, designs and manufactures hi-reliability, high-performance, fault tolerant micro-processors.
AMS offers a broad range of complementary products that provide connectivity and computing functionality for applications that are characterized by their high-performance, high reliability requirements. Its product portfolio includes RF, microwave and millimeter wave products, including discrete components, ICs, monolithic microwave ICs and multi-chip modules. AMS also designs and manufactures application specific, high-performance analog and mixed-signal devices for use in medical, industrial and intelligent sensors.
For the fiscal year ended June 30, 2012, our AMS segment generated $366.7 million of our net sales and $188.7 million of our gross profit.
Aeroflex Test Solutions
ATS is a leading provider of a broad line of specialized test and measurement hardware and software products, primarily for the space, avionics, defense and commercial wireless communications. Our strength in test and measurement stems from our expertise with RF and microwave signals and innovative product design and development to meet the changing needs of our markets. ATS has hardware and software expertise across a number of wireless markets, including the cellular infrastructure, cellular device, mobile radio and satellite markets. ATS' products consist of flexible application software and multifunction hardware that our customers combine with industry-standard computers, networks and other third-party devices to create measurement, automation and embedded systems. This approach gives customers the ability to quickly and cost-effectively design, prototype and deploy unique custom-defined solutions for their design, control and test application needs.
Examples of ATS products and their applications include:
| · | wireless test equipment, which is used to develop and test wireless handsets and base stations; |
| - 5 - |
| · | military radio and PMR test equipment, which is used by radio manufacturers and military, police, fire, and emergency response units to test handheld radios; |
| · | avionics test equipment, which is used in the design, manufacture and maintenance of electronics systems for aircraft; |
| · | synthetic test equipment, which is used to test satellites and transmit / receive modules prior to launch and deployment; and |
| · | general purpose test equipment, including spectrum analyzers and signal generators. |
As technology continues to evolve and "next generation" communications protocols are introduced, equipment manufacturers and network providers need both test and measurement products that are compatible with the new technologies and products that work with older generation equipment. We have gained significant expertise in advanced RF and wireless technology through our focused research and development. One example is the Aeroflex 3000 Series, a modular test suite for mobile phone and general purpose wireless test using the PXI standard, which is a widely accepted standard for modular electronic instrumentation platforms. This product is tailored to the testing of wireless handsets and wireless base stations, where speed, repeatability and accuracy are critical. Also, as wireless infrastructure has evolved with the advent of fourth generation, or 4G networks, ATS has built capabilities around the main 4G standard, Long Term Evolution or LTE, and the subsequent protocol LTE(A) or Long Term Evolution Advanced.
For the fiscal year ended June 30, 2012, ATS generated $306.3 million of our net sales and $150.1 million of our gross profit.
Our Products Offered
Aeroflex Microelectronic Solutions
AMS' broad product portfolio has a longstanding, field-tested, history of reliable performance often characterized by long product life cycles and mission-critical functionality. AMS currently provides products in four functional families:
HiRel Microelectronics/Semiconductors. AMS provides HiRel standard and custom integrated circuits and circuit card assemblies for the aerospace, high reliability altitude avionics, medical, x-ray cargo scanners, critical transportation systems, nuclear power controls, GPS receivers, networking and telecommunication markets. AMS' HiRel products include transceivers, analog multiplexers, clock management generators, MSI logic products, battery electronics units, voltage regulators, high-speed power controllers, MIL-STD 1553 bus controllers, remote terminals, bus monitors, microcontrollers and microprocessors, RadHard Pulse Width Modulation Controllers, RadHard Resolver-to-Digital and memory modules. HiRel Microelectronics/ Semiconductors have a typical life cycle of 10-20 years, as estimated by management.
RF and Microwave Components. AMS provides a broad set of standard and application specific RF/microwave diodes and semiconductor devices. Microwave semiconductor products offered include diodes, amplifiers, resistors, inductors, capacitors, switches, and integrated devices. RF and Microwave active components and subsystems offered include PIN diode-based microwave control components, variable attenuators, phase shifters, limiters, time delay units and Multi-Function Microwave assemblies. AMS offers resistor products, which include a variety of low and high reliability power surface mounted passive devices for the wireless infrastructure and defense markets with applications in isolators, circulators, single and multi-carrier power amplifiers and circuits. Passive components offered include high quality, economically priced and Restriction of Hazardous Substances compliant attenuators, terminations, adapters, DC blocks, and other components for commercial, military and laboratory applications. Other products include power amplifiers, up and down converters, mixers, filters and micro-receivers operating to over 40GHz. RF and Microwave components have a typical life cycle of 5-15 years, as estimated by management.
| - 6 - |
Mixed-Signal/Digital ASICs. AMS provides custom ASICs for demanding environments such as space, medical, screening and industrial applications. RadHard ASICs and Mixed-Signal ASICs include a variety of digital and mixed-signal RadHard ASICs for HiRel applications including 130nHBD, 0.6um to 0.25um processes, QML V and QML Q with total ionizing rates from 100 kilorad to 1 megarad. Mixed-Signal/Digital ASICs have a typical life cycle of 5-15 years, as estimated by management.
Motion Control Products. Our motion control products provide complete and integrated motion control solutions for space (both military and commercial), military, avionics, and strategic industrial customers. AMS' current product line offerings include actuators and mechanisms, electronic controllers, slip rings and twist capsules, DC motors and Gimbal Systems. Motion control products have a typical life cycle of 10-20 years, as estimated by management.
Aeroflex Test Solutions
ATS is a leading provider of a broad line of specialized test and measurement equipment. Our solutions encompass a full spectrum of instrumentation from turnkey systems to standalone test sets to customized modular components and software. ATS currently provides test and measurement equipment across the following five product areas:
Wireless Test Equipment. Wireless Test Equipment is used by wireless service providers and equipment manufacturers to develop and test wireless handsets, base stations and evaluate network performance. We offer a wide selection of cellular tests across an array of wireless standards and communication frequencies, including the new 4G LTE protocols. Products include a broad range of system, protocol, physical layer and parametric test solutions, such as the TM500 test mobile, RF synthesizers, digitizers and combiners, and application software. In addition, ATS provides PXI-based products which are modular scalable solutions for the handset manufacturing environment. Product applications include research and development, conformance testing, manufacturing/production, installation and commissioning, field service, and network optimization. ATS' market leading product, the TM500, emulates a single or multi-handset environment and is used by most global infrastructure development organizations. Wireless Test Equipment products have a typical life cycle of 3-5 years, as estimated by management.
Military Radio and PMR Test Equipment. ATS Radio Test Equipment is used by radio manufacturers and military, police, fire and emergency response units to test handheld radio units. ATS provides TErrestrial Trunked RAdio, or TETRA, and Project 25, or P25, radio test equipment, addressing both mobile and repeater test applications. TETRA is a global standard for private mobile radio, or PMR, systems used by emergency services, public transport and utilities. P25 is a standard for digital radio communications for use by federal, state, private, and local public safety agencies in North America. Our military communications testing systems are primarily used by the U.S. military to test complex voice and data frequency hopping radios and accessories. Military radio and PMR test equipment has a typical life cycle of 5-20 years, as estimated by management.
Avionics Test Equipment. Avionics test equipment is used in the design, manufacture, test and maintenance of commercial, civil and military airborne electronic systems, or avionics. ATS equipment provides the stimulus and signals necessary for certification, verification, fault finding and diagnosis of airborne systems on the ground. For civil and commercial aviation, we have test solutions for various transponder modes, communications frequencies, emergency locator transmitters, weather radars and GPS systems. For military aviation, we have test solutions for microwave landing systems, tactical air navigation, enhanced traffic alert and collision avoidance systems, various identification friend or foe, or IFF, transponder/interrogator modes and IFF monopulse antenna simulation. ATS also provides customized avionics test solutions to support manual and automatic test equipment for manufacturing, repair and ground support operations. Avionics test equipment has a typical life cycle of 8-15 years, as estimated by management.
| - 7 - |
Synthetic Test Equipment. Synthetic test systems test several attributes through one "box" and can take multiple complex measurements simultaneously. ATS provides a highly integrated, turnkey, synthetic test environment that allows digital, analog, RF/microwave and power test of circuits, modules, subsystems and complete systems for commercial, military, and aerospace customers. ATS' STI 1000C+ and TRM 1000C products offer synthetic microwave test systems optimized for testing Transmit/Receive modules and satellite payloads in a factory setting. Our SMART^E and SMART^E 5300 products offer a modular approach for implementing multi-function configurable and reconfigurable test systems. Synthetic test solutions products have a typical life cycle of 10-15 years, as estimated by management.
General Purpose Test Equipment. ATS offers a variety of general purpose test solutions including microwave test solutions, counters and power meters. ATS microwave test solutions cover frequency ranges from 1 MHz to 46GHz, with various tracking, offset, continuous wave, modulated source, fault location, and group delay configuration options provided. ATS power meters are designed for field use, automated test equipment requirements and standard bench applications. General purpose test solutions have a typical life cycle of 4-7 years, as estimated by management.
Our Customers
AMS addresses value-added specialty markets requiring application specific, custom engineered, high-performance microelectronic solutions. The division has strong relationships with the five largest U.S. defense contractors, Boeing, General Dynamics, Lockheed Martin, Northrop Grumman and Raytheon, as well as with several other major defense-related technology companies, such as BAE Systems, Honeywell, ITT Exelis and United Technologies. Certain of our customers, such as BAE Systems and Honeywell, are also our competitors due to their in-house capabilities. AMS customers also include communications equipment OEMs such as Cisco Systems and Ericsson.
ATS addresses value-added specialty markets requiring application specific, custom engineered, high-performance testing solutions. ATS customers also include wireless handset and infrastructure OEMs, including Alcatel Lucent, Ericsson, Huawei, LG, Motorola Mobility, Nokia Siemens and ZTE. The division also has strong relationships with several major defense-related technology companies, including Lockheed Martin, Boeing, Northrop Grumman and Raytheon.
Government Sales
Approximately 33% of sales for the fiscal year ended June 30, 2012 were to agencies of the U.S. government or to prime defense contractors or subcontractors of the U.S. government. These government contracts have been awarded either on a bid basis or after negotiation. These contracts generally provide for fixed prices and have customary provisions for termination at the convenience of the government without cause.
Competition
We compete primarily on the basis of technology and performance. For certain products, we also compete on the basis of price. Some of our competitors are well-established and have greater market share and manufacturing, financial, research and development and marketing resources than we do. We also compete with emerging companies that are attempting to sell their products in specialized markets, and with the internal capabilities of many of our significant customers, including BAE Systems and Honeywell. In addition, a significant portion of our contracts, including those with the federal government and commercial customers, are subject to commercial bidding, both upon initial issuance and subsequent renewal.
AMS primarily competes with large defense-related technology providers, including BAE Systems and Honeywell. In addition, AMS competes with a number of specialty semiconductor providers, including Hittite Microwave Corporation, ILC / Data Devices Corporation and Microsemi. We believe we are one of the largest providers of specialty microelectronics to our targeted markets and that we are the leading global fabless platform of scale in RadHard semiconductors. Additionally, in the RF and Microwave market segment, AMS competes with companies such as Anaren. However, we believe our specialized expertise in RadHard technology, RF and microwave design and development and fabrication expertise provides us with a differentiated technology and pricing position versus our most direct competitors. We typically maintain close and longstanding relationships with our customers and maintain sole source/primary supplier positions with certain customers.
| - 8 - |
ATS primarily competes with a number of specialty test and measurement providers, including Agilent, Anritsu, National Instruments, Rohde & Schwarz and Spirent. We believe our specialized expertise in high-performance RF and wireless testing equipment and our focus on delivery of advanced testing platforms and optimized manufacturing capability sets us apart from our most direct competitors. We believe we continue to maintain the largest installed base of any of our competitors in the specialized test categories in which we compete including many sole source/primary supplier positions with certain customers. In the general purpose test equipment and other markets, our competitors include Agilent Technologies and National Instruments.
Research and Development
As of June 30, 2012, we had approximately 675 engineers conducting research and development activities at 17 of our facilities. Our research and development efforts primarily involve engineering and design relating to:
| · | developing new products; |
| · | improving existing products; |
| · | adapting existing products to new applications; and |
| · | developing prototype components to bid on specific programs. |
We emphasize research and development efforts for products in both the AMS and ATS divisions. In AMS, we have focused our research and development initiatives on the continued enhancement of our high value power management products and subsystems, microwave/RF modules and microreceivers which has enabled us to increase the dollar content of our products embedded into modern satellites. In ATS, we are developing technologies that are used in the next generation of wireless infrastructure. Our research and development consists of self-funded research and development as well as research and development we conduct on behalf of our customers.
Certain product development and similar costs are recoverable under contractual arrangements and those that are not recoverable are expensed in the year incurred. We invested $89.8 million in self-funded research and development for the fiscal year ended June 30, 2012, compared to $90.1 million for the fiscal year ended June 30, 2011. We also seek to strategically acquire businesses or license certain proven commercial technology to apply to our target markets.
Manufacturing
The AMS division primarily operates under a fabless semiconductor manufacturing model, outsourcing substantially all semiconductor fabrication activities to commercial foundries, which significantly reduces our capital expenditures and labor costs and enhances our ability to respond quickly with scalability to changes in technology and customer demands. We purchase our semiconductors from a variety of foundries, which utilize our proprietary design specifications and packaging techniques to manufacture our RadHard products. We test certain of our RadHard products in our in-house radiation simulation testing chamber.
AMS has 11 primary manufacturing facilities throughout the United States, as well as one in China. In AMS' largest facility, Colorado Springs, Colorado, we design and develop our RadHard solutions in addition to a broad range of products for avionics and space applications. AMS manufactures advanced MCMs for airborne, space, shipboard, ground based and commercial avionics and telecommunications systems in its Plainview, New York, facility. The remaining facilities are used to produce RadHard solutions, RF and microwave products and aerospace motion control solutions.
| - 9 - |
We manufacture products for aerospace and defense programs in compliance with stringent military specifications. Most of our manufacturing plants are ISO-9001 certified, and our Plainview, New York, Hauppauge, New York, and Colorado Springs, Colorado, facilities are also certified to the more stringent AS9100 standard.
ATS has five primary manufacturing facilities throughout the United States, as well as one in England. In ATS' largest facility, Wichita, Kansas, we design and develop a wide range of test instrumentation for military radio and avionics. In ATS' Stevenage, England facility, we produce wireless systems test technologies and also provide test solutions with expertise in signal generators, signal analyzers, microwaves and automatic test equipment. The remaining facilities focus on synthetic testing solutions and other wireless communications and automated testing equipment.
Many of the component parts we use in our products are purchased, including semiconductors, transformers and amplifiers. Although we may obtain certain components and materials from a limited group of suppliers, all the materials and components we use, including those purchased from a sole source, are readily available and are, or can be, purchased in the open market. We have no long-term purchase commitments and no supplier provided more than 10% of our raw materials during fiscal 2012.
Capital expenditures as a percentage of sales were 3.2%, 3.6% and 3.2% for fiscal 2012, 2011 and 2010, respectively.
Sales
We employ a team-based sales approach to closely manage relationships at multiple levels of the customer's organization, including management, engineering and purchasing personnel. This integrated sales approach involves a team consisting of a senior executive, a business development specialist and members of our engineering group. Our use of experienced engineering personnel as part of the sales effort enables close technical collaboration with our customers during the design and qualification phase of new technologies and equipment. We believe that this is critical to the integration of the product into the customer's equipment. Manufacturers' representatives and independent sales representatives are also used as needed. Each of the businesses that comprise the AMS segment has its own sales organization, whereas the ATS segment has a common sales force to service its global market. As of June 30, 2012, we had approximately 250 sales people employed domestically and internationally.
Seasonality
Historically our net sales and earnings increase sequentially from quarter to quarter within a fiscal year, but the first quarter is typically less than the previous year’s fourth quarter.
Our Employees
As of June 30, 2012, we had approximately 2,800 employees, of whom 1,400 were employed in a manufacturing capacity, and 1,400 were employed in engineering, sales or administrative positions. Approximately 100 of our employees are covered by a collective bargaining agreement. The collective bargaining agreement expires September 30, 2013. We believe that our employee relations are satisfactory.
Intellectual Property
In order to protect our intellectual property rights, we rely on a combination of patent, trade secret, copyright and trademark laws and employee and third-party nondisclosure agreements. We believe that while the protection afforded by patent, trade secret, copyright and trademark laws may provide some advantages, the competitive position of participants in our industry is principally determined by such factors as the technical and creative skills of their personnel, the frequency of their new product developments and their ability to anticipate and rapidly respond to evolving market requirements. Therefore, we have focused our efforts principally on developing substantial expertise and know-how in our industry, and protecting that know-how with confidentiality agreements and trade secrets.
| - 10 - |
We consider the protection of our proprietary technology to be an important element of our business. We limit access to and distribution of our proprietary information. We attempt to protect our intellectual property rights, both in the United States and in foreign countries, through a combination of patent, trademark and trade secret laws, as well as confidentiality agreements. Because of the differences in foreign trademark, patent and other laws concerning proprietary rights, our intellectual property rights may not receive the same degree of protection in foreign countries as they would in the United States.
We have from time to time applied for patent protection relating to certain existing and proposed products, processes and services, but we do not have an active patent application strategy. When we do apply for patents, we generally apply in those countries where we intend to make, have made, use or sell patented products.
Some of our proprietary technology may have been developed under, or in connection with, U.S. government contracts or other federal funding agreements. With respect to technology developed under such agreements, the U.S. government may retain a nonexclusive, non-transferable, irrevocable, paid-up license to use the technology on behalf of the United States throughout the world. In addition, the U.S. government may obtain additional rights to such technology, or our ability to exploit such technology may be limited.
We rely on our trademarks, tradenames and brand names to distinguish our products and services from the products and services of our competitors, and have registered or applied to register many of these trademarks.
We also rely on unpatented proprietary technology. It is possible that others will independently develop the same or similar technology or otherwise obtain access to our unpatented technology. To protect our trade secrets and other proprietary information, we require employees, consultants, advisors and collaborators to enter into confidentiality agreements. We periodically evaluate our confidentiality policies and procedures, and believe that we have adequate protections in place.
In addition to our own intellectual property, we have an active program of licensing third-party technologies to be developed into new products. In many cases, we make substantial up-front payments to procure such technology. We generally attempt to license third-party technology for so long as practicable and have acquired six licenses that make the technology acquired available to us for periods of up to twenty years.
Regulation
- Environmental
Our operations are subject to various federal, state, local, and foreign environmental laws, ordinances and regulations that limit discharges into the environment, establish standards for the handling, generation, use, emission, release, discharge, treatment, storage and disposal of, or exposure to, hazardous materials, substances and waste, and require cleanup of contaminated soil and groundwater. These laws, ordinances and regulations are complex, change frequently and have tended to become more stringent over time.
We believe that we are in material compliance with all environmental laws, do not anticipate any material expenditure to meet current or pending environmental requirements, and generally believe that our processes and products do not present any unusual environmental concerns. We are unaware of any existing, pending or threatened contingent liability that may have a material adverse effect on our ongoing business operations.
| - 11 - |
In March 2005, we sold the net assets of our shock and vibration control device manufacturing business, which we refer to as VMC. Under the terms of the sale agreements, we retained certain liabilities relating to adverse environmental conditions that existed at the premises occupied by VMC as of the date of sale. See Item 3 - "Legal Proceedings" with respect to the accrued liability.
- Workplace Safety
Our operations are also governed by laws and regulations relating to workplace safety and worker health. We believe we are in material compliance with these laws and regulations and do not believe that future compliance with such laws and regulations will have a material adverse effect on our results of operations or financial condition. We also believe that we are in material compliance with all applicable labor regulations.
- ITAR and Export Controls
We are subject to International Traffic in Arms Regulation, or ITAR. ITAR requires export licenses from the U.S. Department of State for products shipped outside the U.S. that have military or strategic applications. In this connection, we have filed certain Voluntary Disclosures with the Directorate of Defense Trade Controls, U.S. Department of State, describing possible inadvertent violations. We have also identified other ITAR noncompliance in the pre-acquisition business activities of certain acquired companies. These matters have been formally disclosed to the U.S. Department of State. See Item 3 - "Legal Proceedings".
We are also subject to the Export Administration Regulations, or EAR. The EAR regulates the export of certain "dual use" items and technologies and, in some instances, requires a license from the U.S. Department of Commerce.
- Government Contracting Regulations
Because we have contracts with the federal government and its agencies, we are subject to audit from time to time of our compliance with government regulations by various agencies, including the Defense Contract Audit Agency, or DCAA. The DCAA reviews the adequacy of, and a contractor's compliance with, its internal control systems and policies, including the contractor's purchasing, property, estimating, compensation and management information systems. The DCAA has the right to perform audits on our incurred costs on all contracts on a yearly basis.
Other governmental agencies, including the Defense Securities Service and the Defense Logistics Agency, may also, from time to time, conduct inquiries or investigations regarding a broad range of our activities.
Our principal products or services do not require any governmental approval, except for the requirement that we obtain export licenses for certain of our products.
Available Information
We file reports with the SEC. The public may read and copy any materials filed by us with the SEC at the SEC’s public reference room at 100 F Street, NE, Washington, D.C. 20549. The public may obtain information about the operation of the SEC’s public reference room by calling the SEC at 1-800-SEC-0330. The SEC also maintains an internet site at www.sec.gov that contains reports, proxy and information statements and other information about issuers like us that file electronically with the SEC.
In addition, we make available free of charge on our website at www.aeroflex.com our annual report on Form 10-K, quarterly reports on Form 10-Q, current reports on Form 8-K and amendments to those reports filed or furnished pursuant to Section 13(a) or 15(d) under the Exchange Act as soon as reasonably practical after we electronically file such material with, or furnish it to, the SEC.
Information appearing on our website is not a part of, and is not incorporated by reference in, this Form 10-K.
| - 12 - |
| ITEM 1A. | RISK FACTORS |
Risks Relating to our Business
Our operating results may fluctuate significantly on a quarterly basis.
Our sales and other operating results have fluctuated significantly in the past, and we expect this trend will continue. Factors which affect our results include:
| • | the timing, cancellation or rescheduling of customer orders and shipments; |
| • | the pricing and mix of products sold; |
| • | our ability to obtain components and subassemblies from contract manufacturers and suppliers; |
| • | variations in manufacturing efficiencies; and |
| • | research and development and new product introductions. |
Many of these factors are beyond our control. Our performance in any one fiscal quarter is not necessarily indicative of any financial trends or future performance.
The cyclicality of our end user markets could harm our financial results.
Many of the end markets we serve, including but not limited to the commercial wireless market, have historically been cyclical and have experienced periodic downturns. The factors leading to and the severity and length of a downturn are very difficult to predict and there can be no assurance that we will appropriately anticipate changes in the underlying end markets we serve or that any increased levels of business activity will continue as a trend into the future. If we fail to anticipate changes in the end markets we serve, our business, results of operations and financial condition could be materially adversely affected.
We rely on sales to federal government entities under prime contracts and subcontracts. A loss or reduction of such contracts, a failure to obtain new contracts or a reduction of sales under such contracts could have a material adverse effect on our business.
We derived approximately 33% of our net sales for the fiscal year ended June 30, 2012 from contracts with agencies of the federal government or subcontracts with prime defense contractors or subcontractors of the federal government. The loss or significant curtailment of any of these government contracts or subcontracts, or failure to exercise renewal options or enter into new contracts or subcontracts, could have a material adverse effect on our business, results of operations and financial condition. Continuation and the exercise of renewal options on existing government contracts and subcontracts and new government contracts and subcontracts are, among other things, contingent upon the availability of adequate funding for the various federal government agencies with which we and prime government contractors do business. Changes in federal government spending could directly affect our financial performance. Among the factors that could impact federal government spending and which would reduce our federal government contracting and subcontracting business are:
| • | a significant decline in, or reapportioning of, spending by the federal government; |
| • | changes, delays or cancellations of federal government programs or requirements; |
| - 13 - |
| • | the adoption of new laws or regulations that affect companies that provide services to the federal government; |
| • | federal government shutdowns or other delays in the government appropriations process; |
| • | curtailment of the federal government’s use of third-party service firms; |
| • | changes in the political climate, including with regard to the funding or operation of the services we provide; and |
| • | general economic conditions. |
The current administration and Congress are under increasing pressure to reduce the federal budget deficit. This could result in a general decline in U.S. defense spending and could cause federal government agencies to reduce their purchases under contracts, exercise their rights to terminate contracts in whole or in part, to issue temporary stop work orders or decline to exercise options to renew contracts, all of which could harm our operations and significantly reduce our future revenues.
Our future operating results are dependent on the growth in our customers’ businesses and on our ability to identify and enter new markets.
Our growth is dependent on the growth in the sales of our customers’ products as well as the development by our customers of new products. If we fail to anticipate changes in our customers’ businesses and their changing product needs or successfully identify and enter new markets, our results of operations and financial position could be negatively impacted. We cannot assure you that the markets we serve will grow in the future, that our existing and new products will meet the requirements of these markets or that we can maintain adequate gross margins or profits in these markets. A decline in demand in one or several of our end-user markets could have a material adverse impact on the demand for our products and have a material adverse effect on our business, results of operations and financial condition.
Our industry is highly competitive and if we are not able to successfully compete, we could lose market share and our revenues could decline.
We operate in a highly competitive industry. Current and prospective customers for our products evaluate our capabilities against the merits of our direct competitors. We compete primarily on the basis of technology and performance. For certain products, we also compete on price. Some of our competitors are well-established and have greater market share and manufacturing, financial, research and development and marketing resources than we do. We also compete with emerging companies that are attempting to sell their products in specialized markets, and with the internal capabilities of many of our significant customers, including BAE and Honeywell. There can be no assurance that we will be able to maintain our current market share with respect to any of our products. A loss of market share to our competitors could have a material adverse effect on our business, results of operations and financial condition. In addition, a significant portion of our contracts, including those with the federal government and commercial customers, are subject to commercial bidding, both upon initial issuance and subsequent renewal. If we are unable to successfully compete in the bidding process or if we fail to obtain renewal, our business, results of operations and financial condition could be materially adversely affected.
Our industry is characterized by rapid technological change, and if we cannot continue to develop, manufacture and market innovative products that meet customer requirements for performance and reliability, we may lose market share and our net sales may suffer.
The process of developing new products for our markets is complex and uncertain, and failure to keep pace with our competitors’ technological development, to develop or obtain appropriate intellectual property and to anticipate customers’ changing needs and emerging technological trends accurately could significantly harm our results of operations. We must make long-term investments and commit significant resources before knowing whether our predictions will eventually result in products that the market will accept. We must accurately forecast volumes, mix of products and configurations that meet customer requirements, and we may not succeed. If we do not succeed, we may be left with inventories of obsolete products or we may not have enough of some products available to meet customer demand, which could lead to reduced sales and higher expenses.
| - 14 - |
We design custom products to meet specific requirements of our customers. The amount and timing of revenue from such products can affect our quarterly operating results.
The design and sales cycle for our custom products, from initial contact by our sales force to the commencement of shipments of those products in commercial quantities, may be lengthy. In this process, our sales and application engineers work closely with the customer to analyze the customer’s system requirements and establish a technical specification for the custom product. We then select a process, evaluate components, and establish assembly and test procedures before manufacturing in commercial quantities can begin. The length of this cycle is influenced by many factors, including the difficulty of the technical specification, the novelty and complexity of the design and the customer’s procurement processes. Our customers typically do not commit to purchase significant quantities of the custom product until they are ready to commence volume shipments of their own system or equipment. Our receipt of substantial revenue from sales of a custom product often depends on that customer’s commercial success in manufacturing and selling its system or equipment that incorporates our custom product. As a result, a significant period may elapse between our investment of time and resources in designing and developing a custom product and our receipt of substantial revenue from sales of that custom product.
The length of this process may increase the risk that a customer will decide to cancel or change its plans related to its system or equipment. Such a cancellation or change in plans by a customer could cause us to lose anticipated sales. In addition, our business, results of operations and financial condition could be materially adversely affected if a significant customer curtails, reduces or delays orders during our sales cycle, chooses not to release its system or equipment that contains our custom products, or is not successful in the sale and marketing of its system or equipment that contains our custom products.
Additionally, some customers may be unlikely to change their supplier due to the significant costs associated with qualifying a new supplier and potentially redesigning their system or equipment. So, if we fail to achieve initial design wins in the customer’s qualification process, we may not regain the opportunity for significant sales to this customer for a lengthy period of time.
The global recession and potential for tightened credit markets could once again adversely affect us.
The current global recession, due in part to failures of financial institutions, have resulted in unprecedented government intervention in the U.S., Europe and other regions of the world. If macro-economic concerns were to worsen, credit markets could begin to tighten once again. In turn, our customers could experience heightened financial difficulties and, as a result, could modify, delay or cancel plans to purchase our products or services, which could cause our sales to decline, or become unable to make payment to us for amounts due and owing. In addition, our suppliers could experience credit or other financial difficulties that could result in delays in their ability to supply us with necessary raw materials, components or finished products. These risks may make it extremely difficult for our customers, our suppliers and us to accurately forecast and plan future business activities and could result in an asset impairment. The occurrence of any of these factors could have a material adverse effect on our business, results of operations and financial condition. For example, our sales declined by approximately $56 million, or approximately 8%, between fiscal 2011 and fiscal 2012. In addition we wrote-off $56.7 million of goodwill and other long lived assets related to our RF and microwave reporting unit in fiscal 2012 due to the decrease in sales and prospects of that unit in the then current economic environment.
| - 15 - |
As of June 30, 2012, one of our reporting units, Plainview – ATS, had goodwill of $21.3 million and an enterprise carrying value of $33.5 million. We determined if there was an impairment by comparing the fair value of the reporting unit with its enterprise carrying value. Based on our current analysis of the discounted estimated cash flows of this unit, we have estimated that the fair value of this unit was approximately $35.4 million at June 30, 2012 and that the goodwill has not been impaired. However, should actual results differ from our forecasts of cash flows and our estimated enterprise fair value decreases below the carrying value, then an impairment may occur and we would need to calculate the amount of the write-down of goodwill by comparing the implied fair value of the reporting unit’s goodwill (the excess of the fair value of the reporting unit over the fair value of its net identifiable assets) with the carrying amount of that goodwill.
Our major customers account for a sizable portion of our revenue, and the loss of, or a reduction in, orders from these customers could result in a decline in revenue.
Revenue derived from our ten largest customers as a percentage of our annual revenue was 37% for the fiscal year ended June 30, 2012. For the fiscal year ended June 30, 2012, sales to our largest customer represented approximately 7% of our net sales. Our major customers often use our products in multiple systems or programs, sometimes developed by different business units within the customer’s organization, each having differing product life cycles, end customers and market dynamics. While the composition of our top ten customers varies from year to year, we expect that sales to a limited number of customers will continue to account for a significant percentage of our revenue for the foreseeable future. It is possible that any of our major customers could terminate its purchasing arrangements with us or significantly reduce or delay the amount of our products that it orders, purchase products from our competitors or develop its own products internally. The loss of, or a reduction in, orders from any major customer could cause a decline in our overall revenue and have a material adverse effect on our business, results of operations and financial condition.
In the event that certain of our customers encounter financial difficulties and fail to pay us, it could adversely affect our business, results of operations and financial condition.
We manufacture products to customer specifications and generally purchase raw materials in response to customer orders. In addition, we may commit significant amounts of capital to maintain inventory in anticipation of customer orders. In the event that our customers, for whom we maintain inventory, experience financial difficulties, we may be unable to sell such inventory at its current profit margin, if at all. In such an event, our gross margins would decline. In addition, if the financial condition of a significant portion of our customer base deteriorates, resulting in an impairment of their ability to pay us amounts owed in respect of a significant amount of outstanding receivables, our business, results of operations and financial condition could be materially adversely affected.
Federal government contracts may be terminated by the federal government at any time prior to their completion and contain other unfavorable provisions, which could lead to unexpected loss of sales and reduction in backlog.
Under the terms of federal government contracts, the federal government may unilaterally:
| • | terminate or modify existing contracts; |
| • | reduce the value of existing contracts through partial termination; |
| • | delay the payment of our invoices by government payment offices; |
| • | audit our contract-related costs; and |
| • | suspend us from receiving new contracts pending resolution of any alleged violations of procurement laws or regulations. |
| - 16 - |
The federal government can terminate or modify any of its contracts with us or its prime contractors either for its convenience or if we or its prime contractors default by failing to perform under the terms of the applicable contract. A termination arising out of our default could expose us to liability and have a material adverse effect on our ability to compete for future contracts and subcontracts. If the federal government or its prime contractors terminate and/or materially modify any of our contracts or if any applicable options are not exercised, our failure to replace sales generated from such contracts would result in lower sales and could adversely affect our earnings, which could have a material adverse effect on our business, results of operations and financial condition.
Our backlog as of June 30, 2012 was $272.7 million, of which approximately 42% represented firm contracts with agencies of the U.S. government or prime defense contractors or subcontractors of the U.S. government. There can be no assurance that any of the contracts comprising our backlog will result in actual sales in any particular period or that the actual sales from such contracts will equal our backlog estimates. Furthermore, there can be no assurance that any contract included in our backlog that generates sales will be profitable.
Our business could be adversely affected by a negative audit or other actions, including suspension or debarment, by the federal government.
As a federal government contractor, we must comply with and are affected by laws and regulations relating to the formation, administration and performance of government contracts. These laws and regulations affect how we do business with the federal government and our prime government contractors and subcontractors, and in some instances, impose added costs on our business. Federal government agencies routinely audit and investigate government contractors. These agencies review each contractor’s contract performance, cost structure and compliance with applicable laws, regulations and standards. Such agencies also review the adequacy of, and a contractor’s compliance with, its internal control systems and policies, including the contractor’s purchasing, property, estimating, compensation and management information systems. Any costs found to be improperly allocated to a specific contract will not be reimbursed.
In addition, government contract payments received by us for allowable direct and indirect costs are subject to adjustment after audit by government auditors and repayment to the government if the payments exceed allowable costs as defined in the government contracts.
As a federal government contractor, we are subject to an increased risk of investigations, criminal prosecution, civil fraud, whistleblower lawsuits and other legal actions and liabilities to which companies with solely commercial customers are not subject, the results of which could have a material adverse effect on our operations. If we were suspended or prohibited from contracting with the federal government generally, or any significant federal government agency specifically, if our reputation or relationship with federal government agencies were impaired or if the federal government otherwise ceased doing business with us or significantly decreased the amount of business it does with us, our business, results of operations and financial condition could be materially adversely affected.
Under some of our government contracts, we are required to maintain secure facilities and to obtain security clearances for personnel involved in performance of the contract, in compliance with applicable federal standards. If we were unable to comply with these requirements, or if personnel critical to our performance of these contracts were to lose their security clearances, we might be unable to perform these contracts or compete for other projects of this nature, which could adversely affect our revenue.
| - 17 - |
Our federal government contracts are subject to competitive bidding, both upon initial issuance and subsequent renewal. If we are unable to successfully compete in the bidding process or if we fail to receive renewal, it could have a material adverse effect on our business, results of operations and financial condition.
A significant portion of our federal government contracts are awarded through a competitive bidding process, including upon renewal, and we expect that this will continue to be the case. There often is significant competition and pricing pressure as a result of this process.
The competitive bidding process presents a number of risks such as:
| • | we must expend substantial funds and time to prepare bids and proposals for contracts, which could detract attention from other parts of our business; |
| • | we may be unable to estimate accurately the resources and cost that will be required to complete any contract we win, which could result in substantial cost overruns; and |
| • | we may encounter expense and delay if our competitors protest or challenge awards of contracts to us, and any such protest or challenge could result in a requirement to resubmit bids on modified specifications or in termination, reduction or modification of the awarded contract. |
The government contracts for which we compete typically have multiple option periods, and if we fail to win a contract, we generally will be unable to compete again for that contract for several years. If we fail to win new contracts or to receive renewal contracts, such failure could have a material adverse effect on our business, results of operations and financial condition.
New products are subject to greater technology, design and operational risks, and a delay in introducing new products could harm our competitive position.
Our future success is highly dependent upon the timely development and introduction of competitive new products at acceptable margins. However, there are greater design and operational risks associated with new products. The inability of our suppliers to produce advanced products, delays in commencing or maintaining volume shipments of new products, the discovery of product, process, software, or programming defects or failures and any related product returns could each have a material adverse effect on our business, financial condition, and results of operation.
We have experienced from time to time in the past, and expect to experience in the future, difficulties and delays in achieving satisfactory, sustainable yields on new products. Yield problems increase the cost of our new products as well as the time it takes us to bring them to market, which can create inventory shortages and dissatisfied customers. Any prolonged inability to obtain adequate yields or deliveries of new products could have a material adverse effect on our business, results of operations and financial condition.
Our failure to detect unknown defects in our products could materially harm our relationship with customers, our reputation and our business.
We may not be able to anticipate all of the possible performance or reliability problems that could arise with our existing or new products, which could result in significant product liability or warranty claims. In addition, any defects found in our products could result in a loss of sales or market share, failure to achieve market acceptance, injury to our reputation, indemnification claims, litigation, increased insurance costs and increased service costs, any of which could discourage customers from purchasing our products and materially harm our business.
Our purchase agreements with our customers typically contain provisions designed to limit our exposure to potential product liability claims. However, the limitation of liability provisions contained in these agreements may not be effective as a result of federal, state or local laws, or ordinances or unfavorable judicial decisions in the United States or other countries. The insurance we maintain to protect against claims associated with the use of our products may not adequately cover all claims asserted against us. In addition, even if ultimately unsuccessful, such claims could result in costly litigation, divert our management’s time and resources, and damage our customer relationships.
| - 18 - |
Our AMS segment depends on third-party contractors to fabricate semiconductor products and we outsource other portions of our business; a failure to perform by these third parties may adversely affect our ability to bring products to market and damage our reputation.
As part of our efforts to minimize the amount of required capital investment in facilities, equipment and labor and increase our ability to quickly respond to changes in technology and customer requirements, our AMS segment outsources its semiconductor fabrication processes and we outsource certain other manufacturing and engineering functions to third parties. This reliance on third-party manufacturers and engineers involves significant risks, including lack of control over capacity allocation, delivery schedules, the resolution of technical difficulties and the development of new processes. We rely heavily on our third-party manufacturers to be able to deliver materials, know-how and technology to us without encumbrances. Disputes regarding the ownership of or rights in certain third-party intellectual property may preclude our third-party manufacturers from fulfilling our requirements at a reasonable cost or, in some cases, at all. A shortage of raw materials or production capacity could lead any of our third-party manufacturers to allocate available capacity to other customers, or to internal uses. If these third parties fail to perform their obligations in a timely manner or at satisfactory quality and cost levels, our ability to bring products to market and our reputation could suffer and our costs could increase. For example, during a market upturn, our contract manufacturers may be unable to meet our demand requirements, which may preclude us from fulfilling our customers’ orders on a timely basis, which could lead to a loss in sales. The ability of these third parties to perform is largely outside of our control.
Non-performance by our suppliers may adversely affect our operations.
Because we purchase various types of raw materials and component parts from suppliers, we may be materially and adversely affected by the failure of those suppliers to perform as expected. This non-performance may consist of delivery delays or failures caused by production issues or delivery of non-conforming products. The risk of non-performance may also result from the insolvency or bankruptcy of one or more of our suppliers. Our efforts to protect against and to minimize these risks may not always be effective. We may occasionally seek to engage new suppliers with which we have little or no experience. The use of new suppliers can pose technical, quality and other risks.
We use specialized technologies and know-how to design, develop and manufacture our products. Our inability to protect our intellectual property could hurt our competitive position, harm our reputation and adversely affect our results of operations.
As a technology company, we rely on our patents, trademarks, copyrights, trade secrets, and proprietary know-how and concepts. We attempt to protect our intellectual property rights, both in the United States and in foreign countries, through a combination of patent, trademark, copyrights and trade secret laws, as well as confidentiality agreements. Because of the differences in foreign trademark, copyright, patent and other laws concerning proprietary rights, our intellectual property rights may not receive the same degree of protection in foreign countries as they would in the United States. Our failure to obtain or maintain adequate protection of our intellectual property rights for any reason could have a material adverse effect on our business, results of operations and financial condition. We believe that while the protection afforded by patent, trademark, copyright and trade secret laws may provide some advantages, the competitive position of participants in our industry is principally determined by such factors as the technical and creative skills of their personnel, the frequency of their new product developments and their ability to anticipate and rapidly respond to evolving market requirements. To the extent that a competitor effectively uses its intellectual property portfolio, including patents, to prevent us from selling products that allegedly infringe such competitor’s products, our results of operations could be materially adversely affected.
| - 19 - |
We have from time to time applied for patent protection relating to certain existing and proposed products, processes and services, but we do not have an active patent application strategy. When we do apply for patents, we generally apply in those countries where we intend to make, have made, use or sell patented products; however, we may not accurately predict all of the countries where patent protection will ultimately be desirable. If we fail to timely file a patent application in any such country, we may be precluded from doing so at a later date. Furthermore, we cannot be assured that any of our patent applications will be approved. We also cannot be assured that the patents issued as a result of our foreign patent applications will have the same scope of coverage as our United States patents. The patents we own could be challenged, invalidated or circumvented by others and may not be of sufficient scope or strength to provide us with any meaningful protection or commercial advantage. Further, we cannot be assured that competitors will not infringe our patents, or that we will have adequate resources to enforce our patents.
Some of our proprietary technology may have been developed under, or in connection with, U.S. government contracts or other federal funding agreements. With respect to technology developed under such agreements, the U.S. government may retain a nonexclusive, non-transferable, irrevocable, paid-up license to use the technology on behalf of the United States throughout the world. In addition, the U.S. government may obtain additional rights to such technology, or our ability to exploit such technology may be limited.
We rely on our trademarks, tradenames and brand names to distinguish our products and services from the products and services of our competitors, and have registered or applied to register many of these trademarks. In the event that our trademarks are successfully challenged, we could be forced to rebrand our products and services, which could result in loss of brand recognition, and could require us to devote resources towards marketing new brands. Further, we cannot be assured that we will have adequate resources to enforce our trademarks.
We also rely on unpatented proprietary technology. It is possible that others will independently develop the same or similar technology or otherwise obtain access to our unpatented technology. To protect our trade secrets and other proprietary information, we require employees, consultants, advisors and collaborators to enter into confidentiality agreements. We cannot be assured that these agreements will provide meaningful protection for our trade secrets, know-how or other proprietary information in the event of any unauthorized use, misappropriation or disclosure of such trade secrets, know-how or other proprietary information. If we are unable to maintain the proprietary nature of our technologies, our sales could decrease.
If third parties claim that we infringe upon or misappropriate their intellectual property rights, our net sales, gross margins and expenses could be adversely affected.
We face the risk of claims that we have infringed or misappropriated third parties’ intellectual property rights. We have been or are currently involved in various litigation matters involving claims of patent infringement and trade secret misappropriation. Any claims of patent or other intellectual property infringement, even those without merit, could:
| • | be expensive and time consuming to defend; |
| • | cause us to cease making or using products that incorporate the challenged intellectual property; |
| • | require us to redesign, reengineer or rebrand our products, if feasible; |
| • | divert management’s attention and resources; and |
| • | require us to enter into licensing agreements in order to obtain the right to use a third party’s intellectual property. |
Any licensing agreements, if required, may not be available to us on acceptable terms or at all. A successful claim of infringement against us could result in our being required to pay significant damages, enter into costly license agreements, or stop the sale of certain products, which could adversely affect our net sales, gross margins and expenses and harm our future prospects.
| - 20 - |
Many patent applications in the United States are maintained in secrecy for a period of time after they are filed, and therefore there is a risk that we could adopt a technology without knowledge of a pending patent application, which technology would infringe a third party patent once that patent is issued.
We license third-party technologies for the development of certain of our products, and if we fail to maintain these licenses and are unable to secure alternative licenses on reasonable terms, our business could be adversely affected.
We license third-party technologies that are integrated into certain of our products. If we are unable to continue to use or license these technologies on reasonable terms, or if these technologies fail to operate properly, we may not be able to secure alternatives in a timely manner and our ability to make these products could be harmed. In addition, licensed technology may be subject to claims that it infringes others’ technology, and we may lose access to or have restrictions placed on our use of the licensed technology. Certain technology, which we license, has been, or is currently, subject to such claims.
Our licenses of third-party technologies have certain requirements that we must meet to maintain the license. For instance, if we fail to meet certain minimum royalty or purchase amounts, or meet delivery deadlines, certain licenses may be converted from an exclusive license to a non-exclusive license, thus allowing the licensors to license the technology to our competitors. We cannot guarantee that third-party technologies that we license will not be licensed to our competitors. In the future, we may need to obtain additional licenses, renew existing license agreements or otherwise replace existing technology. We are unable to predict whether these license agreements can be obtained or renewed or the technology can be replaced on acceptable terms, or at all. In addition, if we are unable to successfully license technology from third parties to develop future products, we may not be able to develop such products in a timely manner or at all.
As part of our business strategy, we may complete acquisitions or divest non-strategic businesses and product lines and undertake restructuring efforts. These actions could adversely affect our business, results of operations and financial condition.
As part of our business strategy, we engage in discussions with third parties regarding, and enter into agreements relating to, acquisitions, joint ventures and divestitures in order to manage our product and technology portfolios and further our strategic objectives. We also continually look for ways to increase the profitability of our operations through restructuring efforts and to consolidate operations across facilities where synergies exist. In order to pursue this strategy successfully, we must identify suitable acquisition, alliance or divestiture candidates, complete these transactions, some of which may be large and complex, and integrate acquired companies. Integration and other risks of acquisitions can be more pronounced for larger and more complicated transactions, or if multiple acquisitions are pursued simultaneously.
The integration of acquisitions may make the completion and integration of subsequent acquisitions more difficult. However, if we fail to identify and complete these transactions, we may be required to expend resources to internally develop products and technology or may be at a competitive disadvantage or may be adversely affected by negative market perceptions, which may have a material adverse effect on our business, results of operations and financial condition.
Acquisitions may require us to integrate different company cultures, management teams and business infrastructures and otherwise manage integration risks. Even if an acquisition is successfully integrated, we may not receive the expected benefits of the transaction.
A successful sale or divestiture depends on various factors, including our ability to effectively transfer assets and liabilities, contracts, facilities and employees to the purchaser, identify and separate the intellectual property to be divested from the intellectual property that we wish to keep and reduce fixed costs previously associated with the divested assets of the business.
| - 21 - |
Managing acquisitions and divestitures requires varying levels of management resources, which may divert management’s attention from our other business operations. Acquisitions, including abandoned acquisitions, also may result in significant costs and expenses and charges to earnings.
Restructuring activities may result in business disruptions and may not produce the full efficiency and cost reduction benefits anticipated. Further, the benefits may be realized later than expected and the cost of implementing these measures may be greater than anticipated. If these measures are not successful, we may need to undertake additional cost reduction efforts, which could result in future charges. Moreover, we could experience business disruptions with customers and elsewhere if our cost reduction and restructuring efforts prove ineffective, and our ability to achieve our other strategic goals and business plans as well as our business, results of operations and financial condition could be materially adversely affected.
We rely on the significant experience and specialized expertise of our senior management and engineering staff and must retain and attract qualified engineers and other highly skilled personnel in order to grow our business successfully.
Our performance is substantially dependent on the continued services and performance of our senior management and our highly qualified team of engineers, many of whom have numerous years of experience and specialized expertise in our business. In order to be successful, we must retain and motivate executives and other key employees, including those in managerial, technical, marketing and information technology support positions. In particular, our product generation efforts depend on hiring and retaining qualified engineers. Attracting and retaining skilled workers and qualified sales representatives is also critical to us. Experienced management and technical, marketing and support personnel in the microelectronics and test solutions industries are in demand and competition for their talents is intense. Employee retention may be a particularly challenging issue following acquisitions or divestitures since we also must continue to motivate employees and keep them focused on our strategies and goals, which may be particularly difficult due to the potential distractions related to integrating the acquired operations or divesting businesses to be sold. If we lose the services of any key personnel, our business, results of operations and financial condition could be materially adversely affected.
We may be required to make significant payments to members of our management in the event their employment with us is terminated.
We are a party to employment agreements with each of Leonard Borow, our President and Chief Executive Officer, John Buyko, our Executive Vice President and President of our AMS division, John Adamovich, our Senior Vice President and Chief Financial Officer, Edward Wactlar, our Senior Vice President, General Counsel and Secretary and Charles Badlato, our Vice President and Treasurer. In the event we terminate the employment of any of these executives, or in certain cases, if such executives terminate their employment with us, such executives will be entitled to receive certain severance and related payments. At June 30, 2012 the maximum aggregate amount payable by us to Messrs. Borow, Buyko, Adamovich, Wactlar and Badlato upon the termination of their respective employment agreements with us is $11.0 million.
We rely on our information technology systems to manage numerous aspects of our business and a disruption of these systems could adversely affect our business.
Our information technology, or IT, systems are an integral part of our business. We depend on our IT systems for scheduling, sales order entry, purchasing, materials management, accounting and production functions. Our IT systems also allow us to ship products to our customers on a timely basis, maintain cost-effective operations and provide a high level of customer service. Some of our systems are not fully redundant, and our disaster recovery planning does not account for all eventualities. A serious disruption to our IT systems could significantly limit our ability to manage and operate our business efficiently, which in turn could have a material adverse effect on our business, results of operations and financial condition.
| - 22 - |
Our business could be negatively impacted by cyber security threats.
We face various cyber security threats, including cyber security attacks to our information technology infrastructure and attempts to gain access to proprietary or sensitive information. Although we utilize various procedures and controls to monitor these threats and mitigate our exposure to such threats, there can be no assurance that these procedures and controls will be sufficient to prevent cyber security threats from materializing. If any of these threats were to materialize, our operations may be disrupted and we may experience a loss in sales or increased costs arising from the implementation of additional security measures. A cyber security breach may also result in legal claims or proceedings against us and could damage our reputation.
Due to the international nature of our business, political or economic changes could harm our future sales, expenses and financial condition.
Our future sales, costs and expenses could be adversely affected by a variety of international factors, including:
| • | changes in a country’s or region’s political or economic conditions; |
| • | longer accounts receivable cycles; |
| • | trade protection measures; |
| • | unexpected changes in regulatory requirements; |
| • | differing technology standards and/or customer requirements; and |
| • | import or export licensing requirements, which could affect our ability to obtain favorable terms for components or lead to penalties or restrictions. |
For the year ended June 30, 2012, sales of our products to foreign customers accounted for approximately 40% of our net sales. As of June 30, 2012, we employed approximately 750 employees overseas. In addition, a portion of our product and component manufacturing, along with key suppliers, is located outside of the United States, and also could be disrupted by some of the international factors described above.
Certain of our products and international sales may be subject to International Traffic in Arms Regulations, the Export Administration Regulations, Foreign Corrupt Practices Act and other U.S. and foreign government laws, regulations, policies and practices, which may adversely affect our business, results of operations and financial condition.
Our international sales, for which we also use foreign representatives and consultants, are subject to U.S. laws, regulations and policies, including the International Traffic in Arms Regulations (ITAR) and the Foreign Corrupt Practices Act and other export laws and regulations, as well as foreign government laws, regulations and procurement policies and practices which may differ from the U.S. Government regulations in this regard. The ITAR requires export licenses from the U.S. Department of State for products shipped outside the U.S. that have military or strategic applications. In this connection, we have filed certain Voluntary Disclosures with the Directorate of Defense Trade Controls, U.S. Department of State describing possible inadvertent violations involving, among other things, the unlicensed export of controlled products to end-users in a number of countries, including China and Russia. We have also identified other ITAR noncompliance in the pre-acquisition business activities of certain acquired companies. These matters have been formally disclosed to the U.S. Department of State. See Item 3 - “Legal Proceedings”.
| - 23 - |
Compliance with the directives of the U.S. Department of State may result in substantial legal and other expenses and the diversion of management time. In the event that a determination is made that we or any entity we have acquired has violated the ITAR with respect to any matters, we may be subject to substantial monetary penalties that we are unable to quantify at this time, and/or suspension or revocation of our export privileges and criminal sanctions, which may have a material adverse effect on our business, results of operations and financial condition.
We are also subject to the Export Administration Regulations, or EAR. The EAR regulates the export of certain “dual use” items and technologies and, in some instances, requires a license from the U.S. Department of Commerce. We can give no assurance that under either the ITAR or the EAR we will continue to be successful in obtaining the necessary licenses and authorizations or that certain sales will not be prevented or delayed.
We are also subject to, and must comply with, the U. S. Foreign Corrupt Practices Act, or the FCPA, and similar world-wide anti-corruption laws, including the U.K. Bribery Act of 2010. These acts generally prohibit both us and our third party intermediaries from making improper payments to foreign officials for the purpose of acquiring or retaining business or otherwise obtaining favorable treatment. We are required as well to maintain adequate record-keeping and internal accounting practices to fully and accurately reflect our transactions. We have formulated and implemented strict diligence, training and reporting programs and practices that mandate and are intended to ensure compliance with these anti-corruption laws. We operate in many parts of the world that have experienced government corruption to some degree, however, and, in certain circumstances, the FCPA and our programs and policies may conflict with local customs and practices. If we or our any of our local intermediaries have failed to comply with the requirements of the FCPA, governmental authorities in the United States could seek to impose severe criminal and civil penalties. The assertion of violations of the FCPA or other anti-corruption laws could disrupt our business and, if proven, have a material adverse effect on our results of operations and financial condition.
We are exposed to foreign currency exchange rate risks that could adversely affect our business, results of operations and financial condition.
We are exposed to foreign currency exchange rate risks that are inherent in our sales commitments, anticipated sales, and assets and liabilities that are denominated in currencies other than the U.S. dollar. Our exposure to foreign currency exchange rates relates primarily to the British pound and the Euro. For the year ended June 30, 2012, sales of our products to foreign customers accounted for approximately 40% of our net sales. In addition, a portion of our product and component manufacturing, along with key suppliers, are located outside of the United States. Failure to sufficiently hedge or otherwise manage foreign currency risks properly could have a material adverse effect on our business, results of operations and financial condition.
Compliance with and changes in environmental, health and safety laws regulating the present and past operations of our business and the business of predecessor companies could increase the costs of producing our products and expose us to environmental claims.
Our business is subject to numerous federal, state, local and foreign laws and regulations concerning environmental, health and safety matters, including those relating to air emissions, wastewater discharges and the generation, handling, use, storage, transportation, treatment and disposal of, or exposure to, hazardous substances. Violations of such laws and regulations can lead to substantial fines and penalties and other civil or criminal sanctions. We incur costs associated with compliance with these laws and regulations and we face risks of additional costs and liabilities including those related to the investigation and remediation of, or claims for personal injuries or property damages associated with, past or present contamination, at current as well as former properties utilized by us and at third-party disposal sites, regardless of fault or the legality of the original activities that led to such contamination.
In addition, future developments, such as changes in laws and regulations or the enforcement thereof, more stringent enforcement or interpretation thereof and claims for property damage or personal injury could cause us to incur substantial losses or expenditures. Although we believe we are materially compliant with all applicable current laws and regulations, any new or modified laws or regulations, or the discovery of any currently unknown non-compliance or contamination, could increase the cost of producing our products, which could have a material adverse effect on our business, results of operations and financial condition.
Efforts to comply with laws and regulations applicable to public companies will involve significant expenditures, and non-compliance with those laws and regulations may adversely affect us.
The Sarbanes-Oxley Act of 2002 and the Dodd-Frank Act of 2010, as well as the related rules and regulations promulgated by the Securities and Exchange Commission and the New York Stock Exchange that are applicable to us have increased the scope, complexity and cost of our corporate governance, reporting and disclosure practices. We could also experience greater outside and internal costs as a result of our continuing efforts to comply with the Sarbanes-Oxley Act, including Section 404. The effort to comply with our legal and regulatory obligations may divert management’s attention from other business concerns, which could adversely affect our operating performance. In addition, we may identify significant deficiencies or material weaknesses that we cannot remedy in a timely manner.
| - 24 - |
Compliance with new regulations and customer demands regarding “conflict minerals” could significantly increase costs and affect the manufacturing and sale of our products.
Section 1502 of the Dodd-Frank Wall Street Reform and Consumer Protection Act of 2010 (the Dodd-Frank Act), required the SEC to establish new disclosure and reporting requirements regarding specified minerals originating in the Democratic Republic of the Congo or an adjoining country that are necessary to the functionality or production of products manufactured by companies required to file reports with the SEC. The final rules implementing these requirements, as released recently by the SEC could affect sourcing at competitive prices and availability in sufficient quantities of minerals used in the manufacture of our products, including semiconductor devices. In addition, there will be costs associated with complying with the disclosure requirements, such as costs related to determining the source of such minerals used in our products. Also, because our supply chain is complex, we may face commercial challenges if we are unable to sufficiently verify the origins for all metals used in our products through the due diligence procedures that we implement and otherwise may become obliged to publicly disclose those efforts with regard to conflict minerals. Moreover, we may encounter challenges to satisfy those customers who require that all of the components of our products be certified as conflict free which could place us at a competitive disadvantage if we are unable to do so.
Changes in tax rates or policies or changes to our tax liabilities could affect operating results.
We are subject to taxation in the United States and various other countries, including the United Kingdom, Sweden, Germany and China. Significant judgment is required to determine and estimate our worldwide tax liabilities and our future annual and quarterly tax rates could be affected by numerous factors, including changes in the applicable tax laws, composition of earnings in countries or states with differing tax rates, repatriation of foreign earnings to the United States or our valuation and utilization of deferred tax assets and liabilities. In addition, we are subject to regular examination of our income tax returns by the Internal Revenue Service and other taxing authorities. Although we believe our tax estimates are reasonable, we regularly evaluate the adequacy of our provision for income taxes, and there can be no assurance that any final determination by a taxing authority will not result in additional tax liability which could have a material adverse effect on our results of operations.
Accounting standards periodically change and the application of our accounting policies and methods may require management to make estimates about matters that are uncertain.
The regulatory bodies that establish accounting standards, including, among others, the Financial Accounting Standards Board and the SEC, periodically revise or issue new financial accounting and reporting standards that govern the preparation of our consolidated financial statements. The effect of such revised or new standards on our consolidated financial statements can be difficult to predict and can materially impact how we record and report our results of operations and financial condition. In addition, our management must exercise judgment in appropriately applying many of our accounting policies and methods so they comply with generally accepted accounting principles. In some cases, the accounting policy or method chosen might be reasonable under the circumstances and yet might result in our reporting materially different amounts than would have been reported if we had selected a different policy or method. Accounting policies are critical to fairly presenting our results of operations and financial condition and may require management to make difficult, subjective or complex judgments about matters that are uncertain.
Our operations are subject to business interruptions and casualty losses.
Our business is subject to numerous inherent risks, particularly unplanned events such as inclement weather, explosions, fires, terrorist acts, other accidents, equipment failures and transportation interruptions. While our insurance coverage could offset losses relating to some of these types of events, our business, results of operations and financial condition could be materially adversely affected to the extent any such losses are not covered by our insurance.
| - 25 - |
Risks Related to our Indebtedness
Instability in financial markets could adversely affect our ability to access additional capital.
In recent years, the volatility and disruption in the capital and credit markets have reached unprecedented levels. If these conditions continue or worsen, there can be no assurance that we will not experience a material adverse effect on our ability to borrow money, including under our senior secured credit facility, or have access to capital, if needed. Although our lenders have made commitments to make funds available to us in a timely fashion, our lenders may be unable or unwilling to lend money. In addition, if we determine that it is appropriate or necessary to raise capital in the future, the future cost of raising funds through the debt or equity markets may be more expensive or those markets may be unavailable. If we were unable to raise funds through debt or equity markets, it could have a material adverse effect on our business, results of operations and financial condition.
Our substantial indebtedness could adversely affect our financial health and prevent us from fulfilling our obligations.
We have a significant amount of indebtedness. As of June 30, 2012, we had $641.4 million of debt outstanding under our senior secured credit facility. Additionally, as of June 30, 2012, we had the ability to borrow an additional $75.0 million under the revolving portion of our senior secured credit facility.
Our substantial indebtedness could have important consequences. For example, it could:
| • | make it more difficult for us to satisfy our obligations; |
| • | increase our vulnerability to general adverse economic and industry conditions; |
| • | require us to dedicate a substantial portion of our worldwide cash flow from operations to payments on our indebtedness, thereby reducing the availability of our cash flow to fund working capital, capital expenditures and other general corporate purposes; |
| • | limit our flexibility in planning for, or reacting to, changes in our business and the industry in which we operate; |
| • | place us at a competitive disadvantage compared to our competitors that have less debt; |
| • | limit our ability to borrow additional funds; and |
| • | adversely impact our ability to comply with the covenants and restrictions in our debt agreements, and, in turn, could result in a default under our debt agreements. |
Increases in interest rates could increase interest costs under our senior secured credit facility.
We are subject to interest rate risk in connection with borrowings under our senior secured credit facility. We currently do not have interest rate swap agreements hedging this debt. As of June 30, 2012, there was $641.4 million outstanding at adjusted LIBOR plus 4.5% under the term-loan portion of the senior secured credit facility, all of which is subject to variable interest rates. The adjusted LIBOR, as defined in the senior secured credit facility, has a floor of 1.25% on the term loan. Based on LIBOR at June 30, 2012, an increase of 1% in interest rates would result in a 0.21% increase, due to the 1.25% floor, or a $1.4 million increase in our annual interest expense. Any 1% increase in interest rates above the 1.25% floor would result in a $6.5 million increase in our annual interest expense. A 1% change in interest rates would result in a $760,000 change in our annual interest expense on the revolving loan borrowings, assuming the entire $75.0 million was outstanding. Any debt we incur in the future may also bear interest at floating rates.
| - 26 - |
Despite current indebtedness levels, we and our subsidiaries may still be able to incur substantially more debt, which could further exacerbate the risks associated with our substantial leverage.
We and our subsidiaries may be able to incur substantial additional indebtedness in the future. The terms of our debt allow us to incur substantial amounts of additional debt, subject to certain limitations. For example, we have up to $75.0 million of availability under the revolving portion of our senior secured credit facility and we have the ability to increase the aggregate amount of our senior secured credit facility by up to an aggregate amount equal to (i) $150.0 million or (ii) such greater amount if as of the last day of the most recently ended fiscal quarter, the senior secured leverage ratio would be 4.50:1 or less after giving effect to such greater amount as if such greater amount were drawn in its entirety as of such date, in each case without the consent of any person other than the institutions agreeing to provide all or any portion of such increase. Such institutions have not committed to any increases in our senior secured credit facility. If new indebtedness is added to our and our subsidiaries’ current debt levels, the related risks that we and they now face would intensify.
We will require a significant amount of cash to service our indebtedness and other obligations. Our ability to generate cash depends on many factors beyond our control.
Our ability to make payments on and to refinance our indebtedness and to fund working capital needs and planned capital expenditures, will depend on our ability to generate cash in the future. This, to a certain extent, is subject to general economic, financial, competitive and other factors that are beyond our control.
Our business may not generate sufficient cash flow from operations and future borrowings may not be available to us under our senior secured credit facility or otherwise in an amount sufficient to enable us to pay our indebtedness or to fund our other liquidity needs. In addition, to the extent we have consolidated excess cash flow, as defined in the credit agreement governing our senior secured credit facility, we must use specified portions of the excess cash flow to prepay the senior secured credit facility. We may need to refinance all or a portion of our indebtedness on or before the maturity thereof. We may not be able to refinance any of our indebtedness on commercially reasonable terms or at all.
In addition, if for any reason we are unable to meet our debt service obligations, we would be in default under the terms of our agreement governing our outstanding debt. If such a default were to occur, the lenders under our senior secured credit facility could elect to declare all amounts outstanding under our senior secured credit facility immediately due and payable, and the lenders would not be obligated to continue to advance funds to us. If the amount outstanding under this debt agreement is accelerated, our assets may not be sufficient to repay in full the amount owed to our debt holders.
Our senior secured credit facility imposes significant operating and financial restrictions, which may prevent us from capitalizing on business opportunities and taking some actions.
Our senior secured credit facility contains restrictions on our activities, including but not limited to covenants that restrict us and our restricted subsidiaries, as defined in our senior secured credit facility, from:
| • | incurring additional indebtedness and issuing disqualified stock or preferred stock; |
| • | making certain investments or other restricted payments; |
| • | paying dividends and making other distributions with respect to capital stock, or repurchasing, redeeming or retiring capital stock or subordinated debt; |
| • | selling or otherwise disposing of our assets; |
| - 27 - |
| • | under certain circumstances, issuing or selling equity interests; |
| • | creating liens on our assets; |
| • | consolidating or merging with, or acquiring in excess of specified annual limitations, another business, or selling or disposing of all or substantially all of our assets; and |
| • | entering into certain transactions with our affiliates. |
In addition, under our senior secured credit facility, we are required to comply with a maximum total leverage ratio test. If we fail to maintain compliance with the maximum total leverage ratio test under our senior secured credit facility and do not remedy any non-compliance through the issuance of additional equity interests pursuant to the limited cure right set forth therein or by obtaining an amendment, we will be in default. The senior secured credit facility also requires us to use specified portions of our consolidated excess cash flow, as defined in the agreement governing our senior secured credit facility, to prepay the senior secured credit facility.
The restrictions in our senior secured credit facility may prevent us from taking actions that we believe would be in the best interest of our business, and may make it difficult for us to successfully execute our business strategy or effectively compete with companies that are not similarly restricted. We also may incur future debt obligations that might subject us to additional restrictive covenants that could affect our financial and operational flexibility. We may not be granted waivers or amendments to these agreements if for any reason we are unable to comply with these agreements, and we may not be able to refinance our debt on terms acceptable to us, or at all. The breach of any of these covenants and restrictions could result in a default under our senior secured credit facility. An event of default under our debt agreement could permit our lenders to declare all amounts borrowed from them to be due and payable.
On May 24, 2012, we amended our senior secured credit facility, for which we paid a $3.5 million fee to the lenders which allowed us to increase the flexibility under the total leverage ratio covenant. As a result of the amendment, the applicable LIBOR interest margin increased from 300 basis points to 450 basis points.
Aeroflex Holding is a holding company with no significant business operations of its own and depends on its subsidiaries for cash.
Aeroflex Holding is a holding company with no business operations of its own. Our subsidiaries conduct all of our operations and own substantially all of our assets. Dividends and cash from our subsidiaries will be our principal sources of cash to repay indebtedness and fund operations. Accordingly, our ability to repay our indebtedness and fund operations is dependent on the earnings and the distribution of funds from our subsidiaries. In addition, Aeroflex, our direct subsidiary and primary obligor under our outstanding indebtedness, is also dependent to a significant extent on the cash flow of its subsidiaries in order to meet its debt service obligations.
The agreement governing our debt instrument significantly restricts our subsidiaries from paying dividends and otherwise transferring cash or other assets to any party other than us. In addition, some of our subsidiaries are subject to minimum regulatory capital requirements, which may limit their ability to pay dividends or distributions or make loans to us. Furthermore, our subsidiaries are permitted under the agreement governing our debt instrument to incur additional indebtedness that may severely restrict or prohibit the making of distributions, the payment of dividends or the making of loans by our subsidiaries to us.
Our subsidiaries are separate and distinct legal entities. Any right we have to receive any assets of or distributions from any of our subsidiaries upon the bankruptcy, dissolution, liquidation or reorganization of any such subsidiary, or to realize proceeds from the sale of their assets, will be junior to the claims of that subsidiary’s creditors, including trade creditors and holders of debt issued by that subsidiary.
| - 28 - |
Risks Related to Ownership of our Common Stock
Our stock price may be volatile, and you may not be able to resell shares of our common stock at or above the price you paid.
Shares of our common stock were sold in our IPO in November 2010 at a price of $13.50 per share and our common stock has subsequently traded on the New York Stock Exchange at closing sales prices between $5.50 and $20.10 per share. There has been a public market for our common stock for only a short period of time. An active, liquid and orderly market for our common stock may not be sustained. If an active, liquid and orderly market is not sustained, you may have difficulty selling any of our common stock that you have acquired. Furthermore, the market price of our common stock may be influenced by many factors, some of which are beyond our control, including:
| • | the failure of securities analysts to continue to cover our common stock, or changes in financial estimates or recommendations by analysts; |
| • | actual or anticipated variations in our or our competitors’ operating results; |
| • | failure by us to meet analysts’ projections or guidance that we may give the market; |
| • | future sales of common stock; |
| • | investor perceptions of us and the industry; |
| • | the public’s reaction to our press releases, our public announcements and our filings with the Securities and Exchange Commission; |
| • | our ability to develop and market new and enhanced products on a timely basis; |
| • | our commencement of, or involvement in, litigation; |
| • | departure of key personnel; |
| • | changes in governmental regulations; |
| • | general economic conditions; and |
| • | the other factors described elsewhere in these “Risk Factors”. |
As a result of these factors, investors in our common stock may experience a decrease, which could be substantial, in the value of their investment, including decreases unrelated to our operating performance or prospects. In addition, the stock market has at certain times, including recently, experienced extreme price and volume fluctuations. These broad market and industry factors may materially reduce the market price of our common stock, regardless of our operating performance. In the past, following periods of volatility in the market price of publicly traded shares of a company, securities class-action litigation has often been instituted against that company. Such litigation, if instituted against us, could result in substantial costs and a diversion of our management’s attention and resources, which could materially and adversely harm our results of operations and financial condition.
| - 29 - |
We are controlled by the Sponsors, whose interests may not be aligned with yours.
The Sponsors, through their outstanding membership interests in the parent LLC, control 76.6% of our common stock. As a result, the Sponsors control the election of our directors, determine our corporate and management policies and determine, without the consent of our other stockholders, the outcome of any corporate transaction or other matter submitted to our stockholders for approval, including potential mergers or acquisitions, asset sales and other significant corporate transactions. In connection with our IPO, we entered into a director designation agreement that provides for the right of the parent LLC to nominate designees to our board of directors. In addition, the limited liability company agreement of the parent LLC provides that the parent LLC may not permit us to take certain actions without the consent of each of the Sponsors. Seven of our thirteen directors are either employees of or advisors to the Sponsors. The Sponsors will also have sufficient voting power to amend our organizational documents. The interests of the Sponsors may not coincide with the interests of other holders of our common stock.
Additionally, each of the Sponsors is in the business of making investments in companies and may, from time to time, acquire and hold interests in businesses that compete directly or indirectly with us. The Sponsors may also pursue, for their own accounts, acquisition opportunities that may be complementary to our business, and as a result, those acquisition opportunities may not be available to us. Our Amended and Restated Certificate of Incorporation renounces our interest and expectancy in corporate opportunities presented to the parent LLC or any of its members, including the Sponsors, or any of their respective officers, directors, agents, employees, stockholders, members, partners, affiliates and subsidiaries (other than us and our subsidiaries), or any of our directors who is not an employee (other than opportunities presented to such directors in writing solely in their capacity as our director) and provides that none of such persons or entities have any duty to disclose such potential corporate opportunities to us or refrain from competing with us, even if such opportunities are ones we or our subsidiaries might reasonably be deemed to have pursued or had the desire to pursue. Furthermore, such persons or entities may take such corporate opportunities for themselves or offer them to other persons or entities. Our Sponsors may also consider combining our operations with those of another company. So long as the Sponsors continue to own a significant amount of the outstanding shares of our common stock, they will continue to be able to strongly influence or effectively control our decisions, including potential mergers or acquisitions, asset sales and other significant corporate transactions.
In addition, our Amended and Restated Certificate of Incorporation provides that so long as the parent LLC owns a majority of our then-outstanding common stock, the advance notice procedures for stockholder proposals do not apply to it. Furthermore, our Amended and Restated Certificate of Incorporation may be amended by the affirmative vote of the holders of a majority of our common stock at any time that the parent LLC owns at least a majority of our common stock. At any time that the parent LLC does not own at least a majority of our common stock, (i) amendments to the provisions of our Amended and Restated Certificate of Incorporation relating to directors (other than removal of directors), voting, amendments (except as described below), advance notice bylaws, exculpation, indemnification and stockholder meetings will require the affirmative vote of the holders of at least 662/3% of our common stock, (ii) amendments to the provisions of our Amended and Restated Certificate of Incorporation relating to corporate opportunities and business combinations with interested stockholders and to any provision of our Amended and Restated Certificate of Incorporation that requires the vote of at least 80% of the stockholders (including the provisions relating to removal of directors and amendments to our Amended and Restated Bylaws by stockholders at such times as the parent LLC does not own a majority of our outstanding common stock) will require the affirmative vote of the holders of at least 80% of our then outstanding common stock and (iii) amendments to all other provisions of our Amended and Restated Certificate of Incorporation will require the affirmative vote of the holders of a majority of our common stock.
We are a “controlled company” within the meaning of the New York Stock Exchange rules and, as a result, we qualify for, and we rely on, exemptions from certain corporate governance requirements. You will not have the same protections afforded to stockholders of companies that are subject to such requirements.
The parent LLC controls a majority of the voting power of our outstanding common stock. As a result, we are a “controlled company” within the meaning of the New York Stock Exchange corporate governance standards. Under these rules, if more than 50% of the voting power of a listed company is held by an individual, group or another company, the listed company is a “controlled company” and may elect not to comply with certain corporate governance requirements, including:
| - 30 - |
| • | the requirement that a majority of the Board of Directors consist of independent directors; |
| • | the requirement that we have a corporate governance and nominating committee that is composed entirely of independent directors with a written charter addressing the committee’s purpose and responsibilities; |
| • | the requirement that we have a compensation committee that is composed entirely of independent directors with a written charter addressing the committee’s purpose and responsibilities; and |
| • | the requirement for an annual performance evaluation of the corporate governance and nominating committee and the compensation committee. |
We currently utilize these exemptions and intend to continue to utilize these exemptions. As a result, we do not have a majority of independent directors, our corporate governance and nominating committee and compensation committee do not consist entirely of independent directors and such committees are not subject to annual performance evaluations. Accordingly, you will not have the same protections afforded to stockholders of companies that are subject to all of the corporate governance requirements of the New York Stock Exchange.
Even if the Sponsors no longer control us in the future, certain provisions of our charter documents, the director designation agreement between us and the parent LLC and our financing agreements, as well as Delaware law, could discourage, delay or prevent a merger or acquisition at a premium price.
Our Amended and Restated Certificate of Incorporation and Amended and Restated Bylaws contain provisions that:
| • | permit us to issue, without any further vote or action by our stockholders, 50,000,000 shares of preferred stock in one or more series and, with respect to each series, to fix the number of shares constituting the series and the designation of the series, the voting powers (if any) of the shares of such series, and the preferences and other special rights, if any, and any qualifications, limitations or restrictions, of the shares of the series; |
| • | limit our stockholders’ ability to call special meetings; and |
| • | make Section 203 of Delaware General Corporation Law applicable to business combinations with interested stockholders under certain circumstances. |
In addition, our director designation agreement with the parent LLC provides for the right of the parent LLC to nominate to our board of directors (i) such number of individuals as are designated by the parent LLC until such time as we are required to comply with the requirement under the New York Stock Exchange corporate governance standards that a majority of our board of directors consist of independent directors and (ii) during such time as (A) the parent LLC owns less than a majority but at least one share of our outstanding common stock and (B) we are required to comply with the requirement under the New York Stock Exchange corporate governance standards that a majority of our board of directors consist of independent directors, four individuals designated by the parent LLC.
In addition, upon the occurrence of certain kinds of change of control events, amounts outstanding under our senior secured credit facility will be accelerated. The foregoing provision may impose various impediments to the ability of a third party to acquire control of us, even if a change in control would be beneficial to our existing stockholders.
| - 31 - |
If a substantial number of shares become available for sale and are sold in a short period of time, the market price of our common stock could decline.
Sales of a substantial number of shares of our common stock in the public market could occur at any time. The perception in the public market that our controlling stockholder might sell shares of common stock could adversely affect prevailing market prices for our common stock and could impair our future ability to obtain capital through an offering of equity securities. As of June 30, 2012 we had 84,845,687 shares of common stock outstanding, of which 65 million shares were held by the parent LLC, constituting 76.6% of our outstanding common stock. We and the parent LLC may sell shares of common stock in subsequent public or private offerings. We also may issue additional shares of common stock to finance future acquisitions. The parent LLC is a party to a registration rights agreement with us which grants the parent LLC and the Sponsors rights to require us to effect the registration of their shares of common stock. In addition, if we propose to register any of our common stock under the Securities Act, whether for our own account or otherwise, the parent LLC is entitled to include its shares of common stock in that registration.
We do not intend to pay dividends on our common stock for the foreseeable future and the instruments governing our current indebtedness contain various covenants that may limit our ability to pay dividends.
We do not intend to pay cash dividends on our common stock in the foreseeable future. Our board of directors may, in its discretion, modify or repeal our dividend policy. The declaration and payment of dividends depends on various factors, including: our net income, financial conditions, cash requirements, future prospects and other factors deemed relevant by our board of directors. In addition, we are a holding company that does not conduct any business operations of our own. As a result, we are dependent upon cash dividends and distributions and other transfers from our subsidiaries to make dividend payments on our common stock.
The instrument governing our current indebtedness contains covenants which place limitations on the amount of dividends we may pay. In addition, under Delaware law, our board of directors may declare dividends only to the extent of our “surplus” (which is defined as total assets at fair market value minus total liabilities, minus statutory capital), or if there is no surplus, out of net profits for the then current and/or immediately preceding fiscal year.
We plan to continue to issue restricted stock and/or options, which have the potential to dilute stockholder value and cause the price of our common stock to decline.
We expect to continue to offer restricted stock, stock options and/or other forms of stock-based compensation to our directors, officers, employees and consultants. If the restricted stock that we issue vests, or the options that we issue are exercised, and those shares are sold into the public market, the market price of our common stock may decline. In addition, the availability of shares of common stock for award under our equity incentive plan, or the grant of restricted stock, stock options or other forms of stock-based compensation, may adversely affect the market price of our common stock.
| ITEM 1B. | UNRESOLVED STAFF COMMENTS |
None.
| - 32 - |
| ITEM 2. | PROPERTIES |
Our headquarters are located in Plainview, Long Island, New York, where we have approximately 90,000 square feet of space, including manufacturing space, that is utilized by both AMS and ATS. The following table sets forth information concerning the significant properties owned or leased by us.
| Approximate | Expiration | |||||||
| Square | Owned/ | of | ||||||
| Location | Footage | Purpose | Leased | Lease | ||||
| AMS Properties | ||||||||
| Ann Arbor, Michigan | 32,000 | (1)(2) | Owned | N/A | ||||
| Ann Arbor, Michigan | 12,000 | (1)(2) | Leased | 2018 | ||||
| Colorado Springs, Colorado | 102,000 | (3)(4)(5) | Owned | N/A | ||||
| Colorado Springs, Colorado | 29,000 | (3)(6) | Leased | 2016 | ||||
| Eatontown, New Jersey | 46,000 | (1)(2) | Leased | 2021 | ||||
| Frederick, Maryland | 32,000 | (1)(2) | Leased | 2021 | ||||
| Gothenburg, Sweden | 9,000 | (5) | Leased | 2014 | ||||
| Hauppauge, Long Island, New York | 47,000 | (7)(8) | Leased | 2017 | ||||
| Lawrence, Massachusetts | 38,000 | (1)(2) | Leased | 2014 | ||||
| Londonderry, New Hampshire | 43,000 | (1)(2) | Leased | 2017 | ||||
| Nanjing, China | 22,000 | (1) | Leased | 2014 | ||||
| Naples, Florida | 44,000 | (8) | Leased | 2013 | ||||
| Plainview, Long Island, New York | 52,000 | (3) | Owned | N/A | ||||
| Sunnyvale, California | 40,000 | (1)(2) | Leased | 2017 | ||||
| ATS Properties | ||||||||
| Cupertino, California | 20,000 | (10) | Leased | 2014 | ||||
| Ismaning, Germany | 45,000 | (12) | Leased | 2012 | ||||
| Lenexa, Kansas | 54,000 | (13) | Leased | 2015 | ||||
| Plainview, Long Island, New York | 17,000 | (9) | Owned | N/A | ||||
| Powell, Ohio | 20,000 | (10) | Leased | 2017 | ||||
| Stevenage, England | 142,000 | (9)(11)(12)(13)(14) | Owned | N/A | ||||
| Wichita, Kansas | 156,000 | (13)(14) | Owned | N/A |
| (1) | Manufacturing of RF and microwave components. |
| (2) | Research and development of RF and microwave components. |
| (3) | Manufacturing and research and development of HiRel microelectronics/semiconductors. |
| (4) | Manufacturing of mixed-signal/digital ASICs. |
| (5) | Research and development of mixed-signal/digital ASICs. |
| (6) | Radiation testing and validation of HiRel microelectronics/semiconductors. |
| (7) | Research and development of motion control products. |
| (8) | Manufacturing of motion control products. |
| (9) | Manufacturing and research and development of general purpose test equipment and other. |
| (10) | Manufacturing and research and development of synthetic test equipment. |
| - 33 - |
| (11) | Manufacturing of wireless test equipment. |
| (12) | Research and development of wireless test equipment. |
| (13) | Manufacturing and research and development of avionics test equipment. |
| (14) | Manufacturing and research and development of military radio and PMR test equipment. |
We believe that our facilities are adequate for our current and presently foreseeable needs and that we will be able to renew or replace our expiring leases on our rental properties on commercially reasonable terms.
| ITEM 3. | LEGAL PROCEEDINGS |
We have identified instances of noncompliance with the International Traffic in Arms Regulations, or ITAR, in certain of our past business activities as well as in the pre-acquisition business activities of certain acquired companies. These include the inadvertent misclassification and/or export of products without the required license and the disclosure of controlled technology to certain foreign national employees. These matters were formally disclosed to the U.S. Department of State from time to time from fiscal 2007 through fiscal 2012. Matters resolved to date have been done so without penalty. At this time it is not possible to determine whether any fines or other penalties will be assessed against us or the materiality of the outcome of any of the remaining ITAR matters.
In March 2005, we sold the net assets of our shock and vibration control device manufacturing business, which we refer to as VMC. Under the terms of the sale agreements, we retained certain liabilities relating to adverse environmental conditions that existed at the premises occupied by VMC as of the date of sale. We recorded a liability for the estimated remediation costs related to adverse environmental conditions that existed at the VMC premises when it was sold. The accrued environmental liability at June 30, 2012 was $1.4 million, of which $350,000 was expected to be paid within one year.
We are also involved in various other claims and legal actions that arise in the ordinary course of business. We do not believe that the ultimate resolution of any of these actions will have a material adverse effect on our business, results of operations, financial position, liquidity or capital resources.
| ITEM 4. | MINE SAFETY DISCLOSURES |
Not applicable.
| - 34 - |
PART II
| ITEM 5. | MARKET FOR REGISTRANT’S COMMON EQUITY, RELATED STOCKHOLDER MATTERS AND ISSUER PURCHASES OF EQUITY SECURITIES |
Market Information
Our common stock has been listed on the New York Stock Exchange under the symbol “ARX” since our IPO in November 2010. Prior to that time, there was no public market for our common stock.
The following tables sets forth, for the periods indicated, the high and low closing sales prices of our common stock as reported on the New York Stock Exchange:
| High | Low | |||||||
| Fiscal 2011 | ||||||||
| Second quarter (from November 19, 2010) | $ | 16.61 | $ | 13.50 | ||||
| Third quarter | 20.10 | 15.28 | ||||||
| Fourth quarter | 19.37 | 16.73 | ||||||
| High | Low | |||||||
| Fiscal 2012 | ||||||||
| First quarter | $ | 18.69 | $ | 7.69 | ||||
| Second quarter | 11.43 | 8.50 | ||||||
| Third quarter | 13.49 | 10.65 | ||||||
| Fourth quarter | 11.47 | 5.74 | ||||||
Holders
As of August 28, 2012, there were two record holders of our common stock, not including beneficial owners holding stock in the name of a nominee.
Dividends
To date we have not paid dividends on our common stock and do not intend to pay cash dividends on our common stock in the foreseeable future. We are a holding company that does not conduct any business operations of our own. As a result, we are dependent upon cash dividends and distributions and other transfers from our subsidiaries to make dividend payments on our common stock. The amounts available to us to pay cash dividends are restricted by our debt agreement. The declaration and payment of dividends also is subject to the discretion of our board of directors and depends on various factors, including our net income, financial condition, cash requirements, future prospects and other factors deemed relevant by our board of directors.
In addition, under Delaware law, our board of directors may declare dividends only to the extent of our surplus (which is defined as total assets at fair market value minus total liabilities, minus statutory capital) or, if there is no surplus, out of our net profits for the then current and/or immediately preceding fiscal year.
| - 35 - |
Equity Compensation Plan Information as of June 30, 2012
| Number of securities | ||||||||||||
| remaining available | ||||||||||||
| for future issuance | ||||||||||||
| Number of securities | Weighted-average | under equity | ||||||||||
| to be issued upon exercise | exercise price of | compensation plans | ||||||||||
| of outstanding options, | outstanding options, | (excluding securities | ||||||||||
| warrants and rights | warrants and rights | reflected column (a)) | ||||||||||
| Plan Category (1) | (a) | (b) | (c) | |||||||||
| (In thousands) | ||||||||||||
| Equity compensation plans approved by security holders | - | - | 4,051 | |||||||||
| (1) | For a description of the equity compensation plan, see Note 14 to the consolidated financial statements. |
Issuer Purchases of Equity Securities
None.
Common Stock Performance Graph
The graph below shows the cumulative total stockholder return assuming the investment of $100 and the reinvestment of any dividends for the period beginning on November 19, 2010, the date of our IPO, and ending on June 30, 2012, in each of our common stock, the S&P 500 Index and the NYSE Arca Tech 100 Index, which is comprised of common stocks and ADRs of technology-related companies listed on the U.S. exchanges. The performance shown in the following graph is not indicative of future stock price performance.
Comparison of November 19, 2010 to June 30, 2012 Quarterly Cumulative Total Return of Aeroflex Holding Corp., the S&P 500 Index and the NYSE Arca Tech 100 Index:
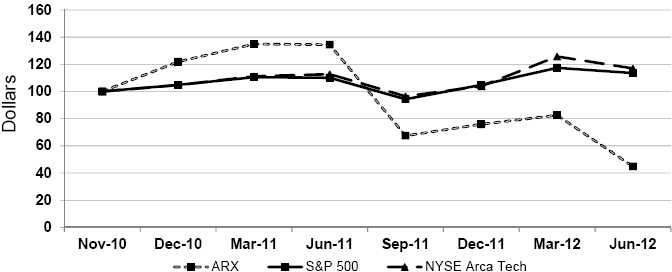
| - 36 - |
Data points for performance graph:
| Cumulative Total Return | ||||||||||||||||||||||||||||||||
| 19-Nov-10 | Dec-10 | Mar-11 | Jun-11 | Sep-11 | Dec-11 | Mar-12 | Jun-12 | |||||||||||||||||||||||||
| Aeroflex Holding Corp. | 100 | 122 | 135 | 134 | 67 | 76 | 83 | 45 | ||||||||||||||||||||||||
| S&P500 | 100 | 105 | 111 | 110 | 94 | 105 | 117 | 114 | ||||||||||||||||||||||||
| NYSE Arca Tech 100 index | 100 | 105 | 111 | 113 | 96 | 104 | 126 | 117 | ||||||||||||||||||||||||
ITEM 6. SELECTED FINANCIAL DATA
The consolidated financial data presented for the fiscal years ended June 30, 2012, 2011, 2010 and 2009, and for the period from August 15, 2007 to June 30, 2008 represent the results of Aeroflex Holding, which was formed in connection with the Going Private Transaction, together with its consolidated subsidiaries. Aeroflex Holding is referred to after the Going Private Transaction as the Successor or Successor Entity. The consolidated financial data for the period from July 1, 2007 to August 15, 2007 represents Aeroflex’s results prior to the Going Private Transaction, and we refer to Aeroflex prior to the Going Private Transaction as the Predecessor or Predecessor Entity. The purchase method of accounting was applied effective August 15, 2007 in connection with the Going Private Transaction. Therefore, our consolidated financial data for the period from July 1, 2007 to August 15, 2007 is presented on a different basis than those for the periods after August 14, 2007 and, as such, is not comparable.
| - 37 - |
Selected Financial Data
| (Predecessor | ||||||||||||||||||||||||
| (Successor Entity) | Entity) | |||||||||||||||||||||||
| Period | Period | |||||||||||||||||||||||
| August 15, | July 1, | |||||||||||||||||||||||
| 2007 | 2007 | |||||||||||||||||||||||
| to | to | |||||||||||||||||||||||
| Year Ended June 30, | June 30, | August 14, | ||||||||||||||||||||||
| 2012 | 2011 | 2010 | 2009 | 2008 | 2007 | |||||||||||||||||||
| (In thousands, except per share data) | ||||||||||||||||||||||||
| Statement of Operations Data: | ||||||||||||||||||||||||
| Net sales | $ | 673,015 | $ | 729,414 | $ | 655,048 | $ | 599,336 | $ | 604,991 | $ | 38,221 | ||||||||||||
| Income (loss) from continuing operations | (53,637 | ) | (34,668 | ) | (12,269 | ) | (76,688 | ) | (100,604 | ) | (14,408 | ) | ||||||||||||
| Income (loss) from discontinued operations, net of taxes | - | - | - | - | (4,821 | ) | (2,508 | ) | ||||||||||||||||
| Net income (loss) | (53,637 | ) | (34,668 | ) | (12,269 | ) | (76,668 | ) | (105,425 | ) | (16,916 | ) | ||||||||||||
| Income (loss) from continuing operations per common share(1): | ||||||||||||||||||||||||
| Basic | $ | (0.63 | ) | $ | (0.45 | ) | $ | (0.19 | ) | $ | (1.18 | ) | $ | (1.62 | ) | |||||||||
| Diluted | (0.63 | ) | (0.45 | ) | (0.19 | ) | (1.18 | ) | (1.62 | ) | ||||||||||||||
| Weighted average number of common shares outstanding(1): | ||||||||||||||||||||||||
| Basic | 84,811 | 77,153 | 65,000 | 65,000 | 65,000 | |||||||||||||||||||
| Diluted | 84,811 | 77,153 | 65,000 | 65,000 | 65,000 | |||||||||||||||||||
(1) Retroactively adjusted to give effect to our 65,000,000-for-1 common stock split in November 2010.
Besides the Going Private Transaction, the comparability of the selected financial data provided above is affected by the data in the table below for each of the periods shown, as more completely described in the notes to our consolidated financial statements appearing elsewhere herein.
| - 38 - |
The table below contains the more significant items that affect the comparability of the results of operations for each of the periods shown:
(All items shown in this table are before income taxes)
| (Predecessor | ||||||||||||||||||||||||
| (Successor Entity) | Entity) | |||||||||||||||||||||||
| Period | Period | |||||||||||||||||||||||
| August 15, | July 1, | |||||||||||||||||||||||
| 2007 | 2007 | |||||||||||||||||||||||
| to | to | |||||||||||||||||||||||
| Year Ended June 30, | June 30, | August 14, | ||||||||||||||||||||||
| 2012 | 2011 | 2010 | 2009 | 2008 | 2007 | |||||||||||||||||||
| (In thousands) | ||||||||||||||||||||||||
| Amortization of acquired intangibles | $ | 62,696 | $ | 63,672 | $ | 61,915 | $ | 62,962 | $ | 73,076 | $ | 1,692 | ||||||||||||
| Share based compensation | 3,527 | 2,254 | 2,076 | 1,955 | 3,123 | 214 | ||||||||||||||||||
| Restructuring charges | 6,779 | 14,783 | 385 | 4,102 | 6,995 | 3,778 | ||||||||||||||||||
| Going Private Transaction and merger related expenses | - | 1,222 | 2,858 | 4,283 | 36,585 | 5,036 | ||||||||||||||||||
| Termination of Sponsor Advisory Agreement | - | 18,133 | - | - | - | - | ||||||||||||||||||
| Loss on liquidation of foreign subsidiary | - | - | 7,696 | - | - | - | ||||||||||||||||||
| Impairment of goodwill and other long-lived assets | 56,700 | - | - | 41,225 | - | - | ||||||||||||||||||
| Increase (decrease) in fair value of acquisition contingent consideration liability | (7,553 | ) | 1,834 | - | - | - | - | |||||||||||||||||
| Acquired in-process research and development costs | - | - | - | 1,665 | 24,975 | - | ||||||||||||||||||
| Impact of purchase accounting adjustments | 282 | 1,645 | 3,059 | 5,149 | 45,578 | 57 | ||||||||||||||||||
| Interest expense | 34,237 | 66,204 | 83,948 | 83,823 | 74,658 | 275 | ||||||||||||||||||
| Loss on extinguishment of debt and write-off of deferred financing costs | 1,232 | 59,395 | - | - | - | - | ||||||||||||||||||
| Gain from a bargain purchase of a business | - | (173 | ) | (3,993 | ) | - | - | - | ||||||||||||||||
| - 39 - |
| (Predecessor | ||||||||||||||||||||||||
| (Successor Entity) | Entity) | |||||||||||||||||||||||
| Period | Period | |||||||||||||||||||||||
| August 15, | July 1, | |||||||||||||||||||||||
| 2007 | 2007 | |||||||||||||||||||||||
| to | to | |||||||||||||||||||||||
| Year Ended June 30, | June 30, | August 14, | ||||||||||||||||||||||
| 2012 | 2011 | 2010 | 2009 | 2008 | 2007 | |||||||||||||||||||
| (In thousands) | ||||||||||||||||||||||||
| Balance Sheet Data | ||||||||||||||||||||||||
| (at end of period): | ||||||||||||||||||||||||
| Working capital (1) | $ | 289,161 | $ | 324,251 | $ | 239,952 | $ | 221,406 | $ | 220,855 | $ | 218,072 | ||||||||||||
| Total assets | 1,189,808 | 1,395,926 | 1,356,140 | 1,361,597 | 1,478,999 | 682,776 | ||||||||||||||||||
| Long-term debt (including current portion) | 641,375 | 725,385 | 901,847 | 889,348 | 878,811 | 3,554 | ||||||||||||||||||
| Stockholders' equity | 326,777 | 383,524 | 150,984 | 159,760 | 276,648 | 506,622 | ||||||||||||||||||
| Other Financial Data: | ||||||||||||||||||||||||
| EBITDA (unaudited) (2) | 60,005 | 76,177 | 155,195 | 76,229 | 28,159 | (17,302 | ) | |||||||||||||||||
| Adjusted EBITDA (unaudited) (3) | 131,482 | 183,698 | 166,130 | 145,340 | - | - | ||||||||||||||||||
| (1) | Working capital is defined as current assets less current liabilities. |
| (2) | As used herein, "EBITDA" represents income (loss) from continuing operations plus (i) interest expense, (ii) provision (benefit) for income taxes and (iii) depreciation and amortization. |
We have included information concerning EBITDA in this report because we believe that such information is used by certain investors, securities analysts and others as one measure of an issuer's performance. In addition, we use EBITDA when interpreting operating trends and results of operations of our business. EBITDA is also widely used by us and others in our industry to evaluate and to price potential acquisition candidates. EBITDA is a non-GAAP financial measure and should not be considered as an alternative to, or more meaningful than, earnings from operations, cash flows from operations or other traditional Generally Accepted Accounting Principles, or GAAP, indications of an issuer's operating performance. EBITDA has important limitations as an analytical tool and you should not consider this measure in isolation or as a substitute for analysis of our results as reported under U.S. GAAP. For example, EBITDA:
| · | excludes certain tax payments that may represent a reduction in cash available to us; |
| · | does not consider capital expenditure requirements for the assets being depreciated and amortized that may have to be replaced in the future; |
| · | does not reflect changes in, or cash requirements for, our working capital needs; and |
| · | does not reflect the significant interest expense, or the cash requirements necessary to service interest or principal payments, on our debt. |
| - 40 - |
The following table is a reconciliation of income (loss) from continuing operations to EBITDA for the periods indicated:
| (Predecessor | ||||||||||||||||||||||||
| (Successor Entity) | Entity) | |||||||||||||||||||||||
| Period | Period | |||||||||||||||||||||||
| August 15, | July 1, | |||||||||||||||||||||||
| 2007 | 2007 | |||||||||||||||||||||||
| to | to | |||||||||||||||||||||||
| Year Ended June 30, | June 30, | August 14, | ||||||||||||||||||||||
| 2012 | 2011 | 2010 | 2009 | 2008 | 2007 | |||||||||||||||||||
| (In thousands) | ||||||||||||||||||||||||
| Income (loss) from continuing operations | $ | (53,637 | ) | $ | (34,668 | ) | $ | (12,269 | ) | $ | (76,688 | ) | $ | (100,604 | ) | $ | (14,408 | ) | ||||||
| Interest expense | 34,237 | 66,204 | 83,948 | 83,823 | 74,658 | 275 | ||||||||||||||||||
| Provision (benefit) for income taxes | (4,893 | ) | (38,818 | ) | 820 | (15,332 | ) | (38,927 | ) | (6,831 | ) | |||||||||||||
| Depreciation and amortization | 84,298 | 83,459 | 82,696 | 84,426 | 93,032 | 3,662 | ||||||||||||||||||
| EBITDA (unaudited) | $ | 60,005 | $ | 76,177 | $ | 155,195 | $ | 76,229 | $ | 28,159 | $ | (17,302 | ) | |||||||||||
| (3) | We also provide information with respect to Adjusted EBITDA in this report. The calculation of Adjusted EBITDA is based on the definition in the credit agreement governing our senior secured credit facility and is not defined under U.S. GAAP. Our use of the term Adjusted EBITDA may vary from others in our industry. Adjusted EBITDA is not a measure of operating income (loss), performance or liquidity under U.S. GAAP and is subject to important limitations. We use Adjusted EBITDA in assessing covenant compliance under our senior secured credit facility and we believe its inclusion is appropriate to provide additional information to investors. In calculating Adjusted EBITDA, we add back certain non-cash, non-recurring and other items that are included in EBITDA as detailed below: |
| - 41 - |
A reconciliation of EBITDA to Adjusted EBITDA (as defined and used for purposes of calculating our debt covenant compliance) is as follows:
| (Successor Entity) | ||||||||||||||||
| Year Ended June 30, | ||||||||||||||||
| 2012 | 2011 | 2010 | 2009 | |||||||||||||
| (In thousands) (Unaudited) | ||||||||||||||||
| EBITDA | $ | 60,005 | $ | 76,177 | $ | 155,195 | $ | 76,229 | ||||||||
| Non-cash purchase accounting adjustments | - | 1,155 | 700 | 2,749 | ||||||||||||
| Change in fair value of acquisition contingent consideration liability | (7,553 | ) | 1,834 | - | - | |||||||||||
| Merger related expenses | - | 1,222 | 2,858 | 4,283 | ||||||||||||
| Restructuring costs and related pro forma savings(a) | 14,783 | 21,085 | 385 | 10,159 | ||||||||||||
| Share-based compensation | 3,527 | 2,254 | 2,076 | 1,955 | ||||||||||||
| Termination of Sponsor Advisory Agreement | - | 18,133 | - | - | ||||||||||||
| Impairment of goodwill and other long-lived assets | 56,700 | - | - | 41,225 | ||||||||||||
| Loss on liquidation of foreign subsidiary | - | - | 7,696 | 3,112 | ||||||||||||
| Loss on extinguishment of debt and write-off of deferred financing costs | 1,232 | 59,395 | - | - | ||||||||||||
| Gain from a bargain purchase of a business | - | (173 | ) | (3,993 | ) | - | ||||||||||
| Other defined items(b) | 2,788 | 2,616 | 1,213 | 5,628 | ||||||||||||
| Adjusted EBITDA | $ | 131,482 | $ | 183,698 | $ | 166,130 | $ | 145,340 | ||||||||
| (a) | Primarily reflects costs associated with the reorganization of our European operations and consolidation of certain of our U.S. component facilities. Pro forma savings reflect the costs that we estimate would have been eliminated during the fiscal year in which a restructuring occurred had the restructuring occurred as of the first day of that fiscal year. Pro forma savings were estimated to be $8.0 million for the year ended June 30, 2012. |
| (b) | Reflects other adjustments required in calculating our debt covenant compliance. These other defined items include legal fees related to litigation, business acquisition costs and pro forma EBITDA for periods prior to the acquisition dates for companies acquired during our fiscal year. |
| - 42 - |
| ITEM 7. | MANAGEMENT’S DISCUSSION AND ANALYSIS OF FINANCIAL CONDITION AND |
RESULTS OF OPERATIONS
Forward-Looking Statements
This report contains "forward-looking statements". All statements other than statements of historical fact are "forward-looking" statements for purposes of the U.S. federal and state securities laws. These statements may be identified by the use of forward looking terminology such as "anticipate", "believe", "continue", "could", "estimate", "expect", "intend", "may", "might", "plan", "potential", "predict", "should" or "will" or the negative thereof or other variations thereon or comparable terminology. In particular, statements about our expectations, beliefs, plans, objectives, assumptions or future events or performance contained in this report under the headings "Risk Factors", "Management's Discussion and Analysis of Financial Condition and Results of Operations" and "Business" are forward-looking statements.
We have based these forward-looking statements on our current expectations, assumptions, estimates and projections. While we believe these expectations, assumptions, estimates and projections are reasonable, such forward-looking statements are only predictions and involve known and unknown risks and uncertainties, many of which are beyond our control. These and other important factors, including those discussed in this report under the headings "Risk Factors", "Management's Discussion and Analysis of Financial Condition and Results of Operations" and "Business", may cause our actual results, performance or achievements to differ materially from any future results, performance or achievements expressed or implied by these forward-looking statements. Some of the key factors that could cause actual results to differ from our expectations include:
| · | adverse developments in the global economy; |
| · | significant reductions in U.S. government spending on defense; |
| · | our dependence on growth in our customers' businesses and the uptake of new technologies; |
| · | our inability to remain competitive in the markets we serve; |
| · | our inability to continue to develop, manufacture and market innovative, customized products and services that meet customer requirements for performance and reliability; |
| · | any failure of our suppliers to provide us with raw materials and/or properly functioning component parts; |
| · | termination of our key contracts, including technology license agreements, or loss of our key customers; |
| · | our inability to protect our intellectual property; |
| · | our failure to comply with regulations such as ITAR and FCPA, and any changes in regulations; |
| · | our failure to realize anticipated benefits from completed acquisitions, divestitures or restructurings, or the possibility that such acquisitions, divestitures or restructurings could adversely affect us; |
| · | our inability to make payments on our significant indebtedness or to remain in compliance with the covenants of our debt agreement; |
| · | the loss of key employees; |
| - 43 - |
| · | our exposure to foreign currency exchange rate risks; |
| · | terrorist acts or acts of war; and |
| · | other risks and uncertainties, including those listed under the caption "Risk Factors". |
Given these risks and uncertainties, you are cautioned not to place undue reliance on such forward-looking statements. The forward-looking statements included in this report are made only as of the date hereof. We undertake no obligation to update or revise any forward-looking statements, either to reflect new developments, or for any other reason, except as required by law.
Overview
We are a leading global provider of RF and microwave integrated circuits, components and systems used in the design, development and maintenance of technically demanding, high-performance wireless communication systems. Our solutions include highly specialized microelectronic components and test and measurement equipment used by companies in the (i) space, avionics and defense; (ii) commercial wireless communications; and (iii) medical and other markets. We have targeted customers in these end markets because we believe our solutions address their technically demanding requirements. We were founded in 1937 and have proprietary technology that is based on extensive know-how and a long history of research and development focused on specialized technologies, often in collaboration with our customers.
The IPO Transactions
Amendment to Senior Secured Credit Agreement
On November 4, 2010, we amended our then existing senior secured credit facility, for which we paid a $3.3 million fee to the lenders which was recorded as deferred financing costs and $579,000 of other costs that were expensed as incurred, which allowed us to, among other things:
| · | increase the amount of cash we could spend for acquisitions of businesses; |
| · | pay certain fees to affiliates of our Sponsors upon the completion of our IPO. These fees were paid on November 24, 2010, and consisted of a $2.5 million transaction fee which was paid to affiliates of the Sponsors under the advisory agreement with them for services directly attributable to the IPO (“Transaction Fee”), which was recorded as a reduction of additional paid-in capital, and a $16.9 million termination fee, to terminate the Sponsor Advisory Agreement with them (“Termination Fee”). The Termination Fee, when combined with the related write-off of prepaid advisory fees, amounted to an $18.1 million expense which is reported in the statement of operations as Termination of Sponsor Advisory Agreement; and |
| · | change the basis for calculating our interest rate margin above LIBOR. |
IPO
In November 2010, we consummated an IPO of our common stock in which we sold 19,789,180 shares of common stock at a price of $13.50 per share. We received net proceeds of $244.0 million from the IPO, after deducting underwriting discounts and offering expenses, including the aforementioned $2.5 million Transaction Fee. In connection with the IPO, we:
| · | repurchased an aggregate of $186.6 million of our then existing senior unsecured notes and senior subordinated unsecured term loans and paid $21.1 million of tender premiums and expenses related thereto; |
| - 44 - |
| · | paid a $16.9 million Termination Fee to affiliates of the Sponsors to terminate the advisory agreement with them, which, including the related write-off of prepaid advisory fees, resulted in an $18.1 million expense; and |
| · | amended our then existing senior secured credit facility, for which a $3.3 million fee was paid to the lenders. |
Debt Repurchase
In December 2010, we repurchased $32.2 million of our then existing senior unsecured notes and $154.4 million of our then existing senior subordinated unsecured term loans with the net proceeds of our IPO. This resulted in a $25.2 million loss on extinguishment of debt and write-off of deferred financing costs, which was comprised of the following:
| · | an 11% premium paid on the debt repurchased, which amounted to $20.5 million; |
| · | the write-off of the related deferred financing costs of $4.0 million; and |
| · | professional fees of $614,000. |
Debt Transactions
Debt Refinancing
On May 9, 2011, we entered into a new senior secured credit facility with various lenders, consisting of a senior secured term loan facility of $725.0 million and a senior secured revolving credit facility of $75.0 million, to refinance $695.5 million of our then outstanding debt. The new term loan facility provided for $1.8 million quarterly principal repayments commencing September 30, 2011, with the remaining balance due at maturity on May 9, 2018. Unless terminated earlier, the new revolving credit facility will expire on May 9, 2016. No amounts have been drawn under the revolving credit facility. The outstanding borrowings under this senior secured credit facility bore interest, prior to the amendment, payable quarterly, at a rate per annum equal to either: (i) the base rate (as defined in the new secured credit facility), plus an applicable margin of 200 basis points, or (ii) the adjusted LIBOR rate, which has a floor of 125 basis points (as defined in the new senior secured credit facility), plus an applicable margin of 300 basis points.
The $725.0 million proceeds were used:
| 1) | to refinance $695.5 million of our then outstanding debt, as follows: |
| · | to repay the entire outstanding balance of $489.1 million under our then existing senior secured credit facility; |
| · | to repurchase all of our unsecured senior notes of $192.8 million; and |
| · | to prepay all of our senior subordinated unsecured term loans of $13.6 million. |
| 2) | to pay a portion of the fees and expenses totaling $34.0 million in connection with the refinancing. |
Debt Amendment
On May 24, 2012, we amended our senior secured credit facility, for which we paid a $3.5 million fee to the lenders which was recorded as deferred financing costs and $83,000 of other costs that were expensed as incurred, which allowed us to increase the flexibility under the total leverage ratio covenant. As a result of the amendment, the applicable LIBOR interest margin increased from 300 basis points to 450 basis points.
| - 45 - |
Factors and Trends That Affect Our Business
In reading our consolidated financial statements, you should be aware of the following factors and trends that our management believes are important in understanding our results.
Revenue
There are many factors that impact our sales. Some are outside of our direct control, such as changes in government spending on space, avionics and defense, the buying patterns of our customers, the uptake of new technologies, exchange rate fluctuations or general economic conditions. For those factors outside of our direct control, we attempt to respond quickly to changes to minimize the risk of adverse consequences.
Other factors are within our control, such as our pricing strategies and our product development focus. We constantly reassess our markets and evaluate potential new end markets for our technologies. Due to our many years of experience in our markets, we often are part of our customers' fundamental design strategies, which gives us greater visibility into potential new products and market demand.
We often design and develop platform-specific and customized products for our customers. Our major customers often use our products in multiple systems or programs, sometimes developed by different business units within the customer's organization. Although our product offerings and customer base are broad and diverse, sales derived from our ten largest customers as a percentage of our net sales was 37% in fiscal 2012, 31% in fiscal 2011 and 36% in fiscal 2010. While the composition of our top ten customers varies from year to year, we expect that sales to a limited number of customers will continue to account for a significant percentage of our revenue for the foreseeable future. No single customer exceeded 10% of our net revenue in fiscal 2012, 2011 or 2010. Approximately 33% of our sales in fiscal 2012, 30% of our sales for fiscal 2011 and 34% of our sales for fiscal 2010 were to agencies of the United States government or to prime defense contractors or subcontractors of the United States government.
Gross Margin
Our gross margin in any period is significantly affected by product mix, that is, the percentage of our revenue in that period that is attributable to higher or lower margin products and to a lesser extent, by pricing. The impact of product mix is evident in both the fiscal 2011 and 2010 improvements experienced in our consolidated gross margin as the gross margins for wireless test equipment products and integrated circuits, which had increased sales in both fiscal 2011 and 2010, are higher than the consolidated average gross margins. Likewise, the impact of product mix is evident in fiscal 2012 as decreased sales of wireless test products were the principal cause of the reduction in our consolidated gross margin. Additional factors affecting our gross margins include changes in the costs of materials and labor, changes in cost estimates for contracts for which revenue is recognized on a percentage of completion basis, variations in overhead absorption rates and other manufacturing efficiencies, and numerous other factors.
To continue to improve our gross margins, we seek to introduce products that are valued by our customers for the ability of those products to address technically challenging applications where performance and reliability are the highest priorities. We also seek continuously to reduce our costs and to improve the efficiency of our manufacturing operations, such as with the restructuring activities we have taken during the last several years.
Selling, General & Administrative Costs
Our selling, general and administrative costs consist of all expenditures incurred in connection with the sales and marketing of our products as well as administrative overhead costs.
| - 46 - |
Changes in selling, general and administrative costs as a percent of sales have historically been modest as we have continually focused on controlling our costs. On a GAAP basis, our selling, general and administrative costs as a percentage of sales have increased from 19.8% to 22.6% over the last three fiscal years, due mainly to a reduction in sales. To help reduce the adverse impact on profitability resulting from the worldwide economic downturn that began to affect our business in 2009, we froze salaries at the beginning of fiscal 2010 at their fiscal 2009 levels and suspended the match to our 401(k) plan. Based upon our performance in fiscal 2010, we reinstated the match to our 401(k) plan, albeit at a reduced level, and resumed salary increases in fiscal 2011. In response to our recent downturn in sales, we again froze salaries and suspended the match to our 401(k) plan in fiscal 2012. Additionally, headcount reductions were carried out in both AMS and ATS to reduce costs in response to market conditions.
Research and Development
Research and development expenses consist of costs related to direct product design, development and process engineering. The level of research and development expense is related to the number of products in development, the state of the development process, the complexity of the underlying technology, the potential scale of the product upon successful commercialization, the level of our exploratory research and the extent to which product development and similar costs are recoverable under contractual arrangements. We generally conduct such activities in collaboration with our customers, which provide better visibility into areas we believe will accelerate our longer term sales growth. Our basic technologies have been developed through a combination of internal development, acquisitions of businesses with technologies in similar or adjacent fields and, more recently, through licenses. Our recent acquisitions have been more of a "tuck-in" nature, demonstrative of a business philosophy that is not hesitant to acquire a business when it is more cost efficient to buy technology than to develop it. Licenses have primarily been used to access technology geared to a commercial application that we can translate to a radiation hardened application for use in space.
On a consolidated basis, our research and development costs were $89.8 million for the fiscal year ended June 30, 2012, $90.1 million for the fiscal year ended June 30, 2011 and $76.2 million for the fiscal year ended June 30, 2010.
Acquisitions and Restructurings
During the three year period covered by the audited financial statements included elsewhere in this report, we made the following acquisitions:
| Date | Acquisition | Description | ||
| May 2010 | Willtek Communications | Wireless test equipment | ||
| June 2010 | Radiation Assured Devices | Radiation tolerant testing, screening and high reliability radiation tolerant components/ semiconductors | ||
| August 2010 | Advanced Control Components | RF and Microwave components and assemblies |
In August 2007, we were ourselves acquired and taken private. The application of purchase accounting is, therefore, pervasive throughout our consolidated financial statements, most notably in the balance sheets’ amortizable and non-amortizable intangible asset accounts and in the operating statements’ amortization of intangibles.
Acquired businesses often require restructuring activities to better align their on-going operations with those of our company and to improve their profitability. The majority of the restructuring charges contained in our consolidated financial statements relate to activities taken to consolidate our acquired European manufacturing operations and consolidate certain of our acquired U.S. components facilities. For instance:
| - 47 - |
| · | In the Aeroflex Microelectronic Solutions (“AMS”) segment, we implemented a plan in 2010 to move the resistor product line from our Whippany, New Jersey factory to our operations in Ann Arbor, Michigan. Additionally, in fiscal 2011 we implemented a plan to move the integrated product line in our Whippany factory to our then recently acquired facility in Eatontown, New Jersey. These actions, which were completed in fiscal 2011, better aligned our manufacturing operations and enabled us to close our Whippany factory. |
| · | In the Aeroflex Test Solutions (“ATS”) segment, we reorganized and integrated Willtek (a company we acquired in May 2010) into our existing U.K. operations. These activities began with the elimination of redundant personnel in fiscal 2011 and were completed in fiscal 2012 when Willtek’s manufacturing was moved from Germany to our U.K. manufacturing facility. Additionally, in response to substantially lower than expected sales in fiscal 2012, we reduced ATS headcount by 156 people (including 106 people in Europe within our wireless test business). |
For the fiscal year ended June 30, 2012, restructuring charges consisted of severance costs of $4.1 million, facility closure costs of $1.7 million and other non-cash charges of $1.0 million, primarily related to the continued integration of Willtek into our European operations and the continued consolidation of one of our domestic components facilities located in Whippany, New Jersey into two of our other facilities.
For the fiscal year ended June 30, 2011, restructuring charges consisted of (i) severance costs of $8.2 million and facility closure costs of $1.7 million, primarily related to the integration of Willtek into our European operations and the continued consolidation of one of our domestic components facilities located in Whippany, New Jersey into two of our other facilities, and (ii) a non-cash building impairment charge of $4.9 million, based on the fair value of the Whippany, New Jersey facility we intend to sell.
For the fiscal year ended June 30, 2010, restructuring charges consisted of severance costs of $526,000 offset by a reduction of $141,000 of facility closure costs previously accrued, related to continued consolidation and reorganization efforts in our European operations and the consolidation of one of our domestic components facilities located in Whippany, New Jersey into two of our other facilities.
Interest Expense
In connection with the Going Private Transaction, we incurred $870.0 million of debt to finance the acquisition of Aeroflex. See “—Quantitative and Qualitative Disclosures About Market Risk”.
In December 2010, we used the majority of the net proceeds from our IPO to repurchase an aggregate of $186.6 million of our senior unsecured notes and senior subordinated unsecured term loans.
In May 2011, we borrowed $725.0 million, under the senior secured term loan of our new senior secured credit facility at the adjusted LIBOR, which has a floor of 1.25%, plus a margin of 3.0% prior to amendment as described below, and repaid $695.5 million of our then existing debt, including $206.4 million of debt bearing interest at 11.75% per annum.
On May 24, 2012, we amended our senior secured credit facility, which allowed us to increase the flexibility under the total leverage ratio covenant. As a result of the amendment, the applicable LIBOR interest margin increased from 300 basis points to 450 basis points. These transactions, as well as the amount of debt repayments made in the normal course of business over the last few years, including approximately $80 million of prepayments in fiscal 2012, have significantly reduced the amount of debt outstanding to $641 million at June 30, 2012. As discussed above, the rates at which we borrow have also changed as a result of the aforementioned transactions. As a result, interest expense amounted to $83.9 million in fiscal 2010, $66.2 million in fiscal 2011 and $34.2 million in fiscal 2012.
| - 48 - |
Income Taxes
As a multi-national company, we are subject to income taxes in the U.S. and certain foreign jurisdictions. As earnings from our foreign operations are repatriated to the U.S., we are subject to U.S. income taxes on those amounts. Our tax provision may fluctuate from quarter to quarter and from year to year due to changes in jurisdictions where income is earned. In addition, our tax provision may be impacted by an enacted change in tax rates and/or availability of tax credits and incentives.
Results of Operations
The following table sets forth our historical results of operations as a percentage of net sales for the periods indicated below:
| Year Ended June 30, | ||||||||||||
| 2012 | 2011 | 2010 | ||||||||||
| Net sales | 100.0 | % | 100.0 | % | 100.0 | % | ||||||
| Cost of sales | 49.6 | 46.2 | 47.6 | |||||||||
| Gross profit | 50.4 | 53.8 | 52.4 | |||||||||
| Operating expenses: | ||||||||||||
| Selling, general and administrative costs | 22.6 | 20.6 | 19.8 | |||||||||
| Research and development costs | 13.3 | 12.4 | 11.6 | |||||||||
| Amortization of acquired intangibles | 9.3 | 8.8 | 9.5 | |||||||||
| Termination of Sponsor Advisory Agreement | - | 2.5 | - | |||||||||
| Restructuring charges | 1.0 | 2.0 | - | |||||||||
| Impairment of goodwill and other long-lived assets | 8.4 | - | - | |||||||||
| Change in fair value of acquisition contingent | ||||||||||||
| consideration liability | (1.1 | ) | 0.3 | - | ||||||||
| Loss on liquidation of foreign subsidiary | - | - | 1.2 | |||||||||
| Total operating expenses | 53.5 | 46.6 | 42.1 | |||||||||
| Operating income (loss) | (3.1 | ) | 7.2 | 10.3 | ||||||||
| Other income (expense): | ||||||||||||
| Interest expense | (5.1 | ) | (9.1 | ) | (12.8 | ) | ||||||
| Loss on extinguishment of debt and write-off of deferred financing costs | (0.2 | ) | (8.1 | ) | - | |||||||
| Gain from a bargain purchase of a business | - | - | 0.6 | |||||||||
| Other income (expense), net | (0.3 | ) | (0.1 | ) | 0.1 | |||||||
| Income (loss) before income taxes | (8.7 | ) | (10.1 | ) | (1.8 | ) | ||||||
| Provision (benefit) for income taxes | (0.7 | ) | (5.3 | ) | 0.1 | |||||||
| Net income (loss) | (8.0 | )% | (4.8 | )% | (1.9 | )% | ||||||
| - 49 - |
Statements of Operations
Management evaluates the operating results of our two segments based upon adjusted operating income, which is pre-tax operating income before certain non-cash, non-recurring and other items. We have set out below our adjusted operating income by segment and in the aggregate, and have provided a reconciliation of adjusted operating income to operating income (loss) on a GAAP basis and income (loss) before income taxes for the periods presented.
| - 50 - |
| Year Ended June 30, | ||||||||||||
| 2012 | 2011 | 2010 | ||||||||||
| (In thousands) | ||||||||||||
| Net sales | ||||||||||||
| - Microelectronic solutions ("AMS") | $ | 366,745 | $ | 370,035 | $ | 322,151 | ||||||
| - Test solutions ("ATS") | 306,270 | 359,379 | 332,897 | |||||||||
| Net sales | $ | 673,015 | $ | 729,414 | $ | 655,048 | ||||||
| Segment adjusted operating income | ||||||||||||
| - AMS | $ | 97,214 | $ | 103,210 | $ | 89,104 | ||||||
| - ATS | 16,974 | 65,652 | 67,621 | |||||||||
| - General corporate expense | (13,059 | ) | (12,322 | ) | (9,841 | ) | ||||||
| Adjusted operating income | 101,129 | 156,540 | 146,884 | |||||||||
| Amortization of acquired intangibles | ||||||||||||
| - AMS | (36,062 | ) | (36,913 | ) | (35,032 | ) | ||||||
| - ATS | (26,634 | ) | (26,759 | ) | (26,883 | ) | ||||||
| Share-based compensation | ||||||||||||
| - Corporate | (3,098 | ) | (2,254 | ) | (2,076 | ) | ||||||
| - AMS | (256 | ) | - | - | ||||||||
| - ATS | (173 | ) | - | - | ||||||||
| Restructuring charges | ||||||||||||
| - AMS | (1,426 | ) | (8,034 | ) | (172 | ) | ||||||
| - ATS | (5,353 | ) | (6,749 | ) | (213 | ) | ||||||
| Business acquisition costs - Corporate | (14 | ) | (282 | ) | (921 | ) | ||||||
| Change in fair value of acquisition contingent consideration liability - Corporate | 7,553 | (1,834 | ) | - | ||||||||
| Merger related expenses - Corporate | - | (1,222 | ) | (2,858 | ) | |||||||
| Termination of Sponsor Advisory Agreement - Corporate | - | (18,133 | ) | - | ||||||||
| Impairment of goodwill and other long-lived assets - AMS | (56,700 | ) | - | - | ||||||||
| Loss on liquidation of foreign subsidiary - ATS | - | - | (7,696 | ) | ||||||||
| Current period impact of acquisition related adjustments | ||||||||||||
| - AMS | (151 | ) | (768 | ) | (1,246 | ) | ||||||
| - ATS | 89 | (657 | ) | (1,593 | ) | |||||||
| - Corporate | (220 | ) | (220 | ) | (220 | ) | ||||||
| Operating income (loss) (GAAP) | (21,316 | ) | 52,715 | 67,974 | ||||||||
| Interest expense | (34,237 | ) | (66,204 | ) | (83,948 | ) | ||||||
| Loss on extinguishment of debt and write-off of deferred financing costs | (1,232 | ) | (59,395 | ) | - | |||||||
| Gain from a bargain purchase of a business | - | 173 | 3,993 | |||||||||
| Other income (expense), net | (1,745 | ) | (775 | ) | 532 | |||||||
| Income (loss) before income taxes | $ | (58,530 | ) | $ | (73,486 | ) | $ | (11,449 | ) | |||
| - 51 - |
Fiscal Year Ended June 30, 2012 Compared to Fiscal Year Ended June 30, 2011
Overview
Our consolidated sales of $673.0 million in fiscal 2012 were substantially less than we anticipated at the beginning of the fiscal year. The comparative fiscal 2011 amount of $729.4 million was a record. The decrease was due in large part to the marketplace difficulties encountered by ATS’ wireless test business. To a lesser extent, the changes in U.S. government-related purchasing patterns have also negatively impacted our business this year. Our backlog was $272.7 million at June 30, 2012 compared to $294.3 million at June 30, 2011.
We continued to feel the impact of the economic crisis in Europe and conservative capital spending in Asia geographies where the majority of our wireless test customers are located. Additionally, the rollout of the next generation wireless protocol, LTE (Long Term Evolution), has been significantly slower than we initially anticipated. We have maintained our strong position in the infrastructure market and continue to invest in our technology and customer relationships.
During the pause in this market, we have taken actions to combine certain operations and to right-size others, and will be taking additional measures to make our operations more efficient. For instance, we implemented a wage freeze and suspended the match to our 401(k) plan during fiscal 2012. We also initiated other cost saving measures by reducing personnel at various locations worldwide. The headcount reductions were most notable in the U.K., where our wireless test business is headquartered. On a consolidated basis, headcount was reduced 178 people. ATS implemented headcount reductions of 156 and AMS implemented headcount reductions of 22. The ATS reduction of 156 included 106 in Europe (65 contractors and 41 employees). Additionally, in July 2012, ATS’s wireless business implemented additional headcount reductions of 68 employees and took further steps to right size its business. The actions taken during fiscal 2012 and to be implemented in fiscal 2013 are expected to produce cost savings of approximately $15 million. Due to the timing of those actions, approximately $7 million of cost savings were achieved in fiscal 2012. The realization of the remaining cost savings in fiscal 2013 may be mitigated by a number of factors, such as to what extent (i) salary increases are given, (ii) the match to our 401(k) plan is reinstated, (iii) bonuses are achieved, and other costs subject to normal inflationary increases.
We have an experienced senior management team that has a demonstrated history of taking the actions necessary to manage our Company through difficult business climates, such as those experienced in the early 1990s when reductions took place in the levels of defense spending. The actions taken in fiscal 2012 will enable us to more efficiently navigate the current business environment and are expected to return Aeroflex to better profitability.
Net Sales. Net sales decreased $56.4 million, or 8%, to $673.0 million for the fiscal year ended June 30, 2012 from $729.4 million for the fiscal year ended June 30, 2011 primarily due to a decline in the ATS segment.
| Net Sales | ||||||||||||||||||||
| % of | % of | |||||||||||||||||||
| Fiscal Year | Consolidated | Consolidated | ||||||||||||||||||
| Ended June 30, | AMS | Net Sales | ATS | Net Sales | Total | |||||||||||||||
| 2012 | $ | 366,745 | 54.5 | % | $ | 306,270 | 45.5 | % | $ | 673,015 | ||||||||||
| 2011 | $ | 370,035 | 50.7 | % | $ | 359,379 | 49.3 | % | $ | 729,414 | ||||||||||
| - 52 - |
Net sales in the AMS segment decreased $3.3 million, or 1%, to $366.7 million for the fiscal year ended June 30, 2012 from $370.0 million for the fiscal year ended June 30, 2011. This sales decrease was primarily attributable to volume driven reductions in (i) sales of RF and microwave components primarily related to what we believe is a slowdown in the telecom/broadband market; (ii) sales of HiRel microelectronics/semiconductors primarily due to program delays, combined with government budgetary constraints on defense and space programs; and (iii) sales of motion control products primarily due to a delay in funding which pushed back sales for various programs. These reductions were offset by volume driven increases, the most significant of which was $14.4 million of mixed-signal/digital Application Specific Integrated Circuits (“ASICs”).
Net sales in the ATS segment decreased $53.1 million, or 15%, to $306.3 million for the fiscal year ended June 30, 2012 from $359.4 million for the fiscal year ended June 30, 2011. The decrease was attributable to a $43.6 million reduction in sales of wireless test equipment and a $19.0 million reduction in sales of general purpose test equipment, primarily due to capital equipment freezes put in place by our customers in the latter part of calendar year 2011 coincident with a slower than anticipated roll-out of 4G/LTE technology, particularly at certain of our larger handset customers and, to a lesser extent, pricing pressure. The decrease in sales was partially offset by an increase in sales of radio test sets of $7.9 million, which primarily relates to shipments of our GRMATS product.
Gross Profit. Gross profit equals net sales less cost of sales. Cost of sales includes materials, direct labor, amortization of capitalized software development costs and overhead expenses such as engineering labor, fringe benefits, depreciation, allocable occupancy costs and manufacturing supplies.
On a consolidated basis, gross profit was $338.9 million, or 50.4% of net sales, for the fiscal year ended June 30, 2012 compared to $392.1 million, or 53.8% of net sales, for the fiscal year ended June 30, 2011.
| Gross Profit | ||||||||||||||||||||||||
| Fiscal Year | % of | % of | % of | |||||||||||||||||||||
| Ended | Net | Net | Net | |||||||||||||||||||||
| June 30, | AMS | Sales | ATS | Sales | Total | Sales | ||||||||||||||||||
| 2012 | $ | 188,743 | 51.5 | % | $ | 150,143 | 49.0 | % | $ | 338,886 | 50.4 | % | ||||||||||||
| 2011 | $ | 192,494 | 52.0 | % | $ | 199,606 | 55.5 | % | $ | 392,100 | 53.8 | % | ||||||||||||
Gross margins in the AMS segment were 51.5% for the fiscal year ended June 30, 2012 and 52.0% for the fiscal year ended June 30, 2011. Gross profit decreased $3.8 million for the fiscal year ended June 30, 2012 as compared to the fiscal year ended June 30, 2011. The decrease in gross margin is principally attributable to product mix and decreased sales of HiRel microelectronics/semiconductors (which carry margins greater than the AMS segment average).
Gross margins in the ATS segment were 49.0% for the fiscal year ended June 30, 2012 and 55.5% for the fiscal year ended June 30, 2011. Gross profit decreased $49.5 million for the fiscal year ended June 30, 2012 as compared to the fiscal year ended June 30, 2011. The decrease in gross margin was caused primarily by the reduction in wireless sales, which carry margins greater than the ATS segment average, and the increased sales of the GRMATS products in the fiscal year ended June 30, 2012 which were sold at margins below the ATS segment average.
Selling, General and Administrative Costs. Selling, general and administrative (“SG&A”) costs include office and management salaries, fringe benefits, commissions, insurance and professional fees.
On a consolidated basis, SG&A costs were relatively flat when comparing fiscal 2012 to fiscal 2011. As a percentage of sales, however, SG&A costs increased from 20.6% to 22.6% from the fiscal year ended June 30, 2011 to the fiscal year ended June 30, 2012, due to the $56.4 million unanticipated reduction in sales. On a percentage basis to sales, SG&A costs increased in both the AMS and ATS segments as most of our costs are fixed in the short term.
| - 53 - |
As discussed above, actions have been taken to respond to the fiscal 2012 decline in sales. Concerning SG&A, the impact of the salary freeze and suspension of the 401(k) match initiated at the beginning of fiscal 2012, combined with the savings realized from the aforementioned headcount reductions, lower sales commissions and bonuses served to control and reduce costs by approximately $7 million; however, the savings were offset by a number of items, most notably (i) a $2.1 million increase in medical costs, (ii) a $1.8 million increase in litigation and settlement costs related to several litigation matters, and (iii) a $1.2 million increase in non-cash compensation related to equity awards under the Company’s 2011 equity plan.
The majority of the previously discussed headcount reductions were initiated during the second half of fiscal 2012 when the manufacturing operations by an acquired wireless business (Willtek) were integrated into our existing U.K. wireless manufacturing facility. In July 2012, our ATS wireless business made further headcount reductions and took additional steps to right size its business.
| Selling, General and Administrative Costs | ||||||||||||||||||||||||||||||
| Fiscal Year | % of | % of | % of | |||||||||||||||||||||||||||
| Ended | Net | Net | Net | |||||||||||||||||||||||||||
| June 30, | AMS | Sales | ATS | Sales | Corporate | Total | Sales | |||||||||||||||||||||||
| 2012 | $ | 54,553 | 14.9 | % | $ | 80,873 | 26.5 | % | $ | 16,392 | $ | 151,818 | 22.6 | % | ||||||||||||||||
| 2011 | $ | 53,645 | 14.5 | % | $ | 80,931 | 22.5 | % | $ | 16,299 | $ | 150,875 | 20.6 | % | ||||||||||||||||
Research and Development Costs. Research and development costs include materials, engineering labor and allocated overhead.
On a consolidated basis, research and development costs were relatively flat - $89.8 million for the fiscal year ended June 30, 2012 and $90.1 million for the fiscal year ended June 30, 2011. As a percentage of sales, research and development costs increased to 13.3% for the fiscal year ended June 30, 2012 from 12.4% for the fiscal year ended June 30, 2011.
The Company’s wireless test operation reduced its R&D contract manufacturing headcount by 65 people near the end of fiscal 2012, coincident with the completion of a number of initiatives.
| Research and Development Costs | ||||||||||||||||||||||||||
| Fiscal Year | % of | % of | % of | |||||||||||||||||||||||
| Ended | Net | Net | Net | |||||||||||||||||||||||
| June 30, | AMS | Sales | ATS | Sales | Total | Sales | ||||||||||||||||||||
| 2012 | $ | 37,382 | 10.2 | % | $ | 52,380 | 17.1 | % | $ | 89,762 | 13.3 | % | ||||||||||||||
| 2011 | $ | 36,407 | 9.8 | % | $ | 53,681 | 14.9 | % | $ | 90,088 | 12.4 | % | ||||||||||||||
Termination of Sponsor Advisory Agreement. In connection with the IPO, we paid a $16.9 million fee to affiliates of the Sponsors on November 24, 2010 to terminate the advisory agreement with them and eliminate all future payments to the Sponsors under that agreement which, including the related write-off of prepaid advisory fees, resulted in an $18.1 million expense in the fiscal year ended June 30, 2011. There was no similar charge recorded for the fiscal year ended June 30, 2012.
| - 54 - |
Restructuring Charges. On a consolidated basis, restructuring charges were $6.8 million for the fiscal year ended June 30, 2012 compared to $14.8 million for the fiscal year ended June 30, 2011.
The AMS segment incurred total restructuring costs of $1.4 million for the fiscal year ended June 30, 2012. In comparison, in the fiscal year ended June 30, 2011, the AMS segment incurred total restructuring costs of $8.0 million. In both periods, the costs related primarily to the consolidation of our components operations by relocating a portion of our Whippany, New Jersey facility’s production to our Ann Arbor, Michigan facility and a portion to our Eatontown, New Jersey facility. In connection with this consolidation, in the fiscal year ended June 30, 2011, we recorded a $4.9 million impairment charge based on the fair value of the Whippany, New Jersey facility we intend to sell.
The ATS segment incurred restructuring costs of $5.4 million for the fiscal year ended June 30, 2012, primarily related to cost savings initiatives which resulted in reductions in personnel at various locations worldwide, most notably in connection with integration of Willtek’s manufacturing operations in Germany into our U.K. facility. In comparison, for the fiscal year ended June 30, 2011, the ATS segment incurred restructuring costs of $6.7 million, primarily related to the reduction of Willtek’s workforce in Germany.
Impairment of Goodwill and Other Long-Lived Assets. In fiscal 2012, due to a decline in AMS’s RFMW reporting unit’s forecasted operating results for the fourth quarter of fiscal 2012 and beyond, we recorded non-cash impairment charges to goodwill and other long lived assets related to the RFMW reporting unit of $54.9 million and $1.8 million, respectively. There were no similar impairment charges recorded in the fiscal year ended June 30, 2011.
Change in Fair Value of Acquisition Contingent Liability. In the fiscal year ended June 30, 2012 we recognized a net benefit of $7.6 million related to the decrease in fair value of the acquisition contingent consideration liability due to the former owners of RAD, acquired in June 2010, due to slower than anticipated roll-out of new products, which has changed the future projection of sales during the earn-out period. In the fiscal year ended June 30, 2011 we recognized an expense of $1.8 million, primarily related to an increase in the contingent consideration liability.
Interest Expense. Interest expense decreased by $32.0 million to $34.2 million for the fiscal year ended June 30, 2012 from $66.2 million for the fiscal year ended June 30, 2011. Interest expense decreased as a result of the repurchase, in December 2010, of $186.6 million of our senior unsecured notes and senior subordinated unsecured term loans with the proceeds from our IPO, the refinancing in May 2011 of the then outstanding amounts due under the prior secured credit facility, senior unsecured notes and senior subordinated unsecured term loan with borrowings under a new senior secured credit facility at lower aggregate interest rates and repayments of $84.0 million of our term loan and other debt in fiscal 2012.
We expect the full impact to interest expense of the debt amendment completed in May 2012 will be reflected in fiscal 2013 when, based on current rates and giving effect to the $20 million repaid in August 2012 interest expense will amount to approximately $36.3 million in fiscal 2013.
Loss on Extinguishment of Debt and Write-off of Deferred Financing Costs. During the fiscal year ended June 30, 2011 we incurred a $59.4 million loss on extinguishment of debt and write-off of deferred financing costs, which was comprised primarily of $38.8 million in tender premiums paid on the debt repurchased and $19.8 million for the write-off of the related deferred financing costs. During the fiscal year ended June 30, 2012, we wrote-off $1.2 million of deferred financing costs related to the prepayment of $80 million of debt.
Gain from a Bargain Purchase of a Business. During the fiscal year ended June 30, 2011 we recognized a $173,000 gain on the Willtek bargain purchase, acquired in June 2010, related to the final working capital adjustment to the purchase price.
| - 55 - |
Other Income (Expense). Other income (expense) of $(1.7) million for the fiscal year ended June 30, 2012 consisted of $(883,000) of foreign currency transaction losses and $(862,000) of miscellaneous expense, net. Other income (expense) of $(775,000) for the fiscal year ended June 30, 2011 consisted of a $(688,000) other than temporary impairment recorded on our auction rate securities and $(634,000) of foreign currency transactions losses offset by $547,000 of interest income and miscellaneous income, net.
Income Taxes. The income tax benefit was $4.9 million for the fiscal year ended June 30, 2012 on a pre-tax loss of $58.5 million resulting in an effective tax rate of 8.4%. The reported tax benefit was less than anticipated due to a goodwill and intangible impairment charge of $55.6 million in the U.S. that was mostly non-deductible. Another significant item impacting the effective tax rate for fiscal 2012 was the benefit from the reversal of the contingent consideration of $7.6 million that was not taxable. We recorded an income tax benefit for the fiscal year ended June 30, 2011 of $38.8 million on a pre-tax loss of $73.5 million resulting in an effective tax rate of 52.8%. In fiscal 2011, we had a pre-tax loss in the U.S. and taxable income from foreign operations. The U.S. loss was primarily due to expenses associated with our debt (interest expense, loss on extinguishment of debt and write-off of deferred financing costs) and for the termination of the Sponsor Advisory Agreement. The effective tax rate for both periods differed from the amount computed by applying the U.S. federal income tax rate to income before taxes primarily due to foreign, state and local income taxes, including U.S. income tax on certain foreign net income that we anticipate will be repatriated to the U.S, the R&D credit and non-deductible and other non-taxable items.
We evaluate the recoverability of our deferred tax assets, including net operating loss carryforwards, by assessing the adequacy of future expected taxable income from all sources, including reversal of taxable temporary differences, forecasted operating earnings and available tax planning strategies. Based on the significant balance of deferred tax liabilities associated with our intangible assets that are scheduled to reverse over the next several years, we did not record a valuation allowance against the deferred tax asset generated in fiscal 2011 with respect to our U.S. net operating loss carryforwards.
Although the Company has a history of domestic pre-tax losses in recent years, these losses are largely driven by amortization expense recorded in the financial statements relating to the U.S. operations which are not deductible for U.S. income tax purposes. The amount of non-deductible U.S. book amortization expense recorded in fiscal 2012 and 2011 was $53.4 million and $54.3 million, respectively. During fiscal 2011, the Company incurred unusual charges of $18.1 million in connection with the termination of the Sponsor Advisory Agreement and $59.4 million in connection with the refinancing of its debt that resulted in a taxable loss for which a deferred tax asset was recorded for the net operating loss carryforwards.
The domestic loss reported in fiscal 2012 was largely the result of an impairment charge of $55.6 million, of which $50.4 million is non-deductible. In addition, the Company repatriated $17.2 million of earnings from a foreign subsidiary during the year for which U.S. tax was previously provided. The combination of non-deductible amortization expense, the non-deductible impairment charge and repatriated earnings resulted in the Company generating sufficient U.S. taxable income in 2012 to fully utilize its Federal net operating loss carryforward from 2011.
At June 30, 2011, we had provided U.S. deferred taxes of $10.8 million on the accumulated earnings of one foreign subsidiary based on the Company’s intent to repatriate these earnings. Part of these earnings were repatriated to the U.S. during fiscal 2012 which was used to pay down principal on the Company’s outstanding debt. During fiscal 2012, we also provided U.S. deferred taxes of $3.5 million on the accumulated earnings of this subsidiary and two additional foreign subsidiaries for which the Company intends to repatriate the earnings in the foreseeable future. At June 30, 2012, the Company has approximately $8.0 million of U.S. deferred taxes provided for the expectation of the repatriation of these earnings. Aside from these three subsidiaries, the Company does not have any significant overseas earnings for which U.S. taxes have not been provided.
| - 56 - |
During the three months ended September 30, 2010, we identified an overstatement of deferred income tax liabilities established in the fourth quarter of fiscal 2009 and throughout fiscal 2010 related to U.S. income taxes provided on unremitted foreign earnings. After consideration of both the quantitative and qualitative factors, we determined the amounts were not material to any of those prior period financial statements or the fiscal 2011 estimated results and thus corrected the balance in the three months ended September 30, 2010. The adjustment resulted in a reduction of deferred income tax liabilities of $3.7 million, with a corresponding increase in income tax benefit in the statement of operations for the three months ended September 30, 2010. The adjustment did not impact the statement of cash flows.
In the fiscal years ended June 30, 2012 and 2011, we paid income taxes of $9.2 million and $15.0 million and received refunds of $194,000 and $3.1 million, respectively related to federal, state and foreign income taxes.
Net Income (Loss). Net income (loss) was $(53.6) million for the fiscal year ended June 30, 2012 and $(34.7) million for the fiscal year ended June 30, 2011.
Fiscal Year Ended June 30, 2011 Compared to Fiscal Year Ended June 30, 2010
Net Sales. Net sales increased $74.4 million, or 11%, to $729.4 million for the year ended June 30, 2011 from $655.0 million for the year ended June 30, 2010. Businesses acquired since May 7, 2010 contributed $32.3 million.
| Net Sales | ||||||||||||||||||||||
| % of | % of | |||||||||||||||||||||
| Fiscal Year | Consolidated | Consolidated | ||||||||||||||||||||
| Ended June 30, | AMS | Net Sales | ATS | Net Sales | Total | |||||||||||||||||
| 2011 | $ | 370,035 | 50.7 | % | $ | 359,379 | 49.3 | % | $ | 729,414 | ||||||||||||
| 2010 | $ | 322,151 | 49.2 | % | $ | 332,897 | 50.8 | % | $ | 655,048 | ||||||||||||
Net sales in the AMS segment increased $47.9 million, or 15%, to $370.0 million for the year ended June 30, 2011 from $322.2 million for the year ended June 30, 2010. Specific variances include a volume driven $24.8 million increase in sales of components, including $11.1 million from ACC, acquired in August 2010; a volume driven $18.3 million increase in sales of integrated circuits; and additional sales of $6.3 million from RAD, acquired in June 2010. The increases in sales were partially offset by volume driven reductions of $1.5 million, primarily due to a $1.1 million reduction in sales of motion control products.
Net sales in the ATS segment increased $26.5 million, or 8%, to $359.4 million for the year ended June 30, 2011 from $332.9 million for the year ended June 30, 2010. Specific variances include a volume driven $22.4 million increase in sales of wireless test products, including a $14.5 million increase from Willtek, acquired in May 2010; a volume driven $7.5 million increase in sales of radio test products; and a volume driven $6.2 million increase in sales from avionic products. The increases in net sales were partially offset by a volume driven reduction of $9.3 million in sales of general purpose test products.
Gross Profit. On a consolidated basis, gross profit was $392.1 million, or 53.8% of net sales, for the year ended June 30, 2011 and $343.0 million, or 52.4% of net sales, for the year ended June 30, 2010.
| - 57 - |
| Gross Profit | ||||||||||||||||||||||||||
| Fiscal Year | % of | % of | % of | |||||||||||||||||||||||
| Ended | Net | Net | Net | |||||||||||||||||||||||
| June 30, | AMS | Sales | ATS | Sales | Total | Sales | ||||||||||||||||||||
| 2011 | $ | 192,494 | 52.0 | % | $ | 199,606 | 55.5 | % | $ | 392,100 | 53.8 | % | ||||||||||||||
| 2010 | $ | 162,447 | 50.4 | % | $ | 180,538 | 54.2 | % | $ | 342,985 | 52.4 | % | ||||||||||||||
Gross margins in the AMS segment were 52.0% for the year ended June 30, 2011 and 50.4% for the year ended June 30, 2010. The increase in gross margins is principally attributable to a favorable product mix and increased sales of integrated circuits, combined with the additional sales of RAD services, acquired in June 2010 (which have margins higher than the segment average). Gross profit increased $30.0 million for the fiscal year ended June 30, 2011 as compared to the fiscal year ended June 30, 2010 principally due to increased sales and the aforementioned increase in gross margins.
Gross margins in the ATS segment were 55.5% for the fiscal year ended June 30, 2011 and 54.2% for the fiscal year ended June 30, 2010. The increase in gross margins is principally attributable to a favorable product mix and increased sales of wireless products, which have margins higher than the segment average. Gross profit increased $19.1 million for the fiscal year ended June 30, 2011 as compared to the fiscal year ended June 30, 2010 due to increased sales and the aforementioned increase in gross margins.
Selling, General and Administrative Costs. On a consolidated basis, SG&A costs increased $22.0 million, or 17%, to $150.9 million for the fiscal year ended June 30, 2011. This increase was primarily attributable to the additional SG&A costs of the acquired businesses, which were not fully integrated during the period, and the expansion of our sales and marketing team in the Asia-Pacific region. As a percentage of sales, SG&A costs increased from 19.8% to 20.6% from the fiscal year ended June 30, 2010 to the fiscal year ended June 30, 2011. The SG&A of the acquired businesses since May 7, 2010 increased SG&A by $5.9 million, or 5.0%.
| Selling, General and Administrative Costs | ||||||||||||||||||||||||||||||
| Fiscal Year | % of | % of | % of | |||||||||||||||||||||||||||
| Ended | Net | Net | Net | |||||||||||||||||||||||||||
| June 30, | AMS | Sales | ATS | Sales | Corporate | Total | Sales | |||||||||||||||||||||||
| 2011 | $ | 53,645 | 14.5 | % | $ | 80,931 | 22.5 | % | $ | 16,299 | $ | 150,875 | 20.6 | % | ||||||||||||||||
| 2010 | $ | 43,001 | 13.3 | % | $ | 69,944 | 21.0 | % | $ | 15,915 | $ | 128,860 | 19.8 | % | ||||||||||||||||
In the AMS segment, SG&A costs increased $10.6 million, or 25%, to $53.6 million for the fiscal year ended June 30, 2011. This increase is primarily due to additional costs of $4.9 million related to RAD, acquired in June 2010, and ACC, acquired in August 2010, as well as general increases in our existing businesses, primarily due to increased employee related expenses of $3.0 million and professional fees of $1.0 million. SG&A costs in the AMS segment increased from 13.3% to 14.5%, as a percentage of sales, from the fiscal year ended June 30, 2010 to the fiscal year ended June 30, 2011.
| - 58 - |
In the ATS segment, SG&A costs increased $11.0 million, or 16%, to $80.9 million for the fiscal year ended June 30, 2011, primarily due to increased employee related expenses of $5.1 million; increased commissions of $3.9 million, due to the increase in sales volume and a change in product mix; and additional costs of $2.8 million related to Willtek, acquired in May 2010. As a percentage of sales, SG&A costs in the ATS segment increased from 21.0% to 22.5% from the fiscal year ended June 30, 2010 to the fiscal year ended June 30, 2011.
Corporate general and administrative costs increased $384,000 for the fiscal year ended June 30, 2011 compared to the fiscal year ended June 30, 2010 primarily due to an increase in employee related expenses of $1.8 million and public company related costs of $820,000, for which there was no similar charge recorded for the fiscal year ended June 30, 2010; partially offset by a reduction in merger related expenses and sponsor fees of $1.6 million.
Research and Development Costs. On a consolidated basis, research and development costs increased by $13.9 million, or 18%, to $90.1 million for the fiscal year ended June 30, 2011. This increase was primarily attributable to the additional costs of the acquired businesses and the acceleration of research and development projects in our ATS segment to meet customer requirements for new products. As a percentage of sales, research and development costs increased from 11.6% to 12.4% from the fiscal year ended June 30, 2010 to the fiscal year ended June 30, 2011. Research and development costs of acquired businesses increased research and development by $5.1 million, or 6.8%.
| Research and Development Costs | ||||||||||||||||||||||||||
| Fiscal Year | % of | % of | % of | |||||||||||||||||||||||
| Ended | Net | Net | Net | |||||||||||||||||||||||
| June 30, | AMS | Sales | ATS | Sales | Total | Sales | ||||||||||||||||||||
| 2011 | $ | 36,407 | 9.8 | % | $ | 53,681 | 14.9 | % | $ | 90,088 | 12.4 | % | ||||||||||||||
| 2010 | $ | 31,588 | 9.8 | % | $ | 44,567 | 13.4 | % | $ | 76,155 | 11.6 | % | ||||||||||||||
AMS segment self-funded research and development costs increased $4.8 million, or 15%, to $36.4 million for the fiscal year ended June 30, 2011 primarily due to additional spending of $2.8 million on projects within integrated circuits and additional spending of $1.9 million related to ACC, acquired in August 2010. As a percentage of sales, AMS segment research and development costs remained at 9.8%.
ATS segment self-funded research and development costs increased $9.1 million, or 20%, to $53.7 million for the fiscal year ended June 30, 2011 primarily due to increases in our radio test and avionics divisions, for the development of a common platform technology, and additional costs of $3.2 million related to Willtek, acquired in May 2010. As a percentage of sales, ATS segment research and development costs increased from 13.4% for the fiscal year ended June 30, 2010 to 14.9% for the fiscal year ended June 30, 2011.
Amortization of Acquired Intangibles. Amortization of acquired intangibles increased $1.8 million for the fiscal year ended June 30, 2011 primarily due to additional amortization related to the acquisitions of RAD, in June 2010; and ACC, in August 2010. The increases in amortization were partially offset by certain intangibles becoming fully amortized during fiscal 2011. By segment, the amortization increased $1.9 million in the AMS segment and decreased $124,000 in the ATS segment.
Termination of Sponsor Advisory Agreement. In connection with the IPO, we paid a $16.9 million Termination Fee to affiliates of the Sponsors on November 24, 2010 to terminate the Sponsor Advisory Agreement with them and eliminate all future payments to the Sponsors under that agreement, which, including the related write-off of prepaid advisory fees, resulted in an $18.1 million expense. There was no similar charge recorded for the fiscal year ended June 30, 2010.
Restructuring Charges. On a consolidated basis, restructuring charges were $14.8 million for the fiscal year ended June 30, 2011, compared to $385,000 for the fiscal year ended June 30, 2010.
| - 59 - |
The AMS segment incurred total restructuring costs of $8.0 million for the fiscal year ended June 30, 2011. In comparison, in the fiscal year ended June 30, 2010, the AMS segment incurred total restructuring costs of $172,000. In both periods, the costs related primarily to consolidation of our components operations by relocating a portion of our Whippany, New Jersey facility’s production to our Ann Arbor, Michigan facility and a portion to our Eatontown, New Jersey facility. In connection with this consolidation, during the fiscal year ended June 30, 2011, we recorded a $4.9 million building impairment charge based on the fair value of the Whippany, New Jersey facility we intend to sell.
The ATS segment incurred restructuring costs of $6.7 million for the fiscal year ended June 30, 2011. In comparison, for the fiscal year ended June 30, 2010, the ATS segment incurred restructuring costs of $213,000. In both periods, the costs related primarily to consolidation and reorganization efforts in our European operations with the increase in the fiscal year ended June 30, 2011 due to the integration of Willtek.
Change in Fair Value of Acquisition Contingent Liability. In the fiscal year ended June 30, 2011 we recognized an expense of $1.8 million, related to the contingent earnout of the former shareholders of RAD.
Loss on Liquidation of Foreign Subsidiary. During the fiscal year ended June 30, 2010, we recognized a $7.7 million non-cash loss on liquidation of a foreign subsidiary. There was no similar charge recorded for the fiscal year ended June 30, 2011.
Other Income (Expense). Interest expense was $66.2 million for the fiscal year ended June 30, 2011 and $83.9 million for the fiscal year ended June 30, 2010. Interest expense decreased as a result of the repurchase, in December 2010, of $186.6 million of our senior unsecured notes and senior subordinated unsecured term loans with the proceeds from the IPO and the refinancing in May 2011 of the then outstanding amounts due under the prior secured credit facility, senior unsecured notes and senior subordinated unsecured term loan with borrowings under a new senior secured credit facility at lower aggregate interest rates.
During the fiscal year ended June 30, 2011 we incurred a $59.4 million loss on extinguishment of debt and write-off of deferred financing costs, which was comprised primarily of $38.8 million in tender premiums paid on the debt repurchased and $19.8 million for the write-off of the related deferred financing costs.
During the fiscal year ended June 30, 2010, we recognized a $4.0 million gain from a bargain purchase of the assets of Willtek Communications, acquired May 2010. The gain from a bargain purchase of Willtek reflects the excess of the fair value of tangible and intangible assets acquired less the liabilities assumed over the purchase price. The purchase price was negotiated at such a level to be reflective of the cost of the restructuring efforts. During the fiscal year ended June 30, 2011 we recognized an additional $173,000 gain on the Willtek bargain purchase, related to the final working capital adjustment to the purchase price.
Other income (expense) of $(775,000) for the fiscal year ended June 30, 2011 consisted primarily of a $(688,000) realized loss recorded on our auction rate securities and $(634,000) of foreign currency transaction losses, partially offset by $547,000 of interest and miscellaneous income. Other income (expense) of $532,000 for the fiscal year ended June 30, 2010 consisted primarily of $1.4 million of interest and miscellaneous income, partially offset by $(905,000) of foreign currency transaction losses.
Income Taxes. For fiscal 2011, we had a pre-tax loss in the U.S. and taxable income from foreign operations. The U.S. loss was primarily due to expenses associated with our debt (interest expense, loss on extinguishment of debt and write-off of deferred financing costs) and for the termination of the Sponsor Advisory Agreement. We recorded an overall income tax benefit of $38.8 million for the fiscal year ended June 30, 2011 on a pre-tax loss of $73.5 million, resulting in an effective income tax rate of 52.8%. We recorded an income tax provision for the fiscal year ended June 30, 2010 of $820,000 on a pre-tax loss of $11.4 million, resulting in an effective income tax rate of (7.2)%. The provisions were a combination of U.S. tax benefits on domestic losses and foreign tax expense on foreign earnings. The effective income tax rate for both periods differed from the amount computed by applying the U.S. Federal income tax rate to income before income taxes primarily due to foreign, state and local income taxes, including U.S. income tax on certain foreign net income that we anticipated would be repatriated to the U.S., the R&D credit and non-deductible items.
| - 60 - |
As a direct result of our IPO, and related repurchase of a portion of our debt in December 2010, interest payments have decreased. Consequently, in the quarter ended December 31, 2010, we changed our intent as to the amount and method of repatriations of foreign earnings, which resulted in a $5.8 million reduction of deferred tax liabilities related to U.S. income taxes previously provided on unremitted foreign earnings. The income tax benefit for the fiscal year ended June 30, 2011 also reflects other discrete items, including an $890,000 income tax benefit for the retroactive reinstatement of the U.S. R&D credit and a reduction of $314,000 of net deferred tax liabilities due to a reduction in the United Kingdom income tax rate. At June 30, 2011, we had provided U.S. deferred income taxes of $10.8 million on the accumulated earnings of one foreign subsidiary which we intended to repatriate to the U.S.
During the three months ended September 30, 2010, we identified an overstatement of deferred income tax liabilities established in the fourth quarter of fiscal 2009 and throughout fiscal 2010 related to U.S. income taxes provided on unremitted foreign earnings. After consideration of both quantitative and qualitative factors, we determined the amounts were not material to any of those prior period financial statements or the fiscal 2011 estimated results and thus corrected the balance in the three months ended September 30, 2010. The adjustment resulted in a reduction of deferred income tax liabilities of $3.7 million, with a corresponding increase in income tax benefit in the statement of operations for the three months ended September 30, 2010. The adjustment did not impact the statement of cash flows and was not material to fiscal 2011 results.
The tax provision for the fiscal year ended June 30, 2010 was affected by the unfavorable impact of a $7.7 million nondeductible loss on the liquidation of a foreign subsidiary, and the favorable impact of a $10.3 million loss for tax purposes on the write-off of our investment in a foreign subsidiary in fiscal 2009. For financial statement purposes, the loss had been recognized in the prior periods, however, for tax purposes the loss was recognized at the time of divestiture, effective September 2009. The fiscal year ended June 30, 2010 provision also included U.S. income taxes on a substantial portion of our foreign earnings that were to be repatriated to the U.S. to partially fund interest and principal payments on our debt. The impact of the above mentioned items significantly increased the effective income tax rate for fiscal 2010.
In the fiscal year ended June 30, 2011 we paid income taxes of $15.0 million and received tax refunds of $3.1 million related to federal, state and foreign income taxes. In the fiscal year ended June 30, 2010, we paid income taxes of $6.1 million and received refunds of $633,000.
Net Loss. Our net loss was $34.7 million for the fiscal year ended June 30, 2011 and $12.3 million for the fiscal year ended June 30, 2010. The $22.4 million unfavorable increase in net loss is comprised of the following: a loss on extinguishment of debt and write-off of deferred financing costs of $59.4 million in connection with the debt repurchase in December 2010 and debt refinancing in May 2011; an increase in operating expenses of $53.9 million, primarily due to increased SG&A costs, R&D spending and restructuring expenses; an expense related to the termination of the Sponsor Advisory Agreement of $18.1 million in connection with the IPO in November 2010; and an unfavorable variance of a gain from a bargain purchase of the assets of Willtek of $3.8 million; partially offset by an increase of $49.1 million in gross profit, primarily due to increased sales and increased margins; a decrease in the income tax provision of $39.6 million; a favorable variance in other income (expense) of $16.4 million, primarily due to a decrease in interest expense of $17.7 million as a result of the debt repurchase in December 2010 and the debt refinancing in May 2011; and a non-cash loss on liquidation of a foreign subsidiary of $7.7 million in fiscal 2010, which did not recur in fiscal 2011.
| - 61 - |
Liquidity and Capital Resources
As of June 30, 2012, we had $41.3 million of cash and cash equivalents, $289.2 million in working capital and our current ratio was 3.70 to 1, versus $66.3 million, $324.3 million and 3.05 to 1, respectively, at June 30, 2011.
Our principal liquidity requirements are to service our debt and interest and meet our working capital and capital expenditure needs. During fiscal 2012, we repaid $83.6 million of our senior secured term loan facility, including voluntary prepayments of $80.0 million, with cash on hand at June 30, 2011 and cash generated from operations during fiscal 2012 that included significant reductions in accounts receivable and inventory. The voluntary prepayments resulted in the write-off of the related deferred financing costs of $1.2 million. These voluntary prepayments were first applied to the scheduled quarterly repayments beginning with the March 31, 2012 payment, and second, to the amount due at the end of the term of the loan. Therefore, we will not have any further required quarterly repayments and will be required to pay $641.4 million on May 9, 2018. On May 24, 2012, we amended our senior secured credit facility, for which we paid a $3.5 million fee to the lenders which was recorded as deferred financing costs and $83,000 of other costs that were expensed as incurred, which allowed us to increase the flexibility under the total leverage ratio covenant. Additionally, at June 30, 2012, we were able to borrow $75.0 million under the revolving portion of our senior secured credit facility, of which none was outstanding.
| - 62 - |
As of June 30, 2012, we were in compliance with all of the covenants contained in our debt agreement. Certain loan covenants are based on Adjusted EBITDA. Adjusted EBITDA is defined as EBITDA (net income (loss) before interest expense, income taxes, depreciation and amortization), adjusted to add back or subtract certain non-cash, non-recurring and other items, as required by various covenants in our debt agreement. Our use of the term Adjusted EBITDA may vary from others in our industry. EBITDA and Adjusted EBITDA are not measures of operating income (loss), performance or liquidity under U.S. GAAP and are subject to important limitations. A reconciliation of net income (loss), which is a U.S. GAAP measure of our operating results, to Adjusted EBITDA, as defined in our debt agreement, is as follows:
| Year Ended June 30, | ||||||||||||
| 2012 | 2011 | 2010 | ||||||||||
| (In thousands) (Unaudited) | ||||||||||||
| Net income (loss) | $ | (53,637 | ) | $ | (34,668 | ) | $ | (12,269 | ) | |||
| Interest expense | 34,237 | 66,204 | 83,948 | |||||||||
| Provision (benefit) for income taxes | (4,893 | ) | (38,818 | ) | 820 | |||||||
| Depreciation and amortization | 84,298 | 83,459 | 82,696 | |||||||||
| EBITDA | 60,005 | 76,177 | 155,195 | |||||||||
| Non-cash purchase accounting adjustments | - | 1,155 | 700 | |||||||||
| Change in fair value of acquisition contingent | ||||||||||||
| consideration liability | (7,553 | ) | 1,834 | - | ||||||||
| Merger related expenses | - | 1,222 | 2,858 | |||||||||
| Restructuring costs and related pro forma savings (a) | 14,783 | 21,085 | 385 | |||||||||
| Share-based compensation | 3,527 | 2,254 | 2,076 | |||||||||
| Termination of Sponsor Advisory Agreement | - | 18,133 | - | |||||||||
| Impairment of goodwill and other long-lived assets | 56,700 | |||||||||||
| Loss on liquidation of foreign subsidiary | - | - | 7,696 | |||||||||
| Loss on extinguishment of debt and write-off of deferred financing costs | 1,232 | 59,395 | - | |||||||||
| Gain from a bargain purchase of a business | - | (173 | ) | (3,993 | ) | |||||||
| Other defined items (b) | 2,788 | 2,616 | 1,213 | |||||||||
| Adjusted EBITDA | $ | 131,482 | $ | 183,698 | $ | 166,130 | ||||||
| (a) | Primarily reflects costs associated with the reorganization of our European operations and consolidation of certain of our U.S. component facilities. Pro forma savings reflect the costs that we estimate would have been eliminated during the fiscal year in which a restructuring occurred had the restructuring occurred as of the first day of that fiscal year. Pro forma savings were estimated to be $8.0 million for the year ended June 30, 2012. |
| (b) | Reflects other adjustments required in calculating our debt covenant compliance. These other defined items include legal fees related to litigation, business acquisition costs and pro forma EBITDA for periods prior to the acquisition dates for companies acquired during our fiscal year. |
Financial covenants in our senior secured credit facility include a maximum leverage ratio of total debt (less up to $15.0 million of unrestricted cash) to Adjusted EBITDA, as defined in our senior secured credit facility. The maximum leverage ratio permitted for the fiscal year ended June 30, 2012 was 5.75, whereas our actual leverage ratio was 4.76. The maximum leverage ratio permitted periodically decreases as follows:
| - 63 - |
| Effective as of | Maximum | |
| the Twelve Months | Permitted | |
| Ending | Leverage Ratio | |
| March 31, 2013 | 5.50 | |
| September 30, 2013 | 5.25 | |
| March 31, 2014 | 5.00 | |
| June 30, 2014 | 4.50 | |
| September 30, 2014 | 4.00 | |
| December 31, 2014 | 3.75 | |
| March 31, 2015 | 3.50 |
We believe we will continue to be in compliance with the leverage ratio for the fiscal year ending June 30, 2013.
Our senior secured credit facility contains restrictions on our activities, including but not limited to covenants that restrict us and our restricted subsidiaries, as defined in our senior secured credit facility, from:
| · | incurring additional indebtedness and issuing disqualified stock or preferred stock; |
| · | making certain investments or other restricted payments; |
| · | paying dividends and making other distributions with respect to capital stock, or repurchasing, redeeming or retiring capital stock or subordinated debt; |
| · | selling or otherwise disposing of assets; |
| · | under certain circumstances, issuing or selling equity interests; |
| · | creating liens on our assets; |
| · | consolidating or merging with, or acquiring in excess of specified annual limitations, another business, or selling or disposing of all or substantially all of our assets; and |
| · | entering into certain transactions with our affiliates. |
If for any reason we fail to comply with the covenants in the senior secured credit facility, we would be in default under the terms of the agreements governing our outstanding debt. If such a default were to occur, the lenders under the senior secured credit facility could elect to declare all amounts outstanding thereunder immediately due and payable, and the lenders would not be obligated to continue to advance funds to us. If the amounts outstanding under these debt agreements are accelerated, our assets may not be sufficient to repay in full the amounts owed.
We expect that cash generated from operating activities and availability under the revolving portion of our new senior secured credit facility will be our principal sources of liquidity. Our ability to make payments on and to refinance our indebtedness and to fund working capital needs and planned capital expenditures will depend on our ability to generate cash in the future. This, to a certain extent, is subject to general economic, financial, competitive and other factors that are beyond our control. In addition, to the extent we have consolidated excess cash flows, as defined in the credit agreement governing the senior secured credit facility, we must use specified portions of the excess cash flows to prepay the senior secured credit facility. Based on our current level of operations, we believe our cash flow from operations and available borrowings under our senior secured credit facility will be adequate to meet our liquidity needs for at least the next twelve months. We cannot assure you, however, that our business will generate sufficient cash flow from operations, or those future borrowings will be available under the senior secured credit facility in an amount sufficient to enable us to repay our indebtedness at maturity or to fund other liquidity needs. We may need to refinance all or a portion of our indebtedness on or before the maturity thereof. We cannot assure you that we will be able to refinance any of our indebtedness on commercially reasonable terms or at all.
| - 64 - |
Cash Flows
For fiscal 2012, our cash flow provided by operations was $90.4 million, which included cash generated by reductions in accounts receivable of $19.9 million and inventory of $25.5 million due to concerted efforts made to better manage these items in fiscal 2012. Our investing activities used cash of $26.5 million, primarily for capital expenditures of $21.8 million and earn-out payments of $5.1 million related to acquired businesses. Our financing activities used cash of $88.7 million, primarily for debt repayments of $84.0 million (that included $80 million of voluntary prepayments).
For fiscal 2011, our cash flow used by operations was $5.5 million, which included cash used to increase inventory by $55.0 million in support of higher sales, to address longer lead times from suppliers and to reduce product delivery times to customers. Our investing activities used cash of $38.3 million, primarily for payments for the purchase of businesses of $23.7 million and for capital expenditures of $26.0 million, partially offset by proceeds from the sale of marketable securities of $10.4 million. Our financing activities provided cash of $6.6 million—$725.0 million of proceeds from term loan borrowings under our senior secured credit facility and $244.0 million from the IPO of our common stock, partially offset by the repurchase of senior unsecured notes and senior subordinated unsecured term loans, including premiums and fees, of $432.5 million, debt repayments of $510.9 million and debt financing costs of $18.9 million.
For fiscal 2010, our cash flow provided by operations was $82.1 million. Our investing activities used cash of $31.1 million, primarily for payments for the purchase of businesses of $19.8 million, net of cash acquired, and for capital expenditures of $21.0 million. These investing activities were offset by $8.6 million received from the redemption of auction rate securities. Our financing activities used cash of $5.6 million to repay indebtedness.
Capital Expenditures
Capital expenditures were $21.8 million, $26.0 million and $21.0 million in fiscal 2012, fiscal 2011 and fiscal 2010, respectively. Our capital expenditures primarily consist of equipment replacements.
Contractual Obligations
The following table summarizes our obligations and commitments to make future payments under debt and other obligations as of June 30, 2012:
| Payments Due By Period | ||||||||||||||||||||
| (In millions) | ||||||||||||||||||||
| Beyond | ||||||||||||||||||||
| Total | Year 1 | Years 2 - 3 | Years 4 - 5 | 5 Years | ||||||||||||||||
| Senior secured credit facility | $ | 641.4 | $ | - | $ | - | $ | - | $ | 641.4 | ||||||||||
| Interest payments | 225.6 | 37.5 | 75.6 | 75.2 | 37.3 | |||||||||||||||
| Operating leases(1) | 30.2 | 8.2 | 10.8 | 7.0 | 4.2 | |||||||||||||||
| Employment agreements | 7.6 | 4.1 | 3.4 | 0.1 | - | |||||||||||||||
| Total | $ | 904.8 | $ | 49.8 | $ | 89.8 | $ | 82.3 | $ | 682.9 | ||||||||||
| (1) | We do not expect any future minimum sub-lease rentals associated with operating lease commitments shown in the above table. |
| - 65 - |
As of June 30, 2012 we were unable to reliably estimate when cash settlements, if any, with the taxing authorities may occur with our unrecognized tax benefits of $2.6 million; therefore, such amounts are not included in the table above.
In the normal course of business, we routinely enter into binding and non-binding purchase obligations primarily covering anticipated purchases of inventory and equipment. None of these obligations are individually significant. We do not expect that these commitments, as of June 30, 2012, will have a material adverse affect on our liquidity.
Off-Balance Sheet Arrangements
We do not maintain any off-balance sheet arrangements, transactions, obligations or other relationships with unconsolidated entities that would be expected to have material current or future effect upon our results of operations or financial condition.
Critical Accounting Policies and Estimates
Our financial statements are prepared in conformity with U.S. GAAP. We consolidate our subsidiaries, all of which, except for Test Evolution Corporation, are wholly owned. All significant intercompany balances and transactions have been eliminated.
The preparation of financial statements and related disclosures in conformity with U.S. GAAP requires that management of the Company make a number of estimates and assumptions relating to the reporting of assets and liabilities and the disclosure of contingent assets and liabilities at the date of the financial statements and the reported amounts of revenues and expenses during the reporting period. Among the more significant estimates included in our consolidated financial statements are revenue and cost recognition under long-term contracts; the valuation of accounts receivable, inventories, investments and deferred tax assets; the depreciable lives of fixed assets and useful lives of amortizable intangible assets; the valuation of assets acquired and liabilities assumed in business combinations; the recoverability of long-lived amortizable intangible assets, tradenames and goodwill; share-based compensation; restructuring charges; asset retirement obligations; fair value measurement of financial assets and liabilities and certain accrued expenses and contingencies.
We are subject to uncertainties such as the impact of future events, economic, environmental and political factors and changes in the business climate; therefore, actual results may differ from those estimates. When no estimate in a given range is deemed to be better than any other when estimating contingent liabilities, the low end of the range is accrued. Accordingly, the accounting estimates used in the preparation of our consolidated financial statements will change as new events occur, as more experience is acquired, as additional information is obtained and as our operating environment changes. Changes in estimates are made when circumstances warrant them. Such changes and refinements in estimation methodologies are reflected in reported results of operations; if material, the effects of changes in estimates are disclosed in the notes to the consolidated financial statements.
Revenue Recognition
We recognize revenue, net of trade discounts and allowances, when (1) persuasive evidence of an arrangement exists, (2) delivery of the product has occurred or the services have been performed, (3) the selling price is fixed or determinable, and (4) collectability of the resulting receivable is reasonably assured.
| - 66 - |
Our product revenue is generated predominantly from the sales of various types of microelectronic products and test and measurement equipment. For arrangements other than certain long-term contracts, revenue (including shipping and handling fees) is recognized when products are shipped and title has passed to the customer. If title does not pass until the product reaches the customer’s delivery site, recognition of the revenue is deferred until that time. Certain of our sales are to distributors, which have a right to return some portion of product within specified periods from delivery. We generally recognize revenue on these sales at the time of shipment to the distributor, as the returns under these arrangements have historically been insignificant and can be reasonably estimated. A provision for such estimated returns is recorded at the time revenues are recognized. For transactions that include customer-specified acceptance criteria, including those where acceptance is required upon achievement of performance milestones, revenue is recognized after the acceptance criteria have been met.
Long-term contracts are accounted for by determining estimated contract profit rates and use of the percentage-of-completion method to recognize revenues and associated costs as work progresses. We measure the extent of progress toward completion generally based upon one of the following methods (based upon an assessment of which method most closely aligns to the underlying earnings process): (i) the units-of-delivery method, (ii) the cost-to-cost method (using the ratio of contract costs incurred as a percentage of total estimated costs at contract completion based upon engineering and production estimates), or (iii) the achievement of contractual milestones. Provisions for anticipated losses or revisions in estimated profits on contracts-in-process are recorded in the period in which such anticipated losses or revisions become evident.
Where an arrangement includes only a software license, revenue is recognized when the software is delivered and title has been transferred to the customer or, in the case of electronic delivery of software, when the customer is given access to the licensed software programs. We also evaluate whether persuasive evidence of an arrangement exists, collection of the receivable is probable, the fee is fixed or determinable and whether any other undelivered elements of the arrangement exist for which a portion of the total fee would be allocated based on vendor-specific objective evidence of the fair value of the undelivered element. When a customer purchases software together with post contract support, we allocate a portion of the fee to the post contract support for its fair value based on the contractual renewal rate. Post contract support fees are deferred in Advance Payments by Customers and Deferred Revenue in the consolidated balance sheets, and recognized as revenue ratably over the term of the related contract.
Service revenue is derived from extended warranty, customer support and training. Service revenue is deferred and recognized over the contractual term or as services are rendered and accepted by the customer. For example, revenue from customer support contracts is recognized ratably over the contractual term, while training revenue is recognized as the training is provided to the customer. In addition, the four revenue recognition criteria described above must be met before service revenue is recognized.
We use vendor-specific objective evidence of selling price, verifiable objective evidence of selling price, such as third party selling prices, or estimated selling price, in that order, to allocate non-software revenue to elements in multiple element arrangements. Revenue is recognized on only those elements that meet the four criteria described above.
Advance payments by customers and deferred revenue was comprised of (i) advance payments by customers primarily for the purchase of materials, (ii) deferred service and software support revenue, (iii) deferred warranty revenue and (iv) deferred revenue related to multiple deliverable arrangements. We generally sell non-software service and extended warranty contracts on a standalone basis.
Acquisition Accounting
We use the acquisition method to account for business combinations, whereby the total purchase price of an acquisition, including contingent consideration, is allocated to the tangible and intangible assets acquired and liabilities assumed, based upon their respective fair values at the date of acquisition. The purchase price in excess of the fair value of the net assets and liabilities, if any, is recorded as goodwill. A gain is recorded if the purchase price is less than the fair value of net assets and liabilities. The allocation of the purchase price is dependent upon certain valuations and other studies, which contain estimates and assumptions. Effective with acquisitions consummated after June 30, 2009, costs related to our acquisitions are expensed as incurred.
| - 67 - |
Goodwill and Other Intangible Assets with Indefinite Lives
Goodwill is calculated as the excess of the cost of purchased businesses over the fair value of their underlying net assets. Other intangible assets with indefinite lives consist of tradenames. Goodwill and other intangible assets with indefinite lives are not amortized.
We assess goodwill and other intangible assets with indefinite lives at least annually for impairment in the fourth quarter of our fiscal year, or more frequently if certain events or circumstances indicate an impairment may have occurred. We test goodwill for impairment at the reporting unit level, which is one level below our operating segments. We identify our reporting units by assessing whether the components of our operating segments constitute businesses for which discrete financial information is available that segment management regularly reviews to assess operating results. Impairment testing is performed in two steps: (i) we determine if there is an impairment by comparing the fair value of a reporting unit with its carrying value, and (ii) if there is an impairment, we measure the amount of impairment loss by comparing the implied fair value of the reporting unit’s goodwill (the excess of the fair value of the reporting unit over the fair value of its net identifiable assets) with the carrying amount of that goodwill.
As of June 30, 2012, Plainview – ATS had goodwill of $21.3 million and an enterprise carrying value of $33.5 million. We determined if there was an impairment by comparing the fair value of the reporting unit with its enterprise carrying value. Based on our current analysis of the discounted estimated cash flows of this unit, we have estimated that the fair value of this unit was approximately $35.4 million at June 30, 2012 and that the goodwill has not been impaired. However, should actual results differ from our forecasts of cash flows and our estimated enterprise fair value decreases below the carrying value, then an impairment may occur and we would need to calculate the amount of the write-down of goodwill by comparing the implied fair value of the reporting unit’s goodwill (the excess of the fair value of the reporting unit over the fair value of its net identifiable assets) with the carrying amount of that goodwill.
Testing goodwill for impairment requires us to estimate fair values of reporting units using significant estimates and assumptions. The assumptions made will impact the outcome and ultimate results of the testing. We use industry accepted valuation models and set criteria that are reviewed and approved by various levels of management and, in certain instances, we engage third-party valuation specialists to assist us in estimating fair values. To determine fair value of the reporting unit, we use an income approach. We use a market approach to assess the reasonableness of the results of the income approach.
Under the income approach, we determine fair value using a discounted cash flow method, estimating future cash flows of each reporting unit, as well as terminal value, and discounting such cash flows at a rate of return that reflects the relative risk of the cash flows.
The key estimates and factors used in the income approach include, but are not limited to, revenue growth rates and profit margins based on historical results and internal forecasts, terminal value and the weighted-average cost of capital used to discount future cash flows. The compound annual growth rate of sales for the first 8 years of our projections ranged between 5% and 9% as of June 30, 2012. The compound annual growth rate of sales for the first 7 to 9 years of our projections ranged between 7% and 9% as of June 30, 2011. The terminal growth rates were projected at 4% after 8 years as of June 30, 2012 as compared to 5% after 7 to 9 years as of June 30, 2011, which reflects our estimate of long-term market and gross domestic product growth. The weighted-average cost of capital used to discount future cash flows ranged from 12% to 16% as of June 30, 2012 and 2011. Future changes in these estimates and assumptions could materially affect the results of our reviews for impairment of goodwill. Changes in the valuation assumptions from those used in the prior year primarily reflect the impact of the current economic environment, including our stock performance on the reporting units and their projected future results of operations.
| - 68 - |
The impairment test for other intangible assets with indefinite lives encompasses determining a fair value and comparing the fair value to its carrying value. If the carrying value exceeds the fair value, impairment is recorded. To determine the fair value of other intangible assets with indefinite lives, we use an income approach, the relief-from-royalty method. This method assumes that, in lieu of ownership, a third party would be willing to pay a royalty in order to obtain the rights to use the comparable asset. The fair value other intangible assets with indefinite lives require significant judgments in determining both the assets’ estimated cash flows as well as the appropriate discount and royalty rates applied to those cash flows to determine fair value. Changes in such estimates or the application of alternative assumptions could produce significantly different results.
Long-Lived Assets
We review other long-lived assets for impairment whenever events or changes in circumstances indicate that the carrying amount may not be recoverable. When such events or changes in circumstances occur, a recoverability test is performed comparing projected undiscounted cash flows from the use and eventual disposition of an asset or asset group to its carrying value. If the projected undiscounted cash flows are less than the carrying value, an impairment would be recorded for the excess of the carrying value over the fair value, which is determined by discounting future cash flows.
Property, Plant and Equipment
Property, plant and equipment are stated at cost. Depreciation of plant and equipment is provided over the estimated useful lives of the respective assets, on a straight-line basis. Leasehold improvements are amortized over the life of the lease, including anticipated renewals, or the estimated life of the asset, whichever is shorter.
Income Taxes
We recognize deferred tax assets and liabilities for the future tax consequences attributable to differences between the financial statement carrying amounts of existing assets and liabilities and their respective tax bases. Deferred tax assets and liabilities are measured using enacted tax rates expected to apply to taxable income in the years in which those temporary differences are expected to be realized or settled. The effect on deferred tax assets and liabilities of a change in tax rates is recognized in income in the period that includes the enactment date.
Net deferred tax assets assume sufficient future earnings for their realization. Where management believes it is more-likely-than-not that the deferred tax assets will not be realized in the relevant jurisdiction, the Company has recorded a valuation allowance against such asset.
The Company has adopted the provisions of ASC 740-10 (formerly FIN 48) and records uncertain tax position liabilities for federal, state, local and foreign exposures relating to periods subject to audit. The calculation of these tax liabilities require judgments about tax issues, potential outcomes and timing, and are a subjective critical estimate. The Company classifies interest and penalties as a component of the provision for income taxes.
Share-Based Compensation
The fair value of share-based payments is recognized as an expense in the consolidated statements of operations over the related vesting periods. Share-based compensation expense is based on the fair value of the portion of share-based payment awards that is ultimately expected to vest and has therefore been reduced for estimated forfeitures at the time of the grant, with subsequent revisions for the differences between actual and the estimated forfeiture rates (see Note 14 to the consolidated financial statements).
| - 69 - |
Recently Issued Accounting Pronouncements Not Yet Adopted
In July 2012, the Financial Accounting Standards Board (“FASB”) amended its authoritative guidance related to testing indefinite-lived intangible assets for impairment. Under the revised guidance, entities testing their indefinite-lived intangible assets for impairment have the option of performing a qualitative assessment before performing further impairment testing. If entities determine, on the basis of qualitative factors, that it is more-likely-than-not that the asset is impaired, a quantitative test is required. This new guidance will become effective for us beginning with the first quarter of fiscal 2014, with early adoption permitted. The adoption of this new guidance is not expected to have an impact on our consolidated financial statements.
In September 2011, the FASB issued authoritative guidance on testing goodwill for impairment. The new guidance provides an entity the option to first perform a qualitative assessment to determine whether it is more likely than not that the fair value of a reporting unit is less than its carrying amount. If an entity determines that this is the case, it is required to perform the currently prescribed two-step goodwill impairment test to identify potential goodwill impairment and measure the amount of goodwill impairment loss to be recognized for that reporting unit (if any). If an entity determines that the fair value of a reporting unit exceeds its carrying amount, the two-step goodwill impairment test is not required. This new guidance will become effective for us beginning with the first quarter of fiscal 2013. The adoption of this new guidance is not expected to have an impact on our consolidated financial statements.
In June 2011, the FASB issued authoritative guidance on the presentation of comprehensive income. The new guidance eliminates the current option to report other comprehensive income and its components in the statement of stockholders’ equity. Instead, an entity will be required to present either a continuous statement of net income and other comprehensive income or in two separate but consecutive statements. The new guidance also requires entities to present reclassification adjustments out of accumulated other comprehensive income by component in both the statement in which net income is presented and the statement in which other comprehensive income is presented. This new guidance will become effective for us beginning with the first quarter of fiscal 2013 and is to be applied retrospectively. We have not yet determined which presentation method we will adopt. In December 2011, the FASB issued guidance which indefinitely defers the guidance related to the presentation of reclassification adjustments.
| - 70 - |
ITEM 7A. QUANTITATIVE AND QUALITATIVE DISCLOSURES ABOUT MARKET RISK
Interest Rate Risk. We are subject to interest rate risk in connection with borrowings under our senior secured credit facility. We currently do not have interest rate swap agreements hedging this debt. As of June 30, 2012, there was $641.4 million outstanding at adjusted LIBOR plus 4.5% under the term-loan portion of the senior secured credit facility, all of which is subject to variable interest rates. The adjusted LIBOR, as defined in the senior secured credit facility, has a floor of 1.25% on the term loan. Based on LIBOR at June 30, 2012, an increase of 1% in interest rates would result in a 0.21% increase, due to the 1.25% floor, or a $1.4 million increase in our annual interest expense. Any 1% increase in interest rates above the 1.25% floor would result in a $6.5 million increase in our annual interest expense. A 1% change in interest rates would result in a $760,000 change in our annual interest expense on the revolving loan borrowings, assuming the entire $75.0 million was outstanding. Any debt we incur in the future may also bear interest at floating rates.
Foreign Currency Risk. Foreign currency contracts are used to protect us from exchange rate fluctuation from the time customers are invoiced in local currency until such currency is exchanged for U.S. dollars. We periodically enter into foreign currency contracts, which are not designated as hedges, and the change in the fair value is included in income currently within other income (expense). As of June 30, 2012, we had $25.2 million of notional value foreign currency forward contracts maturing through July 31, 2012. Notional amounts do not quantify risk or represent assets or liabilities, but are used in the calculation of cash settlements under the contracts. The fair value of these contracts at June 30, 2012 was an asset of $23,000. If foreign currency exchange rates (primarily the British pound and the Euro) change by 10% from the levels at June 30, 2012, the effect on our comprehensive income would be approximately $15.1 million.
Inflation Risk. Inflation has not had a material impact on our results of operations or financial condition during the preceding three years.
| - 71 - |
ITEM 8. FINANCIAL STATEMENTS AND SUPPLEMENTARY DATA
AEROFLEX HOLDING CORP.
AND SUBSIDIARIES
FINANCIAL STATEMENTS
| INDEX | PAGE | |
| CONSOLIDATED FINANCIAL STATEMENTS: | ||
| Reports of Independent Registered Public Accounting Firm | 73 | |
| Consolidated financial statements: | ||
| Balance sheets – June 30, 2012 and 2011 | 75 | |
| Statements of operations – Fiscal years ended June 30, 2012, 2011 and 2010 | 76 | |
| Statements of stockholders’ equity – Fiscal years ended June 30, 2012, 2011 and 2010 | 77 | |
| Statements of comprehensive income (loss) – Fiscal years ended June 30, 2012, 2011 and 2010 | 78 | |
| Statements of cash flows – Fiscal years ended June 30, 2012, 2011 and 2010 | 79 | |
| Notes to the consolidated financial statements | 80 – 111 |
| - 72 - |
Report of Independent Registered Public Accounting Firm
The Board of Directors and Stockholders
Aeroflex Holding Corp. and Subsidiaries:
We have audited the accompanying consolidated balance sheets of Aeroflex Holding Corp. and subsidiaries as of June 30, 2012 and 2011, and the related consolidated statements of operations, stockholders’ equity, comprehensive income (loss), and cash flows for each of the years in the three-year period ended June 30, 2012. In connection with our audits of the consolidated financial statements, we also have audited the financial statement schedule listed in the index to Item 15. We also have audited Aeroflex Holding Corp.’s internal control over financial reporting as of June 30, 2012, based on criteria established in Internal Control – Integrated Framework issued by the Committee of Sponsoring Organizations of the Treadway Commission (COSO). Aeroflex Holding Corp.’s management is responsible for these consolidated financial statements and the financial statement schedule, for maintaining effective internal control over financial reporting, and for its assessment of the effectiveness of internal control over financial reporting, included in the accompanying Management’s Report on Internal Control Over Financial Reporting under Item 9A. Our responsibility is to express an opinion on these consolidated financial statements and the financial statement schedule, and an opinion on the Company’s internal control over financial reporting based on our audits.
We conducted our audits in accordance with the standards of the Public Company Accounting Oversight Board (United States). Those standards require that we plan and perform the audits to obtain reasonable assurance about whether the financial statements are free of material misstatement and whether effective internal control over financial reporting was maintained in all material respects. Our audits of the consolidated financial statements included examining, on a test basis, evidence supporting the amounts and disclosures in the financial statements, assessing the accounting principles used and significant estimates made by management, and evaluating the overall financial statement presentation. Our audit of internal control over financial reporting included obtaining an understanding of internal control over financial reporting, assessing the risk that a material weakness exists, and testing and evaluating the design and operating effectiveness of internal control based on the assessed risk. Our audits also included performing such other procedures as we considered necessary in the circumstances. We believe that our audits provide a reasonable basis for our opinions.
A company’s internal control over financial reporting is a process designed to provide reasonable assurance regarding the reliability of financial reporting and the preparation of financial statements for external purposes in accordance with generally accepted accounting principles. A company’s internal control over financial reporting includes those policies and procedures that (1) pertain to the maintenance of records that, in reasonable detail, accurately and fairly reflect the transactions and dispositions of the assets of the company; (2) provide reasonable assurance that transactions are recorded as necessary to permit preparation of financial statements in accordance with generally accepted accounting principles, and that receipts and expenditures of the company are being made only in accordance with authorizations of management and directors of the company; and (3) provide reasonable assurance regarding prevention or timely detection of unauthorized acquisition, use, or disposition of the company’s assets that could have a material effect on the financial statements.
Because of its inherent limitations, internal control over financial reporting may not prevent or detect misstatements. Also, projections of any evaluation of effectiveness to future periods are subject to the risk that controls may become inadequate because of changes in conditions, or that the degree of compliance with the policies or procedures may deteriorate.
| - 73 - |
In our opinion, the consolidated financial statements referred to above present fairly, in all material respects, the financial position of Aeroflex Holding Corp. and subsidiaries as of June 30, 2012 and 2011, and the results of its operations and its cash flows for each of the fiscal years in the three-year period ended June 30, 2012, in conformity with U.S. generally accepted accounting principles. Also, in our opinion, the related financial statement schedule, when considered in relation to the basic consolidated financial statements taken as a whole, presents fairly, in all material respects, the information set forth therein.
Also, in our opinion, Aeroflex Holding Corp. maintained, in all material respects, effective internal control over financial reporting as of June 30, 2012, based on criteria established in Internal Control – Integrated Framework issued by COSO.
| /s/ KPMG LLP | |
| Melville, New York | |
| August 29, 2012 |
| - 74 - |
Aeroflex Holding Corp. and Subsidiaries
Consolidated Balance Sheets
(In thousands, except share and per share data)
| June 30, | June 30, | |||||||
| 2012 | 2011 | |||||||
| Assets | ||||||||
| Current assets: | ||||||||
| Cash and cash equivalents | $ | 41,324 | $ | 66,278 | ||||
| Accounts receivable, less allowance for doubtful accounts of $981 and $1,210 | 146,597 | 168,141 | ||||||
| Inventories | 158,090 | 186,370 | ||||||
| Deferred income taxes | 33,315 | 51,855 | ||||||
| Income taxes receivable | 4,935 | - | ||||||
| Prepaid expenses and other current assets | 11,942 | 10,044 | ||||||
| Total current assets | 396,203 | 482,688 | ||||||
| Property, plant and equipment, net of accumulated depreciation of $102,310 and $82,581 | 101,632 | 105,162 | ||||||
| Deferred financing costs, net | 15,720 | 15,289 | ||||||
| Other assets | 34,955 | 29,000 | ||||||
| Intangible assets with definite lives, net | 119,476 | 183,614 | ||||||
| Intangible assets with indefinite lives | 113,461 | 114,730 | ||||||
| Goodwill | 408,361 | 465,443 | ||||||
| Total assets | $ | 1,189,808 | $ | 1,395,926 | ||||
| Liabilities and Stockholders' Equity | ||||||||
| Current liabilities: | ||||||||
| Current portion of long-term debt | $ | - | $ | 7,635 | ||||
| Accounts payable | 26,822 | 48,737 | ||||||
| Advance payments by customers and deferred revenue | 23,433 | 25,859 | ||||||
| Income taxes payable | 593 | 8,371 | ||||||
| Accrued payroll expenses | 18,635 | 22,063 | ||||||
| Accrued expenses and other current liabilities | 37,559 | 45,772 | ||||||
| Total current liabilities | 107,042 | 158,437 | ||||||
| Long-term debt | 641,375 | 717,750 | ||||||
| Deferred income taxes | 94,022 | 117,150 | ||||||
| Other long-term liabilities | 20,592 | 19,065 | ||||||
| Total liabilities | 863,031 | 1,012,402 | ||||||
| Stockholders' equity: | ||||||||
| Preferred stock, par value $.01 per share; 50,000,000 shares authorized, no shares issued and outstanding | - | - | ||||||
| Common stock, par value $.01 per share; 300,000,000 shares authorized; 84,845,687 and 84,789,180 shares issued and outstanding | 848 | 848 | ||||||
| Additional paid-in capital | 648,092 | 644,262 | ||||||
| Accumulated other comprehensive income (loss) | (39,476 | ) | (32,536 | ) | ||||
| Accumulated deficit | (282,687 | ) | (229,050 | ) | ||||
| Total stockholders' equity | 326,777 | 383,524 | ||||||
| Total liabilities and stockholders' equity | $ | 1,189,808 | $ | 1,395,926 | ||||
See notes to consolidated financial statements.
| - 75 - |
Aeroflex Holding Corp. and Subsidiaries
Consolidated Statements of Operations
(In thousands, except per share data)
| Year Ended June 30, | ||||||||||||
| 2012 | 2011 | 2010 | ||||||||||
| Net sales | $ | 673,015 | $ | 729,414 | $ | 655,048 | ||||||
| Cost of sales | 334,129 | 337,314 | 312,063 | |||||||||
| Gross profit | 338,886 | 392,100 | 342,985 | |||||||||
| Operating expenses: | ||||||||||||
| Selling, general and administrative costs | 151,818 | 150,875 | 128,860 | |||||||||
| Research and development costs | 89,762 | 90,088 | 76,155 | |||||||||
| Amortization of acquired intangibles | 62,696 | 63,672 | 61,915 | |||||||||
| Termination of Sponsor Advisory Agreement | - | 18,133 | - | |||||||||
| Restructuring charges | 6,779 | 14,783 | 385 | |||||||||
| Impairment of goodwill and other long-lived assets | 56,700 | - | - | |||||||||
| Change in fair value of acquisition contingent consideration liability | (7,553 | ) | 1,834 | - | ||||||||
| Loss on liquidation of foreign subsidiary | - | - | 7,696 | |||||||||
| Total operating expenses | 360,202 | 339,385 | 275,011 | |||||||||
| Operating income (loss) | (21,316 | ) | 52,715 | 67,974 | ||||||||
| Other income (expense): | ||||||||||||
| Interest expense | (34,237 | ) | (66,204 | ) | (83,948 | ) | ||||||
| Loss on extinguishment of debt and write-off of deferred financing costs | (1,232 | ) | (59,395 | ) | - | |||||||
| Gain from a bargain purchase of a business | - | 173 | 3,993 | |||||||||
| Other income (expense), net | (1,745 | ) | (775 | ) | 532 | |||||||
| Total other income (expense), net | (37,214 | ) | (126,201 | ) | (79,423 | ) | ||||||
| Income (loss) before income taxes | (58,530 | ) | (73,486 | ) | (11,449 | ) | ||||||
| Provision (benefit) for income taxes | (4,893 | ) | (38,818 | ) | 820 | |||||||
| Net income (loss) | $ | (53,637 | ) | $ | (34,668 | ) | $ | (12,269 | ) | |||
| Net income (loss) per common share: | ||||||||||||
| Basic | $ | (0.63 | ) | $ | (0.45 | ) | $ | (0.19 | ) | |||
| Diluted | $ | (0.63 | ) | $ | (0.45 | ) | $ | (0.19 | ) | |||
| Weighted average number of common shares outstanding: | ||||||||||||
| Basic | 84,811 | 77,153 | 65,000 | |||||||||
| Diluted | 84,811 | 77,153 | 65,000 | |||||||||
See notes to consolidated financial statements.
| - 76 - |
Aeroflex Holding Corp. and Subsidiaries
Consolidated Statements of Stockholders’ Equity
(In thousands)
| Year Ended June 30, | ||||||||||||
| 2012 | 2011 | 2010 | ||||||||||
| Common stock, beginning of year | $ | 848 | $ | 650 | $ | 650 | ||||||
| Proceeds from issuance of common stock | - | 198 | - | |||||||||
| Common stock, end of year | 848 | 848 | 650 | |||||||||
| Additional paid-in capital, beginning of year | 644,262 | 398,291 | 395,923 | |||||||||
| Proceeds from issuance of common stock | - | 243,797 | - | |||||||||
| Share-based compensation | 3,471 | 2,254 | 2,076 | |||||||||
| Other changes | 359 | (80 | ) | 292 | ||||||||
| Additional paid-in capital, end of year | 648,092 | 644,262 | 398,291 | |||||||||
| Accumulated other comprehensive income (loss), beginning of year | (32,536 | ) | (53,575 | ) | (54,700 | ) | ||||||
| Other comprehensive income (loss) | (6,940 | ) | 21,039 | 1,125 | ||||||||
| Accumulated other comprehensive income (loss), end of year | (39,476 | ) | (32,536 | ) | (53,575 | ) | ||||||
| Accumulated deficit, beginning of year | (229,050 | ) | (194,382 | ) | (182,113 | ) | ||||||
| Net income (loss) | (53,637 | ) | (34,668 | ) | (12,269 | ) | ||||||
| Accumulated deficit, end of year | (282,687 | ) | (229,050 | ) | (194,382 | ) | ||||||
| Total stockholders' equity | $ | 326,777 | $ | 383,524 | $ | 150,984 | ||||||
See notes to consolidated financial statements.
| - 77 - |
Aeroflex Holding Corp. and Subsidiaries
Consolidated Statements of Comprehensive Income (Loss)
(In thousands)
| Year Ended June 30, | ||||||||||||
| 2012 | 2011 | 2010 | ||||||||||
| Net income (loss) | $ | (53,637 | ) | $ | (34,668 | ) | $ | (12,269 | ) | |||
| Other comprehensive income (loss): | ||||||||||||
| Increase (decrease) in fair value of interest rate swap contracts, net of tax | - | 4,046 | 5,556 | |||||||||
| Valuation allowance against non-current marketable securities | - | 1,276 | 992 | |||||||||
| Minimum pension liability adjustment, net of tax | (904 | ) | 229 | (274 | ) | |||||||
| Foreign currency translation adjustment, net of tax | (6,036 | ) | 15,488 | (5,149 | ) | |||||||
| (6,940 | ) | 21,039 | 1,125 | |||||||||
| Total comprehensive income (loss) | $ | (60,577 | ) | $ | (13,629 | ) | $ | (11,144 | ) | |||
See notes to consolidated financial statements.
| - 78 - |
Aeroflex Holding Corp. and Subsidiaries
Consolidated Statements of Cash Flows
(In thousands)
| Year Ended June 30, | ||||||||||||
| 2012 | 2011 | 2010 | ||||||||||
| Cash flows from operating activities: | ||||||||||||
| Net income (loss) | $ | (53,637 | ) | $ | (34,668 | ) | $ | (12,269 | ) | |||
| Adjustments to reconcile net income (loss) to net cash provided by (used in) operating activities: | ||||||||||||
| Depreciation and amortization | 84,298 | 83,459 | 82,696 | |||||||||
| Gain from a bargain purchase of a business | - | (173 | ) | (3,993 | ) | |||||||
| Change in fair value of acquisition contingent consideration liability | (7,553 | ) | 1,834 | - | ||||||||
| Acquisition related adjustment to cost of sales | - | 998 | 575 | |||||||||
| Acquisition related adjustment to sales | - | 157 | 125 | |||||||||
| Impairment of goodwill and other long-lived assets | 56,700 | - | - | |||||||||
| Loss on liquidation of foreign subsidiary | - | - | 7,696 | |||||||||
| Loss on extinguishment of debt and write-off of deferred financing costs | 1,232 | 59,395 | - | |||||||||
| Deferred income taxes | (3,724 | ) | (53,626 | ) | (4,607 | ) | ||||||
| Share-based compensation | 3,527 | 2,254 | 2,076 | |||||||||
| Non - cash restructuring charges | 1,015 | 4,860 | - | |||||||||
| Amortization of deferred financing costs | 2,023 | 4,755 | 4,771 | |||||||||
| Paid in kind interest | - | 2,434 | 18,089 | |||||||||
| Other, net | 613 | 1,103 | 670 | |||||||||
| Change in operating assets and liabilities, net of effects from purchases of businesses: | ||||||||||||
| Decrease (increase) in accounts receivable | 19,884 | (20,577 | ) | (11,898 | ) | |||||||
| Decrease (increase) in inventories | 25,494 | (54,993 | ) | 8,432 | ||||||||
| Decrease (increase) in prepaid expenses and other assets | (6,359 | ) | (5,519 | ) | (4,927 | ) | ||||||
| Increase (decrease) in accounts payable, accrued expenses and other liabilities | (33,066 | ) | 2,849 | (5,385 | ) | |||||||
| Net cash provided by (used in) operating activities | 90,447 | (5,458 | ) | 82,051 | ||||||||
| Cash flows from investing activities: | ||||||||||||
| Payments for purchase of businesses, net of cash acquired | (5,106 | ) | (23,717 | ) | (19,813 | ) | ||||||
| Capital expenditures | (21,773 | ) | (25,957 | ) | (21,015 | ) | ||||||
| Proceeds from sale of marketable securities | - | 10,357 | 8,580 | |||||||||
| Proceeds from the sale of property, plant and equipment | 420 | 995 | 1,485 | |||||||||
| Other, net | - | - | (385 | ) | ||||||||
| Net cash provided by (used in) investing activities | (26,459 | ) | (38,322 | ) | (31,148 | ) | ||||||
| Cash flows from financing activities: | ||||||||||||
| Credit facility borrowings | - | 725,000 | - | |||||||||
| Net proceeds from issuance of common stock | - | 243,995 | - | |||||||||
| Repurchase of senior unsecured notes and senior subordinated unsecured term loans, including premiums and fees | - | (432,526 | ) | - | ||||||||
| Payment of contingent consideration related to business acquisition | (948 | ) | - | - | ||||||||
| Debt repayments | (84,010 | ) | (510,923 | ) | (5,590 | ) | ||||||
| Deferred financing costs | (3,685 | ) | (18,903 | ) | - | |||||||
| Other, net | (37 | ) | - | |||||||||
| Net cash provided by (used in) financing activities | (88,680 | ) | 6,643 | (5,590 | ) | |||||||
| Effect of exchange rate changes on cash and cash equivalents | (262 | ) | 2,752 | (2,398 | ) | |||||||
| Net increase (decrease) in cash and cash equivalents | (24,954 | ) | (34,385 | ) | 42,915 | |||||||
| Cash and cash equivalents at beginning of year | 66,278 | 100,663 | 57,748 | |||||||||
| Cash and cash equivalents at end of year | $ | 41,324 | $ | 66,278 | $ | 100,663 | ||||||
See notes to consolidated financial statements.
| - 79 - |
AEROFLEX HOLDING CORP. AND SUBSIDIARIES
NOTES TO CONSOLIDATED FINANCIAL STATEMENTS
1. Description of Business
We design, engineer and manufacture microelectronic products and test and measurement equipment that are sold primarily to the space, avionics, defense, commercial wireless communications, and medical markets.
Unless the context requires otherwise, (i) “Aeroflex Holding” refers to the issuer, Aeroflex Holding Corp., a holding company that was formerly known as AX Holding Corp., (ii) “Aeroflex” refers to Aeroflex Incorporated, a direct wholly owned subsidiary of Aeroflex Holding, together with its consolidated subsidiaries, (iii) “we”, “our”, “us” or the “Company” refer to Aeroflex Holding Corp. and its consolidated subsidiaries, including Aeroflex, (iv) the term “parent LLC” refers to VGG Holding LLC, which as of June 30, 2012 owned 76.6% of Aeroflex Holding’s common stock, (v) the term “Veritas Capital” refers to The Veritas Capital Fund III, L.P. and its affiliates, (vi) the term “Golden Gate Capital” refers to Golden Gate Private Equity, Inc. and its affiliates, (vii) the term “GS Direct” refers to GS Direct, L.L.C., (viii) the term “Sponsors” refers collectively to Veritas Capital, Golden Gate Capital and GS Direct, and to affiliates of and funds managed by these entities, (ix) the term “Going Private Transaction” refers to the acquisition of Aeroflex by the Sponsors on August 15, 2007, (x) the term “IPO” refers to the initial public offering of 19,789,180 shares of our common stock at a price of $13.50 per share, which was consummated in November 2010, (xi) the term “Sponsor Advisory Agreement” refers to our advisory agreement with affiliates of the Sponsors, under which we paid $2.8 million and $2.5 million during the years ended June 30, 2011 and 2010, respectively, prior to it being terminated in connection with the IPO, (xii) the term “senior secured credit facility” refers to the credit facility that we entered into on May 9, 2011 in connection with our debt refinancing as of such date, and which we amended on May 24, 2012, and (xiii) any “fiscal” year refers to the twelve months ended June 30 of the applicable year (for example, “fiscal 2012” refers to the twelve months ended June 30, 2012).
2. Summary of Significant Accounting Principles and Policies
Presentation and Use of Estimates
Our financial statements are prepared in conformity with U.S. GAAP. We consolidate our subsidiaries, all of which, except for Test Evolution Corporation, are wholly owned. All significant intercompany balances and transactions have been eliminated.
The preparation of financial statements and related disclosures in conformity with U.S. GAAP requires that management of the Company make a number of estimates and assumptions relating to the reporting of assets and liabilities and the disclosure of contingent assets and liabilities at the date of the financial statements and the reported amounts of revenues and expenses during the reporting period. Among the more significant estimates included in our consolidated financial statements are revenue and cost recognition under long-term contracts; the valuation of accounts receivable, inventories, investments and deferred tax assets; the depreciable lives of fixed assets and useful lives of amortizable intangible assets; the valuation of assets acquired and liabilities assumed in business combinations; the recoverability of long-lived amortizable intangible assets, tradenames and goodwill; share-based compensation; restructuring charges; asset retirement obligations; fair value measurement of financial assets and liabilities and certain accrued expenses and contingencies.
| - 80 - |
We are subject to uncertainties such as the impact of future events, economic, environmental and political factors and changes in the business climate; therefore, actual results may differ from those estimates. When no estimate in a given range is deemed to be better than any other when estimating contingent liabilities, the low end of the range is accrued. Accordingly, the accounting estimates used in the preparation of our consolidated financial statements will change as new events occur, as more experience is acquired, as additional information is obtained and as our operating environment changes. Changes in estimates are made when circumstances warrant them. Such changes and refinements in estimation methodologies are reflected in reported results of operations; if material, the effects of changes in estimates are disclosed in the notes to the consolidated financial statements.
Cash and Cash Equivalents
All highly liquid investments having maturities of three months or less at the date of acquisition are considered to be cash equivalents.
Marketable Securities
Marketable securities were classified as available-for-sale and were recorded at fair value with unrealized gains and losses reported as a separate component of stockholders’ equity. Realized gains and losses and declines in market value judged to be other than temporary, which amounted to losses of $688,000 and $320,000 in the fiscal years ended June 30, 2011 and 2010, respectively, were reflected in other income (expense). Interest income and dividends, if any, were also included in other income.
During the year ended June 30, 2011, our remaining auction rate securities were sold for $10.4 million at an average of 93.8% of par.
Inventories
Inventories, including amounts related to long-term contracts accounted for under percentage-of-completion accounting, are stated at the lower of cost (first-in, first-out) or market. We assess the valuation of our inventory on a periodic basis and make adjustments to the value for estimated excess and obsolete inventory based on estimates about future demand. Our excess inventory review process includes analysis of historical usage and sales forecasts.
Derivative Financial Instruments
Foreign currency contracts are used to protect us from fluctuations in exchange rates. Our foreign currency contracts are not designated as hedges and therefore the change in fair value is included in other income (expense) as it occurs.
Our interest rate swap derivatives were designated as cash flow hedges. As such, they were recorded on the balance sheet as assets or liabilities at their fair value, with changes in the fair value of such derivatives, net of taxes, recorded as a component of other comprehensive income. All of our interest rate swap agreements expired prior to June 30, 2011.
Revenue Recognition
We recognize revenue, net of trade discounts and allowances, when (1) persuasive evidence of an arrangement exists, (2) delivery of the product has occurred or the services have been performed, (3) the selling price is fixed or determinable, and (4) collectability of the resulting receivable is reasonably assured.
| - 81 - |
Our product revenue is generated predominantly from the sales of various types of microelectronic products and test and measurement equipment. For arrangements other than certain long-term contracts, revenue (including shipping and handling fees) is recognized when products are shipped and title has passed to the customer. If title does not pass until the product reaches the customer’s delivery site, recognition of the revenue is deferred until that time. Certain of our sales are to distributors, which have a right to return some portion of product within specified periods from delivery. We generally recognize revenue on these sales at the time of shipment to the distributor, as the returns under these arrangements have historically been insignificant and can be reasonably estimated. A provision for such estimated returns is recorded at the time revenues are recognized. For transactions that include customer-specified acceptance criteria, including those where acceptance is required upon achievement of performance milestones, revenue is recognized after the acceptance criteria have been met.
Long-term contracts are accounted for by determining estimated contract profit rates and use of the percentage-of-completion method to recognize revenues and associated costs as work progresses. We measure the extent of progress toward completion generally based upon one of the following methods (based upon an assessment of which method most closely aligns to the underlying earnings process): (i) the units-of-delivery method, (ii) the cost-to-cost method (using the ratio of contract costs incurred as a percentage of total estimated costs at contract completion based upon engineering and production estimates), or (iii) the achievement of contractual milestones. Provisions for anticipated losses or revisions in estimated profits on contracts-in-process are recorded in the period in which such anticipated losses or revisions become evident.
Where an arrangement includes only a software license, revenue is recognized when the software is delivered and title has been transferred to the customer or, in the case of electronic delivery of software, when the customer is given access to the licensed software programs. We also evaluate whether persuasive evidence of an arrangement exists, collection of the receivable is probable, the fee is fixed or determinable and whether any other undelivered elements of the arrangement exist for which a portion of the total fee would be allocated based on vendor-specific objective evidence of the fair value of the undelivered element. When a customer purchases software together with post contract support, we allocate a portion of the fee to the post contract support for its fair value based on the contractual renewal rate. Post contract support fees are deferred in Advance Payments by Customers and Deferred Revenue in the consolidated balance sheets, and recognized as revenue ratably over the term of the related contract.
Service revenue is derived from extended warranty, customer support and training. Service revenue is deferred and recognized over the contractual term or as services are rendered and accepted by the customer. For example, revenue from customer support contracts is recognized ratably over the contractual term, while training revenue is recognized as the training is provided to the customer. In addition, the four revenue recognition criteria described above must be met before service revenue is recognized.
We use vendor-specific objective evidence of selling price, verifiable objective evidence of selling price, such as third party selling prices, or estimated selling price, in that order, to allocate non-software revenue to elements in multiple element arrangements. Revenue is recognized on only those elements that meet the four criteria described above.
Advance payments by customers and deferred revenue was comprised of (i) advance payments by customers primarily for the purchase of materials, (ii) deferred service and software support revenue, (iii) deferred warranty revenue and (iv) deferred revenue related to multiple deliverable arrangements. We generally sell non-software service and extended warranty contracts on a standalone basis.
| - 82 - |
Advance payments by customers and deferred revenue were as follows:
| As of June 30, | ||||||||
| 2012 | 2011 | |||||||
| (In thousands) | ||||||||
| Advance payments by customers | $ | 8,609 | $ | 10,290 | ||||
| Deferred service and software support revenue | 7,166 | 8,758 | ||||||
| Deferred warranty revenue | 4,797 | 5,350 | ||||||
| Deferred revenue related to multiple deliverable arrangements | 2,861 | 1,461 | ||||||
| $ | 23,433 | $ | 25,859 | |||||
Acquisition Accounting
We use the acquisition method to account for business combinations, whereby the total purchase price of an acquisition, including contingent consideration, is allocated to the tangible and intangible assets acquired and liabilities assumed, based upon their respective fair values at the date of acquisition. The purchase price in excess of the fair value of the net assets and liabilities, if any, is recorded as goodwill. A gain is recorded if the purchase price is less than the fair value of net assets and liabilities. The allocation of the purchase price is dependent upon certain valuations and other studies, which contain estimates and assumptions. Effective with acquisitions consummated after June 30, 2009, costs related to our acquisitions are expensed as incurred.
Goodwill and Other Intangible Assets with Indefinite Lives
Goodwill is calculated as the excess of the cost of purchased businesses over the fair value of their underlying net assets. Other intangible assets with indefinite lives consist of tradenames. Goodwill and other intangible assets with indefinite lives are not amortized.
We assess goodwill and other intangible assets with indefinite lives at least annually for impairment in the fourth quarter of our fiscal year, or more frequently if certain events or circumstances indicate an impairment may have occurred. We test goodwill for impairment at the reporting unit level, which is one level below our operating segments. We identify our reporting units by assessing whether the components of our operating segments constitute businesses for which discrete financial information is available that segment management regularly reviews to assess operating results. Impairment testing is performed in two steps: (i) we determine if there is an impairment by comparing the fair value of a reporting unit with its carrying value, and (ii) if there is an impairment, we measure the amount of impairment loss by comparing the implied fair value of the reporting unit’s goodwill (the excess of the fair value of the reporting unit over the fair value of its net identifiable assets) with the carrying amount of that goodwill.
As of June 30, 2012, Plainview – ATS had goodwill of $21.3 million and an enterprise carrying value of $33.5 million. We determined if there was an impairment by comparing the fair value of the reporting unit with its enterprise carrying value. Based on our current analysis of the discounted estimated cash flows of this unit, we have estimated that the fair value of this unit was approximately $35.4 million at June 30, 2012 and that the goodwill has not been impaired. However, should actual results differ from our forecasts of cash flows and our estimated enterprise fair value decreases below the carrying value, then an impairment may occur and we would need to calculate the amount of the write-down of goodwill by comparing the implied fair value of the reporting unit’s goodwill (the excess of the fair value of the reporting unit over the fair value of its net identifiable assets) with the carrying amount of that goodwill.
| - 83 - |
Testing goodwill for impairment requires us to estimate fair values of reporting units using significant estimates and assumptions. The assumptions made will impact the outcome and ultimate results of the testing. We use industry accepted valuation models and set criteria that are reviewed and approved by various levels of management and, in certain instances, we engage third-party valuation specialists to assist us in estimating fair values. To determine fair value of the reporting unit, we use an income approach. We use a market approach to assess the reasonableness of the results of the income approach.
Under the income approach, we determine fair value using a discounted cash flow method, estimating future cash flows of each reporting unit, as well as terminal value, and discounting such cash flows at a rate of return that reflects the relative risk of the cash flows.
The impairment test for other intangible assets with indefinite lives encompasses determining a fair value and comparing the fair value to its carrying value. If the carrying value exceeds the fair value, impairment is recorded. To determine the fair value of other intangible assets with indefinite lives, we use an income approach, the relief-from-royalty method. This method assumes that, in lieu of ownership, a third party would be willing to pay a royalty in order to obtain the rights to use the comparable asset. The fair value of other intangible assets with indefinite lives require significant judgments in determining both the assets’ estimated cash flows as well as the appropriate discount and royalty rates applied to those cash flows to determine fair value. Changes in such estimates or the application of alternative assumptions could produce significantly different results.
Long-Lived Assets
We review other long-lived assets for impairment whenever events or changes in circumstances indicate that the carrying amount may not be recoverable. When such events or changes in circumstances occur, a recoverability test is performed comparing projected undiscounted cash flows from the use and eventual disposition of an asset or asset group to its carrying value. If the projected undiscounted cash flows are less than the carrying value, an impairment would be recorded for the excess of the carrying value over the fair value, which is determined by discounting future cash flows.
Property, Plant and Equipment
Property, plant and equipment are stated at cost. Depreciation of plant and equipment is provided over the estimated useful lives of the respective assets, on a straight-line basis. Leasehold improvements are amortized over the life of the lease, including anticipated renewals, or the estimated life of the asset, whichever is shorter.
Research and Development Costs
We charge all research and development costs to expense as incurred, except those of our software products for which costs incurred between the date of product technological feasibility and the date that the software is available for general release are capitalized. We use a working model of the software or a detailed program design to assess technological feasibility. We capitalized software development costs of $1.0 million in fiscal 2012. We did not capitalize any software development costs in fiscal 2011 or 2010. Capitalized software development costs are amortized to cost of sales based on the higher of a) the percentage of revenue for units delivered to total anticipated revenue for the related product, or b) on a straight-line basis. Capitalized software development costs of $1.0 million and $0 were included in other assets at June 30, 2012 and 2011, respectively.
| - 84 - |
Income Taxes
We recognize deferred tax assets and liabilities for the future tax consequences attributable to differences between the financial statement carrying amounts of existing assets and liabilities and their respective tax bases. Deferred tax assets and liabilities are measured using enacted tax rates expected to apply to taxable income in the years in which those temporary differences are expected to be realized or settled. The effect on deferred tax assets and liabilities of a change in tax rates is recognized in income in the period that includes the enactment date.
Net deferred tax assets assume sufficient future earnings for their realization. Where management believes it is more-likely-than-not that the deferred tax assets will not be realized in the relevant jurisdiction, the Company has recorded a valuation allowance against such asset.
The Company has adopted the provisions of ASC 740-10 (formerly FIN 48) and records uncertain tax position liabilities for federal, state, local and foreign exposures relating to periods subject to audit. The calculation of these tax liabilities require judgments about tax issues, potential outcomes and timing, and are a subjective critical estimate. The Company classifies interest and penalties as a component of the provision for income taxes.
Net Income (Loss) Per Common Share
Our consolidated statements of operations present basic and diluted net income (loss) per common share. Basic net income (loss) per common share is computed by dividing net income (loss) by the weighted average number of common shares outstanding for the period. Diluted net income per common share reflects the dilutive effects of restricted stock units. The treasury stock method was used to determine the dilutive effect of potentially dilutive securities. Due to the net loss for the fiscal year ended June 30, 2012, all 371,000 shares of common stock equivalents were excluded from diluted net income (loss) per common share because they were anti-dilutive. There were no potentially dilutive securities for the fiscal years ended June 30, 2011 and 2010, respectively.
Share-Based Compensation
The fair value of share-based payments is recognized as an expense in the consolidated statements of operations over the related vesting periods. Share-based compensation expense is based on the fair value of the portion of share-based payment awards that is ultimately expected to vest and has therefore been reduced for estimated forfeitures at the time of the grant, with subsequent revisions for the differences between actual and the estimated forfeiture rates (see Note 14 to the consolidated financial statements).
Foreign Currency Translations
The financial statements of our foreign subsidiaries are measured in their local currency and then translated into U.S. dollars using the current rate method. Under the current rate method, assets and liabilities are translated using the exchange rate at the balance sheet date. Revenues and expenses are translated at average exchange rates prevailing throughout the year.
Gains and losses resulting from the translation of financial statements of foreign subsidiaries are accumulated in other comprehensive income (loss) and presented as part of stockholders’ equity. Realized and unrealized foreign currency exchange gains (losses) from the settlement of foreign currency transactions are reflected in other income (expense) and amounted to $(883,000), $(634,000) and $(905,000) for the fiscal years ended June 30, 2012, 2011 and 2010, respectively.
| - 85 - |
Comprehensive Income
Comprehensive income consists of net income (loss) and equity adjustments relating to foreign currency translation, changes in fair value of certain derivatives and non-current marketable securities and adjustments to the minimum pension liability and is presented in the consolidated statements of comprehensive income (loss).
Reclassifications
The change in fair value of acquisition contingent consideration has been reclassified such that it is separately disclosed in the consolidated statements of operations for fiscal 2011 and 2010 in order to conform to the fiscal 2012 presentation.
Recently Adopted Accounting Pronouncements
In May 2011, the Financial Accounting Standards Board (“FASB”) issued authoritative guidance to amend the accounting and disclosure requirements on fair value measurements. The new guidance limits the highest-and-best-use measure to nonfinancial assets, permits certain financial assets and liabilities with offsetting positions in market or counterparty credit risks to be measured at a net basis, and provides guidance on the applicability of premiums and discounts. Additionally, the new guidance expands the disclosures on Level 3 inputs by requiring quantitative disclosure of the unobservable inputs and assumptions, as well as description of the valuation processes and the sensitivity of the fair value to changes in unobservable inputs. The adoption on January 1, 2012 of this new guidance did not have an impact on our consolidated financial statements.
In December 2010, the FASB issued authoritative guidance that modifies Step 1 of the goodwill impairment test for reporting units with zero or negative carrying amounts. For those reporting units, an entity is required to perform Step 2 of the goodwill impairment test if it is more likely than not that a goodwill impairment exists. In determining whether it is more likely than not that a goodwill impairment exists, an entity should consider whether there are any adverse qualitative factors indicating that an impairment may exist. The adoption on July 1, 2011 of this new guidance did not have an impact on our impairment assessment.
In December 2010, the FASB amended its authoritative guidance related to business combinations entered into by an entity that are material on an individual or aggregate basis. These amendments clarify existing guidance that if an entity presents comparative financial statements that include a material business combination, the entity should disclose pro forma revenue and earnings of the combined entity as though the business combination that occurred during the current year had occurred as of the beginning of the comparable prior annual reporting period. The amendments also expand the supplemental pro forma disclosures to include a description of the nature and amount of material, nonrecurring pro forma adjustments directly attributable to the business combination included in the reported pro forma revenue and earnings. We adopted this new guidance on July 1, 2011 and it became effective prospectively for business combinations consummated by us after June 30, 2011.
In January 2010, the FASB issued authoritative guidance to amend the disclosure requirements related to recurring and nonrecurring fair value measurements. The guidance requires a roll forward of activities on purchases, sales, issuance, and settlements on a gross basis of the assets and liabilities measured using significant unobservable inputs (Level 3 fair value measurements). The adoption on July 1, 2011 of the gross presentation of the Level 3 roll forward did not have an impact on our consolidated financial statements.
| - 86 - |
3. Acquisitions of Businesses
Test Evolution Corporation
On October 1, 2007, we purchased 40% of the outstanding stock of Test Evolution Corporation, or TEC, for $4.0 million. We determined that we have control of this company and commencing October 1, 2007 have consolidated TEC’s assets and liabilities and results of operations, all of which were insignificant, into our financial statements. TEC is included in our Test Solutions segment. On August 5, 2010, we invested another $2.0 million in TEC and, as a result of this and other capital transactions, our ownership interest is approximately 51%. The amounts attributable to the non-controlling interest in TEC’s equity and results of operations are not material to our consolidated financial statements and have been included in other long-term liabilities and other income (expense), respectively.
Gaisler Research AB
On June 30, 2008, we acquired the stock of Gaisler Research AB, or Gaisler, for $12.3 million cash (net of $2.7 million cash acquired), plus contingent consideration over the three year period of fiscal 2009 to fiscal 2011, based on Gaisler’s achieved EBITDA. Based on Gaisler’s actual results of operations an additional $4.0 million was paid to the selling shareholders in October 2009, $4.6 million was paid to the selling shareholders in October 2010, and $5.1 million was paid to the selling shareholders in October 2011, all of which has been added to goodwill in the accompanying consolidated balance sheets. Gaisler is included in our AMS segment.
Willtek Communications
On May 7, 2010, we acquired the net assets of Willtek Communications, or Willtek, for $2.8 million in cash, which in accordance with the purchase agreement, was subsequently reduced by an $873,000 closing date deficiency in adjusted net assets, which we received in January 2011. The gain from a bargain purchase of Willtek reflects the excess of the fair value of net assets over the purchase price. The purchase price was negotiated at such a level to be reflective of the cost of the restructuring efforts that we expected to incur at that time. Willtek is included in our ATS segment.
Radiation Assured Devices
On June 30, 2010, we acquired 100% of the stock of Radiation Assured Devices, Inc., or RAD, for $13.0 million in cash, which is net of cash acquired and a closing date deficiency in adjusted net assets, and recorded a $7.1 million liability for the fair value of contingent consideration over a five year period ending June 30, 2015. In October 2011, we paid $1.4 million of contingent consideration. In the statement of cash flows, $948,000 of the $1.4 million payment was classified as a financing activity, and the balance was classified as an operating activity in accordance with Accounting Standards Codification Topic 230. Due to slower than anticipated roll-out of new products, which has changed the future projection of sales during the earn-out period, we re-valued the contingent consideration liability to a value of $0 as of June 30, 2012, which amounted to a net benefit of $7.6 million and we no longer expect to pay any remaining contingent consideration. RAD is included in our AMS segment.
Advanced Control Components
On August 31, 2010, we acquired 100% of the stock of Advanced Control Components, Inc., or ACC, for $18.6 million in cash, which is net of working capital adjustments. ACC, located in Eatontown, New Jersey, designs, manufactures and markets a wide range of radio frequency, or RF, and microwave products for the military, civilian radar, scientific and communications markets. ACC is included in our AMS segment.
| - 87 - |
We allocated the purchase price based on the estimated fair value of the assets acquired and liabilities assumed as follows:
| (In thousands) | ||||
| Current assets (excluding cash of $15) | $ | 4,899 | ||
| Property, plant and equipment | 1,156 | |||
| Other assets | 60 | |||
| Customer related intangibles | 5,680 | |||
| Non-compete arrangements | 30 | |||
| Tradenames | 3,010 | |||
| Goodwill | 9,722 | |||
| Total assets acquired | 24,557 | |||
| Current liabilities | (2,895 | ) | ||
| Deferred taxes | (3,117 | ) | ||
| Total liabilities assumed | (6,012 | ) | ||
| Net assets acquired | $ | 18,545 |
The customer related intangibles and non-compete arrangements are being amortized on a straight-line basis over a range of 1 to 9 years. The tradenames are considered to have indefinite lives. The goodwill is not deductible for tax purposes.
On a pro forma basis, had the ACC acquisition taken place as of the beginning of the periods presented, our results of operations for those periods would not have been materially affected. The results of operations of ACC were included in our accompanying consolidated financial statements commencing with the date it was acquired.
4. Intangible Assets
Intangible Assets with Definite Lives
Intangible assets with definite lives are amortized on a straight-line basis over periods ranging up to 11 years.
The components of amortizable intangible assets were as follows:
| June 30, 2012 | June 30, 2011 | |||||||||||||||
| (In thousands) | ||||||||||||||||
| Gross | Gross | |||||||||||||||
| Carrying | Accumulated | Carrying | Accumulated | |||||||||||||
| Amount | Amortization | Amount | Amortization | |||||||||||||
| Developed technology | $ | 199,489 | $ | 164,065 | $ | 200,861 | $ | 130,675 | ||||||||
| Customer related intangibles | 226,865 | 146,259 | 229,382 | 122,050 | ||||||||||||
| Non-compete arrangements | 10,292 | 8,007 | 10,442 | 6,385 | ||||||||||||
| Tradenames | 3,298 | 2,137 | 3,396 | 1,357 | ||||||||||||
| Total | $ | 439,944 | $ | 320,468 | $ | 444,081 | $ | 260,467 | ||||||||
| - 88 - |
The estimated aggregate amortization expense for each of the next five fiscal years ending June 30, is as follows:
| (In thousands) | 2013 | 2014 | 2015 | 2016 | 2017 | |||||||||||||||
| Estimated amortization expense | $ | 56,026 | $ | 29,671 | $ | 19,105 | $ | 9,525 | $ | 2,393 | ||||||||||
Goodwill
The carrying amount of goodwill, by segment, was as follows:
| Microelectronic | Test | |||||||||||
| Solutions | Solutions | Total | ||||||||||
| (In thousands) | ||||||||||||
| Balance at June 30, 2010 | $ | 287,136 | $ | 158,738 | $ | 445,874 | ||||||
| Goodwill recorded for acquisition of ACC | 9,722 | - | 9,722 | |||||||||
| Gaisler 2011 earned contingent consideration | 5,107 | - | 5,107 | |||||||||
| Translation and other adjustments | 2,516 | 2,224 | 4,740 | |||||||||
| Balance at June 30, 2011 | 304,481 | 160,962 | 465,443 | |||||||||
| Impairment of goodwill | (54,900 | ) | - | (54,900 | ) | |||||||
| Translation and other adjustments | (1,491 | ) | (691 | ) | (2,182 | ) | ||||||
| Balance at June 30, 2012 | $ | 248,090 | $ | 160,271 | $ | 408,361 | ||||||
Intangible Assets with Indefinite Lives
As of June 30, 2012 and 2011, tradenames with indefinite lives were $113.5 million and $114.7 million, respectively.
Fiscal 2012 Impairment
Based on a reduced forecast of earnings for one of our reporting units, the Radio Frequency MicroWave, or RFMW group, we tested this reporting unit for impairment in the third quarter of fiscal 2012. We determined that there was an impairment by comparing the fair value of the reporting unit with its enterprise carrying value.
We then proceeded to the prescribed step 2 of the impairment process and calculated the amount of the write-down of goodwill by comparing the implied fair value of the reporting unit’s goodwill (the excess of the fair value of the reporting unit over the fair value of its net identifiable assets) with the carrying amount of that goodwill. As a result, we recognized $54.9 million as a non-cash goodwill impairment charge. In determining the fair value, a discount rate of 17% was applied to the expected cash flow and a long-term growth rate of 5% was used to determine the residual value.
As part of the analysis we also estimated the fair value of the RFMW group tradenames. In determining the fair value of the tradenames we used the relief-from-royalty method and a 2% royalty rate discounted to a present value at 18% and a 5% long-term growth rate was used to determine the residual value. The carrying value of the tradenames was higher than the fair value determined. Therefore, we recorded an additional non-cash impairment of $700,000. The discounted cash flow model and the relief-from-royalty method are Level 3 fair value measurements consisting of inputs unobservable in the market and significant to the fair value calculation.
| - 89 - |
Based on current and projected results of operations in one of our components of the RFMW reporting unit, we tested this component’s intangible asset for customer relationships for impairment and determined that the projected undiscounted cash flows were less than its carrying value. As a result, we recognized $512,000 as non-cash other long-lived asset impairment charge.
5. Restructuring Charges
For the fiscal year ended June 30, 2012, restructuring charges consisted of severance costs, facility closure costs and other non-cash charges, primarily related to the continued integration of Willtek into our European operations and the continued consolidation of one of our domestic components facilities located in Whippany, New Jersey into two of our other facilities.
For the fiscal year ended June 30, 2011, restructuring charges consisted of (i) severance costs and facility closure costs, primarily related to the integration of Willtek into our European operations and the continued consolidation of one of our domestic components facilities located in Whippany, New Jersey into two of our other facilities, and (ii) a non-cash building impairment charge based on the fair value of the Whippany, New Jersey facility we intend to sell.
For the fiscal year ended June 30, 2010, restructuring charges consisted of severance costs and facility closure costs related to continued consolidation and reorganization efforts in our European operations and the consolidation of one of our domestic components facilities located in Whippany, New Jersey into two of our other facilities.
| - 90 - |
The following table sets forth the charges and payments related to the restructuring liability, which is reflected in accrued expenses and other current liabilities in the accompanying consolidated balance sheets for the periods indicated:
| Balance | Balance | |||||||||||||||||||||||
| June 30, | June 30, | |||||||||||||||||||||||
| 2011 | Year Ended June 30, 2012 | 2012 | ||||||||||||||||||||||
| Non-Cash | Effect of | |||||||||||||||||||||||
| Restructuring | Cash | Restructuring | Foreign | Restructuring | ||||||||||||||||||||
| Liability | Net Additions | Payments | Charges | Currency | Liability | |||||||||||||||||||
| (In thousands) | ||||||||||||||||||||||||
| Severance costs | $ | 2,666 | $ | 4,107 | $ | (4,490 | ) | $ | - | $ | (198 | ) | $ | 2,085 | ||||||||||
| Facilities closure costs | 497 | 1,657 | (1,632 | ) | - | (20 | ) | 502 | ||||||||||||||||
| Asset write-off | - | 1,015 | - | (1,015 | ) | - | - | |||||||||||||||||
| Total | $ | 3,163 | $ | 6,779 | $ | (6,122 | ) | $ | (1,015 | ) | $ | (218 | ) | $ | 2,587 | |||||||||
| Balance | Balance | |||||||||||||||||||||||
| June 30, | June 30, | |||||||||||||||||||||||
| 2010 | Year Ended June 30, 2011 | 2011 | ||||||||||||||||||||||
| Non-Cash | Effect of | |||||||||||||||||||||||
| Restructuring | Cash | Restructuring | Foreign | Restructuring | ||||||||||||||||||||
| Liability | Net Additions | Payments | Charges | Currency | Liability | |||||||||||||||||||
| (In thousands) | ||||||||||||||||||||||||
| Severance costs | $ | 172 | $ | 8,223 | $ | (5,812 | ) | $ | - | $ | 83 | $ | 2,666 | |||||||||||
| Facilities closure costs | 632 | 1,700 | (1,890 | ) | - | 55 | 497 | |||||||||||||||||
| Asset write-off | - | 4,860 | - | (4,860 | ) | - | - | |||||||||||||||||
| Total | $ | 804 | $ | 14,783 | $ | (7,702 | ) | $ | (4,860 | ) | $ | 138 | $ | 3,163 | ||||||||||
6. Inventories
Inventories consisted of the following:
| June 30, | June 30, | |||||||
| 2012 | 2011 | |||||||
| (In thousands) | ||||||||
| Raw materials | $ | 82,202 | $ | 101,854 | ||||
| Work in process | 45,067 | 60,290 | ||||||
| Finished goods | 30,821 | 24,226 | ||||||
| $ | 158,090 | $ | 186,370 | |||||
| - 91 - |
7. Property, Plant and Equipment
Property, plant and equipment consisted of the following:
| Estimated | ||||||||||
| June 30, | June 30, | Useful Life | ||||||||
| 2012 | 2011 | In Years | ||||||||
| (In thousands) | ||||||||||
| Land | $ | 14,651 | $ | 15,474 | ||||||
| Buildings and leasehold improvements | 40,598 | 34,500 | 1 to 40 | |||||||
| Machinery and equipment | 108,132 | 100,211 | 1 to 12 | |||||||
| Furniture and fixtures | 40,561 | 37,558 | 3 to 10 | |||||||
| 203,942 | 187,743 | |||||||||
| Less accumulated depreciation and amortization | 102,310 | 82,581 | ||||||||
| $ | 101,632 | $ | 105,162 | |||||||
Depreciation expense on property, plant and equipment was $20.8 million, $19.4 million and $20.6 million for the fiscal years ended June 30, 2012, 2011 and 2010, respectively.
Based on current and projected results of operations in one of our components of the RFMW reporting unit, we tested this component’s property, plant and equipment for impairment and determined that the projected undiscounted cash flows were less than its carrying value. As a result, we recognized $588,000 as non-cash other long-lived asset impairment charge.
8. Product Warranty
We warrant our products against defects in design, materials and workmanship, generally for one year from their date of shipment. A provision for estimated future costs relating to these warranties is recorded in cost of sales when the related revenue is recognized. Quarterly we analyze our warranty liability for reasonableness based on a 15-month history of warranty costs incurred, the nature of the products shipped subject to warranty and anticipated warranty trends.
| - 92 - |
Activity related to our product warranty liability, which is reflected in accrued expenses and other current liabilities in the accompanying consolidated balance sheets, was as follows:
| (In thousands) | ||||
| Balance at June 30, 2010 | $ | 2,762 | ||
| Provision for warranty obligations | 2,036 | |||
| Cost of warranty obligations | (2,379 | ) | ||
| Foreign currency impact | 80 | |||
| Balance at June 30, 2011 | 2,499 | |||
| Provision for warranty obligations | 3,369 | |||
| Cost of warranty obligations | (3,285 | ) | ||
| Foreign currency impact | (19 | ) | ||
| Balance at June 30, 2012 | $ | 2,564 | ||
9. Derivative Financial Instruments
We address certain financial exposures through a controlled program of risk management that includes the use of derivative financial instruments. When deemed appropriate to do so, we enter into interest rate swap derivatives to manage the effects of interest rate movements on portions of our debt. We routinely enter into foreign currency forward contracts, not designated as hedging instruments, to protect us from fluctuations in exchange rates.
The fair values of our derivative financial instruments included in the consolidated balance sheets as of June 30, 2012 and 2011 were as follows:
| Asset (Liability) Derivatives | ||||||||||||
| June 30, 2012 | June 30, 2011 | |||||||||||
| Balance Sheet | Balance Sheet | |||||||||||
| (In thousands) | Location | Fair Value (1) | Location | Fair Value (1) | ||||||||
| Derivatives not designated as hedging instruments: | ||||||||||||
| Foreign currency forward contracts | Prepaid expenses and other current assets | $ | 23 | Accrued expenses and other current liabilities | $ | (30 | ) | |||||
| (1) | The fair values of derivative assets and liabilities are determined based on observable market data and are considered level 2 in the fair value hierarchy. See Note 10 for further information. |
The gains and losses related to our derivative financial instruments designated as hedging instruments for the fiscal years ended June 30, 2012, 2011 and 2010 were as follows:
| Derivatives in Cash Flow Hedging Relationships | Amount of Gain or (Loss) Recognized on Derivatives in Other Comprehensive Income (Effective Portion) | |||||||||||
| Year Ended June 30, | ||||||||||||
| 2012 | 2011 | 2010 | ||||||||||
| (In thousands) | ||||||||||||
| Interest rate swap contracts | $ | - | $ | (612 | ) | $ | (5,303 | ) | ||||
| - 93 - |
Location of Gain or (Loss) Reclassified from Accumulated Other Comprehensive Income into Income (Effective Portion) | Amount of Gain or (Loss) Reclassified from Accumulated Other Comprehensive Income into Income (Effective Portion) | |||||||||||
| Year Ended June 30, | ||||||||||||
| 2012 | 2011 | 2010 | ||||||||||
| (In thousands) | ||||||||||||
| Interest expense | $ | - | $ | (7,225 | ) | $ | (14,311 | ) | ||||
The amounts of the gains and losses related to our derivative financial instruments not designated as hedging instruments for the fiscal years ended June 30, 2012, 2011 and 2010 were as follows:
| Derivatives Not | Location of Gain or (Loss) | Amount of Gain or (Loss) | ||||||||||||
| Designated as | Recognized in Earnings on | Recognized in Earnings on | ||||||||||||
| Hedging Instruments | Derivative | Derivative | ||||||||||||
| Year Ended June 30, | ||||||||||||||
| 2012 | 2011 | 2010 | ||||||||||||
| (In thousands) | ||||||||||||||
| Foreign currency forward contracts | Other income (expense) | $ | 53 | $ | 263 | $ | (98 | ) | ||||||
Interest Rate Swap Cash-Flow Hedges
We enter into interest rate swap contracts with counterparties that are rated investment grade to manage the effects of interest rate movements on portions of our debt. Such contracts effectively fix the borrowing rates on floating rate debt to limit the exposure against the risk of rising rates. We do not enter into interest rate swap contracts for speculative purposes. There were no interest rate swap contracts that were outstanding as of June 30, 2011, and we have not entered into any new interest rate swap contracts since that date.
Foreign Currency Contract Derivatives
Foreign currency contracts are used to protect us from fluctuations in exchange rates. Our foreign currency contracts are not designated as hedges and therefore the change in fair value is included in other income (expense) as it occurs. As of June 30, 2012, we had $25.2 million of notional value foreign currency forward contracts maturing through July 31, 2012. Notional amounts do not quantify risk or represent assets or liabilities of the Company, but are used in the calculation of cash settlements under the contracts.
10. Fair Value Measurements
We account for certain assets and liabilities at fair value. The hierarchy below lists three levels of fair value based on the extent to which inputs used in measuring the fair value are observable in the market. We categorize each of our fair value measurements in one of these three levels based on the lowest level input that is significant to the fair value measurement in its entirety. These levels are:
| Level 1: | Inputs based on quoted market prices for identical assets or liabilities in active markets at the measurement date. |
| - 94 - |
| Level 2: | Observable inputs other than quoted prices included in Level 1, such as quoted prices for similar assets and liabilities in active markets; quoted prices for identical or similar assets and liabilities in markets that are not active; or other inputs that are observable or can be corroborated by observable market data. |
| Level 3: | Inputs reflect management's best estimate of what market participants would use in pricing the asset or liability at the measurement date. The inputs are unobservable in the market and significant to the instruments' valuation. |
Foreign Currency Forward Contracts — The fair values of our foreign currency forward contracts were determined using a pricing model with all significant inputs based on observable market data such as measurement date spot and forward rates (Level 2). The fair value of our foreign currency forward contracts as of June 30, 2012 was an asset of $23,000 and was included in prepaid expenses and other current assets. The fair value of our foreign currency forward contracts as of June 30, 2011 was a liability of $30,000 and was included in accrued expenses and other current liabilities.
Interest Rate Swap Contracts — The fair values of our interest rate swap contracts were based on valuations received from the counterparties and corroborated by measurement date equivalent swap rates (Level 2). There were no interest rate swap contracts that were outstanding as of June 30, 2011, and we have not entered into any new interest rate swap contracts since that date.
Marketable Securities — The following table presents the changes in the carrying value of our assets measured at fair value on a recurring basis using significant unobservable inputs (Level 3) for the years ended June 30, 2012 and 2011:
| Level 3 | ||||||||
| Auction Rate Securities | ||||||||
| Year Ended June 30, | ||||||||
| 2012 | 2011 | |||||||
| (In thousands) | ||||||||
| Beginning balance | $ | - | $ | 9,769 | ||||
| Sold at par | - | (2,000 | ) | |||||
| Transfer to Level 2 | - | (9,045 | ) | |||||
| Transfer of unrealized loss from accumulated other | ||||||||
| comprehensive income (loss) to realized loss | ||||||||
| recorded in other expense | - | 688 | ||||||
| Unrealized gain (loss) in accumulated other | ||||||||
| comprehensive income (loss) | - | 588 | ||||||
| Ending balance | $ | - | $ | - | ||||
During the fiscal year ended June 30, 2010, $8.9 million of our auction rate securities were redeemed by the issuer at an average of 96.4% of par. The resulting $320,000 realized loss was recorded in the statement of operations for the fiscal year ended June 30, 2010. During the year ended June 30, 2011, our remaining auction rate securities were sold at an average of 93.8% of par. The resulting $688,000 realized loss was recorded in the statement of operations for the fiscal year ended June 30, 2011.
11. Long Term Debt and Credit Agreements
On August 15, 2007, in connection with the Going Private Transaction, we incurred $870.0 million of debt to finance the acquisition of Aeroflex, which was comprised of the following:
| · | a $575.0 million senior secured credit facility, which consisted of $525.0 million of term loans and a $50.0 million revolving credit facility; |
| - 95 - |
| · | a $225.0 million exchangeable senior unsecured credit facility, which was subsequently refinanced with unregistered unsecured senior notes and subsequently exchanged for publicly registered unsecured senior notes; and |
| · | a $120.0 million exchangeable senior subordinated unsecured credit facility, which was subsequently repaid with the proceeds from senior subordinated unsecured term loans. |
On November 4, 2010, we amended our then existing senior secured credit facility, for which we paid a
$3.3 million fee to the lenders which was recorded as deferred financing costs and $579,000 of other costs that were expensed as incurred, which allowed us to, among other things:
| · | increase the amount of cash we could spend for acquisitions of businesses; |
| · | pay certain fees to affiliates of our Sponsors upon the completion of our IPO. These fees were paid on November 24, 2010, and consisted of a $2.5 million transaction fee for services directly attributable to the IPO (“Transaction Fee”), which was recorded as a reduction of additional paid-in capital, and a $16.9 million termination fee, to terminate the Sponsor Advisory Agreement with them (“Termination Fee”). The Termination Fee, when combined with the related write-off of prepaid advisory fees, amounted to an $18.1 million expense which is reported in the statement of operations as Termination of Sponsor Advisory Agreement; and |
| · | change the basis for calculating our interest rate margin above LIBOR. |
The net proceeds of our IPO were used to, among other things, tender for a portion of our senior unsecured notes and offer to repurchase a portion of our senior subordinated unsecured term loans. In December 2010, we repurchased $32.2 million of our then existing senior unsecured notes and $154.4 million of our then existing senior subordinated unsecured term loans. This resulted in a $25.2 million loss on extinguishment of debt and write-off of deferred financing costs, which was comprised of the following:
| · | an 11% premium paid on the debt repurchased, which amounted to $20.5 million; |
| · | the write-off of the related deferred financing costs of $4.0 million; and |
| · | professional fees of $614,000. |
On May 9, 2011, we entered into a new senior secured credit facility, consisting of a senior secured term loan facility of $725.0 million and a senior secured revolving credit facility of $75.0 million.
The $725.0 million proceeds were used:
| 1) | to refinance $695.5 million of our then outstanding debt, as follows: |
| · | to repay the entire outstanding balance of $489.1 million under our then existing senior secured credit facility; |
| · | to repurchase all of our unsecured senior notes of $192.8 million; and |
| · | to prepay all of our senior subordinated unsecured term loans of $13.6 million. |
| 2) | to pay a portion of the fees and expenses totaling $34.0 million in connection with the refinancing, including: |
| · | fees to the lenders of $14.2 million; |
| - 96 - |
| · | a premium of approximately 9% on the repurchased unsecured senior notes and senior subordinated unsecured term loans, which amounted to $18.3 million; and |
| · | professional fees and other expenses of $1.5 million. |
We recorded $15.6 million of these fees as deferred financing costs and recorded $34.2 million, related to the repayment of the debt, as a loss on extinguishment of debt, including the write-off of the existing deferred financing costs of $15.8 million.
The total cash outlay related to the debt refinancing, including premiums, fees and expenses listed above and $10.7 million of interest accrued through May 9, 2011, exceeded the $725.0 million proceeds by $15.2 million, which was paid from our available cash.
On May 24, 2012, we amended our senior secured credit facility, for which we paid a $3.5 million fee to the lenders which was recorded as deferred financing costs and $83,000 of other costs that were expensed as incurred, which allowed us to increase the flexibility under the total leverage ratio covenant. As of result of the amendment, the applicable LIBOR interest margin increased from 300 basis points to 450 basis points.
Total long term debt outstanding as of June 30, 2012 and 2011 consisted of the following:
| June 30, | ||||||||||||
| 2012 | 2011 | |||||||||||
| (In thousands) | ||||||||||||
| Senior secured revolving credit facility | (a) | $ | - | $ | - | |||||||
| Senior secured term loan facility | (b) | 641,375 | 725,000 | |||||||||
| Total senior secured debt | 641,375 | 725,000 | ||||||||||
| Other | - | 385 | ||||||||||
| Total debt | 641,375 | 725,385 | ||||||||||
| Less current maturities | - | 7,635 | ||||||||||
| Total long term debt | $ | 641,375 | $ | 717,750 | ||||||||
| (a) | The senior secured revolving credit facility provides for borrowings of up to $75.0 million through May 9, 2016 at a rate based on the LIBOR rate (3 month period) plus 450 basis points (4.96% at June 30, 2012). The senior secured credit facility allows us to utilize up to $25.0 million of the revolving credit facility for letters of credit and up to $5.0 million for a swing loan. At June 30, 2012, there are no outstanding amounts or letters of credit issued against the facility. Any borrowings would be secured by substantially all of the Company's assets. We are obligated to pay a 0.5% fee on any undrawn revolver commitments. |
| (b) | The $725.0 million senior secured term loan facility provided for $1.8 million quarterly principal repayments commencing September 30, 2011, with the remaining balance due at maturity on May 9, 2018. The senior secured term loan facility is subject to mandatory prepayments based on certain events, including a percentage of our annual excess cash flows, which ranges from 0% to 75%, depending on the level of our senior secured leverage ratio. The outstanding borrowings under the senior secured term loan facility bore interest, prior to the amendment, payable quarterly, at a rate per annum equal to either: (i) the base rate (as defined in the senior secured credit facility), plus an applicable margin of 350 basis points (6.75% at June 30, 2012), or (ii) the adjusted LIBOR rate, which has a floor of 125 basis points (as defined in the senior secured credit facility), plus an applicable margin of 450 basis points (5.75% at June 30, 2012). The borrowings are secured by substantially all of our assets, excluding those of our foreign subsidiaries, but including 65% of the stock of the foreign subsidiaries. During fiscal 2012, we repaid $83.6 million of our senior secured term loan facility, including voluntary prepayments of $80.0 million, with cash on hand from operations. The voluntary prepayments resulted in the write-off of the related deferred financing costs of $1.2 million. These voluntary prepayments were first applied to the scheduled quarterly repayments beginning with the March 31, 2012 payment, and second, to the amount due at the end of the term of the loan. Therefore, we will not have any further required quarterly repayments and will be required to pay $641.4 million on May 9, 2018. |
| - 97 - |
The senior secured credit facility agreement provides that if the Company sells assets (with certain exceptions) or issues new debt or equity securities to unrelated parties, the proceeds must be used to prepay term or revolving credit loans.
Financial covenants in the senior secured credit facility include a maximum leverage ratio of total debt (less up to $15.0 million of unrestricted cash) to Adjusted EBITDA, as defined in the agreement, of 5.75 on June 30, 2012, which reduces to 5.50 on March 31, 2013 and ultimately to 3.50 on March 31, 2015 and thereafter. Additional covenants include restrictions on indebtedness, liens, investments, dividends, disposition of assets, acquisitions and transactions with shareholders and affiliates.
As of June 30, 2012, we were in compliance with all of the financial covenants contained in the senior secured credit facility.
In connection with the respective credit facilities discussed above, we capitalized deferred financing costs of $3.7 million, $18.9 million and $0 for the years ended June 30, 2012, 2011 and 2010, respectively, primarily consisting of facility and legal fees. For the years ended June 30, 2012, 2011 and 2010, we amortized $2.0 million, $4.8 million and $4.8 million, respectively, to interest expense. During the years ended June 30, 2012 and 2011, we wrote-off $1.2 million and $19.8 million, respectively, of deferred financing costs, in connection with the extinguishment of debt.
Interest paid was $31.1 million, $67.6 million and $60.8 million for the years ended June 30, 2012, 2011 and 2010, respectively. Accrued interest of $5.1 million and $4.4 million was included in accrued expenses and other current liabilities at June 30, 2012 and 2011, respectively.
The fair value of our debt instruments are summarized as follows:
| As of June 30, 2012 | ||||||||
| (In thousands) | ||||||||
| Carrying Amount | Estimated Fair Value | |||||||
| Senior secured term loan facility | $ | 641,375 | $ | 622,134 | ||||
| As of June 30, 2011 | ||||||||
| (In thousands) | ||||||||
| Carrying Amount | Estimated Fair Value | |||||||
| Senior secured term loan facility | $ | 725,000 | $ | 725,906 | ||||
| Other | 385 | 385 | ||||||
| Total Debt | $ | 725,385 | $ | 726,291 | ||||
The estimated fair values of each of our debt instruments are based on quoted prices and are considered Level 2 measurements. Fair value estimates related to our debt instruments are made at a specific point in time based on relevant market information. These estimates are subjective in nature and involve uncertainties and matters of significant judgments and therefore cannot be determined with precision. Changes in assumptions could significantly affect the estimates.
| - 98 - |
| 12. | Loss on Liquidation of Foreign Subsidiary |
In connection with the 2003 acquisition of one of our wireless businesses in the U.K., we set up a foreign partnership to finance the acquisition. We invested $19.5 million in the partnership and the partnership advanced those funds to our foreign holding company in the form of a loan, the proceeds of which were used for the acquisition.
During the year ended June 30, 2010, the loan was fully repaid to the partnership, with interest, and we received a return of capital and dividends. The partnership has been liquidated.
As a result of changes in foreign currency rates, there was a cumulative translation adjustment of $7.7 million remaining after substantially all of the assets were returned to us and substantially all of the liabilities were satisfied. In accordance with U.S. GAAP, this remaining cumulative translation adjustment has been expensed in the period during which the substantial liquidation of the partnership occurred and presented as a non-cash loss on liquidation of foreign subsidiary in our consolidated statement of operations for the year ended June 30, 2010. This loss was not deductible for income tax purposes.
| 13. | Common Stock |
As of June 30, 2012, our authorized common stock consists of 300.0 million shares, par value $.01 per share.
Information about our common stock outstanding was as follows:
| Shares | ||||
| (In thousands) | ||||
| Balance at June 30, 2009 and 2010 | 65,000 | |||
| Common stock issued in IPO | 19,789 | |||
| Balance at June 30, 2011 | 84,789 | |||
| Common stock issued upon vesting of RSUs | 57 | |||
| Balance at June 30, 2012 | 84,846 | |||
Our board of directors authorized an increase of our authorized shares of common stock to 300,000,000 and a 65,000,000 for 1 common stock split, both of which became effective on November 18, 2010. Our stockholders’ equity has been retroactively adjusted to give effect to the stock split for all periods presented by reclassifying the par value of the additional shares issued in connection with the split from additional paid-in capital to common stock. In addition, all share numbers and per share amounts in our consolidated financial statements have been retroactively adjusted to give effect to the stock split.
In November 2010, we consummated an IPO of our common stock in which we sold 19,789,180 shares of common stock at a price of $13.50 per share. We received net proceeds of $244.0 million from the IPO, after deducting underwriting discounts and offering expenses, including the $2.5 million Transaction Fee.
| - 99 - |
| 14. | Share-Based Payment Arrangements |
In November 2011, our stockholders approved the 2011 Omnibus Incentive Plan, or the 2011 Plan. The 2011 Plan authorizes us to provide equity-based compensation in the form of options, stock appreciation rights, restricted stock and restricted stock units, or RSUs, other share based awards and performance awards. Awards may be granted to employees, directors and consultants of the Company. The number of shares of our common stock authorized for award under the 2011 Plan was 4.5 million shares. The compensation committee of our board of directors administers the 2011 Plan including selecting participants, the type and terms of awards to be granted and number of shares subject to the awards.
In fiscal 2012, the compensation committee awarded RSUs covering a total of 432,000 shares including 44,000 RSUs that vested during fiscal 2012. In connection with these vestings, we withheld and remitted $101,000 of payroll taxes. As of June 30, 2012, 4.1 million shares of our common stock were reserved and available for grants pursuant to the 2011 Plan.
RSUs generally vest in equal tranches over a service period of up to five years. We have elected to recognize compensation cost on a straight-line basis over the requisite service period for the entire award. Except as noted below, the estimated fair value of RSUs granted under the 2011 Plan was determined based on the fair value of our common stock on the date of grant. RSUs awarded to employees in certain foreign countries are to be settled in cash at their vesting date and were therefore recorded as liability-classified awards. Liability-classified awards are remeasured to fair value at each reporting date until settlement.
The weighted average grant date fair value of RSUs granted for the year ended June 30, 2012 was $8.84 per share. The total intrinsic value of RSUs that vested during the year ended June 30, 2012 was $418,000.
As of June 30, 2012, the total unrecognized compensation cost related to RSUs was $2.7 million and the related weighted average period over which it is expected to be recognized was approximately 2.4 years.
Additional information with respect to our RSUs was as follows:
| Weighted | ||||||||||||
| Average | ||||||||||||
| Contractual | ||||||||||||
| Life | ||||||||||||
| Average | Remaining in | |||||||||||
| Shares | Intrinsic Value | Years | ||||||||||
| (In thousands) | (In thousands) | |||||||||||
| Outstanding at June 30, 2011 | - | |||||||||||
| Granted | 432 | |||||||||||
| Forfeited | (17 | ) | ||||||||||
| Vested | (44 | ) | ||||||||||
| Outstanding at June 30, 2012 | 371 | $ | 2,242 | 2.4 | ||||||||
| Expected to vest at June 30, 2012 | 342 | $ | 2,071 | 2.4 | ||||||||
| - 100 - |
On August 15, 2007 certain members of our management were granted Class B membership interests and during the years ended June 30, 2011 and 2010 certain employees were granted Class B-1 membership interests, in a limited liability company (parent LLC) that owns 76.6% of our common stock as of June 30, 2012. The parent LLC is a holding company with no operations or employees of its own. The parent LLC has three classes of membership interests, Class A, Class B and Class B-1. Our non-management equity investors, or their affiliates, and certain of our employees that made equity investments in parent LLC are Class A members. Class B and Class B-1 members consist of certain of our employees. Pursuant to the terms of the limited liability company operating agreement, or the LLC Agreement, governing parent LLC, all class members will share in any distributions on a pro-rata basis based on their percentage of membership interests, to the extent funds are available, after the Class A members first receive a priority distribution, then the Class B members receive a priority distribution and finally the Class B-1 members receive a priority distribution (each distribution as separately defined in the LLC Agreement). The Class B and Class B-1 membership interests are non-transferable and vest ratably over five years, with any unvested interests reverting to the holders of Class A interests in the event they are forfeited or repurchased. The Class B and Class B-1 membership interests are equity classified awards and, therefore, the fair value of the Class B and Class B-1 membership interests at the grant date is being recorded as compensation expense on a straight-line basis over the respective vesting period. In addition, since the Class A employee members that made equity investments in parent LLC paid less than fair value for their Class A member interests, as only they are entitled to a $3.2 million special distribution and there is no vesting associated with the special distribution, we recorded the present value of the discount from fair value of $1.4 million as compensation expense on August 15, 2007. The accretion of $392,000, $338,000 and $292,000 for the years ended June 30, 2012, 2011 and 2010, respectively, was recorded as interest expense.
Compensation expense attributable to share-based compensation (for both RSUs and membership interests) was $3.5 million ($2.2 million after tax) for the year ended June 30, 2012, $2.3 million ($1.4 million after tax) for the year ended June 30, 2011 and $2.1 million ($1.3 million after tax) for the year ended June 30, 2010.
| 15. | Accumulated Other Comprehensive Income (Loss) |
Accumulated other comprehensive income (loss) was as follows:
| Year Ended June 30 | ||||||||||||
| 2012 | 2011 | 2010 | ||||||||||
| (in thousands) | ||||||||||||
| Net derivative instruments, beginning of year | $ | - | $ | (4,046 | ) | $ | (9,602 | ) | ||||
| Annual change in derivative instruments, net of tax | - | 4,046 | 5,556 | |||||||||
| Net derivative instruments, end of year | - | - | (4,046 | ) | ||||||||
| Net investment gains (losses), beginning of year | - | (1,276 | ) | (2,268 | ) | |||||||
| Annual change in investment gains (losses), net of tax | - | 1,276 | 992 | |||||||||
| Net investment gains (losses), end of year | - | - | (1,276 | ) | ||||||||
| Net minimum pension liability, beginning of year | (544 | ) | (773 | ) | (499 | ) | ||||||
| Annual change in minimum pension liability, net of tax | (904 | ) | 229 | (274 | ) | |||||||
| Net minimum pension liability, end of year | (1,448 | ) | (544 | ) | (773 | ) | ||||||
| Net cumulative translation adjustment, beginning of year | (31,992 | ) | (47,480 | ) | (42,331 | ) | ||||||
| Annual change in cumulative translation adjustment , net of tax | (6,036 | ) | 15,488 | (5,149 | ) | |||||||
| Net cumulative translation adjustment, end of year | (38,028 | ) | (31,992 | ) | (47,480 | ) | ||||||
| Accumulated other comprehensive income (loss) | $ | (39,476 | ) | $ | (32,536 | ) | $ | (53,575 | ) | |||
The valuation allowance for non-current marketable securities was not adjusted for income taxes as it would have created a capital loss carryforward upon realization for which we would record a valuation allowance against the related deferred tax asset.
| - 101 - |
| 16. | Income Taxes |
The amount of income (loss) before income taxes attributable to domestic and foreign operations were as follows:
| Year Ended June 30, | ||||||||||||
| 2012 | 2011 | 2010 | ||||||||||
| (In thousands) | ||||||||||||
| Domestic | $ | (36,411 | ) | $ | (109,608 | ) | $ | (54,262 | ) | |||
| Foreign | (22,119 | ) | 36,122 | 42,813 | ||||||||
| $ | (58,530 | ) | $ | (73,486 | ) | $ | (11,449 | ) | ||||
The provision (benefit) for income taxes consisted of the following:
| Year Ended June 30, | ||||||||||||
| 2012 | 2011 | 2010 | ||||||||||
| (In thousands) | ||||||||||||
| Current: | ||||||||||||
| Federal | $ | 1,623 | $ | 2,399 | $ | 390 | ||||||
| State and local | 1,243 | 359 | 1,133 | |||||||||
| Foreign | (4,035 | ) | 12,050 | 3,904 | ||||||||
| (1,169 | ) | 14,808 | 5,427 | |||||||||
| Deferred: | ||||||||||||
| Federal | 976 | (46,447 | ) | (5,510 | ) | |||||||
| State and local | (1,637 | ) | (3,916 | ) | (2,355 | ) | ||||||
| Foreign | (3,063 | ) | (3,263 | ) | 3,258 | |||||||
| (3,724 | ) | (53,626 | ) | (4,607 | ) | |||||||
| $ | (4,893 | ) | $ | (38,818 | ) | $ | 820 | |||||
The provision (benefit) for income taxes varied from the amount computed by applying the U.S. federal income tax rate to income (loss) before income taxes as a result of the following:
| Year Ended June 30, | ||||||||||||
| 2012 | 2011 | 2010 | ||||||||||
| (In thousands) | ||||||||||||
| Tax at federal statutory rate | $ | (20,486 | ) | $ | (25,720 | ) | $ | (4,007 | ) | |||
| U.S. federal tax on earnings of foreign subsidiaries | 3,493 | (6,394 | ) | 15,737 | ||||||||
| Foreign tax rate differential | 251 | (2,113 | ) | (3,356 | ) | |||||||
| Deduction for write-off of investment in foreign subsidiary, net | - | - | (1,729 | ) | ||||||||
| Foreign tax credits | - | 9,640 | (4,914 | ) | ||||||||
| Increase (decrease) in valuation allowance | 1,947 | (9,278 | ) | 5,395 | ||||||||
| State and local income taxes, net of federal | (1,129 | ) | (3,797 | ) | (2,710 | ) | ||||||
| Impairment of non-deductible goodwill | 17,624 | - | - | |||||||||
| Gain from a bargain purchase of a business | - | (66 | ) | (1,398 | ) | |||||||
| Non-deductible expenses, including change in fair value of contingent consideration liability | (3,440 | ) | 2,438 | 408 | ||||||||
| Research and development credit and deduction | (2,880 | ) | (3,824 | ) | (2,469 | ) | ||||||
| Other, net | (273 | ) | 296 | (137 | ) | |||||||
| $ | (4,893 | ) | $ | (38,818 | ) | $ | 820 | |||||
| - 102 - |
The tax effects of temporary differences which give rise to significant portions of deferred tax assets and liabilities consisted of:
| As of June 30, | ||||||||
| 2012 | 2011 | |||||||
| (In thousands) | ||||||||
| Accounts receivable | $ | 291 | $ | 304 | ||||
| Inventories | 24,958 | 25,617 | ||||||
| Accrued expenses and other current liabilities | 8,067 | 9,625 | ||||||
| Other long-term liabilities | 8,348 | 7,243 | ||||||
| Tax loss carryforwards | 7,437 | 26,856 | ||||||
| Capital loss carryforwards | 2,207 | 391 | ||||||
| Tax credit carryforwards | 4,359 | 6,680 | ||||||
| Gross deferred tax assets | 55,667 | 76,716 | ||||||
| Less: valuation allowance | (9,287 | ) | (7,375 | ) | ||||
| Net deferred tax assets | 46,380 | 69,341 | ||||||
| Property plant and equipment | (18,469 | ) | (16,022 | ) | ||||
| Non-distributed earnings of foreign subsidiaries | (8,031 | ) | (10,802 | ) | ||||
| Intangible assets | (80,587 | ) | (107,812 | ) | ||||
| Gross deferred tax liabilities | (107,087 | ) | (134,636 | ) | ||||
| Net deferred tax assets (liabilities) | $ | (60,707 | ) | $ | (65,295 | ) | ||
Deferred tax assets have resulted primarily from our future deductible temporary differences and net operating loss and tax credit carryforwards. In assessing the realizability of deferred tax assets, management considers whether it is more likely than not that some portion or all of the deferred tax asset will not be realized. Our ability to realize these deferred tax assets depends upon the generation of sufficient future taxable income to allow for the utilization of the deductible temporary differences and loss and credit carryforwards. If such estimates and related assumptions change in the future, we may be required to record additional valuation allowances against our deferred tax assets resulting in additional income tax expense in our consolidated statements of operations. Management evaluates the realizability of the deferred tax assets and the need for additional valuation allowances quarterly. At this time, based on current facts and circumstances, management believes that it is more likely than not that we will realize benefit for our gross deferred tax assets, except those deferred tax assets against which a valuation allowance has been recorded.
At June 30, 2011, we had provided U.S. deferred taxes of $10.8 million on the accumulated earnings of one foreign subsidiary based on the Company’s intent to repatriate these earnings. Part of these earnings were repatriated to the U.S. during fiscal 2012 which was used to pay down principal on the Company’s outstanding debt. During fiscal 2012, we also provided U.S. deferred taxes of $3.5 million on the accumulated earnings of this subsidiary and two additional foreign subsidiaries for which the Company intends to repatriate the earnings in the foreseeable future. At June 30, 2012, the Company has approximately $8.0 million of U.S. deferred taxes provided for the expectation of the repatriation of these earnings. Aside from these three subsidiaries, the Company does not have any significant overseas earnings for which U.S. taxes have not been provided.
During the three months ended September 30, 2010, we identified an overstatement of deferred income tax liabilities established in the fourth quarter of fiscal 2009 and throughout fiscal 2010 related to U.S. income taxes provided on unremitted foreign earnings. After consideration of both quantitative and qualitative factors, we determined the amounts were not material to any of those prior period financial statements or the fiscal 2011 estimated results and thus corrected the balance in the three months ended September 30, 2010. The adjustment resulted in a reduction of deferred income tax liabilities of $3.7 million, with a corresponding increase in income tax benefit in the statement of operations for the three months ended September 30, 2010. The adjustment did not impact the statement of cash flows.
| - 103 - |
As of June 30, 2012, we had U.S. federal and state business credit and alternative minimum tax credit carryforwards of $2.4 million. Our U.S. business credits have varying expiration dates between 2023 and 2031. The alternative minimum tax credit has no expiration date.
As of June 30, 2012, we had foreign tax credit carryforwards of $2.0 million that relate to foreign source income upon which U.S. taxes have been previously provided and paid. The benefit available for foreign tax credits against our U.S. income tax on foreign earnings has not been recognized because it was not considered to be more likely than not that we would generate sufficient foreign source income to be able to claim the credit. Therefore, we have provided a valuation allowance against all foreign tax credits. If factors change such that we conclude that it is more likely than not that we will be able to utilize our foreign tax credits, then we would recognize this benefit through the elimination of the valuation allowance we have set up against the foreign tax credits.
As of June 30, 2012, we had operating loss carryforwards of $668,000 in France, $4.4 million in Germany, $530,000 in Hong Kong, and $3.9 million in Singapore which have no expiration. We also had operating loss carryforwards in China of $880,000 which will expire in 2017. We also had state net operating losses that create an available net benefit of $5.3 million. We have provided a valuation allowance of $1.8 million against the deferred tax assets for all net operating loss carryforwards in France, Germany, Singapore and China and an aggregate of $7.5 million for state net tax benefits, foreign tax credit carryforwards, and certain other deferred tax assets that are not deemed realizable.
The increase in the valuation allowance of $1.9 million during the year ended June 30, 2012 is primarily attributable to non-trade losses generated in the United Kingdom and net operating losses generated in Singapore and Germany for which future utilization is uncertain. The decrease in the valuation allowance for the year ended June 30, 2011 is primarily for foreign tax credits of $9.6 million.
We made income tax payments of $9.2 million, $15.0 million and $6.1 million and received refunds of $194,000, $3.1 million and $633,000 during the years ended June 30, 2012, 2011 and 2010, respectively.
The aggregate amount of unrecognized tax benefits included in liabilities was as follows:
| Year Ended June 30, | ||||||||
| 2012 | 2011 | |||||||
| (In thousands) | ||||||||
| Balance at beginning of year | $ | 2,344 | $ | 855 | ||||
| Gross increase related to tax positions taken in current fiscal year | 195 | 251 | ||||||
| Gross increase related to tax positions taken prior to fiscal year | 239 | 2,685 | ||||||
| Gross decrease of tax benefits related to settlements with taking authorities | (167 | ) | (1,439 | ) | ||||
| Reduction as a result of a lapse of the applicable statute of limitations | (50 | ) | (8 | ) | ||||
| Balance at end of year | $ | 2,561 | $ | 2,344 | ||||
Interest and penalties related to income tax liabilities were included in income tax expense, consistent with our historical policy and amounted to $31,000, $272,000 and $61,000 for the years ended June 30, 2012, 2011 and 2010, respectively. At June 30, 2012 and 2011, accrued interest on uncertain tax positions was $256,000 and $237,000, respectively, net of the federal benefit.
| - 104 - |
We do not anticipate a significant increase or decrease to our unrecognized tax benefits over the next twelve months. As of June 30, 2012, if all uncertain tax positions were sustained at the amounts reported or expected to be reported in our tax returns, our income tax expense would decrease by $2.6 million.
In August 2010, we settled an Internal Revenue Service income tax audit for the fiscal years 2006 and 2007 and the periods July 1, 2007 to August 14, 2007 and August 15, 2007 to June 30, 2008 with a net $1.3 million payment of taxes and $339,000 in interest partially offset by tax benefits of $1.2 million primarily for certain resulting tax credit carryforwards. The decrease in the uncertain tax position liability of $1.4 million in fiscal 2011 was due to the settlement of the audit.
The statute of limitations for our federal income tax return is open for all years subsequent to our 2008 fiscal year. The statute of limitations for our state returns is open for all years subsequent to our 2008 fiscal year. The statute of limitations for the U.K. income tax returns is open for all years subsequent to our 2010 fiscal year.
| 17. | Employment Contracts |
We have employment agreements with our officers and certain other key employees for varying periods through 2015 with annual remuneration ranging from $150,000 to $650,000, plus, in some cases, additional compensation based upon earnings of the Company. Future aggregate minimum payments under these contracts are $7.6 million. Certain of the contracts provide for a three-year consulting period at the expiration of the employment term at two-thirds of salary. In addition, certain of these officers have the option to terminate their employment agreements upon a change in control of the Company, as defined, and receive lump sum payments equal to the salary and bonus, if any, for the remainder of the term.
| 18. | Employee Benefit Plans |
401(k) and Profit Sharing Plans
All of our U.S. employees who are not members of a collective bargaining agreement are eligible to participate in a Company sponsored 401(k) plan. Each participant has the option to contribute a portion of his or her compensation and to receive a discretionary employer matching contribution. In fiscal 2010, there was no employer contribution. On July 1, 2010, the employer matching contribution was reinstated at a rate of 40% of the first 8% of compensation contributed by the employee. On November 1, 2011, the employer matching contribution was suspended. Furthermore, employees of one subsidiary are eligible to participate in a qualified profit sharing plan and receive an allocation of a discretionary share of the subsidiary’s profits. For the fiscal years ended June 30, 2012, 2011 and 2010, aggregate expenses related to these 401(k) and profit sharing plans were $3.7 million, $5.6 million and $2.0 million, respectively.
Defined Benefit Pension Plan
The Company has a Supplemental Executive Retirement Plan, or SERP. As of June 30, 2012, the SERP is unfunded, however, there are funds (primarily the cash surrender value of life insurance policies that specify the SERP as the beneficiary) being held in a rabbi trust for the one remaining individual in the SERP, an officer who retired in 2005. Those assets (which are included in other assets) totaled $11.1 million and $10.3 million at June 30, 2012 and 2011, respectively, and are not considered in the fair value of plan assets. An actuarially determined liability of $6.5 million for the one remaining SERP participant is recorded as of June 30, 2012, of which $628,000 is included in accrued expenses and other current liabilities and $5.9 million is included in other long-term liabilities. Payments to the retired officer of $628,000 were made in each of the fiscal years 2012, 2011 and 2010. We are required to make payments of $628,000 in each fiscal year pursuant to the SERP to this retired officer through December 31, 2015 or upon death, whichever is later.
| - 105 - |
In the fiscal years ended June 30, 2012, 2011 and 2010, we recorded $1.0 million, $404,000 and $311,000, respectively, of pension expense, included in general and administrative expenses in the accompanying statement of operations, for an increase in the SERP liability.
Assumptions
The weighted-average assumptions used to determine benefit obligations and net periodic benefit cost under the SERP was a discount rate of 4.13%, 5.67% and 5.45% for the years ended June 30, 2012, 2011, and 2010, respectively. The rate of compensation increase was not applicable as the one participant in the SERP whose liability is actuarially determined is an inactive retired employee. The expected long-term return on plan assets was also not applicable since the SERP was unfunded.
| 19. | Legal Matters |
We have identified instances of noncompliance with the International Traffic in Arms Regulations, or ITAR, in certain of our past business activities as well as in the pre-acquisition business activities of certain acquired companies. These include the inadvertent misclassification and/or export of products without the required license and the disclosure of controlled technology to certain foreign national employees. These matters were formally disclosed to the U.S. Department of State from time to time from fiscal 2007 through fiscal 2012. Matters resolved to date have been done so without penalty. At this time it is not possible to determine whether any fines or other penalties will be assessed against us or the materiality of the outcome of any of the remaining ITAR matters.
In March 2005, we sold the net assets of our shock and vibration control device manufacturing business, which we refer to as VMC. Under the terms of the sale agreements, we retained certain liabilities relating to adverse environmental conditions that existed at the premises occupied by VMC as of the date of sale. We recorded a liability for the estimated remediation costs related to adverse environmental conditions that existed at the VMC premises when it was sold. The accrued environmental liability at June 30, 2012 was $1.4 million, of which $350,000 was expected to be paid within one year.
We are also involved in various other claims and legal actions that arise in the ordinary course of business. We do not believe that the ultimate resolution of any of these actions will have a material adverse effect on our business, results of operations, financial position, liquidity or capital resources.
| 20. | Other Commitments and Contingencies |
Operating Leases
Several of our operating facilities and certain machinery and equipment are leased under agreements expiring through 2021. The leases for machinery and equipment generally contain purchase options at the end of their lease term at the then fair value of the related leased assets.
| - 106 - |
The following is a summary of future minimum payments under operating leases for the next five fiscal years and thereafter as of June 30, 2012:
| (In thousands) | 2013 | 2014 | 2015 | 2016 | 2017 | Thereafter | Total | |||||||||||||||||||||
| Future minimum payment | $ | 8,168 | $ | 6,234 | $ | 4,589 | $ | 3,929 | $ | 3,062 | $ | 4,216 | $ | 30,198 | ||||||||||||||
Rental expense was $10.6 million, $9.9 million and $8.3 million for the fiscal years ended June 30, 2012, 2011 and 2010, respectively.
| 21. | Business Segments |
We are a global provider of radio frequency, or RF, and microwave integrated circuits, components and systems used in the design, development and maintenance of technically demanding, high-performance wireless communication systems. Our solutions include highly specialized microelectronic components and test and measurement equipment used by companies in the space, avionics, defense, commercial wireless communications, medical and other markets. Approximately 33%, 30% and 34% of our sales for the fiscal years ended June 30, 2012, 2011 and 2010, respectively, were to agencies of the United States government or to prime defense contractors or subcontractors of the United States government. No customer constituted more than 10% of sales during any of the periods presented. Inter-segment sales were not material and have been eliminated from the tables below.
The majority of our operations are located in the United States. We also have operations in Europe and Asia, with our most significant non-U.S. operations in the U.K. Net sales from facilities located in the U.K. were $143.8 million, $178.5 million and $163.8 million for the fiscal years ended June 30, 2012, 2011 and 2010, respectively. Total assets of the U.K. operations were $177.9 million as of June 30, 2012 and $209.6 million as of June 30, 2011.
| - 107 - |
Net sales, based on the customers' locations, attributed to the United States and other regions were as follows:
| Year Ended June 30, | ||||||||||||
| 2012 | 2011 | 2010 | ||||||||||
| (In thousands) | ||||||||||||
| United States of America | $ | 409,270 | $ | 393,396 | $ | 382,537 | ||||||
| Europe and Middle East | 137,978 | 151,964 | 140,101 | |||||||||
| Asia and Australia | 106,748 | 159,554 | 119,332 | |||||||||
| Other regions | 19,019 | 24,500 | 13,078 | |||||||||
| $ | 673,015 | $ | 729,414 | $ | 655,048 | |||||||
The decrease in the sales to Asia in the fiscal year ended June 30, 2012 were primarily due to reduced wireless test equipment sales.
We organize our operations into two segments: Aeroflex Microelectronic Solutions, or AMS, and Aeroflex Test Solutions, or ATS. We engineer, manufacture and market a diverse range of products in each of our segments.
AMS offers a broad range of microelectronics products and is a leading provider of high-performance, high reliability specialty microelectronics components. Its products include high reliability, or HiRel, microelectronics/semiconductors, RF and microwave components, mixed-signal/digital ASICs and motion control products. ATS is a leading provider of a broad line of specialized test and measurement equipment. Its products include wireless test equipment, military radio and private mobile radio test equipment, avionics test equipment, synthetic test equipment and other general purpose test equipment.
| - 108 - |
Selected financial data by segment is as follows:
| Year Ended June 30, | ||||||||||||
| 2012 | 2011 | 2010 | ||||||||||
| (In thousands) | ||||||||||||
| Net sales | ||||||||||||
| - Microelectronic solutions ("AMS") | $ | 366,745 | $ | 370,035 | $ | 322,151 | ||||||
| - Test solutions ("ATS") | 306,270 | 359,379 | 332,897 | |||||||||
| Net sales | $ | 673,015 | $ | 729,414 | $ | 655,048 | ||||||
| Segment adjusted operating income | ||||||||||||
| - AMS | $ | 97,214 | $ | 103,210 | $ | 89,104 | ||||||
| - ATS | 16,974 | 65,652 | 67,621 | |||||||||
| - General corporate expense | (13,059 | ) | (12,322 | ) | (9,841 | ) | ||||||
| Adjusted operating income | 101,129 | 156,540 | 146,884 | |||||||||
| Amortization of acquired intangibles | ||||||||||||
| - AMS | (36,062 | ) | (36,913 | ) | (35,032 | ) | ||||||
| - ATS | (26,634 | ) | (26,759 | ) | (26,883 | ) | ||||||
| Share-based compensation | ||||||||||||
| - Corporate | (3,098 | ) | (2,254 | ) | (2,076 | ) | ||||||
| - AMS | (256 | ) | - | - | ||||||||
| - ATS | (173 | ) | - | - | ||||||||
| Restructuring charges | ||||||||||||
| - AMS | (1,426 | ) | (8,034 | ) | (172 | ) | ||||||
| - ATS | (5,353 | ) | (6,749 | ) | (213 | ) | ||||||
| Business acquisition costs - Corporate | (14 | ) | (282 | ) | (921 | ) | ||||||
| Change in fair value of acquisition contingent consideration liability - Corporate | 7,553 | (1,834 | ) | - | ||||||||
| Merger related expenses - Corporate | - | (1,222 | ) | (2,858 | ) | |||||||
| Termination of Sponsor Advisory Agreement - Corporate | - | (18,133 | ) | - | ||||||||
| Impairment of goodwill and other long-lived assets - AMS | (56,700 | ) | - | - | ||||||||
| Loss on liquidation of foreign subsidiary - ATS | - | - | (7,696 | ) | ||||||||
| Current period impact of acquisition related adjustments | ||||||||||||
| - AMS | (151 | ) | (768 | ) | (1,246 | ) | ||||||
| - ATS | 89 | (657 | ) | (1,593 | ) | |||||||
| - Corporate | (220 | ) | (220 | ) | (220 | ) | ||||||
| Operating income (loss) (GAAP) | (21,316 | ) | 52,715 | 67,974 | ||||||||
| Interest expense | (34,237 | ) | (66,204 | ) | (83,948 | ) | ||||||
| Loss on extinguishment of debt and write-off of deferred financing costs | (1,232 | ) | (59,395 | ) | - | |||||||
| Gain from a bargain purchase of a business | - | 173 | 3,993 | |||||||||
| Other income (expense), net | (1,745 | ) | (775 | ) | 532 | |||||||
| Income (loss) before income taxes | $ | (58,530 | ) | $ | (73,486 | ) | $ | (11,449 | ) | |||
| - 109 - |
Management evaluates the operating results of our two segments based upon adjusted operating income, which is pre-tax operating income before certain non-cash, non-recurring and other items, We have set out above our adjusted operating income by segment and in the aggregate, and have provided a reconciliation of adjusted operating income to operating income (loss) on a GAAP basis and income (loss) before income taxes for the periods presented.
| As of June 30, | ||||||||
| 2012 | 2011 | |||||||
| (In thousands) | ||||||||
| Total Assets | ||||||||
| - AMS | $ | 600,885 | $ | 693,151 | ||||
| - ATS | 523,442 | 606,695 | ||||||
| - Corporate | 65,481 | 96,080 | ||||||
| Total assets: | $ | 1,189,808 | $ | 1,395,926 | ||||
| Year Ended June 30, | ||||||||||||
| 2012 | 2011 | 2010 | ||||||||||
| (In thousands) | ||||||||||||
| Capital expenditures: | ||||||||||||
| - AMS | $ | 12,719 | $ | 13,181 | $ | 11,048 | ||||||
| - ATS | 8,843 | 12,241 | 9,500 | |||||||||
| - Corporate | 211 | 535 | 467 | |||||||||
| Total capital expenditures | $ | 21,773 | $ | 25,957 | $ | 21,015 | ||||||
| Depreciation and amortization expense: | ||||||||||||
| - AMS | $ | 46,149 | $ | 46,175 | $ | 44,024 | ||||||
| - ATS | 37,241 | 36,513 | 37,977 | |||||||||
| - Corporate | 908 | 771 | 695 | |||||||||
| Total depreciation and amortization expense | $ | 84,298 | $ | 83,459 | $ | 82,696 | ||||||
| - 110 - |
| 22. | Quarterly Financial Data (Unaudited): |
(In thousands, except per share data)
| Quarter | Year Ended | |||||||||||||||||||
| FY 2012 | First | Second | Third | Fourth | June 30, | |||||||||||||||
| Net sales | $ | 154,884 | $ | 171,138 | $ | 162,262 | $ | 184,731 | $ | 673,015 | ||||||||||
| Gross profit | 78,519 | 85,691 | 79,173 | 95,503 | 338,886 | |||||||||||||||
| Net income (loss) | (5,042 | ) | (535 | ) | (65,261 | ) | 17,201 | (53,637 | ) | |||||||||||
| Net income (loss) per common share: | ||||||||||||||||||||
| Basic | $ | (0.06 | ) | $ | (0.01 | ) | $ | (0.77 | ) | $ | 0.20 | $ | (0.63 | ) | ||||||
| Diluted | $ | (0.06 | ) | $ | (0.01 | ) | $ | (0.77 | ) | $ | 0.20 | $ | (0.63 | ) | ||||||
| Quarter | Year Ended | |||||||||||||||||||
| FY 2011 | First | Second | Third | Fourth | June 30, | |||||||||||||||
| Net sales | $ | 155,931 | $ | 181,579 | $ | 193,219 | $ | 198,685 | $ | 729,414 | ||||||||||
| Gross profit | 79,826 | 94,840 | 106,358 | 111,076 | 392,100 | |||||||||||||||
| Net income (loss) | (5,817 | ) | (11,403 | ) | 4,127 | (21,575 | ) | (34,668 | ) | |||||||||||
| Net income (loss) per common share: | ||||||||||||||||||||
| Basic | $ | (0.09 | ) | $ | (0.15 | ) | $ | 0.05 | $ | (0.25 | ) | $ | (0.45 | ) | ||||||
| Diluted | $ | (0.09 | ) | $ | (0.15 | ) | $ | 0.05 | $ | (0.25 | ) | $ | (0.45 | ) | ||||||
Note: Since per share information is computed independently for each quarter and the full year based on the respective average number of common shares outstanding, the sum of the quarterly per share amounts does not necessarily equal the per share amounts for each year. All share and per share amounts have been retroactively adjusted to give effect to a 65,000,000-for-1 common stock split which was effective in November 2010.
| - 111 - |
| ITEM 9. | CHANGES IN AND DISAGREEMENTS WITH ACCOUNTANTS ON ACCOUNTING AND FINANCIAL DISCLOSURE |
None.
| ITEM 9A. | CONTROLS AND PROCEDURES |
Management’s Report on Internal Control Over Financial Reporting
Our disclosure controls and procedures under the Securities Exchange Act of 1934, as amended, are designed to ensure that information required to be disclosed in the reports that we file or submit under the Securities Exchange Act of 1934, as amended, is recorded, processed, summarized and reported, within the time periods specified in the rules and forms of the Securities and Exchange Commission. The Principal Executive Officer and the Principal Financial Officer, with the assistance from other members of management, have reviewed the effectiveness of our disclosure controls and procedures as of June 30, 2012 and, based on their evaluation, have concluded that the disclosure controls and procedures were effective as of such date.
There have been no changes in our internal controls over financial reporting that occurred during the quarter ended June 30, 2012 that has materially affected, or is reasonably likely to materially affect, our internal control over financial reporting.
Our management is responsible for establishing and maintaining adequate internal control over financial reporting under the Securities Exchange Act of 1934, as amended. Our system of internal control over financial reporting is designed to provide reasonable assurance to our management and board of directors regarding the preparation and fair presentation of the consolidated financial statements for external purposes in accordance with generally accepted accounting principles.
Our management, under the supervision of the Chief Executive Officer and the Chief Financial Officer, assessed the effectiveness of our internal control over financial reporting as of June 30, 2012. In making this assessment, we used the framework included in Internal Control – Integrated Framework issued by the Committee of Sponsoring Organizations of the Treadway Commission. Based on our evaluation under the criteria set forth in Internal Control – Integrated Framework, management concluded that our internal control over financial reporting was effective as of June 30, 2012.
Because of inherent limitations, internal control over financial reporting may not prevent or detect misstatements. Projections of any evaluation of effectiveness to future periods are subject to the risks that controls may become inadequate because of changes in conditions or that the degree of compliance with the policies or procedures may deteriorate.
The report of our independent registered public accounting firm on our internal control over financial reporting as of June 30, 2012 appears in this Annual Report on Form 10-K on page 73.
| ITEM 9B. | OTHER INFORMATION |
None.
PART III
The information required by items 10, 11, 12, 13 and 14 of Part III is incorporated by reference to our definitive proxy statement in connection with our Annual Meeting of Stockholders scheduled to be held on November 14, 2012. The proxy statement is to be filed with the Securities and Exchange Commission within 120 days following the end of our fiscal year ended June 30, 2012.
| - 112 - |
PART IV
| ITEM 15. | EXHIBITS AND FINANCIAL STATEMENT SCHEDULES |
(a) The following documents are filed as part of this report:
| 1. | Financial Statements. | |
| Reports of Independent Registered Public Accounting Firm | 73 | |
| Consolidated financial statements: | ||
| Balance sheets – June 30, 2012 and 2011 | 75 | |
| Statements of operations – Fiscal years ended June 30, 2012, 2011 and 2010 | 76 | |
| Statements of stockholders’ equity – Fiscal years ended June 30, 2012, 2011 and 2010 | 77 | |
| Statements of comprehensive income (loss) – Fiscal years ended June 30, 2012, 2011 and 2010 | 78 | |
| Statements of cash flows – Fiscal years ended June 30, 2012, 2011 and 2010 | 79 | |
| Notes to the consolidated financial statements | 80 - 111 | |
| 2. | Financial Statement Schedule. | |
| Schedule II – Valuation and Qualifying Account | 114 | |
| 3. | Exhibits. | |
| See Index of Exhibits included on page 115. | ||
| - 113 - |
AEROFLEX HOLDING CORP.
AND SUBSIDIARIES
SCHEDULE II – VALUATION AND QUALIFYING ACCOUNTS
(In thousands)
| Column A | Column B | Column C | Column D | Column E | ||||||||||||||||
| Additions | ||||||||||||||||||||
| Charged | ||||||||||||||||||||
| Balance at | Charged to | to other | Balance at | |||||||||||||||||
| beginning of | costs and | accounts - | Deductions - | end of | ||||||||||||||||
| Description | period | expenses | describe | describe | period | |||||||||||||||
| YEAR ENDED JUNE 30, 2012: | ||||||||||||||||||||
| Allowance for doubtful accounts | $ | 1,210 | $ | 772 | $ | - | $ | 1,001 | (B) | $ | 981 | |||||||||
| YEAR ENDED JUNE 30, 2011: | ||||||||||||||||||||
| Allowance for doubtful accounts | $ | 1,821 | $ | 118 | $ | 140 | (A) | $ | 869 | (B) | $ | 1,210 | ||||||||
| YEAR ENDED JUNE 30, 2010: | ||||||||||||||||||||
| Allowance for doubtful accounts | $ | 2,250 | $ | 678 | $ | 337 | (A) | $ | 1,444 | (B) | $ | 1,821 | ||||||||
| Note: | (A) Acquired in purchase of businesses. |
| (B) Net write-offs of uncollectible amounts and impact of foreign currency translation. |
| - 114 - |
Exhibit |
Exhibit Description | |
| 2.1 | Agreement and Plan of Merger, dated as of May 25, 2007, among Aeroflex Incorporated, Aeroflex Holding Corp. and AX Acquisition Corp. (incorporated by reference to Exhibit 2.1 to Aeroflex Incorporated’s Current Report on Form 8-K filed May 29, 2007). | |
| 3.1 | Amended and Restated Certificate of Incorporation of Aeroflex Holding Corp. (incorporated by reference to Exhibit 3.1 to Amendment No. 6 to the Registrant’s Form S-1 (Reg. No. 333-165920) filed with the SEC on November 10, 2010). | |
| 3.2 | Amended and Restated Bylaws of Aeroflex Holding Corp. (incorporated by reference to Exhibit 3.2 to Amendment No. 6 to the Registrant’s Form S-1 (Reg. No. 333-165920) filed with the SEC on November 10, 2010). | |
| 4.1 | Registration Rights Agreement, dated as of August 15, 2007, by and among Aeroflex Holding Corp., VGG Holding LLC and the other parties thereto (incorporated by reference to Exhibit 4.6 to Amendment No. 2 to the Registrant’s Form S-1 (Reg. No. 333-165920) filed with the SEC on June 10, 2010). | |
| 4.2 | Specimen of Common Stock certificate (incorporated by reference to Exhibit 4.7 to Amendment No. 5 to the Registrant’s Form S-1 (Reg. No. 333-165920) filed with the SEC on November 5, 2010). | |
| 10.1 | Executive Employment Agreement between Aeroflex Incorporated and John Adamovich, Jr., dated November 9, 2005 (incorporated by reference to Exhibit 10.1 to Aeroflex Incorporated’s Current Report on Form 8-K filed on November 15, 2005). | |
| 10.2 | Employment Agreement between Aeroflex Incorporated and Charles Badlato, dated November 6, 2003 (incorporated by reference to Exhibit 10.1 to Aeroflex Incorporated’s Quarterly Report on Form 10-Q for the quarter ended December 31, 2003). | |
| 10.3 | Employment Agreement between Aeroflex Incorporated and Carl Caruso, dated November 6, 2003 (incorporated by reference to Exhibit 10.2 to Aeroflex Incorporated’s Quarterly Report on Form 10-Q for the quarter ended December 31, 2003). | |
| 10.4 | Amendment No. 1 to Employment Agreement between Aeroflex Incorporated and Carl Caruso, dated March 11, 2005 (incorporated by reference to Exhibit 10.1 to Aeroflex Incorporated’s Current Report on Form 8-K filed March 11, 2005). | |
| 10.5 | Amendment No. 1 to Employment Agreement between Aeroflex Incorporated and John Adamovich, Jr., effective November 21, 2006 (incorporated by reference to Exhibit 10.4 to Aeroflex Incorporated’s Current Report on Form 8-K filed November 22, 2006). | |
| 10.6 | Amendment No. 2 to Employment Agreement between Aeroflex Incorporated and John Adamovich, Jr., effective December 1, 2006 (incorporated by reference to Exhibit 10.1 to Aeroflex Incorporated’s Current Report on Form 8-K filed February 2, 2007). | |
| 10.7 | Employment Agreement between Aeroflex Incorporated and Leonard Borow, dated August 15, 2007 (incorporated by reference to Exhibit 10.15 to Aeroflex Incorporated’s Registration Statement on Form S-4 (Reg. No. 333-156061) filed with the SEC on December 11, 2008). | |
| 10.8 | Employment Agreement between Aeroflex Incorporated and John E. Buyko, dated August 15, 2007 (incorporated by reference to Exhibit 10.16 to Aeroflex Incorporated’s Registration Statement on Form S-4 (Reg. No. 333-156061) filed with the SEC on December 11, 2008). | |
| 10.9 | Amendment No. 2 to Employment Agreement between Aeroflex Incorporated and Carl Caruso, effective December 17, 2007 (incorporated by reference to Exhibit 10.23 to Aeroflex Incorporated’s Registration Statement on Form S-4 (Reg. No. 333-156061) filed with the SEC on December 11, 2008). | |
| 10.10 | Amendment No. 1 to Employment Agreement between Aeroflex Incorporated and Charles Badlato, effective July 31, 2008 (incorporated by reference to Exhibit 10.26 to Aeroflex Incorporated’s Registration Statement on Form S-4 (Reg. No. 333-156061) filed with the SEC on December 11, 2008). |
| - 115 - |
| 10.11 | Amendment No. 3 to Employment Agreement between Aeroflex Incorporated and Carl Caruso, effective December 24, 2008 (incorporated by reference to Exhibit 10.27 to Amendment No. 1 to Aeroflex Incorporated’s Registration Statement on Form S-4 (Reg. No. 333-156061) filed with the SEC on January 16, 2009). | |
| 10.12 | Amendment No. 1 to Employment Agreement between Aeroflex Incorporated and Leonard Borow, effective December 31, 2008 (incorporated by reference to Exhibit 10.28 to Amendment No. 1 to Aeroflex Incorporated’s Registration Statement on Form S-4 (Reg. No. 333-156061) filed with the SEC on January 16, 2009). | |
| 10.13 | Amendment No. 1 to Employment Agreement between Aeroflex Incorporated and John Buyko, effective December 31, 2008 (incorporated by reference to Exhibit 10.29 to Amendment No. 1 to Aeroflex Incorporated’s Registration Statement on Form S-4 (Reg. No. 333-156061) filed with the SEC on January 16, 2009). | |
| 10.14 | Amendment No. 3 to Employment Agreement between Aeroflex Incorporated and John Adamovich, Jr., effective December 31, 2008 (incorporated by reference to Exhibit 10.30 to Amendment No. 1 to Aeroflex Incorporated’s Registration Statement on Form S-4 (Reg. No. 333-156061) filed with the SEC on January 16, 2009). | |
| 10.15 | Amendment No. 2 to Employment Agreement between Aeroflex Incorporated and Charles Badlato, effective December 31, 2008 (incorporated by reference to Exhibit 10.31 to Amendment No. 1 to Aeroflex Incorporated’s Registration Statement on Form S-4 (Reg. No. 333-156061) filed with the SEC on January 16, 2009). | |
| 10.16 | Amendment No. 4 to Employment Agreement between Aeroflex Incorporated and Carl Caruso, effective December 31, 2008 (incorporated by reference to Exhibit 10.32 to Amendment No. 1 to Aeroflex Incorporated’s Registration Statement on Form S-4 (Reg. No. 333-156061) filed with the SEC on January 16, 2009). | |
| 10.17 | Amendment No. 4 to Employment Agreement between Aeroflex Incorporated and John Adamovich, Jr., effective September 17, 2009 (incorporated by reference to Exhibit 10.1 to Aeroflex Incorporated’s Current Report on Form 8-K filed September 21, 2009). | |
| 10.18 | Executive Employment Agreement between Aeroflex Incorporated and Edward S. Wactlar, dated July 1, 2010 (incorporated by reference to Exhibit 10.26 to Aeroflex Incorporated’s Annual Report on Form 10-K filed September 2, 2010). | |
| 10.19 | Form of Indemnification Agreement (incorporated by reference to Exhibit 10.25 to Amendment No. 6 to the Registrant’s Form S-1 (Reg. No. 333-165920) filed with the SEC on November 10, 2010). | |
| 10.20 | Amended and Restated Limited Liability Company Operating Agreement of VGG Holding LLC (incorporated by reference to Exhibit 10.26 to Amendment No. 5 to the Registrant’s Form S-1 (Reg. No. 333-165920) filed with the SEC on November 5, 2010). | |
| 10.21 | Amendment No. 1, dated September 13, 2007, to Amended and Restated Limited Liability Company Operating Agreement of VGG Holding LLC (incorporated by reference to Exhibit 10.27 to Amendment No. 5 to the Registrant’s Form S-1 (Reg. No. 333-165920) filed with the SEC on November 5, 2010). | |
| 10.22 | Amendment No. 2, dated September 21, 2007, to Amended and Restated Limited Liability Company Operating Agreement of VGG Holding LLC (incorporated by reference to Exhibit 10.28 to Amendment No. 5 to the Registrant’s Form S-1 (Reg. No. 333-165920) filed with the SEC on November 5, 2010). | |
| 10.23 | Amendment No. 3, dated October 26, 2007, to Amended and Restated Limited Liability Company Operating Agreement of VGG Holding LLC (incorporated by reference to Exhibit 10.29 to Amendment No. 5 to the Registrant’s Form S-1 (Reg. No. 333-165920) filed with the SEC on November 5, 2010). | |
| 10.24 | Amendment No. 4, dated November 30, 2007, to Amended and Restated Limited Liability Company Operating Agreement of VGG Holding LLC (incorporated by reference to Exhibit 10.30 to Amendment No. 5 to the Registrant’s Form S-1 (Reg. No. 333-165920) filed with the SEC on November 5, 2010). |
| - 116 - |
| 10.25 | Amendment No. 5, dated March 4, 2009, to Amended and Restated Limited Liability Company Operating Agreement of VGG Holding LLC (incorporated by reference to Exhibit 10.31 to Amendment No. 5 to the Registrant’s Form S-1 (Reg. No. 333-165920) filed with the SEC on November 5, 2010). | |
| 10.26 | Amendment No. 6, dated September 17, 2009, to Amended and Restated Limited Liability Company Operating Agreement of VGG Holding LLC (incorporated by reference to Exhibit 10.32 to Amendment No. 5 to the Registrant’s Form S-1 (Reg. No. 333-165920) filed with the SEC on November 5, 2010). | |
| 10.27 | Amendment No. 7, dated as of November 24, 2010, to Amended and Restated Limited Liability Company Operating Agreement of VGG Holding LLC. (incorporated by reference to Exhibit 10.33 to Amendment No. 6 to the Registrant’s Form S-1 (Reg. No. 333-165920) filed with the SEC on November 10, 2010). | |
| 10.28 | Amendment No. 5, dated as of November 24, 2010, to Employment Agreement between Aeroflex Incorporated and John Adamovich, Jr. (incorporated by reference to Exhibit 10.34 to Amendment No. 6 to the Registrant’s Form S-1 (Reg. No. 333-165920) filed with the SEC on November 10, 2010). | |
| 10.29 | Amendment No. 3, dated as of November 24, 2010, to Employment Agreement between Aeroflex Incorporated and Charles Badlato (incorporated by reference to Exhibit 10.35 to Amendment No. 6 to the Registrant’s Form S-1 (Reg. No. 333-165920) filed with the SEC on November 10, 2010). | |
| 10.30 | Amendment No. 2, dated as of November 24, 2010, to Employment Agreement between Aeroflex Incorporated and Leonard Borow (incorporated by reference to Exhibit 10.36 to Amendment No. 6 to the Registrant’s Form S-1 (Reg. No. 333-165920) filed with the SEC on November 10, 2010). | |
| 10.31 | Amendment No. 2, dated as of November 24, 2010, to Employment Agreement between Aeroflex Incorporated and John Buyko (incorporated by reference to Exhibit 10.37 to Amendment No. 6 to the Registrant’s Form S-1 (Reg. No. 333-165920) filed with the SEC on November 10, 2010). | |
| 10.32 | Amendment No. 5, dated as of November 24, 2010, to Employment Agreement between Aeroflex Incorporated and Carl Caruso (incorporated by reference to Exhibit 10.38 to Amendment No. 6 to the Registrant’s Form S-1 (Reg. No. 333-165920) filed with the SEC on November 10, 2010). | |
| 10.33 | Termination Agreement, dated as of November 24, 2010, by and among VGG Holding LLC, Aeroflex Holding Corp., Aeroflex Incorporated, Veritas Capital Fund Management, L.L.C., GGC Administration, LLC and Goldman, Sachs & Co. (incorporated by reference to Exhibit 10.39 to Amendment No. 6 to the Registrant’s Form S-1 (Reg. No. 333-165920) filed with the SEC on November 10, 2010). | |
| 10.34 | Dealer Managers Agreement, dated as of November 5, 2010, by and among Aeroflex Incorporated, Goldman, Sachs & Co. and Credit Suisse (USA) LLC (incorporated by reference to Exhibit 10.40 to Amendment No. 6 to the Registrant’s Form S-1 (Reg. No. 333-165920) filed with the SEC on November 10, 2010). | |
| 10.35 | Form of Director Designation Agreement between Aeroflex Holding and VGG Holding LLC (incorporated by reference to Exhibit 10.41 to Amendment No. 6 to the Registrant’s Form S-1 (Reg. No. 333-165920) filed with the SEC on November 10, 2010). | |
| 10.36 | First Amendment to Credit and Guaranty Agreement, dated as of November 4, 2010, by and among Aeroflex Incorporated, Aeroflex Holding Corp., Goldman Sachs Credit Partners L.P., and the guarantors listed on the signature papers thereto (incorporated by reference to Exhibit 10.42 to Amendment No. 6 to the Registrant’s Form S-1 (Reg. No. 333-165920) filed with the SEC on November 10, 2010). | |
| 10.37 | First Amendment to Senior Subordinated Unsecured Credit and Guaranty Agreement, dated as of November 4, 2010, by and among Aeroflex Incorporated, certain Subsidiaries of Aeroflex Incorporated, and each of the lenders party thereto (incorporated by reference to Exhibit 10.43 to Amendment No. 6 to the Registrant’s Form S-1 (Reg. No. 333-165920) filed with the SEC on November 10, 2010). | |
| 10.38 | Credit and Guaranty Agreement, dated as of May 9, 2011, among Aeroflex Incorporated, Aeroflex Holding Corp., the Guarantor Subsidiaries, the lenders party thereto and JPMorgan Chase Bank, N.A. (incorporated by reference to Exhibit 10.1 to Registrant’s Quarterly Report on Form 10-Q for the quarter ended March 31, 2011). |
| - 117 - |
| 10.39 | Pledge and Security Agreement, dated as of May 9, 2011, by the Grantors Party thereto in favor of JPMorgan Chase Bank, N.A., as collateral agent (incorporated by reference to Exhibit 10.2 to Registrant’s Quarterly Report on Form 10-Q for the quarter ended March 31, 2011). | |
| 10.40 | Amendment No. 1, dated as of May 24, 2012, to Credit and Guaranty Agreement among Aeroflex Incorporated, Aeroflex Holding Corp., the Guarantor Subsidiaries, the lenders party thereto and JPMorgan Chase Bank, N.A. (incorporated by reference to Exhibit 10.1 to Registrant’s Current Report on Form 8-K filed May 25, 2012). | |
| 14.1* | Code of Ethics for Chief Executive Officer and Senior Financial Officers of Aeroflex Holding Corp. | |
| 21* | Subsidiaries of Aeroflex Holding Corp. | |
| 23.1* | Consent of KPMG LLP | |
| 31.1* | Certification pursuant to Rules 13a-14(a)/15d-14a as adopted pursuant to Section 302 of the Sarbanes-Oxley Act of 2002. | |
| 31.2* | Certification pursuant to Rules 13a-14(a)/15d-14a as adopted pursuant to Section 302 of the Sarbanes-Oxley Act of 2002. | |
| 31.3* | Certification pursuant to Rules 13a-14(a)/15d-14a as adopted pursuant to Section 302 of the Sarbanes-Oxley Act of 2002. | |
| 32.1* | Certification pursuant to 18 U.S.C. Section 1350 as adopted pursuant to Section 906 of the Sarbanes-Oxley Act of 2002. | |
| 32.2* | Certification pursuant to 18 U.S.C. Section 1350 as adopted pursuant to Section 906 of the Sarbanes-Oxley Act of 2002. | |
| 101.INS** | XBRL Instance Document | |
| 101.SCH** | XBRL Taxonomy Extension Schema Document | |
| 101.CAL** | XBRL Taxonomy Extension Calculation Linkbase Document | |
| 101.LAB** | XBRL Taxonomy Extension Label Linkbase Document | |
| 101.PRE** | XBRL Taxonomy Extension Presentation Linkbase Document | |
| 101.DEF** | XBRL Taxonomy Extension Definition Linkbase Document |
| * | Filed herewith |
| ** | To be filed by amendment |
| - 118 - |
Pursuant to the requirements of Section 13 or 15(d) of the Securities Exchange Act of 1934, the Registrant has duly caused this report to be signed on its behalf by the undersigned, thereunto duly authorized on the 29th day of August 2012.
| AEROFLEX HOLDING CORP. | ||
| By: | /s/ Leonard Borow | |
| Name: | Leonard Borow | |
| Title: | President and Chief Executive Officer |
Pursuant to the requirements of the Securities Exchange Act of 1934, this report has been signed below on August 29, 2012 by the following persons on behalf of Aeroflex Holding Corp. and in the capacities indicated.
| /s/ Robert B. McKeon | Chairman of the Board | |
| Robert B. McKeon | ||
| /s/ Leonard Borow | President and Chief Executive Officer, Director | |
| Leonard Borow | (Principal Executive Officer) | |
| /s/ John Adamovich, Jr. | Senior Vice President and Chief Financial Officer | |
| John Adamovich, Jr. | (Principal Financial Officer) | |
| /s/ Charles Badlato | Vice President-Treasurer | |
| Charles Badlato | (Principal Accounting Officer) | |
| /s/ John Buyko | Executive Vice President | |
| John Buyko | President – Aeroflex Microelectronic Solutions, Director | |
| /s/ Prescott H. Ashe | Director | |
| Prescott H. Ashe | ||
| /s/ Joe Benavides | Director | |
| Joe Benavides | ||
| /s/ Hugh D. Evans | Director | |
| Hugh D. Evans | ||
| /s/ Bradley J. Gross | Director | |
| Bradley J. Gross | ||
| /s/ John D. Knoll | Director | |
| John D. Knoll | ||
| /s/ Ramzi M. Musallam | Director | |
| Ramzi M. Musallam | ||
| /s/ Richard N. Nottenburg | Director | |
| Richard N. Nottenburg | ||
| /s/ Charles S. Ream | Director | |
| Charles S. Ream | ||
| /s/ Mark H. Ronald | Director | |
| Mark H. Ronald | ||
| /s/ Peter J. Schoomaker | Director | |
| Peter J. Schoomaker |
| - 119 - |