Attached files
| file | filename |
|---|---|
| EX-32.1 - CERTIFICATION - AEHR TEST SYSTEMS | aehr_ex321.htm |
| EX-23.1 - CONSENT - AEHR TEST SYSTEMS | aehr_ex231.htm |
| EX-31.1 - CERTIFICATION - AEHR TEST SYSTEMS | aehr_ex311.htm |
| EX-31.2 - CERTIFICATION - AEHR TEST SYSTEMS | aehr_ex312.htm |
| EXCEL - IDEA: XBRL DOCUMENT - AEHR TEST SYSTEMS | Financial_Report.xls |
UNITED STATES
SECURITIES AND EXCHANGE COMMISSION
Washington, D. C. 20549
FORM 10-K
(Mark One)
þ Annual report pursuant to Section 13 or 15(d) of the Securities Exchange Act of 1934
For the fiscal year ended May 31, 2012
or
o Transition report pursuant to Section 13 or 15(d) of the Securities Exchange Act of 1934
For the transition period from ________________ to ________________
Commission file number: 000-22893.
AEHR TEST SYSTEMS
(Exact name of registrant as specified in its charter)
| CALIFORNIA | 94-2424084 | |
| (State or other jurisdiction of incorporation or organization) | (IRS Employer Identification Number) | |
| 400 KATO TERRACE, FREMONT, CA | 94539 | |
| (Address of principal executive offices) | (Zip Code) |
Registrant’s telephone number, including area code: (510) 623-9400
Securities registered pursuant to Section 12(b) of the Act:
Common stock, $0.01 par value
Name of each exchange on which registered: The NASDAQ Stock Market LLC
Securities registered pursuant to Section 12(g) of the Act: None
Indicate by check mark if the registrant is a well-known seasoned issuer, as defined in Rule 405 of the Securities Act. Yes o No þ
Indicate by check mark if the registrant is not required to file reports pursuant to Section 13 or Section 15(d) of the Securities Act. Yes o No þ
Indicate by check mark whether the registrant (1) has filed all reports required to be filed by Section 13 or 15(d) of the Securities Exchange Act of 1934 during the preceding 12 months (or for such shorter period that the registrant was required to file such reports), and (2) has been subject to such filing requirements for the past 90 days.
Yes þ No o
Indicate by check mark whether the registrant has submitted electronically and posted on its corporate Web site, if any, every Interactive Data File required to be submitted and posted pursuant to Rule 405 of Regulation S-T (§232.405 of this chapter) during the preceding 12 months (or for such shorter period that the registrant was required to submit and post such files).
Yes þ No o
Indicate by check mark if disclosure of delinquent filers pursuant to Item 405 of Regulation S-K (§229.405 of this chapter) is not contained herein, and will not be contained to the best of the registrant’s knowledge, in definitive proxy or information statements incorporated by reference in Part III of this Form 10-K or any amendment to this Form 10-K. o
Indicate by check mark whether the registrant is a large accelerated filer, an accelerated filer, a non-accelerated filer, or a smaller reporting company. See the definitions of “large accelerated filer,” “accelerated filer” and “smaller reporting company” in Rule 12b-2 of the Exchange Act (Check one):
| Large accelerated filer | o |
Accelerated filer
|
o |
| Non-accelerated filer | o |
Smaller reporting company
|
þ |
|
(Do not check if a smaller reporting company)
|
|||
Indicate by check mark whether the registrant is a shell company (as defined in Rule 12b-2 of the Exchange Act). Yes o No þ
The aggregate market value of the registrant’s common stock, par value $0.01 per share, held by non-affiliates of the registrant, based upon the closing price of $0.69 on November 30, 2011, as reported on the NASDAQ Capital Market, was $5,165,358. For purposes of this disclosure, shares of common stock held by persons who hold more than 5% of the outstanding shares of common stock (other than such persons of whom the Registrant became aware only through the filing of a Schedule 13G filed with the Securities and Exchange Commission) and shares held by officers and directors of the Registrant have been excluded because such persons may be deemed to be affiliates. This determination of affiliate status is not necessarily conclusive for other purposes.
The number of shares of registrant’s common stock, par value $0.01 per share, outstanding at July 31, 2012 was 9,178,018.
Documents Incorporated By Reference
Certain information required by Part III of this report on Form 10-K is incorporated by reference from the Registrant’s proxy statement for the Annual Meeting of Shareholders to be held on October 24, 2012 (the “Proxy Statement”), which will be filed with the Securities and Exchange Commission within 120 days after the close of the registrant’s fiscal year ended May 31, 2012.
2
AEHR TEST SYSTEMS
FORM 10-K
FISCAL YEAR ENDED MAY 31, 2012
TABLE OF CONTENTS
| PART I | |||||
| Item 1. |
Business
|
4 | |||
| Item 1A. |
Risk Factors
|
9 | |||
| Item 1B. |
Unresolved Staff Comments
|
15 | |||
| Item 2. |
Properties
|
15 | |||
| Item 3. |
Legal Proceedings
|
15 | |||
| Item 4. |
Mine Safety Disclosures
|
15 | |||
|
PART II
|
|||||
| Item 5. |
Market for Registrant’s Common Equity, Related Stockholder Matters and Issuer Purchases of Equity Securities
|
16 | |||
| Item 6. |
Selected Consolidated Financial Data
|
18 | |||
| Item 7. |
Management’s Discussion and Analysis of Financial Condition and Results of Operations
|
19 | |||
| Item 7A. |
Quantitative and Qualitative Disclosures about Market Risk
|
27 | |||
| Item 8. |
Financial Statements and Supplementary Data
|
28 | |||
| Item 9. |
Changes in and Disagreements with Accountants on Accounting and Financial Disclosure
|
51 | |||
| Item 9A. |
Controls and Procedures
|
52 | |||
| Item 9B. |
Other Information
|
52 | |||
|
PART III
|
|||||
| Item 10. |
Directors, Executive Officers and Corporate Governance
|
53 | |||
| Item 11. |
Executive Compensation
|
53 | |||
| Item 12. |
Security Ownership of Certain Beneficial Owners and Management and Related Stockholder Matters
|
53 | |||
| Item 13. |
Certain Relationships and Related Transactions
|
53 | |||
| Item 14. |
Principal Accountant Fees and Services
|
53 | |||
|
PART IV
|
|||||
| Item 15. |
Exhibits, Financial Statement Schedules
|
54 | |||
| Signatures | 58 |
3
This Annual Report on Form 10-K contains forward-looking statements within the meaning of the Private Securities Litigation Act of 1995 which involve risks and uncertainties. Unless the context requires otherwise, references in this Form 10-K to “Aehr Test,” the “Company,” “we,” “us” and “our” refer to Aehr Test Systems. The Company’s actual results may differ materially from the results discussed in the forward-looking statements due to a number of factors, including those described herein and the documents incorporated herein by reference, and those factors described in Part I, Item 1A under “Risk Factors.” These statements typically may be identified by the use of forward-looking words or phrases such as “believe,” “expect,” “intend,” “anticipate,” “should,” “planned,” “estimated” and “potential,” among others. All forward-looking statements included in this document are based on our current expectations, and we assume no obligation to update any of these forward-looking statements. We note that a variety of factors could cause actual results and experience to differ materially from the anticipated results or other expectations expressed in these forward-looking statements, including the risks and uncertainties that may affect the operations, performance, development and results of our businesses. These risks include but are not limited to those factors identified in “Risk Factors” beginning on page 9 of this Annual Report on Form 10-K, those factors that we may from time to time identify in our periodic filings with the Securities and Exchange Commission, as well as other factors beyond our control.
PART I
Item 1. Business
THE COMPANY
Aehr Test was incorporated in the state of California on May 25, 1977. We develop, manufacture and sell systems which are designed to reduce the cost of testing and to perform reliability screening, or burn-in, of complex logic and memory devices. These systems can be used to simultaneously perform parallel testing and burn-in of packaged integrated circuits, or ICs, singulated bare die or ICs still in wafer form. Increased quality and reliability needs of the Automotive and Mobility integrated circuit markets are driving additional testing requirements, capacity needs and opportunities for Aehr Test products in package and wafer level testing. Leveraging its expertise as a long-time leading provider of burn-in equipment, with over 2,500 systems installed worldwide, the Company has developed and introduced several innovative product families, including the ABTSTM and FOXTM systems, the WaferPakTM cartridge and the DiePak® carrier. The latest ABTS family of systems can perform test during burn-in of complex devices, such as digital signal processors, microprocessors, microcontrollers and systems-on-a-chip, and offers Individual Temperature Control for high-power advanced logic devices. The FOX systems are full wafer contact parallel test and burn-in systems designed to make contact with all pads of a wafer simultaneously, thus enabling full wafer parallel test and burn-in. The WaferPak cartridge includes a full-wafer probe card for use in testing wafers in FOX systems. The DiePak carrier is a reusable, temporary package that enables IC manufacturers to perform cost-effective final test and burn-in of bare die.
INDUSTRY BACKGROUND
Semiconductor manufacturing is a complex, multi-step process, and defects or weaknesses that may result in the failure of an integrated circuit may be introduced at any process step. Failures may occur immediately or at any time during the operating life of an IC, sometimes after several months of normal use. Semiconductor manufacturers rely on testing and reliability screening to identify and eliminate defects that occur during the manufacturing process.
Testing and reliability screening involve multiple steps. The first set of tests is typically performed by IC manufacturers before the processed semiconductor wafer is cut into individual die, in order to avoid the cost of packaging defective die into their packages. This “wafer probe” testing can be performed on one or many die at a time, including testing the entire wafer at once. After the die are packaged and before they undergo reliability screening, a short test is typically performed to detect packaging defects. Most leading-edge microprocessors, microcontrollers, digital signal processors, and memory ICs then undergo an extensive reliability screening and stress testing procedure known as “burn-in.” The burn-in process screens for early failures by operating the IC at elevated voltages and temperatures, up to 150 degrees Celsius (302 degrees Fahrenheit), for periods typically ranging from 2 to 48 hours. A typical burn-in system can process thousands of ICs simultaneously. After burn-in, the ICs undergo a final test process using automatic test equipment, or testers.
PRODUCTS
The Company manufactures and markets full wafer contact test systems, test during burn-in systems, test fixtures, die carriers and related accessories.
4
All of the Company’s systems are modular, allowing them to be configured with optional features to meet customer requirements. Systems can be configured for use in production applications, where capacity, throughput and price are most important, or for reliability engineering and quality assurance applications, where performance and flexibility, such as extended temperature ranges, are essential.
FULL WAFER CONTACT SYSTEMS
The FOX-1 full wafer parallel test system, introduced in June 2005, is designed for massively parallel test in wafer sort. The FOX-1 system is designed to make electrical contact to and test all of the die on a wafer in a single touchdown. The FOX-1 test head and WaferPak contactor are compatible with industry-standard 300 mm wafer probers which provide the wafer handling and alignment automation for the FOX-1 system. The FOX-1 pattern generator is designed to functionally test industry-standard memory such as flash and DRAMs, plus it is optimized to test memory or logic ICs that incorporate design for testability, or DFT, and built-in self-test, or BIST. The FOX-1 pin electronics and per-device power supplies are tailored to full-wafer functional test. The Company believes that the FOX-1 system can significantly reduce the cost of testing IC wafers.
The FOX-15 full wafer contact test and burn-in system, introduced in October 2007, is designed for use with wafers that require test and burn-in times typically measured in hours. The FOX-15 is focused on parallel testing and burning-in up to 15 wafers at a time. For high reliability applications, such as automotive, the FOX-15 system is a cost-effective solution for producing tested and burned-in die for use in multi-chip packages. Using Known-Good Die, or KGD, which are fully burned-in and tested die, in multi-chip packages helps assure the reliability of the final product and lowers costs by increasing the yield of high-cost multi-chip packages. Wafer-level burn-in and test enables lower cost production of KGD for multi-chip modules, 3-D stacked packages and systems-in-a-package.
One of the key components of the FOX systems is the patented WaferPak cartridge system. The WaferPak cartridge contains a full-wafer single-touchdown probe card which is easily removable from the system. Traditional probe cards contact only a portion of the wafer, requiring multiple touchdowns to test the entire wafer. The unique design is intended to accommodate a wide range of contactor technologies so that the contactor technology can evolve along with the changing requirements of the customer's wafers.
The full wafer contact systems product category accounted for approximately 53%, 66% and 65% of the Companys net sales in fiscal 2012, 2011 and 2010, respectively.
SYSTEMS FOR PACKAGED PARTS
Test during burn-in, or TDBI, systems consist of several subsystems: pattern generation and test electronics, control software, network interface and environmental chamber. The test pattern generator allows duplication of most of the functional tests performed by a traditional tester. Pin electronics at each burn-in board, or BIB, position are designed to provide accurate signals to the ICs being tested and detect whether a device is failing the test.
Devices being tested are placed on BIBs and loaded into environmental chambers which typically operate at temperatures from 25 degrees Celsius (77 degrees Fahrenheit) up to 150 degrees Celsius (302 degrees Fahrenheit) (optional chambers can produce temperatures as low as -55 degrees Celsius (-67 degrees Fahrenheit)). A single BIB can hold up to several hundred ICs, and a production chamber holds up to 72 BIBs, resulting in thousands of memory or logic devices being tested in a single system.
The Advanced Burn-in and Test System, or ABTS, was introduced in fiscal 2008. The ABTS family of products is based on a completely new hardware and software architecture that is intended to address not only today’s devices, but also future devices for many years to come. The ABTS system can test and burn-in both high-power logic and low-power ICs. It can be configured to provide individual device temperature control for devices up to 50W or more and with up to 320 I/O channels.
The MAX system family, the predecessor to the ABTS family, was designed for monitored burn-in of memory and logic devices. It has 96 channels and holds 64 burn-in boards, each of which may hold up to 350 or more devices, resulting in a system capacity of up to 22,400 or more devices. The output monitor feature allows the MAX system to perform functional tests of devices and it also supports BIST or other scan features. The MAX4 extends the MAX system family to target devices that require higher current, and can provide up to 227 amps of current per BIB position. All systems feature multi-tasking software which includes lot tracking and reporting software that are needed for production and military applications.
5
This packaged part systems product category accounted for approximately 43%, 31% and 35% of the Company’s net sales in fiscal 2012, 2011 and 2010, respectively.
TEST FIXTURES
The Company sells, and licenses others to manufacture and sell, custom-designed test fixtures for its systems. The test fixtures include BIBs for the ABTS parallel test and burn-in system and for the MAX monitored burn-in system. These test fixtures hold the devices undergoing test or burn-in and electrically connect the devices under test to the system electronics. The capacity of each test fixture depends on the type of device being tested or burned-in, ranging from several hundred in memory production to as few as eight for high pin-count complex Application Specific Integrated Circuits, or ASICs, or microprocessor devices. Test fixtures are sold both with new Aehr Test systems and for use with the Company’s installed base of systems.
The Company’s DiePak product line includes a family of reusable, temporary die carriers and associated sockets that enable the test and burn-in of bare die using the same test and burn-in systems used for packaged ICs. DiePak carriers offer cost-effective solutions for providing KGD for most types of ICs, including memory, microcontroller and microprocessor devices. The DiePak carrier was introduced in fiscal 1995. The DiePak carrier consists of an interconnect substrate, which provides an electrical connection between the die pads and the socket contacts, and a mechanical support system. The substrate is customized for each IC product. The DiePak carrier comes in several different versions, designed to handle ICs ranging from 54 pin-count memory up to 320 pin-count microprocessors.
The Company has received patents or applied for patents on certain features of the FOX, ABTS and MAX4 test fixtures. The Company has licensed or authorized several other companies to provide MAX4 BIBs from which the Company receives royalties. Royalties and revenue for the test fixtures product category accounted for less than 5% of net sales in fiscal 2012, 2011 and 2010.
CUSTOMERS
The Company markets and sells its products throughout the world to semiconductor manufacturers, semiconductor contract assemblers, electronics manufacturers and burn-in and test service companies.
Sales to the Company’s five largest customers accounted for approximately 83%, 85%, and 85% of its net sales in fiscal 2012, 2011 and 2010, respectively. During fiscal 2012, Spansion Inc., or Spansion, and Texas Instruments Incorporated, or Texas Instruments, accounted for approximately 40% and 22%, respectively, of the Company’s net sales. During fiscal 2011, Spansion and Texas Instruments accounted for approximately 61% and 11%, respectively, of the Company’s net sales. During fiscal 2010, Spansion, Micronas Semiconductor Holding AG and Texas Instruments accounted for approximately 55%, 12% and 11%, respectively, of the Company’s net sales. No other customers accounted for more than 10% of the Company’s net sales for any of these periods. The Company expects that sales of its products to a limited number of customers will continue to account for a high percentage of net sales for the foreseeable future. In addition, sales to particular customers may fluctuate significantly from quarter to quarter. Such fluctuations may result in changes in utilization of the Company’s facilities and resources. The loss of or reduction or delay in orders from a significant customer or a delay in collecting or failure to collect accounts receivable from a significant customer could materially and adversely affect the Company’s business, financial condition and operating results.
MARKETING, SALES AND CUSTOMER SUPPORT
The Company has sales and service operations in the United States, Japan, Germany and Taiwan, and has established a network of distributors and sales representatives in certain key parts of the world. See “REVENUE RECOGNITION” in Item 7 under “Management’s Discussion and Analysis of Financial Condition and Results of Operations” for a further discussion of the Company’s relationship with distributors, and its effects on revenue recognition.
The Company’s customer service and support program includes system installation, system repair, applications engineering support, spare parts inventories, customer training and documentation. The Company has both applications engineering and field service personnel located at the corporate headquarters in Fremont, California, at several locations in Texas and at the Company’s subsidiaries in Japan, Germany and Taiwan. The Company’s distributors provide applications and field service support in other parts of the world. The Company customarily provides a warranty on its products. The Company offers service contracts on its systems directly and through its subsidiaries, distributors and representatives. The Company maintains customer support personnel in the Philippines and China. The Company believes that maintaining a close relationship with customers and providing them with ongoing engineering support
6
improves customer satisfaction and will provide the Company with a competitive advantage in selling its products to the Company’s customers.
BACKLOG
At May 31, 2012, the Company’s backlog was $7.3 million compared with $5.8 million at May 31, 2011. The Company’s backlog consists of product orders for which confirmed purchase orders have been received and which are scheduled for shipment within 12 months. Due to the possibility of customer changes in delivery schedules or cancellations and potential delays in product shipments or development projects, the Company’s backlog as of a particular date may not be indicative of net sales for any succeeding period.
RESEARCH AND PRODUCT DEVELOPMENT
The Company historically has devoted a significant portion of its financial resources to research and development programs and expects to continue to allocate significant resources to these efforts. The Company’s research and development expenses during fiscal 2012, 2011 and 2010 were $4.2 million, $4.6 million and $4.8 million, respectively.
The Company conducts ongoing research and development to design new products and to support and enhance existing product lines. Building upon the expertise gained in the development of its existing products, the Company has developed the FOX family of systems for performing test and burn-in of entire processed wafers, rather than individual die or packaged parts. The Company is completing development of the ABTS family of products, intended to improve the capability and performance for testing and burn-in of future generation ICs and provide the flexibility in a wide variety of applications from logic to memory.
MANUFACTURING
The Company assembles its products from components and parts manufactured by others, including environmental chambers, power supplies, metal fabrications, printed circuit assemblies, ICs, burn-in sockets, high-density interconnects, wafer contactors and interconnect substrates. Final assembly and testing are performed within the Company’s facilities. The Company’s strategy is to use in-house manufacturing only when necessary to protect a proprietary process or when a significant improvement in quality, cost or leadtime can be achieved. The Company’s principal manufacturing facility is located in Fremont, California. The Company’s facilities in Tokyo, Japan and Utting, Germany provide limited manufacturing and product customization.
The Company relies on subcontractors to manufacture many of the components and subassemblies used in its products. The Company’s ABTS, FOX and MAX systems and DiePak carriers contain several components, including environmental chambers, power supplies, high-density interconnects, wafer contactors, signal distribution substrates and certain ICs, that are currently supplied by only one or a limited number of suppliers. The Company’s reliance on subcontractors and single source suppliers involves a number of significant risks, including the loss of control over the manufacturing process, the potential absence of adequate capacity and reduced control over delivery schedules, manufacturing yields, quality and costs. In the event that any significant subcontractor or single source supplier becomes unable or unwilling to continue to manufacture subassemblies, components or parts in required volumes, the Company will have to identify and qualify acceptable replacements. The process of qualifying subcontractors and suppliers could be lengthy, and no assurance can be given that any additional sources would be available to the Company on a timely basis. Any delay, interruption or termination of a supplier relationship could adversely affect our ability to deliver products, which would harm our operating results.
COMPETITION
The semiconductor equipment industry is intensely competitive. Significant competitive factors in the semiconductor equipment market include price, technical capabilities, quality, flexibility, automation, cost of ownership, reliability, throughput, product availability and customer service. In each of the markets it serves, the Company faces competition from established competitors and potential new entrants, many of which have greater financial, engineering, manufacturing and marketing resources than the Company.
The Company’s FOX full wafer contact systems face competition from larger systems manufacturers that have significant technological know-how and manufacturing capability. Competing suppliers of full wafer contact systems include Advantest Corporation, Teradyne Inc., Micronics Japan Co., Ltd., Matsushita Electric Industrial Co., Ltd. and Delta V Instruments, Incorporated.
7
The Company’s ABTS and MAX TDBI systems have faced and are expected to continue to face increasingly severe competition, especially from several regional, low-cost manufacturers and from systems manufacturers that offer higher power dissipation per device under test. Some users of such systems, such as independent test labs, build their own burn-in systems, while others, particularly large IC manufacturers in Asia, acquire burn-in systems from captive or affiliated suppliers. The market for burn-in systems is highly fragmented, with many domestic and international suppliers. Competing suppliers of burn-in and functional test systems include Dong-Il Corporation, Micro Control Company, Incal Technology, Advantest Corporation, UniTest Inc. and Blue Engineering Inc.
The Company expects that its WaferPak products will face significant competition. The Company believes that several companies have developed or are developing full-wafer and single-touchdown probe cards. As the full-wafer test market develops, the Company expects that other competitors will emerge. The Company expects that the primary competitive factors in this market will be cost, performance, reliability and assured supply. Competing suppliers of full-wafer probe cards include FormFactor, Inc., Advantest Corporation and Micronics Japan Co., Ltd.
The Company’s test fixture products face numerous regional competitors. There are limited barriers to entry into the BIB market, and as a result, many companies design and manufacture BIBs, including BIBs for use with the Company’s ABTS and MAX systems. The Company has granted royalty-bearing licenses to several companies to make BIBs for use with the Company’s MAX4 systems and the Company may grant additional licenses as well. Sales of MAX4 BIBs by licensees result in royalties to the Company.
The Company expects that its DiePak products will face significant competition. The Company believes that several companies have developed or are developing products which are intended to enable test and burn-in of bare die. As the bare die market develops, the Company expects that other competitors will emerge. The DiePak products also face severe competition from other alternative test solutions. The Company expects that the primary competitive factors in this market will be cost, performance, reliability and assured supply. Competing suppliers of DiePak products include Yamaichi Electronics Co., Ltd.
The Company expects its competitors to continue to improve the performance of their current products and to introduce new products with improved price and performance characteristics. New product introductions by the Company’s competitors or by new market entrants could cause a decline in sales or loss of market acceptance of the Company’s products. The Company has observed price competition in the systems market, particularly with respect to its less advanced products. Increased competitive pressure could also lead to intensified price-based competition, resulting in lower prices which could adversely affect the Company’s operating margins and results. The Company believes that to remain competitive it must invest significant financial resources in new product development and expand its customer service and support worldwide. There can be no assurance that the Company will be able to compete successfully in the future.
PROPRIETARY RIGHTS
The Company relies primarily on the technical and creative ability of its personnel, its proprietary software, and trade secrets and copyright protection, rather than on patents, to maintain its competitive position. The Company’s proprietary software is copyrighted and licensed to the Company’s customers. At May 31, 2012 the Company held thirty seven issued United States patents with expiration date ranges from 2012 to 2030 and had several additional United States patent applications and foreign patent applications pending.
The Company’s ability to compete successfully is dependent in part upon its ability to protect its proprietary technology and information. Although the Company attempts to protect its proprietary technology through patents, copyrights, trade secrets and other measures, there can be no assurance that these measures will be adequate or that competitors will not be able to develop similar technology independently. Further, there can be no assurance that claims allowed on any patent issued to the Company will be sufficiently broad to protect the Company’s technology, that any patent will be issued to the Company from any pending application or that foreign intellectual property laws will protect the Company’s intellectual property. Litigation may be necessary to enforce or determine the validity and scope of the Company’s proprietary rights, and there can be no assurance that the Company’s intellectual property rights, if challenged, will be upheld as valid. Any such litigation could result in substantial costs and diversion of resources and could have a material adverse effect on the Company’s business, financial condition and operating results, regardless of the outcome of the litigation. In addition, there can be no assurance that any of the patents issued to the Company will not be challenged, invalidated or circumvented or that the rights granted thereunder will provide competitive advantages to the Company. Also, there can be no assurance that the Company will have the financial resources to defend its patents from infringement or claims of invalidity.
8
There are currently no pending claims against the Company regarding infringement of any patents or other intellectual property rights of others. However, the Company may receive communications from third parties asserting intellectual property claims against the Company. Such claims could include assertions that the Company’s products infringe, or may infringe, the proprietary rights of third parties, requests for indemnification against such infringement or suggest the Company may be interested in acquiring a license from such third parties. There can be no assurance that any such claim made in the future will not result in litigation, which could involve significant expense to the Company, and, if the Company is required or deems it appropriate to obtain a license relating to one or more products or technologies, there can be no assurance that the Company would be able to do so on commercially reasonable terms, or at all.
EMPLOYEES
As of May 31, 2012, the Company, including its two foreign subsidiaries and one branch office, employed 84 persons collectively, on a full-time basis, of whom 25 were engaged in research, development and related engineering, 21 were engaged in manufacturing, 24 were engaged in marketing, sales and customer support and 14 were engaged in general administration and finance functions. In addition, the Company from time to time employs a number of contractors and part-time employees, particularly to perform customer support and manufacturing. The Company’s success is in part dependent on its ability to attract and retain highly skilled workers, who are in high demand. None of the Company’s employees are represented by a union and the Company has never experienced a work stoppage. The Company’s management considers its relations with its employees to be good.
GEOGRAPHIC AREAS
The Company operates in several geographic areas. Selected financial information, including net sales and property and equipment, net for each of the last three fiscal years, is included in Part II, Item 8, Note 13 “Segment Information” and certain risks related to such operations are discussed in Part I, Item 1A, under the heading “We sell our products and services worldwide, and our business is subject to risks inherent in conducting business activities in geographic regions outside of the United States.”
AVAILABLE INFORMATION
The Company’s common stock trades on the NASDAQ Capital Market under the symbol “AEHR.” The Company’s annual report on Form 10-K, quarterly reports on Form 10-Q, current reports on Form 8-K and amendments to these reports that are filed with the United States Securities and Exchange Commission, or SEC, pursuant to Section 13(a) or 15(d) of the Exchange Act, are available free of charge through the Company’s website at www.aehr.com as soon as reasonably practicable after we electronically file them with, or furnish them to the SEC.
The public may read and copy any materials filed by the Company with the SEC at the SEC’s Public Reference Room at 100 F Street, NE, Washington, DC 20549. The public may obtain information on the operations of the Public Reference Room by calling the SEC at 1-800-SEC-0330. The SEC maintains an Internet site, http://www.sec.gov, that contains reports, proxy and information statements and other information regarding issuers that file electronically with the SEC.
In addition, information regarding the Company’s code of conduct and ethics and the charters of its Audit, Compensation and Nominating and Governance Committees, are available free of charge on the Company’s website listed above.
Item 1A. Risk Factors
You should carefully consider the risks described below. These risks are not the only risks that we may face. Additional risks and uncertainties that we are unaware of, or that we currently deem immaterial, also may become important factors that affect us. If any of the following risks occur, our business, financial condition or results of operations could be materially and adversely affected which could cause our actual operating results to differ materially from those indicated or suggested by forward-looking statements made in this Annual Report on Form 10-K or presented elsewhere by management from time to time.
Periodic economic and semiconductor industry downturns could negatively affect our business, results of operations and financial condition.
The recent and historical global economic and semiconductor industry downturns negatively affected and could continue to negatively affect our business, results of operations, and financial condition. The recent financial turmoil affected the banking system and financial markets resulting in a tightening of the credit markets, disruption in the
9
financial markets and global economy downturn. These events contributed to significant slowdowns in the industry in which we operate. Difficulties in obtaining capital and deteriorating market conditions can pose the risk that some of our customers may not be able to obtain necessary financing on reasonable terms, which could result in lower sales for the Company. Customers with liquidity issues may lead to additional bad debt expense for the Company. For example, Spansion declared bankruptcy in Japan and the U.S. during fiscal 2009; as a result the Company subsequently recorded a $13.7 million provision for bad debts. A recurrence of these conditions may also similarly affect our key suppliers, which could impact their ability to deliver parts and result in delays in deliveries of our products.
Turmoil in the international financial markets has resulted, and may result in the future, in dramatic currency devaluations, stock market declines, restriction of available credit and general financial weakness. In addition, flash, DRAM and other memory device prices have historically declined, and will likely do so again in the future. These developments may affect us in several ways. We believe that many international semiconductor manufacturers limited their capital spending in calendar 2009 and again in calendar 2011, and that the uncertainty of the semiconductor market may cause some manufacturers in the future to further delay capital spending plans. Economic conditions may also affect the ability of our customers to meet their payment obligations, resulting in cancellations or deferrals of existing orders and limiting additional orders. In addition, some governments have subsidized portions of fabrication facility construction, and financial turmoil may reduce these governments’ willingness to continue such subsidies. Such developments could have a material adverse affect on our business, financial condition and results of operations.
The recent economic conditions and uncertainty about future economic conditions make it challenging for us to forecast our operating results, make business decisions, and identify the risks that may affect our business, financial condition and results of operations. If such conditions recur, and we are not able to timely and appropriately adapt to changes resulting from the difficult macroeconomic environment, our business, financial condition or results of operations may be materially and adversely affected.
If we are not able to reduce our operating expenses sufficiently during periods of weak revenue, or if we utilize significant amounts of cash to support operating losses, we may erode our cash resources and may not have sufficient cash to operate our business.
In the face of the recent sustained downturn in our business and decline in our net sales, we implemented a variety of cost controls and restructured our operations with the goal of reducing our operating costs to position ourselves to more effectively meet the needs of the then weak market for test and burn-in equipment. While we took significant steps in fiscal 2009 to minimize our expense levels and to increase the likelihood that we would have sufficient cash to support operations during the downturn, during fiscal 2009, 2010, 2011 and fiscal 2012 we experienced operating losses. Due primarily to these operating losses, we experienced cash outflows and at May 31, 2012 had $2.1 million in cash and cash equivalents, compared to $4.0 million at May 31, 2011. Should our business downturn be prolonged, and if we are unable to reduce our operating expenses sufficiently, we may require additional debt or equity financing to meet working capital or capital expenditure needs. While we believe our existing cash balance, together with cash flows from operations, as well as funds available through our working capital credit facility, will be adequate to meet our working capital and capital equipment requirements through fiscal 2013, we cannot determine with certainty that, if needed, we will be able to raise additional funding through either equity or debt financing under these circumstances or on what terms such financing would be available.
We generate a large portion of our sales from a small number of customers. If we were to lose one or more of our large customers, operating results could suffer dramatically.
The semiconductor manufacturing industry is highly concentrated, with a relatively small number of large semiconductor manufacturers and contract assemblers accounting for a substantial portion of the purchases of semiconductor equipment. Sales to the Company’s five largest customers accounted for approximately 83% and 85% of its net sales in fiscal 2012 and 2011, respectively. During fiscal 2012, Spansion and Texas Instruments accounted for approximately 40% and 22%, respectively, of the Company’s net sales. During fiscal 2011, Spansion and Texas Instruments accounted for approximately 61% and 11%, respectively, of the Company’s net sales. No other customers represented more than 10% of the Company's net sales for either fiscal 2012 or fiscal 2011.
We expect that sales of our products to a limited number of customers will continue to account for a high percentage of net sales for the foreseeable future. In addition, sales to particular customers may fluctuate significantly from quarter to quarter. The loss of, or reduction or delay in an order, or orders from a significant customer, or a delay in collecting or failure to collect accounts receivable from a significant customer could adversely affect our business, financial condition and operating results. For example, during fiscal 2009 Spansion, our largest customer at the time, declared bankruptcy in Japan and in the U.S. and subsequently placed lower levels of orders with the Company, which caused our net sales to drop dramatically and impacted the Company’s ability to collect on accounts receivable.
10
A substantial portion of our net sales is generated by relatively small volume, high value transactions.
We derive a substantial portion of our net sales from the sale of a relatively small number of systems which typically range in purchase price from approximately $200,000 to over $1 million per system. As a result, the loss or deferral of a limited number of system sales could have a material adverse effect on our net sales and operating results in a particular period. All customer purchase orders are subject to cancellation or rescheduling by the customer with limited penalties, and, therefore, backlog at any particular date is not necessarily indicative of actual sales for any succeeding period. From time to time, cancellations and rescheduling of customer orders have occurred, and delays by our suppliers in providing components or subassemblies to us have caused delays in our shipments of our own products. There can be no assurance that we will not be materially adversely affected by future cancellations or rescheduling. Certain contracts contain provisions that require customer acceptance prior to recognition of revenue. The delay in customer acceptance could have a material adverse effect on our operating results. A substantial portion of net sales typically are realized near the end of each quarter. A delay or reduction in shipments near the end of a particular quarter, due, for example, to unanticipated shipment rescheduling, cancellations or deferrals by customers, customer credit issues, unexpected manufacturing difficulties experienced by us or delays in deliveries by suppliers, could cause net sales in a particular quarter to fall significantly below our expectations.
The Company’s business operations could be negatively impacted by earthquakes or other natural disasters.
The March 2011 Japanese earthquake and resulting tsunami seriously affected many companies in Japan, including some of our customers. Besides the direct impact to their employees and facilities, the customers were affected by, among other things, the rolling electrical blackouts and industry wide shutdowns as well as the impact of the nuclear power plant disaster. Some of our customers delayed capital equipment purchases as a result of the disaster. The disaster also negatively impacted the Japanese economy as a whole, which could further impact the Company's future business prospects in Japan.
Natural disasters may impact our ability to manufacture products in the event our facility is damaged, or if operations are disrupted at a major supplier. The demand for our products may be negatively affected if a natural disaster impacts one or more of our significant customers. These events may seriously damage our ability to conduct business.
We rely on increasing market acceptance for our FOX system, and we may not be successful in attracting new customers or maintaining our existing customers.
A principal element of our business strategy is to capture an increasing share of the test equipment market through sales of our FOX wafer-level test and burn-in system. The FOX system is designed to simultaneously burn-in and functionally test all of the die on a wafer. The market for the FOX systems is in the early stages of development. Market acceptance of the FOX system is subject to a number of risks. Before a customer will incorporate the FOX system into a production line, lengthy qualification and correlation tests must be performed. We anticipate that potential customers may be reluctant to change their procedures in order to transfer burn-in and test functions to the FOX system. Initial purchases are expected to be limited to systems used for these qualifications and for engineering studies. Market acceptance of the FOX system also may be affected by a reluctance of IC manufacturers to rely on relatively small suppliers such as Aehr Test Systems. As is common with new complex products incorporating leading-edge technologies, we may encounter reliability, design and manufacturing issues as we begin volume production and initial installations of FOX systems at customer sites. The failure of the FOX system to achieve increased market acceptance would have a material adverse effect on our future operating results, long-term prospects and our stock price.
We rely on increasing market acceptance for our ABTS system and our ability to complete certain enhancements.
Market acceptance of the ABTS family, first introduced in fiscal 2008, is subject to a number of risks. We must complete engineering development of certain hardware and software enhancements to the ABTS family in order to increase market acceptance. It is important that we achieve customer satisfaction and increased market acceptance of the ABTS products. To date, the Company has received orders for the ABTS system from more than 12 customers worldwide. The failure of the ABTS family to achieve increased market acceptance would have a material adverse effect on our future operating results and stock price.
We depend upon some continued market need for our MAX system; a limited market for the product may result in our having excess inventory.
We have historically derived a substantial portion of our net sales from the sale of dynamic burn-in systems. We believe that the market for burn-in systems is mature and is not expected to experience growth in the future. In general,
11
process control improvements in the semiconductor industry have tended to reduce burn-in times. In addition, as a given IC product generation matures and yields increase, the required burn-in time may be reduced or eliminated. IC manufacturers, which historically have been our primary customer base, increasingly outsource test and burn-in to independent test labs, which may build their own systems. Our ABTS system may cannibalize the business that would previously have been addressed by the MAX system. We have some level of inventory which supports MAX products. Our success depends upon some continued need for our MAX burn-in products within these markets. There can be no assurance that the market for burn-in systems will not decline, or that sales of our MAX burn-in products will not decline, which would have an adverse effect on our operating results.
We sell our products and services worldwide, and our business is subject to risks inherent in conducting business activities in geographic regions outside of the United States.
Approximately 38%, 39% and 29% of our net sales for fiscal 2012, 2011 and 2010, respectively, were attributable to sales to customers for delivery outside of the United States. We operate sales, service and limited manufacturing organizations in Japan and Germany and a sales and support organization in Taiwan. We expect that sales of products for delivery outside of the United States will continue to represent a substantial portion of our future net sales. Our future performance will depend, in significant part, upon our ability to continue to compete in foreign markets which in turn will depend, in part, upon a continuation of current trade relations between the United States and foreign countries in which semiconductor manufacturers or assemblers have operations. A change toward more protectionist trade legislation in either the United States or such foreign countries, such as a change in the current tariff structures, export compliance or other trade policies, could adversely affect our ability to sell our products in foreign markets. In addition, we are subject to other risks associated with doing business internationally, including longer receivable collection periods and greater difficulty in accounts receivable collection, the burden of complying with a variety of foreign laws, difficulty in staffing and managing global operations, risks of civil disturbance or other events which may limit or disrupt markets, international exchange restrictions, changing political conditions and monetary policies of foreign governments.
Approximately 95%, 1% and 4% of our net sales for fiscal 2012 were denominated in U.S. Dollars, Japanese Yen and Euros, respectively. Although the percentages of net sales denominated in Japanese Yen and Euros were small in fiscal 2012, they have been larger in the past and could become significant again in the future. A large percentage of net sales to European customers are denominated in U.S. Dollars, but sales to many Japanese customers are denominated in Yen. Because a substantial portion of our net sales is from sales of products for delivery outside the United States, an increase in the value of the U.S. Dollar relative to foreign currencies would increase the cost of our products compared to products sold by local companies in such markets. In addition, since the price is determined at the time a purchase order is accepted, we are exposed to the risks of fluctuations in the U.S. Dollar exchange rate during the lengthy period from the date a purchase order is received until payment is made. This exchange rate risk is partially offset to the extent our foreign operations incur expenses in the local currency. To date, we have not invested in instruments designed to hedge currency risks. Our operating results could be adversely affected by fluctuations in the value of the U.S. Dollar relative to other currencies.
Our industry is subject to rapid technological change and our ability to remain competitive depends on our ability to introduce new products in a timely manner.
The semiconductor equipment industry is subject to rapid technological change and new product introductions and enhancements. Our ability to remain competitive will depend in part upon our ability to develop new products and to introduce these products at competitive prices and on a timely and cost-effective basis. Our success in developing new and enhanced products depends upon a variety of factors, including product selection, timely and efficient completion of product design, timely and efficient implementation of manufacturing and assembly processes, product performance in the field and effective sales and marketing. Because new product development commitments must be made well in advance of sales, new product decisions must anticipate both future demand and the technology that will be available to supply that demand. Furthermore, introductions of new and complex products typically involve a period in which design, engineering and reliability issues are identified and addressed by our suppliers and by us. There can be no assurance that we will be successful in selecting, developing, manufacturing and marketing new products that satisfy market demand. Any such failure would materially and adversely affect our business, financial condition and results of operations.
Because of the complexity of our products, significant delays can occur between a product’s introduction and the commencement of the volume production of such product. We have experienced, from time to time, significant delays in the introduction of, and technical and manufacturing difficulties with, certain of our products and may experience delays and technical and manufacturing difficulties in future introductions or volume production of our new products. Our inability to complete new product development, or to manufacture and ship products in time to meet customer requirements would materially adversely affect our business, financial condition and results of operations.
12
We may experience increased costs associated with new product introductions.
As is common with new complex products incorporating leading-edge technologies, we have encountered reliability, design and manufacturing issues as we began volume production and initial installations of certain products at customer sites. Certain of these issues in the past have been related to components and subsystems supplied to us by third parties who have in some cases limited the ability of us to address such issues promptly. This process in the past required and in the future is likely to require us to incur un-reimbursed engineering expenses and to experience larger than anticipated warranty claims which could result in product returns. In the early stages of product development there can be no assurance that we will discover any reliability, design and manufacturing issues or, that if such issues arise, that they can be resolved to the customers’ satisfaction or that the resolution of such problems will not cause us to incur significant development costs or warranty expenses or to lose significant sales opportunities.
Our dependence on subcontractors and sole source suppliers may prevent us from delivering our products on a timely basis and expose us to intellectual property infringement.
We rely on subcontractors to manufacture many of the components or subassemblies used in our products. Our FOX and ABTS systems, WaferPak contactors and DiePak carriers contain several components, including environmental chambers, power supplies, high-density interconnects, wafer contactors, signal distribution substrates and certain ICs that are currently supplied by only one or a limited number of suppliers. Our reliance on subcontractors and single source suppliers involves a number of significant risks, including the loss of control over the manufacturing process, the potential absence of adequate capacity and reduced control over delivery schedules, manufacturing yields, quality and costs. In the event that any significant subcontractor or single source supplier becomes unable or unwilling to continue to manufacture subassemblies, components or parts in required volumes, we will have to identify and qualify acceptable replacements. The process of qualifying subcontractors and suppliers could be lengthy, and no assurance can be given that any additional sources would be available to us on a timely basis. Any delay, interruption or termination of a supplier relationship could adversely affect our ability to deliver products, which would harm our operating results.
Our suppliers manufacture components, tooling, and provide engineering services which allows access to intellectual property of the Company. While the Company maintains patents to protect from intellectual property infringement, there can be no assurance that technological information gained in the manufacture of our products will not be used to develop a new product, improve processes or techniques which compete against our products. Litigation may be necessary to enforce or determine the validity and scope of our proprietary rights, and there can be no assurance that our intellectual property rights, if challenged, will be upheld as valid.
Future changes in semiconductor technologies may make our products obsolete.
Future improvements in semiconductor design and manufacturing technology may reduce or eliminate the need for our products. For example, improvements in built-in self-test, or BIST, technology and improvements in conventional test systems, such as reduced cost or increased throughput, may significantly reduce or eliminate the market for one or more of our products. If we are not able to improve our products or develop new products or technologies quickly enough to maintain a competitive position in our markets, our business may decline.
Semiconductor business cycles are unreliable and there is always the risk of cancellations and rescheduling which could have a material adverse affect on our operating results.
Our operating results depend primarily upon the capital expenditures of semiconductor manufacturers, semiconductor contract assemblers and burn-in and test service companies worldwide, which in turn depend on the current and anticipated market demand for ICs. The semiconductor equipment manufacturing industry has historically been subject to a relatively high rate of purchase order cancellation by customers as compared to other high technology industry sectors. Manufacturing companies that are the customers of semiconductor equipment companies frequently revise, postpone and cancel capital facility expansion plans. In such cases, semiconductor equipment companies may experience a significant rate of cancellations or rescheduling of purchase orders. A significant increase in purchase order cancellations was recognized in the third quarter of fiscal 2009 as a result of the Spansion bankruptcy filing. There can be no assurance that we will not be materially adversely affected by future cancellations or rescheduling of purchase orders.
Our stock price may fluctuate.
The price of our common stock has fluctuated in the past and may fluctuate significantly in the future. We believe that factors such as announcements of developments related to our business, fluctuations in our operating results, failure to meet securities analysts’ expectations, general conditions in the semiconductor and semiconductor equipment
13
industries and the worldwide economy, announcement of technological innovations, new systems or product enhancements by us or our competitors, fluctuations in the level of cooperative development funding, acquisitions, changes in governmental regulations, developments in patents or other intellectual property rights and changes in our relationships with customers and suppliers could cause the price of our common stock to fluctuate substantially. In addition, in recent years the stock market in general, and the market for small capitalization and high technology stocks in particular, have experienced extreme price fluctuations which have often been unrelated to the operating performance of the affected companies. Such fluctuations could adversely affect the market price of our common stock.
The Company may not meet the listing requirements of the NASDAQ markets which could cause our stock to be delisted.
Pursuant to the requirements of NASDAQ, if a company’s stock price is below $1 per share for 30 consecutive trading days (the “Bid Price Rule”), NASDAQ will notify the company that it is no longer in compliance with the NASDAQ listing qualifications. If a company is not in compliance with the Bid Price Rule, the company will have 180 calendar days to regain compliance. On September 15, 2009, the Company received notice from NASDAQ that it was no longer in compliance with the Bid Price Rule. The Company regained compliance on September 30, 2009. Additionally, on November 2, 2011, the Company received notice from NASDAQ that it was no longer in compliance with the Bid Price Rule. The Company subsequently regained compliance on April 16, 2012.
On January 18, 2011 the Company received notice from NASDAQ that it was no longer in compliance with NASDAQ’s Listing Rule 5450(b)(1)(A), which specifies that an issuer must maintain stockholders’ equity of at least $10 million. On March 21, 2011 the Company submitted an application to NASDAQ to transfer the listing of its company stock from the NASDAQ Global Market to the NASDAQ Capital Market. On March 24, 2011 the Company received a letter from NASDAQ informing it that the NASDAQ Listing Qualifications Staff had granted the Company’s request to transfer the listing of its common stock to the NASDAQ Capital Market, effective at the opening of business on March 28, 2011. The Bid Price Rule is also a listing requirement of the NASDAQ Capital Market.
There can be no assurance that the Company will maintain compliance with the Bid Price Rule and the other listing requirements of the NASDAQ Capital Market, or that it will not be delisted.
We depend on our key personnel and our success depends on our ability to attract and retain talented employees.
Our success depends to a significant extent upon the continued service of Rhea Posedel, our Executive Chairman and Gayn Erickson, our President and Chief Executive Officer, as well as other executive officers and key employees. We do not maintain key person life insurance for our benefit on any of our personnel, and none of our employees are subject to a non-competition agreement with the Company. The loss of the services of any of our executive officers or a group of key employees could have a material adverse effect on our business, financial condition and operating results. Our future success will depend in significant part upon our ability to attract and retain highly skilled technical, management, sales and marketing personnel. There is a limited number of personnel with the requisite skills to serve in these positions, and it has become increasingly difficult for us to hire such personnel. Competition for such personnel in the semiconductor equipment industry is intense, and there can be no assurance that we will be successful in attracting or retaining such personnel. Changes in management could disrupt our operations and adversely affect our operating results.
We may be subject to litigation relating to intellectual property infringement which would be time-consuming, expensive and a distraction from our business.
If we do not adequately protect our intellectual property, competitors may be able to use our proprietary information to erode our competitive advantage, and our business and operating results could be harmed. Litigation may be necessary to enforce or determine the validity and scope of our proprietary rights, and there can be no assurance that our intellectual property rights, if challenged, will be upheld as valid. Such litigation could result in substantial costs and diversion of resources and could have a material adverse effect on our operating results, regardless of the outcome of the litigation. In addition, there can be no assurance that any of the patents issued to us will not be challenged, invalidated or circumvented or that the rights granted thereunder will provide competitive advantages to us.
There are no pending claims against us regarding infringement of any patents or other intellectual property rights of others. However, in the future we may receive communications from third parties asserting intellectual property claims against us. Such claims could include assertions that our products infringe, or may infringe, the proprietary rights of third parties, requests for indemnification against such infringement or suggestions that we may be interested in acquiring a license from such third parties. There can be no assurance that any such claim will not result in litigation,
14
which could involve significant expense to us, and, if we are required or deem it appropriate to obtain a license relating to one or more products or technologies, there can be no assurance that we would be able to do so on commercially reasonable terms, or at all.
While we believe we have complied with all applicable environmental laws, our failure to do so could adversely affect our business as a result of having to pay substantial amounts in damages or fees.
Federal, state and local regulations impose various controls on the use, storage, discharge, handling, emission, generation, manufacture and disposal of toxic and other hazardous substances used in our operations. We believe that our activities conform in all material respects to current environmental and land use regulations applicable to our operations and our current facilities, and that we have obtained environmental permits necessary to conduct our business. Nevertheless, the failure to comply with current or future regulations could result in substantial fines being imposed on us, suspension of production, alteration of our manufacturing processes or cessation of operations. Such regulations could require us to acquire expensive remediation equipment or to incur substantial expenses to comply with environmental regulations. Any failure by us to control the use, disposal or storage of or adequately restrict the discharge of, hazardous or toxic substances could subject us to significant liabilities.
While we believe we currently have adequate internal control over financial reporting, we are required to assess our internal control over financial reporting on an annual basis and any future adverse results from such assessment could result in a loss of investor confidence in our financial reports and have an adverse effect on our stock.
Pursuant to Section 404 of the Sarbanes-Oxley Act of 2002, we must include in our Annual Report on Form 10-K a report of management on the effectiveness of our internal control over financial reporting. If we fail to maintain effective internal control over financial reporting, or management does not timely assess the adequacy of such internal control, we could be subject to regulatory sanctions and the investing public’s perception of the Company may decline.
Item 1B. Unresolved Staff Comments
None.
Item 2. Properties
The Company’s principal administrative and production facilities are located in Fremont, California, in a 51,289 square foot building. The term of the Company’s current lease ends on June 30, 2015. The Company has an option to extend the lease for an additional period at rates to be determined. The Company’s facility in Japan is located in Tokyo in a 4,294 square foot building under a lease which expires in September, 2013. The Company leases a sales and support office in Utting, Germany. The lease, which began February 1, 1992 and expires on January 31, 2014, contains an automatic twelve months renewal, at rates to be determined, if no notice is given prior to six months from expiry. The Company’s and its subsidiaries’ annual rental payments currently aggregate $680,000. The Company periodically evaluates its global operations and facilities to bring its capacity in line with demand and to provide cost efficient services for its customers. In prior years, through this process, the Company has moved from certain facilities that exceeded the capacity required to satisfy its needs. The Company believes that its existing facilities are adequate to meet its current and reasonably foreseeable requirements. The Company regularly evaluates its expected future facilities requirements and believes that alternate facilities would be available if needed.
Item 3. Legal Proceedings
None.
Item 4. Mine Safety Disclosures
Not Applicable
15
PART II
Item 5. Market for Registrant’s Common Equity, Related Stockholder Matters and Issuer Purchases of Equity Securities
The Company’s common stock publicly traded on the NASDAQ Global Market under the symbol “AEHR” from August 1997, the date of our initial public offering, through March 2011, at which time the stock began trading on the NASDAQ Capital Market. The following table sets forth, for the periods indicated, the high and low sale prices for the common stock on such markets. These quotations represent prices between dealers and do not include retail markups, markdowns or commissions and may not necessarily represent actual transactions.
|
High
|
Low
|
|||||||
|
Fiscal 2012:
|
||||||||
|
First quarter ended August 31, 2011
|
$ | 1.73 | $ | 1.01 | ||||
|
Second quarter ended November 30, 2011
|
1.25 | 0.40 | ||||||
|
Third quarter ended February 29, 2012
|
1.00 | 0.51 | ||||||
|
Fourth quarter ended May 31, 2012
|
1.65 | 0.69 | ||||||
|
Fiscal 2011:
|
||||||||
|
First quarter ended August 31, 2010
|
$ | 2.49 | $ | 1.13 | ||||
|
Second quarter ended November 30, 2010
|
1.75 | 0.91 | ||||||
|
Third quarter ended February 28, 2011
|
1.89 | 0.92 | ||||||
|
Fourth quarter ended May 31, 2011
|
2.39 | 1.27 | ||||||
At August 6, 2012, the Company had 130 holders of record of its common stock. The Company estimates the number of beneficial owners of the Company’s common stock at August 6, 2012 to be 1,604.
The market price of the Company’s common stock has been volatile. For a discussion of the factors affecting the Company’s stock price, see “Risk Factors – Our stock price may fluctuate.”
The Company has not paid cash dividends on its common stock or other securities. The Company currently anticipates that it will retain its future earnings, if any, for use in the expansion and operation of its business and does not anticipate paying any cash dividends on its common stock in the foreseeable future.
The Company did not repurchase any of its common stock during the fiscal year ended May 31, 2012.
EQUITY COMPENSATION PLAN INFORMATION
The information required by this item is incorporated by reference to the information under the caption “Security Ownership of Certain Beneficial Owners and Management and Related Stockholder Matters” of the Proxy Statement and Part III, Item 12 of this Annual Report on Form 10-K.
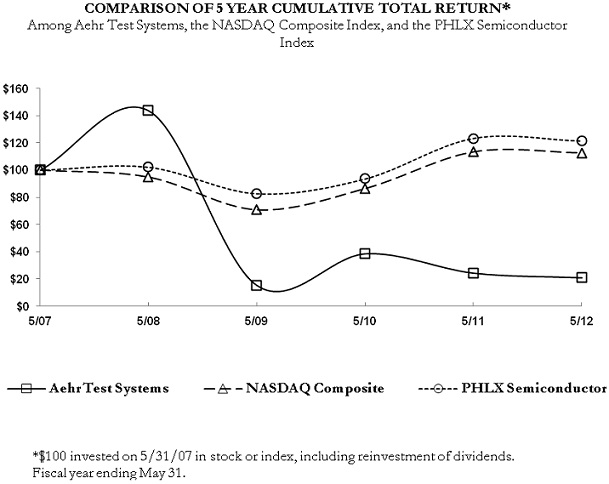
PERFORMANCE MEASUREMENT COMPARISON
The following graph shows a comparison of total shareholder return for holders of the Company's common stock for the last five fiscal years ended May 31, 2012, compared with the NASDAQ Composite Index and the Philadelphia Semiconductor Index. The graph assumes that $100 was invested in the Company's common stock, in the NASDAQ Composite Index and the Philadelphia Semiconductor Index on May 31, 2007, and that all dividends were reinvested. The Company believes that while total shareholder return can be an important indicator of corporate performance, the stock prices of semiconductor equipment companies like Aehr Test Systems are subject to a number of market-related factors other than company performance, such as competitive announcements, mergers and acquisitions in the industry, the general state of the economy and the performance of other semiconductor equipment company stocks. Stock prices and shareholder returns over the indicated period should not be considered indicative of future stock prices or shareholder returns.
16
17
Item 6. Selected Consolidated Financial Data
The selected consolidated financial data set forth below should be read in conjunction with “Management’s Discussion and Analysis of Financial Condition and Results of Operations” and the consolidated financial statements and related notes included elsewhere in this Form 10-K.
|
Fiscal Year Ended May 31,
|
||||||||||||||||||||
|
2012
|
2011
|
2010
|
2009
|
2008
|
||||||||||||||||
| (In thousands, except per share data) | ||||||||||||||||||||
|
CONSOLIDATED STATEMENTS OF OPERATIONS:
|
||||||||||||||||||||
|
Net sales
|
||||||||||||||||||||
|
Product sales
|
$ | 15,521 | $ | 13,737 | $ | 8,934 | $ | 21,407 | $ | 39,041 | ||||||||||
|
Cancellation charges
|
-- | -- | 2,740 | -- | -- | |||||||||||||||
|
Total net sales
|
15,521 | 13,737 | 11,674 | 21,407 | 39,041 | |||||||||||||||
|
Cost of sales
|
9,314 | 8,225 | 5,571 | 20,223 | 19,072 | |||||||||||||||
|
Gross profit
|
6,207 | 5,512 | 6,103 | 1,184 | 19,969 | |||||||||||||||
|
Operating expenses:
|
||||||||||||||||||||
|
Selling, general and administrative
|
6,526 | 5,964 | 6,094 | 20,623 | 7,657 | |||||||||||||||
|
Research and development
|
4,188 | 4,567 | 4,758 | 5,762 | 6,501 | |||||||||||||||
|
Impairment of goodwill
|
-- | -- | -- | 274 | -- | |||||||||||||||
|
Gain on bankruptcy claim
|
-- | (832 | ) | (3,993 | ) | -- | -- | |||||||||||||
|
Total operating expenses
|
10,714 | 9,699 | 6,859 | 26,659 | 14,158 | |||||||||||||||
|
(Loss) income from operations
|
(4,507 | ) | (4,187 | ) | (756 | ) | (25,475 | ) | 5,811 | |||||||||||
|
Interest income
|
-- | 3 | 5 | 142 | 231 | |||||||||||||||
|
Interest expense
|
(4 | ) | -- | -- | -- | -- | ||||||||||||||
|
Gain on sale of long-term investment
|
990 | -- | -- | -- | -- | |||||||||||||||
|
Other income (expense), net
|
117 | 762 | 131 | 277 | (71 | ) | ||||||||||||||
|
(Loss) income before income tax benefit
|
||||||||||||||||||||
|
(expense)
|
(3,404 | ) | (3,422 | ) | (620 | ) | (25,056 | ) | 5,971 | |||||||||||
|
Income tax benefit (expense)
|
15 | 49 | 139 | (4,915 | ) | 4,602 | ||||||||||||||
|
Net (loss) income
|
$ | (3,389 | ) | $ | (3,373 | ) | $ | (481 | ) | $ | (29,971 | ) | $ | 10,573 | ||||||
|
Net (loss) income per share:
|
||||||||||||||||||||
|
Basic
|
$ | (0.38 | ) | $ | (0.38 | ) | $ | (0.06 | ) | $ | (3.55 | ) | $ | 1.32 | ||||||
|
Diluted
|
$ | (0.38 | ) | $ | (0.38 | ) | $ | (0.06 | ) | $ | (3.55 | ) | $ | 1.24 | ||||||
|
Shares used in per share calculations
|
||||||||||||||||||||
|
Basic
|
9,016 | 8,776 | 8,563 | 8,436 | 8,013 | |||||||||||||||
|
Diluted
|
9,016 | 8,776 | 8,563 | 8,436 | 8,508 | |||||||||||||||
|
May 31,
|
||||||||||||||||||||
|
2012
|
2011
|
2010
|
2009
|
2008
|
||||||||||||||||
|
CONSOLIDATED BALANCE SHEETS:
|
||||||||||||||||||||
|
Cash and cash equivalents
|
$ | 2,073 | $ | 4,020 | $ | 7,766 | $ | 4,360 | $ | 15,648 | ||||||||||
|
Working capital
|
6,073 | 8,031 | 9,827 | 7,299 | 33,362 | |||||||||||||||
|
Total assets
|
11,613 | 12,083 | 14,474 | 13,911 | 45,199 | |||||||||||||||
|
Long-term obligations, less current portion
|
304 | 442 | 578 | 605 | 566 | |||||||||||||||
|
Total shareholders' equity
|
6,454
|
9,101
|
11,281
|
9,963
|
37,772
|
|||||||||||||||
18
Item 7. Management’s Discussion and Analysis of Financial Condition and Results of Operations
The following discussion and analysis of the financial condition and results of operations of the Company should be read in conjunction with “Selected Consolidated Financial Data” and our consolidated financial statements and related notes included elsewhere in this Annual Report on Form 10-K.
OVERVIEW
The Company was founded in 1977 to develop and manufacture burn-in and test equipment for the semiconductor industry. Since its inception, the Company has sold more than 2,500 systems to semiconductor manufacturers, semiconductor contract assemblers and burn-in and test service companies worldwide. The Company’s principal products currently are the Advanced Burn-in and Test System, the FOX full wafer contact parallel test and burn-in system, the MAX burn-in system, WaferPak contactors, the DiePak carrier and test fixtures.
The Company’s net sales consist primarily of sales of systems, test fixtures, die carriers, upgrades and spare parts and revenues from service contracts. The Company's selling arrangements may include contractual customer acceptance provisions and installation of the product occurs after shipment and transfer of title.
SIGNIFICANT ITEMS IMPACTING COMPARABILITY OF FINANCIAL STATEMENTS
Spansion, the Company’s largest customer in fiscal 2010 through 2012, filed for bankruptcy in Japan in February 2009 and in the United States in March 2009. Due to the bankruptcy filing and the impact of the weak global economic environment on demand for the Company’s products, in the third quarter of fiscal 2009, we recorded a $13.7 million provision for bad debts in selling, general and administrative expenses, a $7.2 million provision for excess and obsolete inventory and a $0.3 million charge for cancellation charges to cost of sales, a $4.9 million charge to income tax expense related to the reinstatement of the valuation allowance against the Company’s deferred tax assets, a $0.3 million charge to operating expenses related to goodwill impairment and a $0.4 million expense related to severance charges.
The Company filed a claim in the Spansion U.S. bankruptcy action. In the first quarter of fiscal 2010, the Company sold a portion, $11.4 million, of its Spansion U.S. bankruptcy claim to a third party for net proceeds of $3.3 million and recorded the amount as a reduction of operating expenses. In the third quarter of fiscal 2010, the Company sold the remaining balance, $7.1 million, of its Spansion U.S. bankruptcy claim to a third party for net proceeds of $4.6 million and recorded $2.7 million as net sales related to cancellation charges, $1.3 million as deferred revenue and $0.6 million as a reduction of operating expenses. In the fourth quarter of fiscal 2010, the Company received the remaining payment of $0.1 million due from its bankruptcy claim sale completed in the first quarter of fiscal 2010 and recognized the amount as a reduction of operating expenses. The $1.3 million deferred revenue at the end of the third quarter of fiscal 2010 was recognized as product sales during the fourth quarter of fiscal 2010 in connection with the delivery of products.
In the first quarter of fiscal 2011, the Company's Japanese subsidiary received approximately $0.2 million in proceeds from the Spansion Japan bankruptcy claim and recorded the amount as a reduction of operating expenses. In the fourth quarter of fiscal 2011, the Company's Japanese subsidiary received approximately $0.7 million in proceeds from the Spansion Japan bankruptcy claim and recorded the amount as a reduction of operating expenses.
The Company significantly reduced its headcount and initiated other expense reduction measures in fiscal 2009. The Company intends to take actions as necessary to maintain sufficient cash to manage through the current period of slow business activity.
CRITICAL ACCOUNTING POLICIES AND ESTIMATES
The Company’s discussion and analysis of its financial condition and results of operations are based upon the Company’s consolidated financial statements, which have been prepared in accordance with accounting principles generally accepted in the United States of America. The preparation of these consolidated financial statements requires the Company to make estimates and judgments that affect the reported amounts of assets, liabilities, revenues and expenses, and related disclosure of contingent assets and liabilities. On an ongoing basis, the Company evaluates its estimates, including those related to customer programs and incentives, product returns, bad debts, inventories, investments, intangible assets, income taxes, financing operations, warranty obligations, long-term service contracts, contingencies and litigation. The Company bases its estimates on historical experience and on various other assumptions that are believed to be reasonable under the circumstances, the results of which form the basis for making judgments about the carrying values of assets and liabilities that are not readily apparent from other sources. Actual results may differ from these estimates under different assumptions or conditions.
19
The Company believes the following critical accounting policies affect its more significant judgments and estimates used in the preparation of its consolidated financial statements.
REVENUE RECOGNITION
The Company recognizes revenue upon the shipment of products or the performance of services when: (1) persuasive evidence of the arrangement exists; (2) services have been rendered; (3) the price is fixed or determinable; and (4) collectibility is reasonably assured. The Company's selling arrangements may include contractual customer acceptance provisions. The Company defers recognition of revenue for any amounts subject to acceptance until such acceptance occurs. When a sales agreement involves multiple deliverables, such as extended support provisions, training to be supplied after delivery of the systems, and test programs specific to customers’ routine applications, the multiple deliverables are evaluated to determine the unit of accounting. Judgment is required to properly identify the accounting units of multiple element transactions and the manner in which revenue is allocated among the accounting units. Judgments made, or changes to judgments made, may significantly affect the timing or amount of revenue recognition.
Revenue related to the multiple elements are allocated to each unit of accounting using the relative selling price hierarchy. Consistent with accounting guidance, the selling price is based upon vendor specific objective evidence (VSOE). If VSOE is not available, third party evidence (TPE) is used to establish the selling price. In the absence of VSOE or TPE, estimated selling price is used. We have adopted this guidance effective with the first quarter of fiscal 2012. Prior to fiscal 2012, revenue for arrangements containing multiple deliverables was allocated based upon estimated fair values. The adoption of the new revenue recognition accounting standards did not have a material impact on our consolidated financial statements.
Sales tax collected from customers is not included in net sales but rather recorded as a liability due to the respective taxing authorities. Provisions for the estimated future cost of warranty and installation are recorded at the time the products are shipped.
Royalty-based revenue related to licensing income from performance test boards and burn-in boards is recognized upon the earlier of the receipt by the Company of the licensee’s report related to its usage of the licensed intellectual property or upon payment by the licensee.
The Company’s terms of sales with distributors are generally Free on Board, or FOB, shipping point with payment due within 60 days. All products go through in-house testing and verification of specifications before shipment. Apart from warranty reserves, credits issued have not been material as a percentage of net sales. The Company’s distributors do not generally carry inventories of the Company’s products. Instead, the distributors place orders with the Company at or about the time they receive orders from their customers. The Company’s shipment terms to our distributors do not provide for credits or rights of return. Because the Company’s distributors do not generally carry inventories of our products, they do not have rights to price protection or to return products. At the time the Company ships products to the distributors, the price is fixed. Subsequent to the issuance of the invoice, there are no discounts or special terms. The Company does not give the buyer the right to return the product or to receive future price concessions. The Company’s arrangements do not include vendor consideration.
PRODUCT DEVELOPMENT COSTS AND CAPITALIZED SOFTWARE
The Company capitalizes its systems software development costs incurred after a system achieves technological feasibility and before first commercial shipment. Such costs typically represent a small portion of total research and development costs. No system software development costs were capitalized or amortized in fiscal 2012, 2011 or 2010.
ALLOWANCE FOR DOUBTFUL ACCOUNTS
The Company maintains an allowance for doubtful accounts to reserve for potentially uncollectible trade receivables. The Company also reviews its trade receivables by aging category to identify specific customers with known disputes or collection issues. The Company exercises judgment when determining the adequacy of these reserves as the Company evaluates historical bad debt trends, general economic conditions in the United States and internationally and changes in customer financial conditions. Uncollectible receivables are recorded as bad debt expense when all efforts to collect have been exhausted and recoveries are recognized when they are received.
WARRANTY OBLIGATIONS
The Company provides and records the estimated cost of product warranties at the time revenues are recognized on products shipped. While the Company engages in extensive product quality programs and processes, including actively
20
monitoring and evaluating the quality of its component suppliers, the Company’s warranty obligation is affected by product failure rates, material usage and service delivery costs incurred in correcting a product failure. The Company’s estimate of warranty reserve is based on management’s assessment of future warranty obligations and on historical warranty obligations. Should actual product failure rates, material usage or service delivery costs differ from the Company’s estimates, revisions to the estimated warranty liability would be required, which could affect how the Company accounts for expenses.
INVENTORY OBSOLESCENCE
In each of the last three fiscal years, the Company has written down its inventory for estimated obsolescence or unmarketable inventory by an amount equal to the difference between the cost of inventory and the estimated market value based upon assumptions about future demand and market conditions. If future market conditions are less favorable than those projected by management, additional inventory write-downs may be required.
IMPAIRMENT OF GOODWILL
Goodwill represents the excess of the purchase price over the fair value of tangible and identifiable intangible net assets acquired in the Company’s acquisition of its Japanese subsidiary. The Company reviews goodwill annually or whenever events or circumstances indicate that a decline in value may have occurred. Based on the fair market value of the Company’s common stock relative to its book value and revised estimates for its future cash flow and revenue projections, the Company determined that indicators of impairment for its goodwill were present during fiscal year 2009. As a result, the Company tested the goodwill for impairment, determined that it was impaired and recorded a non-cash impairment of goodwill charge of $274,000 for the fiscal year ended May 31, 2009, bringing the net value to zero. Both gross goodwill and accumulated impairment were each $274,000 at May 31, 2012, 2011 and 2010.
INVESTMENT IMPAIRMENT
The Company records an investment impairment charge when it believes an investment has experienced a decline in value that is other than temporary. Future adverse changes in market conditions or poor operating results of underlying investments could result in losses or an inability to recover the carrying value of the investments that may not be reflected in an investment’s current carrying value, thereby possibly requiring an impairment charge in the future.
INCOME TAXES
Income taxes have been provided using the liability method whereby deferred tax assets and liabilities are determined based on differences between financial reporting and tax bases of assets and liabilities and net operating loss and tax credit carryforwards measured using the enacted tax rates and laws that will be in effect when the differences are expected to reverse or the carryforwards are utilized. Valuation allowances are established when it is determined that it is more likely than not that such assets will not be realized.
During the fiscal year ended May 31, 2008 a partial release of the valuation allowance previously established was made based upon the Company’s current level of profitability and the level of forecasted future earnings. During fiscal 2009, a full valuation allowance was established against all deferred tax assets as management determined that it is more likely than not that certain deferred tax assets will not be realized.
The Company accounts for uncertain tax positions consistent with authoritative guidance. The guidance prescribes a “more likely than not” recognition threshold and measurement attribute for the financial statement recognition and measurement of a tax position taken or expected to be taken in a tax return. The Company does not expect any material change in its unrecognized tax benefits over the next twelve months. The Company recognizes interest and penalties related to unrecognized tax benefits as a component of income taxes.
Although the Company files U.S. federal, various state and foreign tax returns, the Company’s only major tax jurisdictions are the United States, California, Germany and Japan. Tax years 1996 – 2011 remain subject to examination by the appropriate governmental agencies due to tax loss carryovers from those years.
STOCK-BASED COMPENSATION EXPENSE
Stock-based compensation expense consists of expenses for stock options and employee stock purchase plan, or ESPP, shares. Stock-based compensation cost is measured at each grant date, based on the fair value of the award using the Black-Scholes option valuation model, and is recognized as expense over the employee’s requisite service period. This model was developed for use in estimating the value of publicly traded options that have no vesting restrictions and
21
are fully transferable. The Company’s employee stock options have characteristics significantly different from those of publicly traded options. All of the Company’s stock compensation is accounted for as an equity instrument.
The fair value of each option grant and the right to purchase shares under the Company’s stock purchase plan are estimated on the date of grant using the Black-Scholes option valuation model with assumptions concerning expected term, stock price volatility, expected dividend yield, risk-free interest rate and the expected life of the award. In the second quarter of fiscal 2010, the seven officers of the Company elected to forfeit certain stock options previously granted. The forfeiture of these options resulted in the immediate recognition of the unamortized portion of stock compensation expense of $0.5 million. See Note 1 for additional information relating to stock-based compensation. See Notes 9 and 10 for detailed information regarding the stock option plan and the ESPP.
RESULTS OF OPERATIONS
The following table sets forth statements of operations data as a percentage of net sales for the periods indicated.
|
Year Ended May 31,
|
||||||||||||
|
2012
|
2011
|
2010
|
||||||||||
|
Net sales
|
||||||||||||
|
Product sales
|
100.0 | % | 100.0 | % | 76.5 | % | ||||||
|
Cancellation charges
|
-- | -- | 23.5 | |||||||||
|
Total net sales
|
100.0 | 100.0 | 100.0 | |||||||||
|
Cost of sales
|
60.0 | 59.9 | 47.7 | |||||||||
|
Gross profit
|
40.0 | 40.1 | 52.3 | |||||||||
|
Operating expenses:
|
||||||||||||
|
Selling, general and administrative
|
42.0 | 43.4 | 52.2 | |||||||||
|
Research and development
|
27.0 | 33.2 | 40.8 | |||||||||
|
Gain on bankruptcy claim
|
-- | (6.0 | ) | (34.2 | ) | |||||||
|
Total operating expenses
|
69.0 | 70.6 | 58.8 | |||||||||
|
Loss from operations
|
(29.0 | ) | (30.5 | ) | (6.5 | ) | ||||||
|
Interest income
|
-- | -- | 0.1 | |||||||||
|
Gain on sale of long-term investment
|
6.4 | -- | -- | |||||||||
|
Other income, net
|
0.7 | 5.6 | 1.1 | |||||||||
|
Loss before income tax benefit
|
(21.9 | ) | (24.9 | ) | (5.3 | ) | ||||||
|
Income tax benefit
|
(0.1 | ) | (0.3 | ) | (1.2 | ) | ||||||
|
Net loss
|
(21.8 | )% | (24.6 | )% | (4.1 | )% | ||||||
FISCAL YEAR ENDED MAY 31, 2012 COMPARED TO FISCAL YEAR ENDED MAY 31, 2011
NET SALES. Net sales consist primarily of sales of systems, test fixtures, die carriers, upgrades and spare parts as well as revenues from service contracts. Net sales increased to $15.5 million for the fiscal year ended May 31, 2012 from $13.7 million for the fiscal year ended May 31, 2011, an increase of 13%. The increase in net sales in fiscal 2012 was primarily due to an increase in net sales of the Company’s TDBI products, partially offset by a decrease of the Company’s wafer-level products. Net sales of the Company’s TDBI products for fiscal 2012 were $6.7 million, and increased approximately $2.4 million from fiscal 2011. Net sales of the wafer-level products for fiscal 2012 were $8.2 million, and decreased approximately $0.9 million from fiscal 2011.
GROSS PROFIT. Gross profit consists of net sales less cost of sales. Cost of sales consists primarily of the cost of materials, assembly and test costs, and overhead from operations. Gross profit increased to $6.2 million for the fiscal year ended May 31, 2012 from $5.5 million for the fiscal year ended May 31, 2011, an increase of 12.6% primarily due to an increase in net sales. Gross profit margin for the fiscal year ended May 31, 2012 was 40.0%, about flat with 40.1% for the fiscal year ended May 31, 2011.
22
SELLING, GENERAL AND ADMINISTRATIVE. Selling, general and administrative, or SG&A, expenses consist primarily of salaries and related costs of employees, customer support costs, commission expenses to independent sales representatives, product promotion, other professional services and bad debt expenses. SG&A expenses were $6.5 million for the fiscal year ended May 31, 2012, compared with $6.0 million for the fiscal year ended May 31, 2011, an increase of 9.4%. The increase in SG&A expenses was primarily due to increases of $0.2 million of sales expenses related to the pre-sales support, $0.1 million in employment related expenses and $0.1 million of commissions paid to outside sales representatives.
RESEARCH AND DEVELOPMENT. Research and development, or R&D, expenses consist primarily of salaries and related costs of employees engaged in ongoing research, design and development activities, costs of engineering materials and supplies and professional consulting expenses. R&D expenses decreased to $4.2 million for the fiscal year ended May 31, 2012 from $4.6 million for the fiscal year ended May 31, 2011, a decrease of 8.3%. The decrease in R&D expenses was primarily due to a decrease in employment related expenses.
GAIN ON BANKRUPTCY CLAIM. Spansion, the Company’s largest customer in fiscal 2012, 2011 and 2010, filed for bankruptcy in Japan in February 2009 and in the United States in March 2009. The Company filed claims in the Spansion U.S. and Spansion Japan bankruptcy actions. In fiscal 2011, the Company's Japanese subsidiary received $0.8 million in proceeds from the Spansion Japan bankruptcy claim and recorded the amount as a reduction of operating expenses.
INTEREST INCOME. Interest income decreased to nil for the fiscal year ended May 31, 2012 from $3,000 for the fiscal year ended May 31, 2011.
INTEREST EXPENSE. Interest expense was $4,000 for the fiscal year ended May 31, 2012, compared with nil for the fiscal year ended May 31, 2011.
GAIN ON SALE OF LONG-TERM INVESTMENT. During the first quarter of fiscal 2012, the Company sold its long-term investment in ESA Electronics PTE Ltd, resulting in a gain of approximately $1.0 million.
OTHER INCOME, NET. Other income, net decreased to $117,000 for the fiscal year ended May 31, 2012 from $762,000 for the fiscal year ended May 31, 2011. Other income for the fiscal year ended May 31, 2011 was primarily attributable to the receipt of a $575,000 dividend payment related to a long-term investment in ESA Electronics PTE Ltd. This long-term investment was sold in the first quarter of fiscal 2012.
INCOME TAX BENEFIT. Income tax benefit was $15,000 for the fiscal year ended May 31, 2012, compared with income tax benefit of $49,000 for the fiscal year ended May 31, 2011. The income tax benefits for the fiscal year ended May 31, 2012 and 2011 were due to the expiration of the statute of limitations related to the adoption of FIN-48.
FISCAL YEAR ENDED MAY 31, 2011 COMPARED TO FISCAL YEAR ENDED MAY 31, 2010
NET SALES. Net sales consist primarily of sales of systems, test fixtures, die carriers, upgrades and spare parts as well as revenues from service contracts. Net sales increased to $13.7 million for the fiscal year ended May 31, 2011 from $11.7 million for the fiscal year ended May 31, 2010, an increase of 17.7%. Net sales for the fiscal year ended May 31, 2010 included $8.9 million of product sales and $2.7 million of cancellation charges, resulting from the Spansion bankruptcy. No similar cancellation charges were recorded in fiscal 2011. The increase in net sales in fiscal 2011 resulted primarily from an increase in net sales of the Company’s wafer-level products. Net sales of the Company’s wafer-level products in fiscal 2011 were $9.1 million, and increased $1.5 million from fiscal 2010.
GROSS PROFIT. Gross profit consists of net sales less cost of sales. Cost of sales consists primarily of the cost of materials, assembly and test costs, and overhead from operations. Gross profit decreased to $5.5 million for the fiscal year ended May 31, 2011 from $6.1 million for the fiscal year ended May 31, 2010. Gross profit margin decreased to 40.1% for the fiscal year ended May 31, 2011 from 52.3% for the fiscal year ended May 31, 2010, primarily because the cancellation charges resulting from the Spansion bankruptcy, recorded in fiscal 2010, had no related cost of sales. No similar cancellation charges were recorded in fiscal 2011.
SELLING, GENERAL AND ADMINISTRATIVE. Selling, general and administrative, or SG&A, expenses consist primarily of salaries and related costs of employees, customer support costs, commission expenses to independent sales representatives, product promotion, other professional services and bad debt expenses. SG&A expenses were $6.0 million for the fiscal year ended May 31, 2011, compared with $6.1 million for the fiscal year ended May 31, 2010, a decrease of 2.1%. The decrease in SG&A expenses was primarily due to a decrease in employment related expenses. The decrease in employment related expenses was primarily due to a decrease of $0.4 million in stock compensation
23
expense which included the impact from the $0.5 million forfeited options in fiscal 2010, offset by an increase in salary expense of $0.2 million from the elimination of certain cost reduction initiatives previously implemented.
RESEARCH AND DEVELOPMENT. Research and development, or R&D, expenses consist primarily of salaries and related costs of employees engaged in ongoing research, design and development activities, costs of engineering materials and supplies and professional consulting expenses. R&D expenses decreased to $4.6 million for the fiscal year ended May 31, 2011 from $4.8 million for the fiscal year ended May 31, 2010, a decrease of 4.0%. This decrease was primarily attributable to the inclusion of a $0.2 million write-down of capital equipment in fiscal 2010.
GAIN ON BANKRUPTCY CLAIM. Spansion, the Company’s largest customer in fiscal 2009, 2010 and 2011, filed for bankruptcy in Japan in February 2009 and in the United States in March 2009. The Company filed a claim in the Spansion U.S. bankruptcy action. In the first quarter of fiscal 2010, the Company sold a portion of its bankruptcy claim to a third party for net proceeds of $3.3 million and recorded the amount as a reduction of operating expenses. In the third quarter of fiscal 2010, the Company sold the remaining balance of its Spansion U.S. bankruptcy claim to a third party for net proceeds of $4.6 million and recorded $0.6 million as a reduction of operating expenses. The portion of the claim representing cancellation charges and product shipments were recorded as revenue in fiscal 2010. In the fourth quarter of fiscal 2010, the Company received the remaining payment of $0.1 million due from its bankruptcy claim sale completed in the first quarter of fiscal 2010 and recognized the amount as a reduction of operating expenses. In the first quarter of fiscal 2011, the Company's Japanese subsidiary received approximately $155,000 in proceeds from the Spansion Japan bankruptcy claim and recorded the amount as a reduction of operating expenses. In the fourth quarter of fiscal 2011, the Company's Japanese subsidiary received approximately $677,000 in proceeds from the Spansion Japan bankruptcy claim and recorded the amount as a reduction of operating expenses.
INTEREST INCOME. Interest income decreased to $3,000 for the fiscal year ended May 31, 2011 from $5,000 for the fiscal year ended May 31, 2010, a decrease of $2,000.
OTHER INCOME, NET. Other income, net increased to $762,000 for the fiscal year ended May 31, 2011 from $131,000 for the fiscal year ended May 31, 2010. The increase in other income, net was primarily attributable to the receipt of a $575,000 dividend payment in the second quarter of fiscal 2011 related to a long-term investment.
INCOME TAX BENEFIT. Income tax benefit was $49,000 for the fiscal year ended May 31, 2011, compared with income tax benefit of $139,000 for the fiscal year ended May 31, 2010. The income tax benefit for the fiscal year ended May 31, 2010 was related to the increase in the net operating loss carry-back period from two to five years and the inclusion of alternative minimum taxes paid in the carry-back calculation. The income tax benefit for the fiscal year ended May 31, 2011 was due to the expiration of the statute of limitations related to the adoption of FIN-48.
LIQUIDITY AND CAPITAL RESOURCES
We consider cash and cash equivalents as liquid and available for use. As of May 31, 2012, the Company had $2.1 million in cash and cash equivalents, compared to $4.0 million as of May 31, 2011. This decrease resulted primarily from our operating loss, partially offset by a gain of approximately $1.0 million on sale of long-term investment in ESA Electronics PTE Ltd.
Net cash used in operating activities was $4.9 million and $4.1 million for the fiscal years ended May 31, 2012 and 2011, respectively. For the fiscal year ended May 31, 2012, net cash used in operating activities was primarily the result of the net loss of $3.4 million, as adjusted to exclude the effect of non-cash charges including stock-based compensation expense of $0.7 million and depreciation and amortization of $0.5 million, and a gain of approximately $1.0 million on the sale of the Company’s long-term investment in ESA Electronics PTE Ltd., and increases in accounts receivable of $1.3 million and inventories of $1.1 million, partially offset by an increase in accounts payable of $0.6 million. The increase in accounts receivable was primarily due to an increase in revenues in fiscal year 2012 compared to fiscal year 2011. The increase in inventories was to support future shipments for customer orders. The increase in accounts payable was due primarily to inventory purchases to support future shipments. For the fiscal year ended May 31, 2011, net cash used in operating activities was primarily the result of the net loss of $3.4 million as adjusted to exclude the effect of non-cash charges including stock-based compensation expense of $0.9 million and depreciation and amortization of $0.6 million, as well as the increase in inventories of $1.3 million. The increase in inventories was intended to support future shipments for customer orders.
Net cash provided by investing activities was $1.3 million for the fiscal year ended May 31, 2012 as compared to net cash used in investing activities of $15,000 for the fiscal year ended May 31, 2011. The increase during the fiscal year ended May 31, 2012 was due primarily to the $1.4 million in proceeds received from the sale of the Company’s long-
24
term investment in ESA Electronics PTE Ltd. Net cash used in investing activities during the fiscal year ended May 31, 2011 was primarily due to the purchase of property and equipment.
Financing activities provided cash of $1.6 million for the fiscal year ended May 31, 2012 as compared to $343,000 for the fiscal year ended May 31, 2011. Net cash provided by financing activities during the fiscal year ended May 31, 2012 was primarily due to a $1.4 million draw on our line of credit. Refer to Note 8 of Notes to Consolidated Financial Statements, “LINE OF CREDIT”, for further discussion of the credit facility agreement. Net cash provided by financing activities during the fiscal year ended May 31, 2011 was primarily due to proceeds from issuance of common stock and exercise of stock options.
As of May 31, 2012, the Company had working capital of $6.1 million. Working capital consists of cash and cash equivalents, accounts receivable, inventories and prepaid expenses and other current assets, less current liabilities.
As of May 31, 2011, the Company had $4.0 million in cash and cash equivalents, compared to $7.8 million as of May 31, 2010. This decrease resulted primarily from our operating loss.
For the fiscal year ended May 31, 2010, net cash provided by operating activities was primarily the result of the net loss of $0.5 million as adjusted to exclude the effect of non-cash charges including stock-based compensation expense of $1.7 million and depreciation and amortization of $0.7 million, as well as the decrease in inventories of $0.8 million. The decrease in inventories was primarily due to the sale of certain goods from existing stock on hand, without subsequent purchases of replacement raw materials in fiscal 2010.
Net cash used in investing activities was $69,000 for the fiscal year ended May 31, 2010. Net cash used in investing activities during the fiscal year ended May 31, 2010 was primarily due to the purchase of property and equipment.
Financing activities provided cash of $176,000 for the fiscal year ended May 31, 2010. Net cash provided by financing activities during the fiscal year ended May 31, 2010 was primarily due to proceeds from issuance of common stock and exercise of stock options.
As of May 31, 2011, the Company had working capital of $8.0 million.
The Company leases its manufacturing and office space under operating leases. The Company entered into a non-cancelable operating lease agreement for its United States manufacturing and office facilities, which commenced in April 2008 and expires in June 2015. Under the lease agreement, the Company is responsible for payments of utilities, taxes and insurance.
From time to time, the Company evaluates potential acquisitions of businesses, products or technologies that complement the Company’s business. If consummated, any such transactions may use a portion of the Company’s working capital or require the issuance of equity. The Company has no present understandings, commitments or agreements with respect to any material acquisitions.
The Company anticipates that the existing cash balance together with cash flows from operations, as well as funds available through the working capital credit facility will be adequate to meet its working capital and capital equipment requirements through fiscal 2013. The Company expects to become profitable and to return to positive cash flow by the end of calendar year 2012. Refer to Note 8 of Notes to Consolidated Financial Statements, “LINE OF CREDIT”, for further discussion of the credit facility agreement. After fiscal 2013, depending on its rate of growth and profitability, the Company may require additional equity or debt financing to meet its working capital requirements or capital equipment needs. There can be no assurance that additional financing will be available when required, or if available, that such financing can be obtained on terms satisfactory to the Company.
OFF-BALANCE SHEET FINANCING
The Company has not entered into any off-balance sheet financing arrangements and has not established any special purpose entities.
OVERVIEW OF CONTRACTUAL OBLIGATIONS
The following table provides a summary of such arrangements, or contractual obligations.
25
|
Payments Due by Period (in thousands)
|
||||||||||||||||||||
|
Total
|
Less than
1 year
|
1-3
years
|
3-5
years
|
5
years
|
||||||||||||||||
|
Operating Leases
|
$ | 1,819 | $ | 596 | $ | 1,223 | $ | -- | $ | -- | ||||||||||
|
Purchases(1)
|
1,343 | 1,343 | -- | -- | -- | |||||||||||||||
|
Total
|
$ | 3,162 | $ | 1,939 | $ | 1,223 | $ | -- | $ | -- | ||||||||||
(1) Shown above are the Company’s binding purchase obligations. The large majority of the Company’s purchase orders are cancelable by either party, which if canceled may result in a negotiation with the vendor to determine if there shall be any restocking or cancellation fees payable to the vendor.
In the normal course of business to facilitate sales of its products, the Company indemnifies other parties, including customers, with respect to certain matters. The Company has agreed to hold the other party harmless against losses arising from a breach of representations or covenants, or from intellectual property infringement or other claims. These agreements may limit the time period within which an indemnification claim can be made and the amount of the claim. In addition, the Company has entered into indemnification agreements with its officers and directors, and the Company’s bylaws contain similar indemnification obligations to the Company’s agents.
It is not possible to determine the maximum potential amount under these indemnification agreements due to the limited history of prior indemnification claims and the unique facts and circumstances involved in each particular agreement. To date, payments made by the Company under these agreements have not had a material impact on the Company’s operating results, financial position or cash flows.
RECENT ACCOUNTING PRONOUNCEMENTS:
In October 2009, the Financial Accounting Standards Board, or FASB, issued authoritative guidance for revenue recognition with multiple deliverables. This authoritative guidance defines the criteria for identifying individual deliverables in a multiple-element arrangement and the manner in which revenues are allocated to individual deliverables. In absence of vendor-specific objective evidence, or VSOE, or other third party evidence, or TPE, of the selling price for the deliverables in a multiple-element arrangement, guidance requires companies to use an estimated selling price, or ESP, for the individual deliverables. Companies shall apply the relative-selling price model for allocating an arrangement’s total consideration to its individual elements. Under this model, the ESP is used for both the delivered and undelivered elements that do not have VSOE or TPE of the selling price. This guidance is effective for fiscal years beginning on or after June 15, 2010, and was applied prospectively to revenue arrangements entered into or materially modified after the effective date. The Company adopted this standard in the first quarter of fiscal year 2012.
In October 2009, the FASB issued authoritative guidance for the accounting for certain revenue arrangements that include software elements. This authoritative guidance amends the scope of pre-existing software revenue guidance by removing from the guidance non-software components of tangible products and certain software components of tangible products. This guidance is effective for fiscal years beginning on or after June 15, 2010, and was applied prospectively to revenue arrangements entered into or materially modified after the effective date. The Company adopted this standard in the first quarter of fiscal year 2012.
These standards did not have a material impact on the Company’s condensed consolidated financial statements.
In May 2011 updated authoritative guidance to amend existing requirements for fair value measurements and disclosures was issued. The guidance expands the disclosure requirements around fair value measurements categorized in Level 3 of the fair value hierarchy and requires disclosure of the level in the fair value hierarchy of items that are not measured at fair value but whose fair value must be disclosed. It also clarifies and expands upon existing requirements for fair value measurements of financial assets and liabilities as well as instruments classified in shareholders’ equity. The guidance will be effective for fiscal years, and interim periods within those years, beginning after December 15, 2011, and are to be applied prospectively. The Company will adopt this guidance in the first quarter of fiscal 2013. The implementation of this authoritative guidance is not expected to have a material impact on the Company’s financial position or results of operations.
In June 2011, authoritative guidance was issued on the presentation of comprehensive income to require an entity to present the total of comprehensive income, the components of net income, and the components of other
26
comprehensive income either in a single continuous statement of comprehensive income or in two separate but consecutive statements. This authoritative guidance eliminates the option to present the components of other comprehensive income as part of the statement of shareholders’ equity. This guidance is effective for fiscal years, and interim periods within those years, beginning after December 15, 2011. The implementation of this authoritative guidance will change the presentation of comprehensive income only.
Item 7A. Quantitative and Qualitative Disclosures about Market Risk
The Company had no holdings of derivative financial or commodity instruments at May 31, 2012.
The Company is exposed to financial market risks, including changes in interest rates and foreign currency exchange rates. The Company only invests its short-term excess cash in government-backed securities with maturities of 18 months or less. The Company maintained a cost basis equity investment in a privately held company, ESA Electronics PTE Ltd through May 2011. This investment was sold in the first quarter of fiscal 2012. The Company does not use any financial instruments for speculative or trading purposes. Fluctuations in interest rates would not have a material effect on the Company’s financial position, results of operations or cash flows.
A majority of the Company’s revenue and capital spending is transacted in U.S. Dollars. The Company, however, enters into transactions in other currencies, primarily Japanese Yen. Substantially all sales to Japanese customers are denominated in Yen. Since the price is determined at the time a purchase order is accepted, the Company is exposed to the risks of fluctuations in the Yen-U.S. Dollar exchange rate during the lengthy period from purchase order to ultimate payment. This exchange rate risk is partially offset to the extent that the Company’s Japanese subsidiary incurs expenses payable in Yen. To date, the Company has not invested in instruments designed to hedge currency risks. In addition, the Company’s Japanese subsidiary typically carries debt or other obligations due to the Company that may be denominated in either Yen or U.S. Dollars. Since the Japanese subsidiary’s financial statements are based in Yen and the Company’s condensed consolidated financial statements are based in U.S. Dollars, the Japanese subsidiary and the Company recognize foreign exchange gain or loss in any period in which the value of the Yen rises or falls in relation to the U.S. Dollar. A 10% decrease in the value of the Yen as compared with the U.S. Dollar would not be expected to result in a significant change to the Company’s net income or loss. There have been no material changes in our risk exposure since the end of fiscal 2011, nor are any material changes to our risk exposure anticipated.
27
Item 8. Financial Statements and Supplementary Data
INDEX
|
Consolidated Financial Statements of Aehr Test Systems
|
||||
|
Report of Independent Registered Public Accounting Firm
|
29 | |||
|
Consolidated Balance Sheets at May 31, 2012 and 2011
|
30 | |||
|
Consolidated Statements of Operations for the years ended May 31, 2012, 2011 and 2010
|
31 | |||
|
Consolidated Statements of Shareholders' Equity and Comprehensive Income (Loss) for the years ended May 31, 2012, 2011 and 2010
|
32 | |||
|
Consolidated Statements of Cash Flows for the years ended May 31, 2012, 2011 and 2010
|
33 | |||
|
Notes to Consolidated Financial Statements
|
34 | |||
|
Financial statement schedules not listed above are either omitted because they are not applicable or the required information is shown in the Consolidated
Financial Statements or in the Notes thereto. |
||||
28
REPORT OF
INDEPENDENT REGISTERED PUBLIC ACCOUNTING FIRM
To the Board of Directors and Shareholders of
Aehr Test Systems
We have audited the accompanying consolidated balance sheets of Aehr Test Systems and its subsidiaries (the “Company”) as of May 31, 2012 and 2011, and the related consolidated statements of operations, shareholders’ equity and comprehensive income (loss), and cash flows for each of the three years in the period ended May 31, 2012. These consolidated financial statements are the responsibility of the Company’s management. Our responsibility is to express an opinion on these consolidated financial statements based on our audits.
We conducted our audits in accordance with the standards of the Public Company Accounting Oversight Board (United States). Those standards require that we plan and perform the audit to obtain reasonable assurance about whether the financial statements are free of material misstatement. The Company is not required to have, nor have we been engaged to perform, an audit of the Company’s internal control over financial reporting. Our audits included consideration of internal control over financial reporting as a basis for designing audit procedures that are appropriate in the circumstances, but not for the purpose of expressing an opinion on the effectiveness of the Company’s internal control over financial reporting. Accordingly, we express no such opinion. An audit also includes examining, on a test basis, evidence supporting the amounts and disclosures in the financial statements, assessing the accounting principles used and significant estimates made by management, as well as evaluating the overall financial statement presentation. We believe that our audits provide a reasonable basis for our opinion.
In our opinion, the consolidated financial statements referred to above present fairly, in all material respects, the financial position of Aehr Test Systems and its subsidiaries as of May 31, 2012 and 2011, and the results of their operations and their cash flows for each of the three years in the period ended May 31, 2012 in conformity with accounting principles generally accepted in the United States of America.
/s/ Burr Pilger Mayer, Inc.
E. Palo Alto, California
August 28, 2012
29
AEHR TEST SYSTEMS AND SUBSIDIARIES
CONSOLIDATED BALANCE SHEETS
(IN THOUSANDS, EXCEPT PER SHARE DATA)
|
May 31,
|
||||||||
|
2012
|
2011
|
|||||||
|
ASSETS
|
||||||||
|
Current assets:
|
||||||||
|
Cash and cash equivalents
|
$ | 2,073 | $ | 4,020 | ||||
|
Accounts receivable, net
|
2,588 | 1,432 | ||||||
|
Inventories
|
6,070 | 4,958 | ||||||
|
Prepaid expenses and other
|
197 | 161 | ||||||
|
Total current assets
|
10,928 | 10,571 | ||||||
|
Property and equipment, net
|
510 | 954 | ||||||
|
Other assets
|
175 | 558 | ||||||
|
Total assets
|
$ | 11,613 | $ | 12,083 | ||||
|
LIABILITIES AND SHAREHOLDERS' EQUITY
|
||||||||
|
Current liabilities:
|
||||||||
|
Line of credit
|
$ | 1,408 | $ | -- | ||||
|
Accounts payable
|
1,507 | 885 | ||||||
|
Accrued expenses
|
1,385 | 1,434 | ||||||
|
Deferred revenue
|
555 | 221 | ||||||
|
Total current liabilities
|
4,855 | 2,540 | ||||||
|
Income tax payable
|
125 | 204 | ||||||
|
Deferred lease commitment
|
179 | 238 | ||||||
|
Total liabilities
|
5,159 | 2,982 | ||||||
|
Commitments and contingencies (Note 15)
|
||||||||
|
Shareholders' equity:
|
||||||||
|
Preferred stock, $0.01 par value:
|
||||||||
|
Authorized: 10,000 shares;
|
||||||||
|
Issued and outstanding: none
|
-- | -- | ||||||
|
Common stock, $0.01 par value:
|
||||||||
|
Authorized: 75,000 shares;
|
||||||||
|
Issued and outstanding: 9,135 shares and 8,932
|
||||||||
|
shares at May 31, 2012 and 2011, respectively
|
91 | 89 | ||||||
|
Additional paid-in capital
|
48,622 | 47,747 | ||||||
|
Accumulated other comprehensive income
|
2,458 | 2,593 | ||||||
|
Accumulated deficit
|
(44,717 | ) | (41,328 | ) | ||||
|
Total shareholders' equity
|
6,454 | 9,101 | ||||||
|
Total liabilities and shareholders' equity
|
$ | 11,613 | $ | 12,083 | ||||
The accompanying notes are an integral part of these consolidated financial statements.
30
AEHR TEST SYSTEMS AND SUBSIDIARIES
CONSOLIDATED STATEMENTS OF OPERATIONS
(IN THOUSANDS, EXCEPT PER SHARE DATA)
|
Year Ended May 31,
|
||||||||||||
|
2012
|
2011
|
2010
|
||||||||||
|
Net sales
|
||||||||||||
|
Product sales
|
$ | 15,521 | $ | 13,737 | $ | 8,934 | ||||||
|
Cancellation charges
|
-- | -- | 2,740 | |||||||||
|
Total net sales
|
15,521 | 13,737 | 11,674 | |||||||||
|
Cost of sales
|
9,314 | 8,225 | 5,571 | |||||||||
|
Gross profit
|
6,207 | 5,512 | 6,103 | |||||||||
|
Operating expenses:
|
||||||||||||
|
Selling, general and administrative
|
6,526 | 5,964 | 6,094 | |||||||||
|
Research and development
|
4,188 | 4,567 | 4,758 | |||||||||
|
Gain on bankruptcy claim
|
-- | (832 | ) | (3,993 | ) | |||||||
|
Total operating expenses
|
10,714 | 9,699 | 6,859 | |||||||||
|
Loss from operations
|
(4,507 | ) | (4,187 | ) | (756 | ) | ||||||
|
Interest income
|
-- | 3 | 5 | |||||||||
|
Interest expense
|
(4 | ) | -- | -- | ||||||||
|
Gain on sale of long-term investment
|
990 | -- | -- | |||||||||
|
Other income, net
|
117 | 762 | 131 | |||||||||
|
Loss before income tax benefit
|
(3,404 | ) | (3,422 | ) | (620 | ) | ||||||
|
Income tax benefit
|
15 | 49 | 139 | |||||||||
|
Net loss
|
$ | (3,389 | ) | $ | (3,373 | ) | $ | (481 | ) | |||
|
Net loss per share – basic
|
$ | (0.38 | ) | $ | (0.38 | ) | $ | (0.06 | ) | |||
|
Shares used in per share calculation - basic
|
9,016 | 8,776 | 8,563 | |||||||||
|
Net loss per share – diluted
|
$ | (0.38 | ) | $ | (0.38 | ) | $ | (0.06 | ) | |||
|
Shares used in per share calculation - diluted
|
9,016 | 8,776 | 8,563 | |||||||||
The accompanying notes are an integral part of these consolidated financial statements.
31
AEHR TEST SYSTEMS AND SUBSIDIARIES
CONSOLIDATED STATEMENTS OF SHAREHOLDERS' EQUITY
AND COMPREHENSIVE INCOME (LOSS)
(IN THOUSANDS)
|
Accumulated
|
||||||||||||||||||||||||
|
Other
|
||||||||||||||||||||||||
|
Comprehensive
|
||||||||||||||||||||||||
|
Income
|
||||||||||||||||||||||||
|
Additional
|
Cumulative
|
|||||||||||||||||||||||
|
Common Stock
|
Paid-in
|
Translation
|
Accumulated
|
|||||||||||||||||||||
|
Shares
|
Amount
|
Capital
|
Adjustment
|
Deficit
|
Total
|
|||||||||||||||||||
|
Balances, May 31, 2009
|
8,496 | $ | 85 | $ | 44,552 | $ | 2,800 | $ | (37,474 | ) | $ | 9,963 | ||||||||||||
|
Issuance of common stock
|
||||||||||||||||||||||||
|
under employee plans
|
168 | 2 | 174 | -- | -- | 176 | ||||||||||||||||||
|
Stock-based compensation
|
1,733 | -- | -- | 1,733 | ||||||||||||||||||||
|
Net loss
|
-- | -- | -- | -- | (481 | ) | (481 | ) | ||||||||||||||||
|
Foreign currency
|
||||||||||||||||||||||||
|
translation adjustment
|
-- | -- | -- | (110 | ) | -- | (110 | ) | ||||||||||||||||
|
Comprehensive loss
|
(591 | ) | ||||||||||||||||||||||
|
Balances, May 31, 2010
|
8,664 | 87 | 46,459 | 2,690 | (37,955 | ) | 11,281 | |||||||||||||||||
|
Issuance of common stock
|
||||||||||||||||||||||||
|
under employee plans
|
268 | 2 | 341 | -- | -- | 343 | ||||||||||||||||||
|
Stock-based compensation
|
947 | -- | -- | 947 | ||||||||||||||||||||
|
Net loss
|
-- | -- | -- | -- | (3,373 | ) | (3,373 | ) | ||||||||||||||||
|
Foreign currency
|
||||||||||||||||||||||||
|
translation adjustment
|
-- | -- | -- | (97 | ) | -- | (97 | ) | ||||||||||||||||
|
Comprehensive loss
|
(3,470 | ) | ||||||||||||||||||||||
|
Balances, May 31, 2011
|
8,932 | 89 | 47,747 | 2,593 | (41,328 | ) | 9,101 | |||||||||||||||||
|
Issuance of common stock
|
||||||||||||||||||||||||
|
under employee plans
|
203 | 2 | 166 | -- | -- | 168 | ||||||||||||||||||
|
Stock-based compensation
|
709 | -- | -- | 709 | ||||||||||||||||||||
|
Net loss
|
-- | -- | -- | -- | (3,389 | ) | (3,389 | ) | ||||||||||||||||
|
Foreign currency
|
||||||||||||||||||||||||
|
translation adjustment
|
-- | -- | -- | (135 | ) | -- | (135 | ) | ||||||||||||||||
|
Comprehensive loss
|
(3,524 | ) | ||||||||||||||||||||||
|
Balances, May 31, 2012
|
9,135 | $ | 91 | $ | 48,622 | $ | 2,458 | $ | (44,717 | ) | $ | 6,454 | ||||||||||||
The accompanying notes are an integral part of these consolidated financial statements.
32
AEHR TEST SYSTEMS AND SUBSIDIARIES
CONSOLIDATED STATEMENTS OF CASH FLOWS
(IN THOUSANDS)
|
Year Ended May 31,
|
||||||||||||
|
2012
|
2011
|
2010
|
||||||||||
|
Cash flows from operating activities:
|
||||||||||||
|
Net loss
|
$ | (3,389 | ) | $ | (3,373 | ) | $ | (481 | ) | |||
|
Adjustments to reconcile net loss to net cash
|
||||||||||||
|
(used in) provided by operating activities:
|
||||||||||||
|
Stock-based compensation expense
|
709 | 947 | 1,733 | |||||||||
|
Provision for doubtful accounts
|
16 | 15 | 59 | |||||||||
|
Loss on disposal of asset
|
1 | 1 | 301 | |||||||||
|
Gain on sale of long-term investment
|
(990 | ) | -- | -- | ||||||||
|
Depreciation and amortization
|
491 | 573 | 690 | |||||||||
|
Changes in operating assets and liabilities:
|
||||||||||||
|
Accounts receivable
|
(1,285 | ) | (501 | ) | 267 | |||||||
|
Inventories
|
(1,114 | ) | (1,322 | ) | 837 | |||||||
|
Prepaid expenses and other
|
(42 | ) | 287 | 423 | ||||||||
|
Accounts payable
|
570 | (353 | ) | (446 | ) | |||||||
|
Accrued expenses and deferred revenue
|
295 | (280 | ) | (138 | ) | |||||||
|
Income tax payable
|
(78 | ) | (94 | ) | 28 | |||||||
|
Deferred lease commitment
|
(59 | ) | (42 | ) | (26 | ) | ||||||
|
Net cash (used in) provided by
|
||||||||||||
|
operating activities
|
(4,875 | ) | (4,142 | ) | 3,247 | |||||||
|
Cash flows from investing activities:
|
||||||||||||
|
Proceeds from sale of investments
|
1,375 | -- | -- | |||||||||
|
Purchase of property and equipment
|
(45 | ) | (15 | ) | (69 | ) | ||||||
|
Net cash provided by (used in)
|
||||||||||||
|
investing activities
|
1,330 | (15 | ) | (69 | ) | |||||||
|
Cash flows from financing activities:
|
||||||||||||
|
Line of credit borrowings, net
|
1,408 | -- | -- | |||||||||
|
Proceeds from issuance of common stock
|
||||||||||||
|
and exercise of stock options
|
168 | 343 | 176 | |||||||||
|
Net cash provided by
|
||||||||||||
|
financing activities
|
1,576 | 343 | 176 | |||||||||
|
Effect of exchange rates on cash and
|
||||||||||||
|
cash equivalents
|
22 | 68 | 52 | |||||||||
|
Net (decrease) increase in cash and
|
||||||||||||
|
cash equivalents
|
(1,947 | ) | (3,746 | ) | 3,406 | |||||||
|
Cash and cash equivalents, beginning of year
|
4,020 | 7,766 | 4,360 | |||||||||
|
Cash and cash equivalents, end of year
|
$ | 2,073 | $ | 4,020 | $ | 7,766 | ||||||
|
Supplemental cash flow information:
|
||||||||||||
|
Cash paid during the year for:
|
||||||||||||
|
Income taxes
|
$ | 62 | $ | 51 | $ | -- | ||||||
|
Interest
|
$ | 4 | $ | -- | $ | -- | ||||||
The accompanying notes are an integral part of these consolidated financial statements.
33
AEHR TEST SYSTEMS AND SUBSIDIARIES
NOTES TO CONSOLIDATED FINANCIAL STATEMENTS
1. ORGANIZATION AND SUMMARY OF SIGNIFICANT ACCOUNTING POLICIES:
BUSINESS:
Aehr Test Systems (the “Company”) was incorporated in California in May 1977 and primarily designs, engineers and manufactures test and burn-in equipment used in the semiconductor industry. The Company’s principal products are the Advanced Burn-In and Test System, or ABTS, the FOX full wafer contact parallel test and burn-in systems, the MAX burn-in system, WaferPak full wafer contactor, the DiePak carrier and test fixtures.
LIQUIDITY:
Since inception, the Company has incurred substantial cumulative losses and negative cash flows from operations. During fiscal 2010, 2011 and 2012, the Company experienced a decrease in its net sales in recent years compared to previous years as a result of a major customer filing bankruptcy and a slowdown in the semiconductor manufacturing industry. In response to the low levels of net sales, the Company took significant steps to minimize expense levels and to increase the likelihood that it will have sufficient cash to support operations during the slow business periods. Those steps included reductions in headcount, reduced compensation for officers and other salaried employees, a Company-wide shutdown for one week each month and lower fees paid to the Board of Directors, among other spending cuts. The Company has subsequently eliminated some of these cuts. The Company will continue to explore methods to reduce its costs.
In August 2011, the Company entered into a working capital credit facility agreement allowing the Company to borrow up to $1.5 million based upon qualified U.S. based and foreign customer receivables, and export-related inventory. In May 2012, the credit agreement was amended to increase the borrowing limit to $2.0 million. Refer to Note 8, “LINE OF CREDIT”, for further discussion of the credit facility agreement.
During fiscal 2009, 2010, 2011 and fiscal 2012 we experienced operating losses. Due primarily to these operating losses, we experienced cash outflows and, at May 31, 2012, had $2.1 million in cash and cash equivalents, compared to $4.0 million at May 31, 2011. The Company expects to become profitable and to return to positive cash flow by the end of calendar year 2012. The Company anticipates that the existing cash balance together with cash flows from operations, as well as funds available through the working capital credit facility will be adequate to meet its working capital and capital equipment requirements through fiscal 2013. After fiscal 2013, depending on its rate of growth and profitability, the Company may require additional equity or debt financing to meet its working capital requirements or capital equipment needs. There can be no assurance that additional financing will be available when required, or if available, that such financing can be obtained on terms satisfactory to the Company.
CONSOLIDATION AND EQUITY INVESTMENTS:
The consolidated financial statements include the accounts of the Company and both its wholly-owned and majority-owned foreign subsidiaries. Intercompany accounts and transactions have been eliminated. Equity investments in which the Company holds an equity interest less than 20 percent and over which the Company does not have significant influence are accounted for using the cost method. Dividends received from investees accounted for using the cost method are included in other income, net on the Consolidated Statements of Operations.
FOREIGN CURRENCY TRANSLATION AND TRANSACTIONS:
Assets and liabilities of the Company’s foreign subsidiaries and branch office are translated into U.S. Dollars from their functional currencies of Japanese Yen, Euros and New Taiwan Dollars using the exchange rate in effect at the balance sheet date. Additionally, their net sales and expenses are translated using exchange rates approximating average rates prevailing during the fiscal year. Translation adjustments that arise from translating their financial statements from their local currencies to U.S. Dollars are accumulated and reflected as a separate component of shareholders’ equity.
Transaction gains and losses that arise from exchange rate changes denominated in currencies other than the local currency are included in the statements of operations as incurred. See Note 12 for the detail of foreign exchange transaction gains for all periods presented.
34
USE OF ESTIMATES:
The preparation of financial statements in conformity with accounting principles generally accepted in the United States of America requires management to make estimates and assumptions that affect the reported amounts of assets and liabilities, disclosure of contingent assets and liabilities at the date of the financial statements and the reported amounts of revenues and expenses during the reporting period. Actual results could differ from those estimates. Significant estimates in the Company’s consolidated financial statements include allowance for doubtful accounts, valuation of inventory at the lower of cost or market, and warranty reserves.
CASH EQUIVALENTS AND INVESTMENTS:
Cash equivalents consist of money market instruments, commercial paper and other highly liquid investments purchased with an original maturity of three months or less. Short-term investments not classified as cash equivalents are classified as available-for-sale. These investments are reported at fair value with unrealized gains and losses, net of tax, if any, included as a component of shareholders’ equity.
FAIR VALUE OF FINANCIAL INSTRUMENTS AND MEASUREMENT:
On June 1, 2008, the Company adopted authoritative guidance for fair value measurements and the fair value option for financial assets and liabilities. This authoritative guidance defines fair value, establishes a framework for using fair value to measure assets and liabilities, and expands disclosures about fair value measurements.
In the first quarter of fiscal 2010, the Company adopted revised accounting guidance for the fair value measurements and disclosure for non-financial assets and non-financial liabilities, except for items that are recognized or disclosed at fair value in the financial statements on a recurring basis (at least annually).
The guidance establishes a fair value hierarchy that is intended to increase the consistency and comparability in fair value measurements and related disclosures. The fair value hierarchy is based on inputs to valuation techniques that are used to measure fair value that are either observable or unobservable. Observable inputs reflect assumptions market participants would use in pricing an asset or liability based on market data obtained from independent sources while unobservable inputs reflect a reporting entity’s pricing based upon their own market assumptions. The fair value hierarchy consists of the following three levels:
Level 1 - instrument valuations are obtained from real-time quotes for transactions in active exchange markets involving identical assets.
Level 2 - instrument valuations are obtained from readily-available pricing sources for comparable instruments.
Level 3 - instrument valuations are obtained without observable market values and require a high level of judgment to determine the fair value.
The following table summarizes the Company’s financial assets and liabilities measured at fair value on a recurring basis as of May 31, 2012 (in thousands):
|
Balance as of
|
||||||||||||||||
|
May 31, 2012
|
Level 1
|
Level 2
|
Level 3
|
|||||||||||||
|
Money market funds
|
$ | 2 | $ | 2 | $ | -- | $ | -- | ||||||||
|
Assets
|
$ | 2 | $ | 2 | $ | -- | $ | -- | ||||||||
|
Liabilities
|
$ | -- | $ | -- | $ | -- | $ | -- | ||||||||
The following table summarizes the Company’s financial assets and liabilities measured at fair value on a recurring basis as of May 31, 2011 (in thousands):
35
|
Balance as of
|
||||||||||||||||
|
May 31, 2011
|
Level 1
|
Level 2
|
Level 3
|
|||||||||||||
|
Money market funds
|
$ | 1,236 | $ | 1,236 | $ | -- | $ | -- | ||||||||
|
Assets
|
$ | 1,236 | $ | 1,236 | $ | -- | $ | -- | ||||||||
|
Liabilities
|
$ | -- | $ | -- | $ | -- | $ | -- | ||||||||
Financial instruments include cash, cash equivalents, receivables, accounts payable and certain other accrued liabilities. The fair value of cash, cash equivalents, receivables, accounts payable and certain other accrued liabilities are valued at their carrying value, which approximates fair value due to their short maturities.
The Company has at times invested in debt and equity of private companies, and may do so again in the future, as part of its business strategy. These investments are carried at cost and are included in “Other Assets” in the consolidated balance sheets. If the Company determines that an other-than-temporary decline exists in the fair value of an investment, the Company writes down the investment to its fair value and records the related write-down as an investment loss in “Other Income (Expense)” in its consolidated statements of operations. During the first quarter of fiscal 2012, the Company sold its long-term investment in ESA Electronics PTE Ltd for proceeds of approximately $1.4 million, resulting in a gain of $990,000. At May 31, 2011, the carrying value of the strategic investments was $384,000 and was included in other assets-long term on the accompanying condensed consolidated balance sheet.
ACCOUNTS RECEIVABLE AND ALLOWANCE FOR DOUBTFUL ACCOUNTS:
Accounts receivable are derived from the sale of products throughout the world to semiconductor manufacturers, semiconductor contract assemblers, electronics manufacturers and burn-in and test service companies. Accounts receivable are recorded at the invoiced amount and are not interest bearing. The Company maintains an allowance for doubtful accounts to reserve for potentially uncollectible trade receivables. The Company also reviews its trade receivables by aging category to identify specific customers with known disputes or collection issues. The Company exercises judgment when determining the adequacy of these reserves as the Company evaluates historical bad debt trends, general economic conditions in the United States and internationally, and changes in customer financial conditions. Uncollectible receivables are recorded as bad debt expense when all efforts to collect have been exhausted and recoveries are recognized when they are received. During the year ended May 31, 2009, the Company recorded a $13,558,000 increase in its allowance for doubtful accounts as a result of its major customer filing for bankruptcy. During the year ended May 31, 2010, the allowance for doubtful accounts decreased by $12,330,000 due primarily to the write-off of the Spansion U.S. accounts receivable reserved in the prior fiscal year. No significant adjustments to the allowance for doubtful accounts were recorded during the year ended May 31, 2011 or 2012.
CONCENTRATION OF CREDIT RISK:
The Company sells its products primarily to semiconductor manufacturers in North America, Asia, and Europe. As of May 31, 2012, approximately 52%, 25% and 23% of gross accounts receivable are from customers located in the United States, Asia and Europe, respectively. As of May 31, 2011, approximately 49%, 12% and 39% of gross accounts receivable are from customers located in the United States, Asia and Europe, respectively. Three customers accounted for 45%, 22% and 18% of gross accounts receivable at May 31, 2012. Three customers accounted for 41%, 17% and 11% of gross accounts receivable at May 31, 2011. Two customers accounted for 40% and 22% of net sales in fiscal 2012. Two customers accounted for 61% and 11% of net sales in fiscal 2011. The Company performs ongoing credit evaluations of its customers and generally does not require collateral. While the Company has historically maintained reserves within management expectations, as a result of the bankruptcy filing of a key customer during the fiscal year ended May 31, 2009, specific reserves were established. The specific reserves established for this customer accounted for virtually all the allowance for doubtful accounts at May 31, 2009. The Company uses letter of credit terms for some of its international customers.
The Company’s cash, cash equivalents, short-term cash deposits and short-term investments are generally deposited with major financial institutions in the United States, Japan, Germany and Taiwan. The Company invests its excess cash in money market funds and short-term cash deposits. The money market funds and short-term cash deposits bear the risk associated with each fund. The money market funds have variable interest rates, and the short-term cash deposits have fixed rates. The Company has not experienced any material losses on its money market funds or short-term cash deposits.
36
CONCENTRATION OF SUPPLY RISK:
The Company relies on subcontractors to manufacture many of the components and subassemblies used in its products. Quality or performance failures of the Company’s products or changes in its manufacturers’ financial or business condition could disrupt the Company’s ability to supply quality products to its customers and thereby have a material and adverse effect on its business and operating results. Some of the components and technologies used in the Company’s products are purchased and licensed from a single source or a limited number of sources. The loss of any of these suppliers may cause the Company to incur additional transition costs, result in delays in the manufacturing and delivery of its products, or cause it to carry excess or obsolete inventory and could cause it to redesign its products.
STRATEGIC INVESTMENTS:
The Company invests in debt and equity of private companies as part of its business strategy. These available for sale investments are carried at cost and are included in “Other Assets” in the consolidated balance sheets. If the Company determines that an other-than-temporary decline exists in the fair value of an investment, the Company writes down the investment to its fair value and records the related write-down as an investment loss in “Other Income (Expense)” in its consolidated statements of operations.
At May 31, 2011 the Company held a long-term investment in ESA Electronics PTE Ltd. The carrying value of the strategic investments at that date was $384,000. The investment had not been revalued at May 31, 2011 as the fair value was not readily determinable due to the investment being a privately held company based in Singapore. The Company maintains less than 20% of the voting rights of the company invested.
In June 2011, the Company sold all of its shares of ESA for approximately $1.4 million resulting in a gain of approximately $990,000 reported in the first quarter of fiscal 2012.
INVENTORIES:
Inventories include material, labor and overhead, and are stated at the lower of cost (first-in, first-out method) or market. Provisions for excess, obsolete and unusable inventories are made after management’s evaluation of future demand and market conditions. The Company adjusts inventory balances to approximate the lower of its manufacturing costs or market value. If actual future demand or market conditions become less favorable than those projected by management, additional inventory write-downs may be required, and would be reflected in cost of product revenue in the period the revision is made. During the year ended May 31, 2009, the Company recorded a $7,203,000 charge to cost of sales to reduce its inventory to net realizable value primarily as a result of the bankruptcy filing of its major customer.
PROPERTY AND EQUIPMENT:
Property and equipment are stated at cost less accumulated depreciation and amortization. Major improvements are capitalized, while repairs and maintenance are expensed as incurred. Leasehold improvements are amortized over the lesser of their estimated useful lives or the term of the related lease. Furniture, fixtures, machinery and equipment are depreciated on a straight-line basis over their estimated useful lives. The ranges of estimated useful lives for furniture, fixtures, machinery and equipment are generally as follows:
| Furniture and fixtures | 2 to 6 years | |
| Machinery and equipment | 4 to 6 years | |
| Test equipment | 4 to 6 years |
GOODWILL:
Goodwill represents the excess of the purchase price over the fair value of tangible and identifiable intangible net assets acquired in the Company’s acquisition of its Japanese subsidiary. The Company reviews goodwill annually or whenever events or circumstances indicate that a decline in value may have occurred. Based on the fair market value of the Company’s common stock relative to its book value and revised estimates for its future cash flow and revenue projections, the Company determined that indicators of impairment for its goodwill were present during fiscal year 2009. As a result, the Company tested the goodwill for impairment, determined that it was impaired and recorded a non-cash impairment of goodwill charge of $274,000 for the fiscal year ended May 31, 2009 bringing the net value to zero. Both gross goodwill and accumulated impairment were each $274,000 at May 31, 2012 and 2011.
37
REVENUE RECOGNITION:
The Company recognizes revenue upon the shipment of products or the performance of services when: (1) persuasive evidence of the arrangement exists; (2) services have been rendered; (3) the price is fixed or determinable; and (4) collectibility is reasonably assured. The Company's selling arrangements may include contractual customer acceptance provisions. The Company defers recognition of revenue for any amounts subject to acceptance until such acceptance occurs. When a sales agreement involves multiple deliverables, such as extended support provisions, training to be supplied after delivery of the systems, and test programs specific to customers’ routine applications, the multiple deliverables are evaluated to determine the unit of accounting. Judgment is required to properly identify the accounting units of multiple element transactions and the manner in which revenue is allocated among the accounting units. Judgments made, or changes to judgments made, may significantly affect the timing or amount of revenue recognition.
Revenue related to the multiple elements are allocated to each unit of accounting using the relative selling price hierarchy. Consistent with accounting guidance, the selling price is based upon vendor specific objective evidence (VSOE). If VSOE is not available, third party evidence (TPE) is used to establish the selling price. In the absence of VSOE or TPE, estimated selling price is used. We have adopted this guidance effective with the first quarter of fiscal 2012. Prior to fiscal 2012, revenue for arrangements containing multiple deliverables was allocated based upon estimated fair values. The adoption of the new revenue recognition accounting standards did not have a material impact on our consolidated financial statements.
Sales tax collected from customers is not included in net sales but rather recorded as a liability due to the respective taxing authorities. Provisions for the estimated future cost of warranty and installation are recorded at the time the products are shipped.
Royalty-based revenue related to licensing income from performance test boards and burn-in boards is recognized upon the earlier of the receipt by the Company of the licensee’s report related to its usage of the licensed intellectual property or upon payment by the licensee.
The Company’s terms of sales with distributors are generally FOB shipping point with payment due within 60 days. All products go through in-house testing and verification of specifications before shipment. Apart from warranty reserves, credits issued have not been material as a percentage of net sales. The Company’s distributors do not generally carry inventories of the Company’s products. Instead, the distributors place orders with the Company at or about the time they receive orders from their customers. The Company’s shipment terms to our distributors do not provide for credits or rights of return. Because the Company’s distributors do not generally carry inventories of our products, they do not have rights to price protection or to return products. At the time the Company ships products to the distributors, the price is fixed. Subsequent to the issuance of the invoice, there are no discounts or special terms. The Company does not give the buyer the right to return the product or to receive future price concessions. The Company’s arrangements do not include vendor consideration.
PRODUCT DEVELOPMENT COSTS AND CAPITALIZED SOFTWARE:
Costs incurred in the research and development of new products or systems are charged to operations as incurred. Costs incurred in the development of software programs for the Company’s products are charged to operations as incurred until technological feasibility of the software has been established. Generally, technological feasibility is established when the software module performs its primary functions described in its original specifications, contains features required for it to be usable in a production environment, is completely documented and the related hardware portion of the product is complete. After technological feasibility is established, any additional costs are capitalized. Capitalization of software costs ceases when the software is substantially complete and is ready for its intended use. Capitalized costs are amortized over the estimated life of the related software product using the greater of the units of sales or straight-line methods over ten years. No system software development costs were capitalized or amortized in fiscal 2012, 2011 and 2010.
IMPAIRMENT OF LONG-LIVED ASSETS:
In the event that facts and circumstances indicate that the carrying value of assets may be impaired, an evaluation of recoverability would be performed. If an evaluation is required, the estimated future undiscounted cash flows associated with the asset would be compared to the asset’s carrying value to determine if a write-down is required.
38
ADVERTISING COSTS:
The Company expenses all advertising costs as incurred and the amounts were not material for all periods presented.
SHIPPING AND HANDLING OF PRODUCTS:
Amounts billed to customers for shipping and handling of products are included in net sales. Costs incurred related to shipping and handling of products are included in cost of sales.
INCOME TAXES:
Income taxes have been provided using the liability method whereby deferred tax assets and liabilities are determined based on differences between financial reporting and tax bases of assets and liabilities and net operating loss and tax credit carryforwards measured using the enacted tax rates and laws that will be in effect when the differences are expected to reverse or the carryforwards are utilized. Valuation allowances are established when it is determined that it is more likely than not that such assets will not be realized.
During the fiscal year ended May 31, 2008 a partial release of the valuation allowance previously established was made based upon the Company’s current level of profitability and the level of forecasted future earnings. During fiscal 2009, a full valuation allowance was established against all deferred tax assets as management determined that it is more likely than not that certain deferred tax assets will not be realized.
The Company accounts for uncertain tax positions consistent with authoritative guidance. The guidance prescribes a “more likely than not” recognition threshold and measurement attribute for the financial statement recognition and measurement of a tax position taken or expected to be taken in a tax return. The Company does not expect any material change in its unrecognized tax benefits over the next twelve months. The Company recognizes interest and penalties related to unrecognized tax benefits as a component of income taxes.
Although the Company files U.S. federal, various state, and foreign tax returns, the Company’s only major tax jurisdictions are the United States, California, Germany and Japan. Tax years 1996 – 2011 remain subject to examination by the appropriate governmental agencies due to tax loss carryovers from those years.
STOCK-BASED COMPENSATION:
Stock-based compensation expense consists of expenses for stock options and employee stock purchase plan, or ESPP, shares. Stock-based compensation cost is measured at each grant date, based on the fair value of the award using the Black-Scholes option valuation model, and is recognized as expense over the employee’s requisite service period. This model was developed for use in estimating the value of publicly traded options that have no vesting restrictions and are fully transferable. The Company’s employee stock options have characteristics significantly different from those of publicly traded options. All of the Company’s stock compensation is accounted for as an equity instrument.
The following table summarizes compensation costs related to the Company’s stock-based compensation for the years ended May 31, 2012, 2011 and 2010, respectively (in thousands, except per share data):
|
Year Ended May 31,
|
||||||||||||
|
2012
|
2011
|
2010
|
||||||||||
|
Stock-based compensation in the form of employee
|
||||||||||||
|
stock options and ESPP shares, included in:
|
||||||||||||
|
Cost of sales
|
$ | 87 | $ | 108 | $ | 293 | ||||||
|
Selling, general and administrative
|
430 | 488 | 901 | |||||||||
|
Research and development
|
192 | 351 | 539 | |||||||||
|
Net effect on net loss
|
$ | 709 | $ | 947 | $ | 1,733 | ||||||
|
Effect on net loss per share:
|
||||||||||||
|
Basic
|
$ | 0.08 | $ | 0.11 | $ | 0.20 | ||||||
|
Diluted
|
$ | 0.08 | $ | 0.11 | $ | 0.20 | ||||||
During fiscal 2012, 2011 and fiscal 2010, the Company recorded stock-based compensation related to stock options of $613,000, $829,000 and $1,511,000, respectively.
39
In the second quarter of fiscal 2010, the seven officers of the Company elected to forfeit certain stock options previously granted. The forfeiture of these options resulted in the immediate recognition of the unamortized portion of stock compensation expense of $465,000.
As of May 31, 2012, the total compensation cost related to unvested stock-based awards under the Company’s 1996 Stock Option Plan and 2006 Equity Incentive Plan, but not yet recognized, was $818,000 which is net of estimated forfeitures of $2,000. This cost will be amortized on a straight-line basis over a weighted average period of approximately 3.2 years.
During fiscal 2012, 2011 and fiscal 2010, the Company recorded stock-based compensation related to its ESPP of $96,000, $118,000 and $222,000, respectively.
As of May 31, 2012, the total compensation cost related to options to purchase the Company’s common shares under the ESPP but not yet recognized was $55,000. This cost will be amortized on a straight-line basis over a weighted average period of approximately 1.0 years.
Valuation Assumptions
Valuation and Amortization Method. The Company estimates the fair value of stock options granted using the Black-Scholes option valuation method and a single option award approach. The fair value under the single option approach is amortized on a straight-line basis over the requisite service periods of the awards, which is generally the vesting period.
Expected Term. The Company’s expected term represents the period that the Company’s stock-based awards are expected to be outstanding and was determined based on historical experience, giving consideration to the contractual terms of the stock-based awards, vesting schedules and expectations of future employee behavior as evidenced by changes to the terms of its stock-based awards.
Expected Volatility. Volatility is a measure of the amounts by which a financial variable such as stock price has fluctuated (historical volatility) or is expected to fluctuate (expected volatility) during a period. The Company uses the historical volatility for the past five years, which matches the expected term of most of the option grants, to estimate expected volatility. Volatility for each of the ESPP’s four time periods of six months, twelve months, eighteen months, and twenty-four months is calculated separately and included in the overall stock-based compensation cost recorded.
Dividends. The Company has never paid any cash dividends on its common stock and does not anticipate paying any cash dividends in the foreseeable future. Consequently, the Company uses an expected dividend yield of zero in the Black-Scholes option valuation method.
Risk-Free Interest Rate. The Company bases the risk-free interest rate used in the Black-Scholes option valuation method on the implied yield in effect at the time of option grant on U.S. Treasury zero-coupon issues with a remaining term equivalent to the expected term of the stock awards including the ESPP.
Estimated Forfeitures. When estimating forfeitures, the Company considers voluntary termination behavior as well as analysis of actual option forfeitures.
Fair Value. The fair values of the Company’s stock options granted to employees and ESPP shares in fiscal 2012, 2011 and 2010 were estimated using the following weighted average assumptions in the Black-Scholes option valuation method:
|
Year Ended May 31,
|
||||||||||||
|
2012
|
2011
|
2010
|
||||||||||
|
Option Plan Shares
|
||||||||||||
|
Expected Term (in years)
|
5 | 5 | 5 | |||||||||
|
Volatility
|
0.84 | 0.80 | 0.78 | |||||||||
|
Expected Dividend
|
$ | 0.00 | $ | 0.00 | $ | 0.00 | ||||||
|
Risk-free Interest Rates
|
1.12 | % | 1.73 | % | 2.53 | % | ||||||
|
Weighted Average Grant Date Fair Value
|
$ | 0.60 | $ | 1.19 | $ | 0.56 | ||||||
40
The fair value of our ESPP purchase rights for the fiscal 2012, 2011 and 2010 was estimated using the following weighted-average assumptions:
|
Year End May 31,
|
||||||||||||
|
2012
|
2011
|
2010
|
||||||||||
|
Employee Stock Purchase Plan Shares
|
||||||||||||
|
Expected Term (in years)
|
0.5 - 2.0 | n/a | 0.5 - 2.0 | |||||||||
|
Volatility
|
0.79 – 0.95 | n/a | 0.89 – 1.01 | |||||||||
|
Expected Dividend
|
$0.00 | n/a | $0.00 | |||||||||
|
Risk-free Interest Rates
|
0.06%–1.05% | n/a | 0.2%–1.1% | |||||||||
|
Weighted Average Grant Date Fair Value
|
$0.40 | n/a | $0.84 | |||||||||
There were no ESPP purchase rights granted during the ESPP periods in fiscal 2011.
EARNINGS PER SHARE (“EPS”):
Basic EPS is computed by dividing net income (loss) available to common shareholders by the weighted average number of common shares outstanding for the period. Diluted EPS is computed after giving effect to all dilutive potential common shares that were outstanding during the period. Dilutive potential common shares consist of the incremental common shares issuable upon exercise of stock options for all periods.
A reconciliation of the numerator and denominator of basic and diluted EPS is provided as follows (in thousands, except per share amounts):
|
Year Ended May 31,
|
||||||||||||
|
2012
|
2011
|
2010
|
||||||||||
|
Numerator: Net loss
|
$ | (3,389 | ) | $ | (3,373 | ) | $ | (481 | ) | |||
|
Denominator for basic net loss per share:
|
||||||||||||
|
Weighted-average shares outstanding
|
9,016 | 8,776 | 8,563 | |||||||||
|
Shares used in basic net loss per share calculation
|
9,016 | 8,776 | 8,563 | |||||||||
|
Effect of dilutive securities
|
-- | -- | -- | |||||||||
|
Denominator for diluted net loss per share
|
9,016 | 8,776 | 8,563 | |||||||||
|
Basic net loss per share
|
$ | (0.38 | ) | $ | (0.38 | ) | $ | (0.06 | ) | |||
|
Diluted net loss per share
|
$ | (0.38 | ) | $ | (0.38 | ) | $ | (0.06 | ) | |||
For purposes of computing diluted earnings per share, weighted average potential common shares do not include stock options with an exercise price greater than the average fair value of the Company’s common stock for the period, as the effect would be anti-dilutive. Potential common shares have not been included in the calculation of diluted net loss per share for the fiscal years ended May 31, 2012, 2011 and 2010, as the effect would be anti-dilutive due to the Company’s net loss. As such the numerator and the denominator used in computing both basic and diluted net loss per share for fiscal years ended May 31, 2012, 2011 and 2010 are the same. Stock options to purchase 2,957,000, 2,083,000 and 1,949,000 shares of common stock were outstanding on May 31, 2012, 2011 and 2010, respectively, but not included in the computation of diluted income per share, because the inclusion of such shares would be anti-dilutive.
COMPREHENSIVE INCOME (LOSS):
Comprehensive income (loss) generally represents all changes in shareholders’ equity except those resulting from investments or contributions by shareholders. Unrealized gains (losses) on foreign currency translation adjustments are included in the Company’s components of comprehensive income (loss), which are excluded from net income (loss). Comprehensive income (loss) is included in the statement of shareholders’ equity and comprehensive income (loss).
41
RECENT ACCOUNTING PRONOUNCEMENTS:
In October 2009, the Financial Accounting Standards Board, or FASB, issued authoritative guidance for revenue recognition with multiple deliverables. This authoritative guidance defines the criteria for identifying individual deliverables in a multiple-element arrangement and the manner in which revenues are allocated to individual deliverables. In absence of vendor-specific objective evidence, or VSOE, or other third party evidence, or TPE, of the selling price for the deliverables in a multiple-element arrangement, guidance requires companies to use an estimated selling price, or ESP, for the individual deliverables. Companies shall apply the relative-selling price model for allocating an arrangement’s total consideration to its individual elements. Under this model, the ESP is used for both the delivered and undelivered elements that do not have VSOE or TPE of the selling price. This guidance is effective for fiscal years beginning on or after June 15, 2010, and was applied prospectively to revenue arrangements entered into or materially modified after the effective date. The Company adopted this standard in the first quarter of fiscal year 2012.
In October 2009, the FASB issued authoritative guidance for the accounting for certain revenue arrangements that include software elements. This authoritative guidance amends the scope of pre-existing software revenue guidance by removing from the guidance non-software components of tangible products and certain software components of tangible products. This guidance is effective for fiscal years beginning on or after June 15, 2010, and was applied prospectively to revenue arrangements entered into or materially modified after the effective date. The Company adopted this standard in the first quarter of fiscal year 2012.
These standards did not have a material impact on the Company’s condensed consolidated financial statements.
In May 2011 updated authoritative guidance to amend existing requirements for fair value measurements and disclosures was issued. The guidance expands the disclosure requirements around fair value measurements categorized in Level 3 of the fair value hierarchy and requires disclosure of the level in the fair value hierarchy of items that are not measured at fair value but whose fair value must be disclosed. It also clarifies and expands upon existing requirements for fair value measurements of financial assets and liabilities as well as instruments classified in shareholders’ equity. The guidance will be effective for fiscal years, and interim periods within those years, beginning after December 15, 2011, and are to be applied prospectively. The Company will adopt this guidance in the first quarter of fiscal 2013. The implementation of this authoritative guidance is not expected to have a material impact on the Company’s financial position or results of operations.
In June 2011, authoritative guidance was issued on the presentation of comprehensive income to require an entity to present the total of comprehensive income, the components of net income, and the components of other comprehensive income either in a single continuous statement of comprehensive income or in two separate but consecutive statements. This authoritative guidance eliminates the option to present the components of other comprehensive income as part of the statement of shareholders’ equity. This guidance is effective for fiscal years, and interim periods within those years, beginning after December 15, 2011. The authoritative guidance is effective for the Company’s first quarter of fiscal 2013. Other than requiring additional disclosure, the adoption of this new guidance will not have a material impact on the Company’s consolidated financial statements.
2. ACCOUNTS RECEIVABLE:
Accounts receivable comprise (in thousands):
|
Year Ended May 31,
|
||||||||
|
2012
|
2011
|
|||||||
|
Accounts receivable
|
$ | 2,627 | $ | 1,455 | ||||
|
Less: Allowance for doubtful accounts
|
(39 | ) | (23 | ) | ||||
| $ | 2,588 | $ | 1,432 | |||||
42
|
Additions
|
||||||||||||||||
|
Balance at
|
charged to
|
Balance
|
||||||||||||||
|
beginning
|
costs and
|
at end
|
||||||||||||||
|
of year
|
expenses
|
Deductions*
|
of year
|
|||||||||||||
|
Allowance for doubtful accounts receivable:
|
||||||||||||||||
|
May 31, 2012
|
$ | 23 | $ | 16 | $ | -- | $ | 39 | ||||||||
|
May 31, 2011
|
$ | 1,411 | $ | 15 | $ | 1,403 | $ | 23 | ||||||||
|
May 31, 2010
|
$ | 13,741 | $ | 59 | $ | 12,389 | $ | 1,411 | ||||||||
* Deductions include write-offs of uncollectible accounts and collections of amounts previously reserved.
3. INVENTORIES:
Inventories comprise (in thousands):
|
Year Ended May 31,
|
||||||||
|
2012
|
2011
|
|||||||
|
Raw materials and sub-assemblies
|
$ | 3,218 | $ | 1,992 | ||||
|
Work in process
|
2,657 | 2,699 | ||||||
|
Finished goods
|
195 | 267 | ||||||
| $ | 6,070 | $ | 4,958 | |||||
4. PROPERTY AND EQUIPMENT:
Property and equipment comprise (in thousands):
|
Year Ended May 31,
|
||||||||
|
2012
|
2011
|
|||||||
|
Leasehold improvements
|
$ | 1,107 | $ | 1,105 | ||||
|
Furniture and fixtures
|
1,264 | 1,246 | ||||||
|
Machinery and equipment
|
4,303 | 4,263 | ||||||
|
Test equipment
|
2,972 | 3,004 | ||||||
| 9,646 | 9,618 | |||||||
|
Less: Accumulated depreciation
|
||||||||
|
and amortization
|
(9,136 | ) | (8,664 | ) | ||||
| $ | 510 | $ | 954 | |||||
5. PRODUCT WARRANTIES:
The Company provides for the estimated cost of product warranties at the time revenues are recognized on the products shipped. While the Company engages in extensive product quality programs and processes, including actively monitoring and evaluating the quality of its component suppliers, the Company’s warranty obligation is affected by product failure rates, material usage and service delivery costs incurred in correcting a product failure. Should actual product failure rates, material usage or service delivery costs differ from the Company’s estimates, revisions to the estimated warranty liability would be required.
Following is a summary of changes in the Company’s liability for product warranties during the fiscal years ended May 31, 2012 and May 31, 2011 (in thousands):
43
|
Year Ended May 31,
|
||||||||
|
2012
|
2011
|
|||||||
|
Balance at the beginning of the year
|
$ | 103 | $ | 174 | ||||
|
Accruals for warranties issued during the year
|
208 | 174 | ||||||
|
Adjustments related to pre-existing warranties
|
||||||||
|
(including changes in estimates)
|
-- | (88 | ) | |||||
|
Settlement made during the year
|
||||||||
|
(in cash or in kind)
|
(220 | ) | (157 | ) | ||||
|
Balance at the end of the year
|
$ | 91 | $ | 103 | ||||
The accrued warranty balance is included in Accrued Expenses on the accompanying consolidated balance sheets.
6. ACCRUED EXPENSES:
Accrued expenses comprise (in thousands):
|
|
Year Ended May 31,
|
|||||||
|
2012
|
2011
|
|||||||
|
Payroll related
|
$ | 573 | $ | 736 | ||||
|
Professional services
|
209 | 159 | ||||||
|
Commissions and bonuses
|
218 | 185 | ||||||
|
Accrued customer obligations
|
95 | 35 | ||||||
|
Warranty
|
91 | 103 | ||||||
|
Taxes payable
|
74 | 80 | ||||||
|
Deferred rent
|
59 | 42 | ||||||
|
Other
|
66 | 94 | ||||||
| $ | 1,385 | $ | 1,434 | |||||
7. INCOME TAXES:
Domestic and foreign components of loss before income tax expense (benefit) are as follows (in thousands):
|
Year Ended May 31,
|
||||||||||||
|
2012
|
2011
|
2010
|
||||||||||
|
Domestic
|
$ | (3,590 | ) | $ | (4,424 | ) | $ | (805 | ) | |||
|
Foreign
|
186 | 1,002 | 185 | |||||||||
| $ | (3,404 | ) | $ | (3,422 | ) | $ | (620 | ) | ||||
The income tax benefit consists of the following (in thousands):
|
Year Ended May 31,
|
||||||||||||
|
2012
|
2011
|
2010
|
||||||||||
|
Federal income taxes:
|
||||||||||||
|
Current
|
-- | -- | $ | 185 | ||||||||
|
Deferred
|
-- | -- | -- | |||||||||
|
State income taxes:
|
||||||||||||
|
Current
|
$ | (12 | ) | $ | (30 | ) | (4 | ) | ||||
|
Deferred
|
-- | -- | -- | |||||||||
|
Foreign income taxes:
|
||||||||||||
|
Current
|
27 | 79 | (42 | ) | ||||||||
|
Deferred
|
-- | -- | -- | |||||||||
| $ | 15 | $ | 49 | $ | 139 | |||||||
44
The Company’s effective tax rate differs from the U.S. federal statutory tax rate, as follows:
|
Year Ended May 31,
|
||||||||||||
|
2012
|
2011
|
2010
|
||||||||||
|
U.S. federal statutory tax rate
|
34.0 | % | 34.0 | % | 34.0 | % | ||||||
|
State taxes, net of federal tax effect
|
(0.2 | ) | (0.6 | ) | (0.6 | ) | ||||||
|
Foreign rate differential
|
2.9 | 12.4 | 4.7 | |||||||||
|
Stock-based compensation
|
(6.0 | ) | (8.5 | ) | (92.6 | ) | ||||||
|
Research and development credit
|
0.1 | -- | 13.2 | |||||||||
|
Change in valuation allowance
|
(30.2 | ) | (35.7 | ) | 64.5 | |||||||
|
Other
|
(0.2 | ) | (0.2 | ) | (0.8 | ) | ||||||
|
Effective tax rate
|
0.4 | % | 1.4 | % | 22.4 | % | ||||||
The components of the net deferred tax asset (liability) are as follows (in thousands):
|
Year Ended May 31,
|
||||||||
|
2012
|
2011
|
|||||||
|
Net operating losses
|
$ | 11,106 | $ | 9,675 | ||||
|
Credit carryforwards
|
3,696 | 3,548 | ||||||
|
Inventory reserves
|
2,686 | 2,945 | ||||||
|
Reserves and accruals
|
2,957 | 3,506 | ||||||
|
Other
|
665 | 725 | ||||||
| 21,110 | 20,399 | |||||||
|
Less: Valuation allowance
|
(21,110 | ) | (20,399 | ) | ||||
|
Net deferred tax asset
|
$ | -- | $ | -- | ||||
The valuation allowance increased by $711,000 during fiscal 2012, $1,861,000 during fiscal 2011, and $56,000 during fiscal 2010. As of May 31, 2012 and 2011, the Company concluded that it is more likely than not that the deferred tax assets will not be realized and therefore provided a full valuation allowance against the deferred tax assets. The Company will continue to evaluate the need for a valuation allowance against its deferred tax assets on a quarterly basis.
At May 31, 2012, the Company had federal and state net operating loss carryforwards of $28,774,000 and $26,365,000, respectively. These carryforwards will begin to expire in 2024 and 2014, respectively. At May 31, 2012, the Company also had federal and state research and development tax credit carryforwards of $1,693,000 and $4,149,000, respectively. The federal credit carryforward will begin to expire in 2016, and the California credit will carryforward indefinitely. These carryforwards may be subject to certain limitations on annual utilization in case of a change in ownership, as defined by tax law. The Company also has alternative minimum tax credit carryforwards of $91,000 for federal tax purposes and $34,000 for state purposes. The credits may be used to offset regular tax and do not expire.
The Company has made no provision for U.S. income taxes on undistributed earnings of certain foreign subsidiaries because it is the Company’s intention to permanently reinvest such earnings in its foreign subsidiaries. If such earnings were distributed, the Company would be subject to additional U.S. income tax expense. Determination of the amount of unrecognized deferred income tax liability related to these earnings is not practicable.
Foreign net operating loss carryforwards of $1,209,000 are available to reduce future foreign taxable income. The foreign net operating losses will begin to expire in 2012.
The Company maintains liabilities for uncertain tax positions. These liabilities involve considerable judgment and estimation and are continuously monitored by management based on the best information available. The aggregate changes in the balance of gross unrecognized tax benefits are as follows: (in thousands)
45
|
Beginning balance as of May 31, 2009
|
$ | 1,190 | ||
|
Decreases related to prior year tax positions
|
(5 | ) | ||
|
Decreases related to lapse of statute of limitations
|
(4 | ) | ||
|
Balance at May 31, 2010
|
$ | 1,181 | ||
|
Decreases related to prior year tax positions
|
-- | |||
|
Decreases related to lapse of statute of limitations
|
(88 | ) | ||
|
Balance at May 31, 2011
|
$ | 1,093 | ||
|
Decreases related to prior year tax positions
|
-- | |||
|
Decreases related to lapse of statute of limitations
|
(71 | ) | ||
|
Balance at May 31, 2012
|
$ | 1,022 |
If the ending balance of $1,022,000 of unrecognized tax benefits at May 31, 2012 were recognized, $125,000 would affect the effective income tax rate. In accordance with the Company’s accounting policy, it recognizes accrued interest and penalties related to unrecognized tax benefits in the provision for income taxes. The Company had accrued interest and penalties of $15,000 at May 31, 2012.
Although the Company files U.S. federal, various state, and foreign tax returns, the Company’s only major tax jurisdictions are the United States, California, Germany and Japan. Tax years 1996 – 2011 remain subject to examination by the appropriate governmental agencies due to tax loss carryovers from those years.
8. LINE OF CREDIT:
On August 25, 2011, the Company entered into a working capital credit facility agreement allowing the Company to borrow up to $1.5 million based upon qualified accounts receivable, and export-related inventory. On May 29, 2012 the credit agreement was amended to increase the borrowing limit to $2.0 million. Each account receivable financed by the lender will bear an annual interest rate or finance charge equal to the greater of the lender's prime rate less 0.5%, or 3.50%, when the Company meets certain borrowing base requirements. If the Company does not meet the borrowing base requirements, each account receivable financed by the lender will bear an annual interest rate or finance charge equal to the greater of the lender's prime rate plus 0.75%, or 4.75%. The applicable interest is calculated based on the full amount of the account receivable and export-related inventory provided as collateral for the actual amounts borrowed. Depending on the composition of the collateral items, whether or not the Company meets certain borrowing base requirements and the relative cash position of the Company, the equivalent annual interest rate applied to the actual loan balances may vary from 3.89% to 8.94%, assuming that the bank’s prime rate is 4.00% or less. At May 31, 2012 the weighted average interest rate on the outstanding loan balance was 4.04%. The average loan balance since the loan inception was $127,000. The term of the agreement is one year and is collateralized by all the Company’s assets except for intellectual property. At May 31, 2012 the Company had drawn $1,408,000 against the credit facility. The balance available to borrow under the line at May 31, 2012 was $592,000. The Company was in compliance with all covenants at May 31, 2012.
9. CAPITAL STOCK:
STOCK OPTIONS:
In October 1996, the Company’s Board of Directors approved the 1996 Stock Option Plan (the “Stock Plan”), which provided for granting of incentive and non-qualified stock options to our employees and directors. The Stock Plan provides that qualified options be granted at an exercise price equal to the fair market value at the date of grant, as determined by the Board of Directors (85% of fair market value in the case of non-statutory options and purchase rights and 110% of fair market value in certain circumstances). Options generally expire within five years from date of grant. Most options become exercisable in increments over a four-year period from the date of grant.
In October 2006, the Company’s 2006 Equity Incentive Plan and 2006 Employee Stock Purchase Plan (“2006 Plans”) were approved by the shareholders. A total of 2,900,000 shares of common stock have been reserved for issuance under the Company’s 2006 Equity Incentive Plan. Options granted under the 2006 Equity Incentive Plan are generally for periods not to exceed ten years (five years if the option is granted to a 10% stockholder) and are granted at the fair market value of the stock at the date of grant as determined by the Board of Directors. The 2006 Plans respectively
46
replace the Company’s Amended and Restated 1996 Stock Option Plan, which would otherwise have expired in 2006; and the Company’s 1997 Employee Stock Purchase Plan, which would have otherwise expired in 2007. The Amended and Restated 1996 Stock Option Plan will continue to govern awards previously granted under that plan.
As of May 31, 2012, out of the 3,797,000 shares authorized for grant under the 1996 Stock Option Plan and 2006 Equity Incentive Plan, approximately 2,957,000 shares had been granted.
The following table summarizes the Company’s stock option transactions during fiscal 2012, 2011 and 2010 (in thousands, except per share data):
|
Outstanding Options
|
||||||||||||||||
|
Weighted
|
||||||||||||||||
|
Number
|
Average
|
Aggregate
|
||||||||||||||
|
Available
|
of
|
Exercise
|
Intrinsic
|
|||||||||||||
|
Shares
|
Shares
|
Price
|
Value
|
|||||||||||||
|
Balances, May 31, 2009
|
536 | 1,636 | $ | 5.37 | -- | |||||||||||
|
Additional shares reserved
|
800 | -- | ||||||||||||||
|
Options granted
|
(560 | ) | 560 | $ | 0.88 | |||||||||||
|
Options terminated
|
232 | (232 | ) | $ | 7.19 | |||||||||||
|
Plan shares expired
|
(10 | ) | -- | |||||||||||||
|
Options exercised
|
-- | (15 | ) | $ | 2.03 | |||||||||||
|
Balances, May 31, 2010
|
998 | 1,949 | $ | 3.88 | $ | 833 | ||||||||||
|
Options granted
|
(508 | ) | 508 | $ | 1.88 | |||||||||||
|
Options terminated
|
327 | (327 | ) | $ | 4.30 | |||||||||||
|
Plan shares expired
|
(130 | ) | -- | |||||||||||||
|
Options exercised
|
-- | (47 | ) | $ | 0.85 | |||||||||||
|
Balances, May 31, 2011
|
687 | 2,083 | $ | 3.40 | $ | 298 | ||||||||||
|
Additional shares reserved
|
1,199 | -- | ||||||||||||||
|
Options granted
|
(1,141 | ) | 1,141 | $ | 0.92 | |||||||||||
|
Options terminated
|
258 | (258 | ) | $ | 3.72 | |||||||||||
|
Plan shares expired
|
(164 | ) | -- | |||||||||||||
|
Options exercised
|
-- | (9 | ) | $ | 0.85 | |||||||||||
|
Balances, May 31, 2012
|
839 | 2,957 | $ | 2.40 | $ | 587 | ||||||||||
|
Options exercisable and expected to be exercisable at May 31, 2012
|
2,898 | $ | 2.40 | $ | 575 | |||||||||||
The options outstanding and exercisable at May 31, 2012 were in the following exercise price ranges (in thousands, except per share data):
|
Options Outstanding
|
Options Exercisable
|
|||||||||||||||||||||||||||||
|
at May 31, 2012
|
at May 31, 2012
|
|||||||||||||||||||||||||||||
|
Range of
Exercise
Prices
|
Number
Outstanding
Shares
|
Weighted Average Remaining Contractual Life (Years) |
Weighted
Average Exercise
Price
|
Number
Exercisable
Shares
|
Weighted
Average Exercise
Price
|
Weighted Average Remaining Contractual Life (Years)
|
Aggregate
Intrinsic
Value
|
|||||||||||||||||||||||
| $0.59-$0.89 | 1,061 | 4.74 | $ | 0.74 | 616 | $ | 0.82 | 3.39 | ||||||||||||||||||||||
| $1.10-$2.81 | 1,349 | 3.62 | $ | 1.79 | 690 | $ | 2.06 | 2.37 | ||||||||||||||||||||||
| $3.00-$5.96 | 244 | 0.12 | $ | 5.16 | 244 | $ | 5.16 | 0.12 | ||||||||||||||||||||||
| $6.00-$9.30 | 187 | 0.80 | $ | 7.88 | 186 | $ | 7.88 | 0.80 | ||||||||||||||||||||||
| $9.94-$9.94 | 116 | 1.07 | $ | 9.94 | 114 | $ | 9.94 | 1.07 | ||||||||||||||||||||||
| $0.59-$9.94 | 2,957 | 3.45 | $ | 2.40 | 1,850 | $ | 3.13 | 2.17 | $ | 279 | ||||||||||||||||||||
The total intrinsic values of options exercised were $6,000, $25,000 and $7,000 during fiscal 2012, 2011 and 2010, respectively. The weighted average contractual life of the options exercisable and expected to be exercisable at May 31, 2012 was 3.5 years.
47
Options to purchase 1,850,000, 1,591,000 and 1,343,000 shares were exercisable at May 31, 2012, 2011 and 2010, respectively. These exercisable options had weighted average exercise prices of $3.13, $3.66 and $4.20 as of May 31, 2012, 2011 and 2010, respectively.
10. EMPLOYEE BENEFIT PLANS:
EMPLOYEE STOCK OWNERSHIP PLAN:
The Company has a non-contributory, trusteed employee stock option plan for full-time employees who have completed three consecutive months of service and for part-time employees who have completed one year of service and have attained an age of 21. The Company can contribute either shares of the Company’s stock or cash to the plan. The contribution is determined annually by the Company and cannot exceed 15% of the annual aggregate salaries of those employees eligible for participation in the plan. On May 31, 2007, the Company converted the Aehr Test Systems Employee Stock Bonus Plan into the Aehr Test Systems Employee Stock Ownership Plan (the “Plan”). The stock bonus plan was converted to an employee stock ownership plan (“ESOP”) to enable the Plan to better comply with changes in the law regarding Company stock. Individuals’ account balances vest at a rate of 20% per year commencing upon completion of two years of service. Non-vested balances, which are forfeited following termination of employment, are allocated to the remaining employees in the Plan. Under the Plan provisions, each employee who reaches age fifty-five (55) and has been a participant in the Plan for ten years will be offered an election each year to direct the transfer of up to 25% of his/her ESOP account to the employee self-directed account in the Savings & Retirement Plan. For anyone who met the above prerequisites, the first election to diversify holdings was offered after May 31, 2008. In the sixth year, employees will be able to diversify up to 50% of their ESOP accounts. Contributions of $60,000, $60,000 and $150,000 were authorized for the plan during fiscal 2012, 2011 and 2010, respectively. The contribution amounts are recorded as compensation expense, in the period authorized and included in accrued liabilities, in the period authorized. Contributions of 40,540 shares were made to the ESOP during fiscal 2012 for fiscal 2011. Contributions of 64,102 shares were made to the ESOP during fiscal 2011 for fiscal 2010. Contributions of 64,516 shares were made to the ESOP during fiscal 2010 for fiscal 2009. The contribution for fiscal 2012 will be made in fiscal 2013. Shares held in the ESOP are included in the EPS calculation.
401(K) PLAN:
The Company maintains a defined contribution savings plan (the “401(k) Plan”) to provide retirement income to all qualified employees of the Company. The 401(k) Plan is intended to be qualified under Section 401(k) of the Internal Revenue Code of 1986, as amended. The 401(k) Plan is funded by voluntary pre-tax contributions from employees. Contributions are invested, as directed by the participant, in investment funds available under the 401(k) Plan. The Company is not required to make, and did not make, any contributions to the 401(k) Plan during fiscal 2012, 2011 and 2010.
EMPLOYEE STOCK PURCHASE PLAN:
The Company’s Board of Directors adopted the 1997 Employee Stock Purchase Plan in June 1997. A total of 400,000 shares of common stock have been reserved for issuance under the plan. The plan has consecutive, overlapping, twenty-four month offering periods. Each twenty-four month offering period includes four six month purchase periods. The offering periods generally begin on the first trading day on or after April 1 and October 1 each year, except that the first such offering period commenced with the effectiveness of the Company’s initial public offering and ended on the last trading day on or before March 31, 1999. Shares are purchased through employee payroll deductions at exercise prices equal to 85% of the lesser of the fair market value of the Company’s common stock at either the first day of an offering period or the last day of the purchase period. If a participant’s rights to purchase stock under all employee stock purchase plans of the Company accrue at a rate which exceeds $25,000 worth of stock for a calendar year, such participant may not be granted an option to purchase stock under the 1997 Employee Stock Purchase Plan. The maximum number of shares a participant may purchase during a single purchase period is 3,000 shares.
In October 2006, the Company’s shareholders approved the 2006 Employee Stock Purchase Plan, or 2006 Purchase Plan. A total of 800,000 shares of the Company’s common stock were reserved for issuance under the 2006 Purchase Plan. The 2006 Purchase Plan has consecutive, overlapping, twenty-four month offering periods. Each twenty-four month offering period includes four six month purchase periods. The offering periods generally begin on the first trading day on or after April 1 and October 1 each year. The first exercise date under the 2006 Purchase Plan was April 1, 2007. All employees who work a minimum of 20 hours per week and are customarily employed by the Company (or an affiliate thereof) for at least five months per calendar year are eligible to participate. Under the 2006 Purchase Plan, shares are purchased through employee payroll deductions at exercise prices equal to 85% of the lesser of the fair market
48
value of the Company’s common stock at either the first day of an offering period or the last day of the purchase period. If a participant’s rights to purchase stock under all employee stock purchase plans of the Company accrue at a rate which exceeds $25,000 worth of stock for a calendar year, such participant may not be granted an option to purchase stock under the 2006 Purchase Plan. For the years ended May 31, 2012, 2011 and 2010, approximately 154,000, 157,000 and 89,000 shares of common stock, respectively, were issued under the plans. To date, 919,000 shares have been issued under both employee stock purchase plans.
11. STOCKHOLDER RIGHTS PLAN:
The Company’s Board of Directors adopted a Stockholder Rights Plan on March 5, 2001, under which a dividend of one Right to purchase one one-thousandth of a share of the Company’s Series A Participating Preferred Stock was distributed for each outstanding share of the Company’s common stock. The plan entitled each Right holder to purchase 1/1000th of a share of the Company’s Series A Participating Preferred Stock at an exercise price of $35.00, subject to adjustment, in certain events, such as a tender offer to acquire 20% or more of the Company’s outstanding common stock. Under some circumstances, such as if a person or group acquires 20% or more of the Company’s common stock prior to redemption of the Rights, the plan entitled such holders (other than an acquiring party) to purchase the Company’s common stock having a market value at that time of twice the Right’s exercise price. The Rights expired on April 3, 2010.
12. OTHER INCOME, NET:
Other income, net comprises the following (in thousands):
|
Year Ended May 31,
|
||||||||||||
|
2012
|
2011
|
2010
|
||||||||||
|
Dividend distribution on long-term investment
|
-- | $ | 575 | -- | ||||||||
|
Foreign exchange gain
|
$ | 117 | 135 | $ | 118 | |||||||
|
Other, net
|
-- | 52 | 13 | |||||||||
| $ | 117 | $ | 762 | $ | 131 | |||||||
13. SEGMENT INFORMATION:
As the Company’s business is completely focused on one industry segment, the designing, manufacturing and marketing of advanced test and burn-in products to the semiconductor manufacturing industry, management believes that the Company has only one reportable segment. The Company’s net sales and profits are generated through the sale and service of products for this one segment.
The following presents information about the Company’s operations in different geographic areas (in thousands):
|
United
|
||||||||||||||||
|
States
|
Asia
|
Europe
|
Total
|
|||||||||||||
|
2012:
|
||||||||||||||||
|
Net sales
|
$ | 14,173 | $ | 662 | $ | 686 | $ | 15,521 | ||||||||
|
Property and equipment, net
|
441 | 66 | 3 | 510 | ||||||||||||
|
2011:
|
||||||||||||||||
|
Net sales
|
$ | 11,911 | $ | 1,404 | $ | 422 | $ | 13,737 | ||||||||
|
Property and equipment, net
|
872 | 72 | 10 | 954 | ||||||||||||
|
2010
|
||||||||||||||||
|
Net sales
|
$ | 11,080 | $ | 256 | $ | 338 | $ | 11,674 | ||||||||
|
Property and equipment, net
|
1,412 | 77 | 15 | 1,504 | ||||||||||||
The Company’s foreign operations are primarily those of its Japanese and German subsidiaries. Substantially all of the sales of the subsidiaries are made to unaffiliated Japanese or European customers. Net sales exclude intercompany transactions.
49
14. RELATED PARTY TRANSACTIONS:
The Company has entered into transactions with ESA Electronics Pte Ltd., or ESA, in which the Company owned a 12.5% interest at May 31, 2011 and 2010. In June 2011, the Company sold its investment in ESA for approximately $1.4 million, recording a gain of approximately $1.0 million. ESA purchased goods from the Company for $11,000 and $34,000 during fiscal 2011 and 2010, respectively. In addition, the Company purchased goods from ESA for $2,000 and $3,000 in fiscal 2010 and 2009, respectively. There were no goods purchased from ESA in fiscal 2011. At May 31, 2011 and 2010, the Company had no amounts payable to ESA. At May 31, 2011 and 2010, the Company had no amounts receivable from ESA.
Mario M. Rosati, one of the Company’s directors, is also a member of Wilson Sonsini Goodrich & Rosati, Professional Corporation, which has served as the Company’s outside corporate counsel and has received compensation at normal commercial rates for these services.
15. COMMITMENTS AND CONTINGENCIES:
COMMITMENTS
The Company leases most of its manufacturing and office space under operating leases. The Company entered into non-cancelable operating lease agreements for its United States manufacturing and office facilities and maintains equipment under non-cancelable operating leases in Germany. The Company’s principal administrative and production facilities are located in Fremont, California, in a 51,289 square foot building. The term of the Company’s current lease commenced on April 1, 2008 and ends on June 30, 2015. The Company has an option to extend the lease for an additional period at rates to be determined. The Company’s facility in Japan is located in Tokyo in a 4,294 square foot building under a cancellable lease whose term commenced on October 1, 2007 and ends on September 30, 2013. The Company leases a sales and support office in Utting, Germany. The lease, which began February 1, 1992 and expires on January 31, 2014, contains an automatic twelve months renewal, at rates to be determined, if no notice is given prior to six months from expiry. Under the lease agreements, the Company is responsible for payments of utilities, taxes and insurance.
Minimum annual rentals payments under non-cancellable operating leases in each of the next five fiscal years and thereafter are as follows (in thousands):
|
Years Ending May 31,
|
||||
|
2013
|
$ | 596 | ||
|
2014
|
583 | |||
|
2015
|
591 | |||
|
2016
|
49 | |||
|
2017
|
-- | |||
|
Thereafter
|
-- | |||
|
Total
|
$ | 1,819 | ||
Rental expense for the years ended May 31, 2012, 2011 and 2010 was $680,000, $680,000 and $653,000, respectively.
At May 31, 2012 and 2011, the Company had a $50,000 certificate of deposit held by a financial institution representing a security deposit for its United States manufacturing and office space lease. This amount is included in “Other Assets” on the consolidated balance sheets.
PURCHASE OBLIGATIONS
The Company has purchase obligations to certain suppliers. In some cases the products the Company purchases are unique and have provisions against cancellation of the order. At May 31, 2012, the Company had $1,343,000 of purchase obligations which are due within the following 12 months. This amount does not include contractual obligations recorded on the consolidated balance sheets as liabilities.
CONTINGENCIES
The Company is, from time to time, involved in legal proceedings arising in the ordinary course of business. While there can be no assurances as to the ultimate outcome of any litigation involving the Company, management does not
50
believe any pending legal proceedings will result in judgment or settlement that will have a material adverse effect on the Company’s consolidated financial position, results of operations or cash flows.
In the normal course of business to facilitate sales of its products, the Company indemnifies other parties, including customers, with respect to certain matters. The Company has agreed to hold the other party harmless against losses arising from a breach of representations or covenants, or from intellectual property infringement or other claims. These agreements may limit the time within which an indemnification claim can be made and the amount of the claim. In addition, the Company has entered into indemnification agreements with its officers and directors, and the Company’s bylaws contain similar indemnification obligations to the Company’s agents.
It is not possible to determine the maximum potential amount under these indemnification agreements due to the limited history of prior indemnification claims and the unique facts and circumstances involved in each particular agreement. To date, payments made by the Company under these agreements have not had a material impact on the Company’s operating results, financial position or cash flows.
16. SELECTED QUARTERLY CONSOLIDATED FINANCIAL DATA (UNAUDITED)
The following table (presented in thousands, except per share data) sets forth selected unaudited condensed consolidated statements of operations data for each of the four quarters of the fiscal years ended May 31, 2012 and 2011. The unaudited quarterly information has been prepared on the same basis as the annual information presented elsewhere herein and, in the Company’s opinion, includes all adjustments (consisting only of normal recurring entries) necessary for a fair statement of the information for the quarters presented. The operating results for any quarter are not necessarily indicative of results for any future period and should be read in conjunction with the audited consolidated financial statements of the Company’s and the notes thereto included elsewhere herein.
|
Three Months Ended
|
||||||||||||||||
|
Aug. 31,
|
Nov. 30,
|
Feb. 29,
|
May 31,
|
|||||||||||||
|
2011
|
2011
|
2012
|
2012
|
|||||||||||||
|
Net sales
|
$ | 4,130 | $ | 3,860 | $ | 2,855 | $ | 4,676 | ||||||||
|
Gross profit
|
$ | 1,802 | $ | 1,128 | $ | 1,108 | $ | 2,169 | ||||||||
|
Net income (loss)
|
$ | 124 | $ | (1,373 | ) | $ | (1,361 | ) | $ | (779 | ) | |||||
|
Net income (loss) per share (basic)
|
$ | 0.01 | $ | (0.15 | ) | $ | (0.15 | ) | $ | (0.09 | ) | |||||
|
Net income (loss) per share (diluted)
|
$ | 0.01 | $ | (0.15 | ) | $ | (0.15 | ) | $ | (0.09 | ) | |||||
During the three months ended August 31, 2011 the Company sold all of its shares of ESA for approximately $1.4 million resulting in a gain of approximately $1.0 million reported in the first quarter of fiscal 2012.
|
Three Months Ended
|
||||||||||||||||
|
Aug. 31,
|
Nov. 30,
|
Feb. 28,
|
May 31,
|
|||||||||||||
|
2010
|
2010
|
2011
|
2011
|
|||||||||||||
|
Net sales
|
$ | 2,169 | $ | 3,577 | $ | 4,242 | $ | 3,749 | ||||||||
|
Gross profit
|
$ | 944 | $ | 1,354 | $ | 1,605 | $ | 1,609 | ||||||||
|
Net loss
|
$ | (1,516 | ) | $ | (767 | ) | $ | (946 | ) | $ | (144 | ) | ||||
|
Net loss per share (basic)
|
$ | (0.17 | ) | $ | (0.09 | ) | $ | (0.11 | ) | $ | (0.02 | ) | ||||
|
Net loss per share (diluted)
|
$ | (0.17 | ) | $ | (0.09 | ) | $ | (0.11 | ) | $ | (0.02 | ) | ||||
During the three months ended August 31, 2010 the Company’s Japanese subsidiary received $0.2 million in proceeds from the Spansion Japan bankruptcy claim and recorded the amount as a reduction of operating expenses.
During the three months ended November 30, 2010 the Company received a dividend payment of $0.6 million related to a long-term investment and reported the amount as other income.
During the three months ended May 31, 2011 the Company’s Japanese subsidiary received $0.7 million in proceeds from the Spansion Japan bankruptcy claim and recorded the amount as a reduction of operating expenses.
Item 9. Changes in and Disagreements with Accountants on Accounting and Financial Disclosure
None.
51
Item 9A. Controls and Procedures
|
(a)
|
Evaluation of disclosure controls and procedures.
|
Our management evaluated, with the participation of our Chief Executive Officer and Chief Financial Officer, the effectiveness of our disclosure controls and procedures, as defined in Rules 13a-15(e) and 15d-15(e) under the Exchange Act, as of the end of the period covered by this Annual Report on Form 10-K. Based on this evaluation, our Chief Executive Officer and our Chief Financial Officer have concluded that our disclosure controls and procedures are effective to ensure that information we are required to disclose in reports that we file or submit under the Securities Exchange Act of 1934 is recorded, processed, summarized and reported within the time periods specified in Securities and Exchange Commission rules and forms, and that such information is accumulated and communicated to management, including our Chief Executive Officer and Chief Financial Officer, as appropriate to allow for timely decisions regarding required disclosure.
|
(b)
|
Management’s report on internal control over financial reporting.
|
Our management is responsible for establishing and maintaining adequate internal control over financial reporting as defined in Rule 13a-15(f) of the Exchange Act. Under the supervision and with the participation of our Chief Executive Officer and Chief Financial Officer, our management conducted an evaluation of the effectiveness of our internal control over financial reporting based upon the framework in “Internal Control – Integrated Framework” issued by the Committee of Sponsoring Organizations of the Treadway Commission. Based on that evaluation, management has concluded that the Company’s internal control over financial reporting was effective as of May 31, 2012. This annual report does not include an attestation report of the Company’s registered public accounting firm regarding internal control over financial reporting. Management’s report was not subject to attestation by the Company’s registered public accounting firm pursuant to rules of the Securities and Exchange Commission that permit the Company to provide only management’s report in this Annual Report.
|
(c)
|
Changes in internal controls over financial reporting.
|
There were no changes in our internal controls over financial reporting that occurred during the period covered by this Annual Report on Form 10-K that have materially affected, or are reasonably likely to materially affect, our internal controls over financial reporting.
Item 9B. Other Information
None.
52
PART III
Item 10. Directors, Executive Officers and Corporate Governance
The information required by this item is incorporated by reference to the sections entitled “Board Matters and Corporate Governance”, “Proposal 1 -- Election of Directors” and “Compensation of Executive Officers” of the Proxy Statement.
Item 11. Executive Compensation
The information required by this item is incorporated by reference to the sections entitled “Director Compensation” and “Compensation of Executive Officers” of the Proxy Statement.
Item 12. Security Ownership of Certain Beneficial Owners and Management and Related Stockholder Matters
The information required by this item is incorporated by reference to the section entitled “Security Ownership of Certain Beneficial Owners, Directors and Management” of the Proxy Statement.
Item 13. Certain Relationships and Related Transactions
The information required by this item is incorporated by reference to the section entitled “Certain Relationships and Related Transactions” of the Proxy Statement.
Item 14. Principal Accountant Fees and Services
The information required by this item is incorporated by reference to the section entitled “Independent Registered Public Accounting Firm’s Fees” of the Proxy Statement.
53
PART IV
Item 15. Exhibits, Financial Statement Schedules
(a) The following documents are filed as part of this Report:
| 1. | Financial Statements | |
| See Index under Item 8. | ||
| 2. | Financial Statement Schedule | |
| See Index under Item 8. | ||
| 3. | Exhibits | |
| See Item 15(b) below. |
(b) Exhibits
The following exhibits are filed as part of or incorporated by reference into this Report:
54
|
Exhibit No.
|
Description
|
|
|
3.1(1)
|
Restated Articles of Incorporation of Registrant.
|
|
|
3.2(1)
|
Bylaws of Registrant.
|
|
|
3.2(2)
|
Amended and Restated Bylaws of Registrant.
|
|
|
4.1(3)
|
Form of Common Stock certificate.
|
|
|
4.2(4)
|
2006 Equity Incentive Plan.
|
|
|
4.3(4)
|
2006 Employee Stock Purchase Plan.
|
|
|
10.1(1)
|
Amended 1986 Incentive Stock Plan and form of agreement thereunder.
|
|
|
10.2(3)
|
1996 Stock Option Plan (as amended and restated) and forms of Incentive Stock Option Agreement and Nonstatutory Stock Option Agreement thereunder.
|
|
|
10.3(3)
|
1997 Employee Stock Purchase Plan and form of subscription agreement thereunder.
|
|
|
10.4(3)
|
Form of Indemnification Agreement entered into between Registrant and its directors and executive officers.
|
|
|
10.5(1)
|
Capital Stock Purchase Agreement dated September 11, 1979 between Registrant and certain holders of Common Stock.
|
|
|
10.6(1)
|
Capital Stock Investment Agreement dated April 12, 1984 between Registrant and certain holders of Common Stock.
|
|
|
10.7(1)
|
Amendment dated September 17, 1985 to Capital Stock Purchase Agreement dated April 12, 1984 between Registrant and certain holders of Common Stock.
|
|
|
10.8(1)
|
Amendment dated February 26, 1990 to Capital Stock Purchase Agreement dated April 12, 1984 between Registrant and certain holders of Common Stock.
|
|
|
10.9(1)
|
Stock Purchase Agreement dated September 18, 1985 between Registrant and certain holders of Common Stock.
|
|
|
10.10(1)
|
Common Stock Purchase Agreement dated February 26, 1990 between Registrant and certain holders of Common Stock.
|
|
|
10.11(1)
|
Lease dated May 14, 1991 for facilities located at 1667 Plymouth Street, Mountain View, California.
|
|
|
10.12(5)
|
Lease dated August 3, 1999 for facilities located at Building C, 400 Kato Terrace, Fremont, California.
|
|
|
10.13(6)
|
Preferred Shares Rights Agreement dated March 5, 2001.
|
|
|
10.14(7)
|
Form of Change of Control Agreement.
|
|
|
10.15(8)
|
First Amendment dated May 06, 2008 for facilities located at 400 Kato Terrace, Fremont, California.
|
|
|
10.16(9)
|
Purchase and Sale Agreement between the Company and Fulcrum Credit Partners LLC dated August 31, 2009.
|
|
|
10.17(10)
|
Purchase and Sale Agreement between the Company and APS Capital Corp. dated January 25, 2010.
|
|
|
10.18(11)
|
Separation Agreement and Release between the Company and Gregory M. Perkins, dated February 1, 2011.
|
|
|
10.19(12)
|
Sale and Purchase Agreement between the Company and IPCO International Limited dated April 13, 2011.
|
|
|
10.20(13)
|
Loan and Security Agreement dated August 25, 2011 by and between Aehr Test Systems and Silicon Valley Bank.
|
|
|
10.21(14)
|
First Amendment to Loan and Security Agreement dated May 29, 2012 by and between Aehr Test Systems and Silicon Valley Bank.
|
|
|
10.22(15)
|
Export-Import Bank Loan and Security Agreement dated August 25, 2011 by and between Aehr Test Systems and Silicon Valley Bank.
|
|
|
10.23(16)
|
First Amendment to Export-Import Bank Loan and Security Agreement dated May 29, 2012 by and between Aehr Test Systems and Silicon Valley Bank.
|
|
|
10.24(17)
|
Export-Import Bank of the United States Working Capital Guarantee Program Borrower Agreement dated August 25, 2011 made by Aehr Test
|
55
| Systems in favor of the Export Import Bank of the United States and Silicon Valley Bank. | ||
|
10.25(18)
|
Offer Letter dated January 3, 2012, between the Company and Gayn Erickson.
|
|
|
10.26(19)
|
Offer Letter dated January 3, 2012, between the Company and Rhea Posedel.
|
|
|
10.27(20)
|
Change of Control Severance Agreement dated January 3, 2012, between the Company and Gayn Erickson.
|
|
|
10.28(21)
|
Amended and Restated Change of Control Severance Agreement dated January 3, 2012, between the Company and Rhea J. Posedel.
|
|
|
16.1(22)
|
Letter dated December 9, 2005 regarding change in Certifying Accountant.
|
|
|
21.1(1)
|
Subsidiaries of the Company.
|
|
|
23.1
|
Consent of Burr Pilger Mayer, Inc. - Independent Registered Public Accounting Firm (filed herewith).
|
|
|
24.1
|
Power of Attorney (see page 58).
|
|
|
31.1
|
Certification Statement of Chief Executive Officer pursuant to Section 302(a) of the Sarbanes-Oxley Act of 2002 (filed herewith).
|
|
|
31.2
|
Certification Statement of Chief Financial Officer pursuant to Section 302(a) of the Sarbanes-Oxley Act of 2002 (filed herewith).
|
|
|
32.1
|
Certification of Chief Executive Officer and Chief Financial Officer pursuant to 18 U.S.C. Section 1350, as adopted pursuant to Section 906 of the Sarbanes-Oxley Act of 2002 (furnished herewith).
|
|
|
101.INS
|
XBRL Instance Document*
|
|
|
101.SCH
|
XBRL Taxonomy Extension Schema Document*
|
|
|
101.CAL
|
XBRL Taxonomy Extension Calculation Linkbase Document*
|
|
|
101.DEF
|
XBRL Taxonomy Extension Definition Linkbase Document*
|
|
|
101.LAB
|
XBRL Taxonomy Extension Label Linkbase Document*
|
|
|
101.PRE
|
XBRL Taxonomy Extension Presentation Linkbase Document*
|
___________________
(1) Incorporated by reference to the same-numbered exhibit previously filed with the Company’s Registration Statement on Form S-1 filed June 11, 1997 (File No. 333-28987).
(2) Incorporated by reference to Exhibit No. 3.1 previously filed with the Company’s Current Report on Form 8-K filed January 9, 2012 (File No. 000-22893).
(3) Incorporated by reference to the same-numbered exhibit previously filed with Amendment No.1 to the Company’s Registration Statement on Form S-1 filed July 17, 1997 (File No. 333-28987).
(4) Incorporated by reference to the exhibit previously filed with the Company’s Registration Statement on Form S-8 filed October 27, 2006 (File No. 333-138249).
(5) Incorporated by reference to the same-numbered exhibit previously filed with the Company’s Form 10-K for the year ended May 31, 1999 filed August 30, 1999 (File No. 000-22893).
(6) Incorporated by reference to the Exhibit No. 4.1 previously filed with the Company’s Current Report on Form 8-K filed March 28, 2001 (File No. 000-22893).
(7) Incorporated by reference to the same-numbered exhibit previously filed with the Company’s Form 10-K for the year ended May 31, 2001 filed August 29, 2001 (File No. 000-22893).
56
(8) Incorporated by reference to the same-numbered exhibit previously filed with the Company’s Current Report on Form 8-K filed May 9, 2008 (File No. 000-22893).
(9) Incorporated by reference to the Exhibit No. 10.1 previously filed with the Company’s Quarterly Report on Form 10-Q for the quarter ended August 31, 2009 filed October 14, 2009 (File No. 000-22893).
(10) Incorporated by reference to the Exhibit No. 10.17 previously filed with the Company’s Current Report on Form 8-K filed January 29, 2010 (File No. 000-22893).
(11) Incorporated by reference to the same-numbered exhibit previously filed with the Company’s Current Report on Form 8-K filed February 3, 2011 (File No. 000-22893).
(12) Incorporated by reference to the same-numbered exhibit previously filed with the Company’s Current Report on Form 8-K/A filed April 20, 2011 (File No. 000-22893).
(13) Incorporated by reference to the same-numbered exhibit previously filed with the Company’s Current Report on Form 8-K filed August 30, 2011 (File No. 000-22893).
(14) Incorporated by reference to Exhibit 10.1 previously filed with the Company’s Current Report on Form 8-K filed June 4, 2012 (File No. 000-22893).
(15) Incorporated by reference to Exhibit 10.21 previously filed with the Company’s Current Report on Form 8-K filed August 30, 2011 (File No. 000-22893).
(16) Incorporated by reference to Exhibit 10.2 previously filed with the Company’s Current Report on Form 8-K filed June 4, 2012 (File No. 000-22893).
(17) Incorporated by reference to Exhibit 10.22 previously filed with the Company’s Current Report on Form 8-K filed August 30, 2011 (File No. 000-22893).
(18) Incorporated by reference to the Exhibit No. 10.1 previously filed with the Company's Current Report on Form 8-K filed January 9, 2012 (File No. 000-22893).
(19) Incorporated by reference to the Exhibit No. 10.2 previously filed with the Company's Current Report on Form 8-K filed January 9, 2012 (File No. 000-22893).
(20) Incorporated by reference to the Exhibit No. 10.3 previously filed with the Company's Current Report on Form 8-K filed January 9, 2012 (File No. 000-22893).
(21) Incorporated by reference to the Exhibit No. 10.4 previously filed with the Company's Current Report on Form 8-K filed January 9, 2012 (File No. 000-22893).
(22) Incorporated by reference to the same-numbered exhibit previously filed with the Company’s Current Report on Form 8-K filed December 9, 2005 (File No. 000-22893).
* In accordance with Rule 406T of Regulation S-T, XBRL (Extensible Business Reporting Language) information deemed not filed or part of a registration statement or prospectus for purposes of Sections 11 or 12 of the Securities Act of 1933, is deemed not filed for purposes of Section 18 of the Securities Exchange Act of 1934, and otherwise is not subject to liability under these sections.
57
SIGNATURES
Pursuant to the requirements of Section 13 or 15(d) of the Securities Exchange Act of 1934, the Registrant has duly caused this Report on Form 10-K to be signed on its behalf by the undersigned, thereunto duly authorized.
Dated: August 28, 2012
| AEHR TEST SYSTEMS | |||
|
By:
|
/s/ GAYN ERICKSON | ||
| Gayn Erickson | |||
| PRESIDENT AND CHIEF EXECUTIVE OFFICER | |||
POWER OF ATTORNEY
KNOW ALL PERSONS BY THESE PRESENTS, that each person whose signature appears below constitutes and appoints Gayn Erickson and Gary L. Larson, jointly and severally, his attorneys-in-fact, each with the power of substitution, for him in any and all capacities, to sign any and all amendments to this Report on Form 10-K, and to file the same, with exhibits thereto and other documents in connection therewith, with the Securities and Exchange Commission, hereby ratifying and confirming all that each of said attorneys-in-fact, or his substitute or substitutes, may do or cause to be done by virtue hereof.
Pursuant to the requirements of the Securities Act of 1934, this Report on Form 10-K has been signed below by the following persons on behalf of the Registrant and in the capacities and on the dates indicated.
|
Signature
|
Title
|
Date
|
||
| President, Chief | ||||
|
Executive Officer, and Director
|
||||
|
/s/ GAYN ERICKSON
|
(Principal Executive Officer) |
August 28, 2012
|
||
|
Gayn Erickson
|
||||
| Vice President of Finance | ||||
| and Chief Financial Officer | ||||
|
/s/ GARY L. LARSON
|
(Principal Financial and |
August 28, 2012
|
||
|
Gary L. Larson
|
Accounting Officer) | |||
|
|
|
|
||
| /s/ RHEA J. POSEDEL | Executive Chairman | August 28, 2012 | ||
| Rhea J. Posedel | ||||
| /s/ ROBERT R. ANDERSON | Director | August 28, 2012 | ||
| Robert R. Anderson | ||||
| /s/ WILLIAM W. R. ELDER | Director | August 28, 2012 | ||
| William W. R. Elder | ||||
| /s/ MUKESH PATEL | Director | August 28, 2012 | ||
| Mukesh Patel | ||||
| /s/ MARIO M. ROSATI | Director | August 28, 2012 | ||
| Mario M. Rosati | ||||
| /s/ HOWARD T. SLAYEN | Director | August 28, 2012 | ||
| Howard T. Slayen |
58