Attached files
| file | filename |
|---|---|
| 8-K - Apple Hospitality REIT, Inc. | c70729_8-k.htm |
Exhibit 99.1
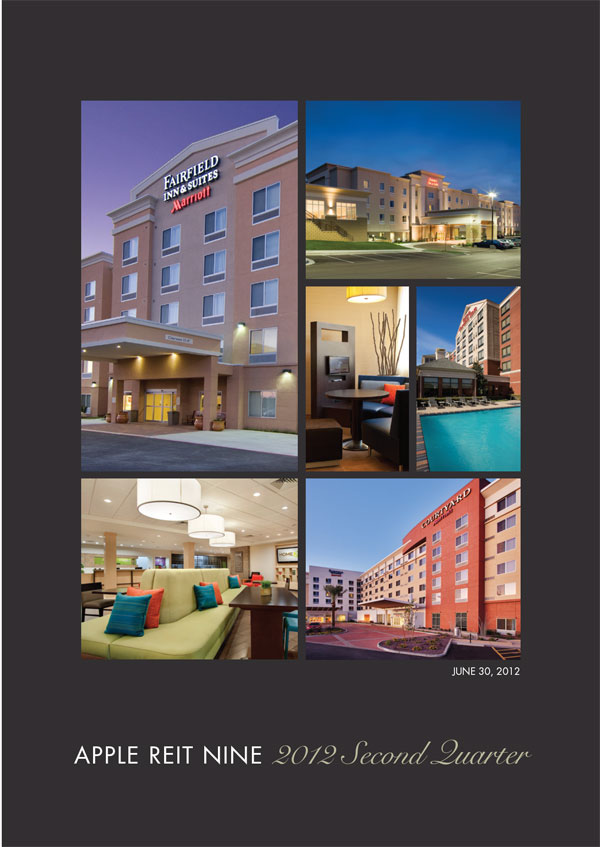

DEAR SHAREHOLDER, Key indicators of hotel performance including occupancy, average daily rate and revenue per available room have improved across the U.S. hotel industry in 2012 and according to industry analysts the outlook for the remainder of the year is positive. Following the acquisition of a new 119-room Home2 Suites by Hilton® in Nashville, TN, on May 31,2012, the Apple REIT Nine, Inc. portfolio includes 89 Marriott®- and Hilton®-branded hotels that are strategically located in diversified markets across 27 states. I am confident 2012 will be a good year for our Company.
I am pleased to report that the Apple REIT Nine portfolio of hotels achieved revenue per available room (RevPAR) of $86 for the second quarter of 2012, an increase of nine percent as compared to the same period of 2011. The average occupancy rate for the second quarter of this year was 77 percent and the average daily rate (ADR) was $112, these measures were approximately four percent and five percent ahead of comparable results from last year, respectively. For the six-month period ending June 30, 2012, RevPAR was $82, up by approximately eight percent in comparison to the same period last year.
Modified funds from operations (MFFO) for the second quarter of this year totaled $36.8 million, or $0.20 per share, and for the six-month period ending June 30, 2012, MFFO was $70.0 million, or $0.38 per share. MFFO results for the same periods last year were $33.4 million, or $0.18 per share, and $61.3 million, or $0.34 per share, respectively.
On April 27, 2012, Apple REIT Nine completed the sale of 110 parcels of land in the Ft. Worth, Texas area. As a result of this transaction, the Company made a Special Distribution to shareholders of $0.75 per share and the liquidation preference of each share was reduced by the amount of the Special Distribution, from $11.00 to $10.25 per share. As a result of the Special Distribution, the Company’s Board of Directors changed the annualized distribution rate from $0.88 per share (or approximately eight percent annually based on a liquidation preference of $11.00 per share) to $0.83 per share (or approximately 8.1 percent annually based on a liquidation preference of $10.25 per share). For reference, since the time of the Company’s
first distribution payment through July 31, 2012, the Company has paid $4.41 per share, including the Special Distribution of $0.75 per share, or $577 million. Our annualized distribution rate is closely monitored, taking into account varying economic cycles and capital improvements, as well as current and projected hotel performance. Although we strive for consistency over the life of our program, we may make adjustments as needed, based on available cash resources.
As always, we encourage our shareholders to know their investment and stay informed by reviewing information on our website at www.applereitnine.com, as well as our filings with the Securities and Exchange Commission, which can be found on their website at www.sec.gov.
Throughout the history of Apple REIT Nine, our team has remained focused on maximizing shareholder value through the ownership of lodging real estate. Our portfolio includes high-quality, well-branded hotels and our balance sheet is among the strongest in our industry, with a debt level of approximately eight percent as compared to our total initial capitalization. As the hotel industry continues to see improvement, I believe the Company is well positioned for the future. I look forward to sharing our continued progress with you in upcoming shareholder communications.
|
|
|
Sincerely, |
|
|
|
|
|
|
|
Glade M. Knight, |
|
|
|
Chairman and Chief Executive Officer |

Statements of Operations (Unaudited)
|
|
|
|
|
|
|
|
|
|
|
|
|
|
|
|
|
|
Three months ended |
|
Three months ended |
|
Six months ended |
|
Six months ended |
|||||
|
(In thousands except statistical data) |
|
June 30, 2012 |
|
June 30, 2011 |
|
June 30, 2012 |
|
June 30, 2011 |
|||||
|
REVENUES |
|
|
|
|
|
|
|
|
|
|
|
|
|
|
Room revenue |
|
$ |
88,047 |
|
$ |
77,069 |
|
$ |
167,600 |
|
$ |
142,938 |
|
|
Other revenue |
|
|
9,063 |
|
|
7,323 |
|
|
17,601 |
|
|
13,492 |
|
|
|
|
|
|
|
|
|
|
|
|
||||
|
Total revenue |
|
$ |
97,110 |
|
$ |
84,392 |
|
$ |
185,201 |
|
$ |
156,430 |
|
|
|
|||||||||||||
|
EXPENSES |
|
|
|
|
|
|
|
|
|
|
|
|
|
|
Direct operating expense |
|
$ |
24,239 |
|
$ |
21,120 |
|
$ |
46,651 |
|
$ |
39,325 |
|
|
Other hotel operating expenses |
|
|
34,336 |
|
|
30,472 |
|
|
66,569 |
|
|
58,090 |
|
|
General and administrative |
|
|
2,327 |
|
|
2,011 |
|
|
4,931 |
|
|
3,545 |
|
|
Depreciation |
|
|
13,166 |
|
|
12,178 |
|
|
26,009 |
|
|
23,476 |
|
|
Acquisition related costs |
|
|
430 |
|
|
1,733 |
|
|
461 |
|
|
4,348 |
|
|
Interest expense, net |
|
|
1,579 |
|
|
1,198 |
|
|
2,955 |
|
|
1,733 |
|
|
|
|
|
|
|
|
|
|
|
|
||||
|
Total expenses |
|
$ |
76,077 |
|
$ |
68,712 |
|
$ |
147,576 |
|
$ |
130,517 |
|
|
|
|||||||||||||
|
NET INCOME |
|
|
|
|
|
|
|
|
|
|
|
|
|
|
Income from continuing operations |
|
$ |
21,033 |
|
$ |
15,680 |
|
$ |
37,625 |
|
$ |
25,913 |
|
|
Income from discontinued operations |
|
|
1,525 |
|
|
4,716 |
|
|
6,792 |
|
|
9,432 |
|
|
|
|
|
|
|
|
|
|
|
|
||||
|
Net income |
|
$ |
22,558 |
|
$ |
20,396 |
|
$ |
44,417 |
|
$ |
35,345 |
|
|
|
|
|
|
|
|
|
|
|
|
||||
|
Income from continuing operations per share |
|
$ |
0.11 |
|
$ |
0.08 |
|
$ |
0.20 |
|
$ |
0.14 |
|
|
Income from discontinued operations per share |
|
|
0.01 |
|
|
0.03 |
|
|
0.04 |
|
|
0.05 |
|
|
|
|
|
|
|
|
|
|
|
|
||||
|
Net income per share |
|
$ |
0.12 |
|
$ |
0.11 |
|
$ |
0.24 |
|
$ |
0.19 |
|
|
|
|
|
|
|
|
|
|
|
|
||||
|
|
|||||||||||||
|
MODIFIED FUNDS FROM OPERATIONS (A) |
|
|
|
|
|
|
|
|
|
|
|
|
|
|
Net income |
|
$ |
22,558 |
|
$ |
20,396 |
|
$ |
44,417 |
|
$ |
35,345 |
|
|
Depreciation of real estate owned |
|
|
13,166 |
|
|
12,778 |
|
|
26,009 |
|
|
24,676 |
|
|
|
|
|
|
|
|
|
|
|
|
||||
|
Funds from operations (FFO) |
|
$ |
35,724 |
|
$ |
33,174 |
|
$ |
70,426 |
|
$ |
60,021 |
|
|
Acquisition-related costs |
|
|
430 |
|
|
1,733 |
|
|
461 |
|
|
4,348 |
|
|
Interest earned on note receivable |
|
|
1,120 |
|
|
- |
|
|
1,120 |
|
|
- |
|
|
Straight-line rental income |
|
|
(443 |
) |
|
(1,546 |
) |
|
(1,975 |
) |
|
(3,092 |
) |
|
|
|
|
|
|
|
|
|
|
|
||||
|
Modified funds from operations (MFFO) |
|
$ |
36,831 |
|
$ |
33,361 |
|
$ |
70,032 |
|
$ |
61,277 |
|
|
|
|
|
|
|
|
|
|
|
|
||||
|
FFO per share |
|
$ |
0.20 |
|
$ |
0.18 |
|
$ |
0.39 |
|
$ |
0.33 |
|
|
MFFO per share |
|
$ |
0.20 |
|
$ |
0.18 |
|
$ |
0.38 |
|
$ |
0.34 |
|
|
|
|||||||||||||
|
WEIGHTED-AVERAGE SHARES OUTSTANDING |
|
|
182,110 |
|
|
182,621 |
|
|
182,236 |
|
|
182,118 |
|
|
|
|||||||||||||
|
OPERATING STATISTICS |
|
|
|
|
|
|
|
|
|
|
|
|
|
|
Occupancy |
|
|
77% |
|
|
74% |
|
|
73% |
|
|
70% |
|
|
Average daily rate |
|
$ |
112 |
|
$ |
107 |
|
$ |
112 |
|
$ |
108 |
|
|
RevPAR |
|
$ |
86 |
|
$ |
79 |
|
$ |
82 |
|
$ |
76 |
|
|
Number of hotels |
|
|
89 |
|
|
86 |
|
|
|
|
|
|
|
|
Distributions per Share (B) |
|
$ |
0.97 |
|
$ |
0.22 |
|
$ |
1.19 |
|
$ |
0.44 |
|
|
|
|
|
|
|
|
|
|
|
|
|
|
|
|
|
Balance Sheet Highlights (Unaudited) |
|||||||||||||
|
|
|
|
|
|
|
|
|
|
|
|
|
|
|
|
(In thousands) |
|
|
|
|
June 30, 2012 |
|
|
|
|
December 31, 2011 |
|
||
|
ASSETS |
|
|
|
|
|
|
|
|
|
|
|
|
|
|
Investment in real estate, net |
|
|
|
|
$ |
1,480,164 |
|
|
|
|
$ |
1,480,722 |
|
|
Real estate held for sale |
|
|
|
|
|
- |
|
|
|
|
|
158,552 |
|
|
Cash and cash equivalents |
|
|
|
|
|
7,388 |
|
|
|
|
|
30,733 |
|
|
Note receivable, net |
|
|
|
|
|
25,471 |
|
|
|
|
|
- |
|
|
Other assets |
|
|
|
|
|
39,259 |
|
|
|
|
|
30,960 |
|
|
|
|
|
|
|
|
|
|
|
|
|
|
||
|
Total assets |
|
|
|
|
$ |
1,552,282 |
|
|
|
|
$ |
1,700,967 |
|
|
|
|
|
|
|
|
|
|
|
|
|
|
||
|
|
|||||||||||||
|
LIABILITIES AND SHAREHOLDERS’ EQUITY |
|
|
|
|
|
|
|
|
|
|
|
|
|
|
Notes payable |
|
|
|
|
$ |
152,602 |
|
|
|
|
$ |
124,124 |
|
|
Other liabilities |
|
|
|
|
|
12,812 |
|
|
|
|
|
13,253 |
|
|
|
|
|
|
|
|
|
|
|
|
|
|
||
|
Total liabilities |
|
|
|
|
|
165,414 |
|
|
|
|
|
137,377 |
|
|
Total shareholders’ equity |
|
|
|
|
|
1,386,868 |
|
|
|
|
|
1,563,590 |
|
|
|
|
|
|
|
|
|
|
|
|
|
|
||
|
Total liabilities & shareholders’ equity |
|
|
|
|
$ |
1,552,282 |
|
|
|
|
$ |
1,700,967 |
|
|
|
|
|
|
|
|
|
|
|
|
|
|
||
(A) Funds from operations (FFO)
is defined as net income (computed in accordance with generally accepted
accounting principles – GAAP) excluding gains and losses from sales of
depreciable property, plus depreciation and amortization. Modified funds from
operations (MFFO) excludes rental revenue earned, but not received during the
period or “straight-line” rent received and costs associated with the
acquisition of real estate and includes interest earned on a note receivable
that is not included in net income. The company considers FFO and MFFO in
evaluating property acquisitions and its operating performance and believes
that FFO and MFFO should be considered along with, but not as an alternative
to, net income and cash flows as a measure of the company’s activities in
accordance with GAAP. FFO and MFFO are not necessarily indicative of cash available
to fund cash needs.
(B) 2012 distributions include a
Special Distribution of $0.75 per share in May 2012.
The financial information
furnished reflects all adjustments necessary for a fair
presentation of financial position at June 30, 2012 and the results of
operations for the interim period ended June 30, 2012. Such interim results are
not necessarily indicative of the results that can be expected for the full
year. The accompanying financial statements should be read in conjunction with
the audited financial statements and related notes appearing in the Apple REIT
Nine, Inc. 2011 Annual Report.
|
|
|
|
|
|
|
|
|
|
|
|
|
|
|
|
|
|
|
|
|
|
Cover images from left to right, top to bottom: FAIRFIELD INN & SUITES, AUSTIN, TX; HAMPTON INN & SUITES, ROCHESTER, MN; COURTYARD, SANTA ANA, CA; HILTON GARDEN INN, ALLEN, TX; HOME2 SUITES, FAYETTEVILLE, NC; COURTYARD, CHANDLER, AZ |
|
|
|
|
|
|
|
This quarterly report contains forward-looking statements within the meaning of the Securities Act of 1933 and the Securities Exchange Act of 1934. Such statements involve known and unknown risks, uncertainties, and other factors which may cause the actual results, performance, or achievements of the company to be materially different from any future results, performance or achievements expressed or implied by such forward-looking statements. Such factors include: the availability and terms of financing; changes in national, regional and local economies and business conditions; competitors within the hotel industry; the outcome of current and future litigation and regulatory proceedings or inquiries; and the ability of the company to implement its acquisition strategy and operating strategy and to manage planned growth. |
|
|
|
|
|
|
|
In addition, the timing and amounts of distributions to common shareholders are within the discretion of the company’s board of directors. Although the company believes that the assumptions underlying the forward-looking statements contained herein are reasonable, any of the assumptions could be inaccurate; therefore, there can be no assurance that such statements included in this quarterly report will prove to be accurate. In light of the significant uncertainties inherent in the forward-looking statements included herein, the inclusion of such information should not be regarded as a representation by the company or any other person that the results or conditions described in such statements or the objectives and plans of the company will be achieved. |
|
|
|
|
|
|
|
“Courtyard® by Marriott®,” “Fairfield Inn® by Marriott®,” “Fairfield Inn & Suites® by Marriott®,” “Marriott®,” “Residence Inn® by Marriott®,” “SpringHill Suites® by Marriott®” and “TownePlace Suites® by Marriott®” are each a registered trademark of Marriott International, Inc. or one of its affiliates. All references to “Marriott” mean Marriott International and all of its affiliates and subsidiaries, and their respective officers, directors, agents, employees, accountants and attorneys. Marriott is not responsible for the content of this correspondence, whether relating to the hotel information, operating information, financial information, Marriott’s relationship with Apple REIT Nine, Inc. or otherwise. Marriott is not involved in any way whether as an “issuer” or “underwriter” or otherwise in the Apple REIT Nine offering and receives no proceeds from the offering. Marriott has not expressed any approval or disapproval regarding this correspondence, and the grant by Marriott of any franchise or other rights to Apple REIT Nine shall not be construed as any expression of approval or disapproval. Marriott has not assumed and shall not have any liability in connection with this report. |
|
|
|
|
|
|
|
“Embassy Suites Hotels®,” “Hampton Inn®,” “Hampton Inn & Suites®,” “Hilton®,” “Hilton Garden Inn®,” “Home2 Suites by Hilton®,” and “Homewood Suites by Hilton®” are each a registered trademark of Hilton Worldwide or one of its affiliates. All references to “Hilton” mean Hilton Worldwide and all of its affiliates and subsidiaries, and their respective officers, directors, agents, employees, accountants and attorneys. Hilton is not responsible for the content of this correspondence, whether relating to hotel information, operating information, financial information, Hilton’s relationship with Apple REIT Nine, Inc., or otherwise. Hilton is not involved in any way, whether as an “issuer” or “underwriter” or otherwise, in the Apple REIT Nine offering and receives no proceeds from the offering. Hilton has not expressed any approval or disapproval regarding this correspondence, and the grant by Hilton of any franchise or other rights to Apple REIT Nine shall not be construed as any expression of approval or disapproval. Hilton has not assumed and shall not have any liability in connection with this report. |
|
|
|
|
|
|
|
|
|
 CORPORATE PROFILE Apple REIT Nine, Inc. is a real estate investment
trust (REIT) focused on the acquisition and ownership of income-producing real estate that
generates attractive returns for our shareholders. Our hotels operate under the
Courtyard® by Marriott®, Fairfield Inn® by
Marriott®, Fairfield Inn & Suites® by
Marriott®, Marriott® Hotels & Resorts, Residence
Inn® by Marriott®, SpringHill Suites® by
Marriott®, TownePlace Suites® by Marriott®,
Embassy Suites Hotels®, Hilton®, Home2 Suites by
Hilton®, Homewood Suites by Hilton®, Hilton Garden
Inn®, Hampton Inn®, and Hampton Inn &
Suites® brands. The Apple REIT Nine portfolio consists of 89 hotels with a
total of 11,371 guestrooms in 27 states.
CORPORATE PROFILE Apple REIT Nine, Inc. is a real estate investment
trust (REIT) focused on the acquisition and ownership of income-producing real estate that
generates attractive returns for our shareholders. Our hotels operate under the
Courtyard® by Marriott®, Fairfield Inn® by
Marriott®, Fairfield Inn & Suites® by
Marriott®, Marriott® Hotels & Resorts, Residence
Inn® by Marriott®, SpringHill Suites® by
Marriott®, TownePlace Suites® by Marriott®,
Embassy Suites Hotels®, Hilton®, Home2 Suites by
Hilton®, Homewood Suites by Hilton®, Hilton Garden
Inn®, Hampton Inn®, and Hampton Inn &
Suites® brands. The Apple REIT Nine portfolio consists of 89 hotels with a
total of 11,371 guestrooms in 27 states. Market Diversity
|
|
|
|
STATE/CITY |
Portfolio of hotels |
|
|
|
|
ALABAMA |
|
|
Dothan, Troy |
|
|
ALASKA |
|
|
Anchorage |
|
|
ARIZONA |
|
|
Chandler (2), Phoenix (2), Tucson (2) |
|
|
ARKANSAS |
|
|
Rogers (2) |
|
|
CALIFORNIA |
|
|
Clovis (2), San Bernardino, Santa Ana, Santa Clarita (4) |
|
|
COLORADO |
|
|
Pueblo |
|
|
FLORIDA |
|
|
Fort Lauderdale, Miami, Orlando (2), Panama City, Panama City Beach, Tampa |
|
|
GEORGIA |
|
|
Albany |
|
|
IDAHO |
|
|
Boise |
|
|
ILLINOIS |
|
|
Mettawa (2), Schaumburg, Warrenville |
|
|
INDIANA |
|
|
Indianapolis, Mishawaka |
|
|
LOUISIANA |
|
|
Alexandria, Baton Rouge, Lafayette (2), West Monroe |
|
|
MARYLAND |
|
|
Silver Spring |
|
|
MASSACHUSETTS |
|
|
Andover |
|
|
MICHIGAN |
|
|
Novi |
|
|
MINNESOTA |
|
|
Rochester |
|
|
MISSISSIPPI |
|
|
Hattiesburg |
|
|
MISSOURI |
|
|
Kansas City, St. Louis (2) |
|
|
NEW JERSEY |
|
|
Mt. Laurel, West Orange |
|
|
|
|
STATE/CITY |
|
|
|
NORTH CAROLINA |
|
Charlotte, Durham, Fayetteville, Holly Springs, Jacksonville |
|
OHIO |
|
Twinsburg |
|
OKLAHOMA |
|
Oklahoma City |
|
PENNSYLVANIA |
|
Collegeville, Malvern, Pittsburgh |
|
TENNESSEE |
|
Jackson (2), Johnson City, Nashville (2) |
|
TEXAS |
|
Arlington, Austin (5), Beaumont, Dallas, Dallas/Allen (2), Dallas/Duncanville, Dallas/Lewisville, El Paso, Fort Worth, Frisco, Grapevine, Houston, Irving, Round Rock, Texarkana |
|
UTAH |
|
Salt Lake City |
|
VIRGINIA |
|
Alexandria, Bristol, Manassas |
|
|
|
|
|
|
|
|
|
|
|
CORPORATE HEADQUARTERS |
|
|
814 East Main Street |
|
|
Richmond, Virginia 23219 |
|
|
(804) 344-8121 |
|
|
(804) 344-8129 FAX |
|
|
www.applereitnine.com |
|
|
|
|
|
INVESTOR INFORMATION |
|
|
For additional information about the |
|
|
Company, please contact: Kelly Clarke, |
|
|
Director of Investor Services |
|
|
(804) 727-6321 or |
|
|
kclarke@applereit.com |