Attached files
| file | filename |
|---|---|
| 8-K - CURRENT REPORT - TAIWAN FUND INC | v322124_8k.htm |
| THE TAIWAN FUND, INC. (THE ‘FUND’) | |
| MONTHLY INSIGHT |
JULY 31, 2012
| IN BRIEF | |
| Net asset value per share | US$16.75 |
| Market price | US$15.03 |
| Premium/(discount) | (10.27%) |
| Total net assets | US$152.3m |
| Market cap | US$136.7m |
Source: State Street Bank and Trust Company.
| At July 31, 2012 | US$ return | |
| Fund* | TAIEX Total | |
| % | Return Index† | |
| % | ||
| One month | 2.0 | 1.8 |
| Three months | (3.0) | (3.1) |
| One year | (21.3) | (16.1) |
| Three years % pa | 7.7 | 7.9 |
Past performance is not a guide to future returns.
Returns are annualized, except for periods of less than one year.
*Source: State Street Bank and Trust Company.
NAV performance.
†Source: TWSE.
FUND MANAGERS
 |
 |
||
| Wong Kok Hoi | James Liu |
MANAGER’S COMMENTARY
The Taiwan Stock Exchange Index (TWSE) moved downward for most of the month, but recovered at month end aided by the rebound in global financial markets and the passing of the capital gains tax (CGT) bill by the legislature. The external economic environment remained unfavorable, with China’s Gross Domestic Product (GDP) growth falling below 8% for the first time in three years, and the job market in the United States still weak. European Central Bank president Mario Draghi’s declaration to do ‘whatever it takes’ to preserve the euro lifted investors’ spirits, but doubts abounded about how he would accomplish this. The TWSE ended the month of July roughly flat.
The CGT bill, which had dragged on for four months, was finally passed at an extra parliamentary session. As expected, foreign and domestic institutional investors will be exempt from the tax, while retail investors won’t be taxed as long as the TWSE Index is below 8500 in 2013 and 2014. From 2015, the tax will be applied to categories including active investors, non-residents and shareholders of unlisted companies. The final CGT bill was considered one of the more benign versions of as many as 10 proposals. The approval of the bill removed the overhang which had contributed to the TWSE’s 13% decline since the government panel first held discussions on March 28, 2012.
Taiwan’s GDP fell unexpectedly in the second quarter – down 0.16% from a year earlier, according to preliminary data. The government again cut its 2012 growth forecast, to 2.08% from 3.03%. The export-oriented economy has been under pressure as China’s growth slows and Europe remains trapped in its sovereign-debt crisis; the island’s exports have fallen for the past four months.
Technology stocks faced strong selling pressure from both international and domestic investors as more and more evidence showed that consumer pessimism caused by the sluggish global economy has negatively affected electronics sales. Investors have been shifting into non-tech stocks for perceived stability of earnings, even though the valuations of some of those companies are already stretched. As long as the economic gloom persists, stocks that can provide investors with a sense of safety may continue to outperform the market.
MONTHLY INSIGHT
INVESTMENT REVIEW
Key positive contributors to the Fund over the month included Mercuries & Associates, Ruentex Development and Advantech. Mercuries & Associates performed well towards the end of the month after news that the company’s life-insurance subsidiary had signed cooperation agreements with mainland companies. Meanwhile, Ruentex Development benefited as investors favored companies with operations that are considered stable amid macro uncertainties. Ruentex Development’s retail chain in China and its life-insurance business are expected to continue to perform well. Elsewhere, shares in Advantech rose as investors bought the stock for its stable earnings and high dividend yield.
Detracting from performance were Taiflex Scientific, First Steamship and WT Microelectronics. Taiflex Scientific’s share price declined during the month because of market concerns about demand for its products, which are used in smartphones and tablet PCs, as well as solar panels. Numbers from Apple were disappointing and the solar-panel market was sluggish. First Steamship underperformed as Grand Ocean, its department-store-chain operator in China, indicated that there would be no strong rebound in business in the third quarter as consumer sentiment was adversely affected by the financial crisis. Meanwhile, the stock of integrated-circuit distributor WT Microelectronics came under pressure as semiconductors faced strong headwinds, with consumers tightening their spending on gadgets.
We made no major buys or sells during the month.
Source: Martin Currie Inc. and APS Asset Management Pte Ltd.
For further information please go to www.thetaiwanfund.com.
Martin Currie Inc. took over management of the Fund on May 9, 2010.
| FUND DETAILS | |
| July 31, 2012 | |
| Shares outstanding | 9,092,566 |
| Exchange listed | NYSE |
| Listing date | 1986 |
| Investment manager | Martin Currie Inc |
Source: State Street Bank and Trust Company.
| PERFORMANCE | (US$ RETURNS) | |
| (US$ returns) | NAV % | Market price % |
| One month | 2.0 | 0.2 |
| Three months | (3.0) | (6.7) |
| Three years % pa | 7.7 | 7.1 |
Past performance is not a guide to future returns. Returns are annualized, except for periods of less than one year.
Source: State Street Bank and Trust Company.
| SECTOR ALLOCATION | ||
| Fund %* | Benchmark %† | |
| Electronics | 28.6 | 49.4 |
| Construction | 17.0 | 1.7 |
| Wholesale and retail | 14.3 | 6.0 |
| Transportation | 9.4 | 2.2 |
| Healthcare | 7.7 | — |
| Textiles | 6.4 | 1.9 |
| Finance | 4.7 | 12.8 |
| Electric and machinery | 4.6 | 1.4 |
| Plastics | 3.6 | 8.2 |
| Cement | 2.3 | 1.4 |
| Steel and iron | — | 2.9 |
| Others | — | 2.8 |
| Chemicals | — | 2.2 |
| Foods | — | 2.0 |
| Rubber | — | 1.8 |
| Automobile | — | 1.6 |
| Tourism | — | 0.6 |
| Electrical appliance and cable | — | 0.4 |
| Glass and ceramics | — | 0.4 |
| Paper and pulp | — | 0.3 |
| Other assets and liabilities, net | 1.4 | — |
*Source: State Street Bank and Trust Company.
†Source: TWSE.
| 15 LARGEST HOLDINGS* | ||
| % of net | ||
| 64.1% of holdings | Sector | assets |
| WT Microelectronics | Electronics | 9.0 |
| YungShin Global Holding | Healthcare | 5.4 |
| Mercuries & Associates | Wholesale and retail | 5.0 |
| Ruentex Development | Construction | 4.8 |
| First Steamship | Transportation | 4.7 |
| Advantech | Electronics | 4.2 |
| Aurora | Electronics | 3.9 |
| PC Home Online | Wholesale and retail | 3.8 |
| Yem Chio | Plastics | 3.6 |
| Yungtay Engineering | Electric and machinery | 3.5 |
| Wistron NeWeb | Electronics | 3.4 |
| Makalot Industrial | Textiles | 3.3 |
| Farglory F T Z Investment Holding | Transportation | 3.3 |
| Taiflex Scientific | Electronics | 3.1 |
| Far Eastern New Century | Textiles | 3.1 |
*Source: State Street Bank and Trust Company.
| PERFORMANCE | (US$ returns at July 31, 2012) | |||||||
| One month % |
Three months % |
Calendar year to date % |
One year % |
Three years % pa |
Five years % pa |
Ten years % pa |
Since launch % pa | |
| The Taiwan Fund, Inc.* | 2.0 | (3.0) | 5.1 | (21.3) | 7.7 | (3.1) | 6.2 | 8.5 |
| TAIEX Index† | (0.7) | (5.6) | 3.8 | (19.1) | 4.0 | (3.1) | 5.2 | 8.3 |
| TAIEX Total Return Index† | 1.8 | (3.1) | 6.6 | (16.1) | 7.9 | 0.8 | na | na |
| MSCI Taiwan Index† | 1.3 | (4.3) | 5.0 | (14.9) | 6.9 | (0.9) | 6.7 | na |
Past performance is not a guide to future returns. Returns are annualized, except for periods of less than one year.
*Source: State Street Bank and Trust Company. Launch date December 23, 1986. Returns for the Fund are historical total returns that reflect changes in net asset value per share during each period and assume that dividends and capital gains, if any, were reinvested.
†Source: MSCI for the MSCI Taiwan Index and TWSE for the TAIEX Total Return Index and the TAIEX Index. For a full description of each index please see the index descriptions section.
Returns for the TAIEX Index are not total returns and reflect only changes in the share price but do not assume that cash dividends, if any, were reinvested, and thus are not strictly comparable to the Fund returns.
The TAIEX Total Return Index commenced January 1, 2003.
MONTHLY INSIGHT
PORTFOLIO IN FULL
| Company | % of | ||||
| Sector | (BGB ticker) | Price | Holding | Value US$ | net assets |
| ELECTRONICS | 28.6 | ||||
| WT Microelectronics | 3036 TT | NT$38.7 | 10,584,556 | $13,639,846 | 9.0 |
| Advantech | 2395 TT | NT$106.5 | 1,808,100 | $6,420,360 | 4.2 |
| Aurora | 2373 TT | NT$44.2 | 4,060,000 | $5,976,461 | 3.9 |
| Wistron NeWeb | 6285 TT | NT$59.8 | 2,622,000 | $5,227,827 | 3.4 |
| Taiflex Scientific | 8039 TT | NT$41.5 | 3,452,821 | $4,771,841 | 3.1 |
| GeoVision | 3356 TT | NT$110.0 | 1,018,669 | $3,736,054 | 2.5 |
| MPI | 6223 TT | NT$60.0 | 1,448,000 | $2,896,724 | 1.9 |
| Tatung | 2371 TT | NT$5.9 | 4,770,897 | $943,283 | 0.6 |
| CONSTRUCTION | 17.0 | ||||
| Ruentex Development | 9945 TT | NT$51.0 | 4,315,082 | $7,337,474 | 4.8 |
| Hung Poo Real Estate Development | 2536 TT | NT$24.6 | 4,929,873 | $4,043,507 | 2.7 |
| Goldsun Development & Construction | 2504 TT | NT$10.3 | 11,314,980 | $3,866,918 | 2.5 |
| Acter | 5536 TT | NT$121.0 | 941,179 | $3,797,038 | 2.5 |
| King’s Town Construction | 2524 TT | NT$25.2 | 4,261,680 | $3,580,706 | 2.4 |
| Taiwan Land Development | 2841 TT | NT$11.7 | 8,177,799 | $3,176,506 | 2.1 |
| WHOLESALE AND RETAIL | 14.3 | ||||
| Mercuries & Associates | 2905 TT | NT$25.0 | 9,178,175 | $7,650,392 | 5.0 |
| PC Home Online | 8044 TT | NT$193.0 | 906,588 | $5,833,841 | 3.8 |
| Test-Rite International | 2908 TT | NT$21.4 | 5,894,000 | $4,195,612 | 2.8 |
| Taiwan Tea | 2913 TT | NT$14.9 | 8,231,000 | $4,089,086 | 2.7 |
| TRANSPORTATION | 9.4 | ||||
| First Steamship | 2601 TT | NT$31.6 | 6,714,000 | $7,073,848 | 4.7 |
| Farglory F T Z Investment Holding | 5607 TT | NT$18.1 | 8,373,000 | $5,039,015 | 3.3 |
| Taiwan High Speed Rail | 2633 TT | NT$5.2 | 12,597,600 | $2,188,330 | 1.4 |
| HEALTHCARE | 7.7 | ||||
| YungShin Global Holding | 3705 TT | NT$39.1 | 6,261,000 | $8,151,773 | 5.4 |
| Pacific Hospital Supply | 4126 TT | NT$79.0 | 1,345,456 | $3,543,920 | 2.3 |
| TEXTILES | 6.4 | ||||
| Makalot Industrial | 1477 TT | NT$82.8 | 1,828,000 | $5,046,542 | 3.3 |
| Far Eastern New Century | 1402 TT | NT$33.7 | 4,216,836 | $4,731,067 | 3.1 |
| FINANCE | 4.7 | ||||
| Yuanta Financial Holding | 2885 TT | NT$14.0 | 9,631,900 | $4,496,010 | 2.9 |
| Union Bank of Taiwan | 2838 TT | NT$10.8 | 7,507,000 | $2,703,196 | 1.8 |
| ELECTRIC AND MACHINERY | 4.6 | ||||
| Yungtay Engineering | 1507 TT | NT$49.0 | 3,274,000 | $5,348,871 | 3.5 |
| Good Friend International Holdings | 912398 TT | NT$11.9 | 4,145,000 | $1,644,594 | 1.1 |
| Company | % of | ||||
| Sector | (BGB ticker) | Price | Holding | Value US$ | net assets |
| PLASTICS | 3.6 | ||||
| Yem Chio | 4306 TT | NT$27.8 | 5,979,833 | $5,532,729 | 3.6 |
| CEMENT | 2.3 | ||||
| Wei Mon Industry | 8925 TT | NT$16.1 | 6,433,854 | $3,442,973 | 2.3 |
| OTHER ASSETS AND LIABILITIES, NET | $2,139,452 |
MONTHLY INSIGHT
THE TAIWAN FUND, INC. PREMIUM/DISCOUNT
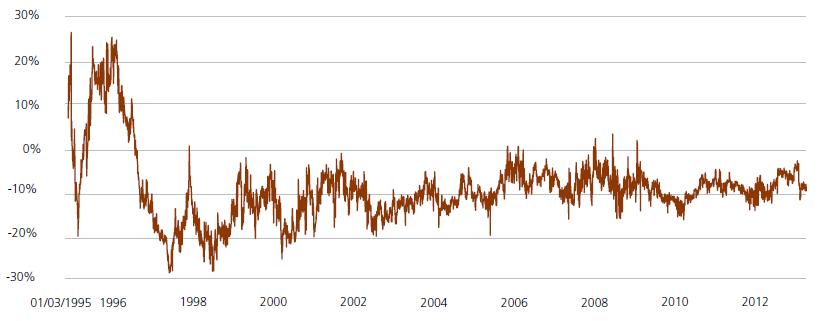
Source: State Street Bank and Trust Company as of July 31, 2012.
INDEX DESCRIPTIONS
TAIEX Index
The TWSE, or TAIEX Index is a capitalization-weighted index of all listed common shares traded on the Taiwan Stock Exchange. The Index was based in 1966 and does not include re-invested dividends.
TAIEX Total Return Index
The TAIEX Total Return Index is a capitalization-weighted index of all listed common shares traded on the Taiwan Stock Exchange, based in 1966, which includes re-invested dividends.
MSCI Taiwan Index
The MSCI Total Return Taiwan Index is a free-float adjusted market capitalization index. The Index represents Taiwanese companies that are available to investors worldwide. The Index has a base date of December 31, 1987. As of July 31, 2012, it contained 114 constituents.
OBJECTIVE
The Fund was launched on December 23, 1986 to allow US and other investors to access and participate in the growth of the economy and the stock market in Taiwan, the Republic of China. The Fund’s investment objective is to seek long-term capital appreciation primarily through investments in equity securities listed in Taiwan. The Fund is a diversified, closed-end management investment company listed on the New York Stock Exchange (NYSE) under the symbol ‘TWN’.
Taiwan, with its global market leadership in high technology goods and its significant investments throughout mainland China and Southeast Asian economies, is now an integral economic player in the Asia Pacific Region as well as around the world. Investing in Taiwan not only allows investors to capitalize on Taiwan’s dynamic economy, but also allows investors to reap the growth and investment potential of the mainland China and other emerging economies of the region.
CONTACTS
The Taiwan Fund, Inc.
c/o State Street Bank and Trust Company
2 Avenue de Lafayette
PO Box 5049
Boston, MA 02111
Tel: (1) 877-864-5056
www.thetaiwanfund.com
IMPORTANT INFORMATION
This document is issued and approved by Martin Currie Inc (‘MC Inc’), as investment adviser of The Taiwan Fund, Inc. (the ‘Fund’). MC Inc is authorised and regulated by the Financial Services Authority (‘FSA’) and incorporated under limited liability in New York, USA. Registered in Scotland (No BR2575), registered address Saltire Court, 20 Castle Terrace, Edinburgh, EH1 2ES. Information herein is believed to be reliable but has not been verified by MC Inc. MC Inc makes no representation or warranty and does not accept any responsibility in relation to such information or for opinion or conclusion which the reader may draw from this newsletter.
The Fund is classified as a diversified investment company under the US Investment Company Act of 1940 as amended. It meets the criteria of a closed ended US fund and its shares are listed on the New York Stock Exchange. MC Inc has been appointed investment adviser to the Fund.
Investors are advised that they will not generally benefit from the rules and regulations of the United Kingdom Financial Services and Markets Act 2000 and the FSA for the protection of investors, nor benefit from the United Kingdom Financial Services Compensation Scheme, nor have access to the Financial Services Ombudsman in the event of a dispute. Investors will also have no rights of cancellation under the FSA’s Conduct of Business Sourcebook of the United Kingdom.
This newsletter does not constitute an offer of shares. MC Inc, its ultimate and intermediate holding companies, subsidiaries, affiliates, clients, directors or staff may, at any time, have a position in the market referred to herein, and may buy or sell securities, currencies, or any other financial instruments in such markets. The information or opinion expressed in this newsletter should not be construed to be a recommendation to buy or sell the securities, commodities, currencies or financial instruments referred to herein.
The information provided in this report should not be considered a recommendation to purchase or sell any particular security. There is no assurance that any securities discussed herein will remain in an account’s portfolio at the time you receive this report or that securities sold have not been repurchased.
It should not be assumed that any of the securities transactions or holdings discussed here were or will prove to be profitable, or that the investment recommendations or decisions we make in the future will be profitable or will equal the investment performance of the securities discussed herein.
Investing in the Fund involves certain considerations in addition to the risks normally associated with making investments in securities. The value of the shares issued by the Fund, and the income from them, may go down as well as up and there can be no assurance that upon sale, or otherwise, investors will receive back the amount originally invested. There can be no assurance that you will receive comparable performance returns, or that investments will reflect the performance of the stock examples contained in this document. Movements in foreign exchange rates may have a separate effect, unfavorable as well as favorable, on the gain or loss otherwise experienced on an investment. Past performance is not a guide to future returns. Accordingly, the Fund is only suitable for investment by investors who are able and willing to withstand the total loss of their investment. In particular, prospective investors should consider the following risks:
 |
It should be noted that investment in the Fund is only suitable for sophisticated investors who are aware of the risk of investing in Taiwan and should be regarded as long term. Funds which invest in one country carry a higher degree of risk than those with portfolios diversified across a number of markets. |
|
Investment in the securities of smaller and unquoted companies can involve greater risk than is customarily associated with investment in larger, more established, companies. In particular, smaller companies often have limited product lines, markets or financial resources and their management may be dependent on a smaller number of key individuals. In addition, the market for stock in smaller companies is often less liquid than that for stock in larger companies, bringing with it potential difficulties in acquiring, valuing and disposing of such stock. Proper information for determining their value, or the risks to which they are exposed, may not be available. |
|
Investments within emerging markets such as Taiwan can be of higher risk. Many emerging markets, and the companies quoted on their stock exchanges, are exposed to the risks of political, social and religious instability, expropriation of assets or nationalization, rapid rates of inflation, high interest rates, currency depreciation and fluctuations and changes in taxation which may affect the Fund’s income and the value of its investments. |
|
The marketability of quoted shares may be limited due to foreign investment restrictions, wide dealing spreads, exchange controls, foreign ownership restrictions, the restricted opening of stock exchanges and a narrow range of investors. Trading volume may be lower than on more developed stockmarkets, and equities are less liquid. Volatility of prices can also be greater than in more developed stockmarkets. The infrastructure for clearing, settlement and registration on the primary and secondary markets may be undeveloped. Under certain circumstances, there may be delays in settling transactions in some of the markets. |


Martin Currie Inc registered in Scotland (no BR2575)
Registered office: Saltire Court, 20 Castle Terrace, Edinburgh EH1 2ES
Tel: 44 (0) 131 229 5252 Fax: 44 (0) 131 228 5959 www.martincurrie.com
North American office: 1350 Avenue of the Americas, Suite 3010, New York, NY
10019, USA Tel: (1) 212 258 1900 Fax: (1) 212 258 1919
Authorised and regulated by the Financial Services Authority and incorporated with
limited liability in New York, USA. Registered with the SEC as an investment adviser.
Please note: calls to the above numbers may be recorded.