Attached files
| file | filename |
|---|---|
| 8-K - 8-K - MARKWEST ENERGY PARTNERS L P | a12-18764_18k.htm |
Exhibit 99.1
|
|
Investor Presentation Citi 2012 MLP/ Midstream Infrastructure Conference |
|
|
Forward-Looking Statements This presentation contains forward-looking statements and information. These forward-looking statements, which in many instances can be identified by words like “could,” “may,” “will,” “should,” “expects,” “plans,” “project,” “anticipates,” “believes,” “planned,” “proposed,” “potential,” and other comparable words, regarding future or contemplated results, performance, transactions, or events, are based on MarkWest Energy Partners, L.P. (“MarkWest” and the “Partnership”) current information, expectations and beliefs, concerning future developments and their potential effects on MarkWest. Although MarkWest believes that the expectations reflected in the forward-looking statements are reasonable, it can give no assurance that such expectations will prove to be correct, and actual results, performance, distributions, events or transactions could vary significantly from those expressed or implied in such statements and are subject to a number of uncertainties and risks. Among the factors that could cause results to differ materially are those risks discussed in the periodic reports MarkWest files with the SEC, including its Annual Report on Form 10-K for the year ended December 31, 2011 and its Quarterly Report on Form 10-Q for the quarters ended March 31, 2012 and June 30, 2012. You are urged to carefully review and consider the cautionary statements and other disclosures, including those under the heading “Risk Factors,” made in those documents. If any of the uncertainties or risks develop into actual events or occurrences, or if underlying assumptions prove incorrect, it could cause actual results to vary significantly from those expressed in the presentation, and MarkWest’s business, financial condition, or results of operations could be materially adversely affected. Key uncertainties and risks that may directly affect MarkWest’s performance, future growth, results of operations, and financial condition, include, but are not limited to: Fluctuations and volatility of natural gas, NGL products, and oil prices; A reduction in natural gas or refinery off-gas production which MarkWest gathers, transports, processes, and/or fractionates; A reduction in the demand for the products MarkWest produces and sells; Financial credit risks / failure of customers to satisfy payment or other obligations under MarkWest’s contracts; Effects of MarkWest’s debt and other financial obligations, access to capital, or its future financial or operational flexibility or liquidity; Construction, procurement, and regulatory risks in our development projects; Hurricanes, fires, and other natural and accidental events impacting MarkWest’s operations, and adequate insurance coverage; Terrorist attacks directed at MarkWest facilities or related facilities; Changes in and impacts of laws and regulations affecting MarkWest operations and risk management strategy; and Failure to integrate recent or future acquisitions. 2 |
|
|
Non-GAAP Measures Distributable Cash Flow, Adjusted EBITDA, and Net Operating Margin are not measures of performance calculated in accordance with GAAP, and should not be considered separately from or as a substitute for net income, income from operations, or cash flow as reflected in our financial statements. The GAAP measure most directly comparable to Distributable Cash Flow and Adjusted EBITDA is net income (loss). The GAAP measure most directly comparable to Net Operating Margin is income (loss) from operations. In general, we define Distributable Cash Flow as net income (loss) adjusted for (i) depreciation, amortization, accretion, and other non-cash expense; (ii) amortization of deferred financing costs; (iii) loss on redemption of debt net of current tax benefit; (iv) non-cash (earnings) loss from unconsolidated affiliates; (v) distributions from (contributions to) unconsolidated affiliates (net of affiliate growth capital expenditures); (vi) non-cash compensation expense; (vii) non-cash derivative activity; (viii) losses (gains) on the disposal of property, plant, and equipment (PP&E) and unconsolidated affiliates; (ix) provision for deferred income taxes; (x) cash adjustments for non-controlling interest in consolidated subsidiaries; (xi) revenue deferral adjustment; (xii) losses (gains) relating to other miscellaneous non-cash amounts affecting net income for the period; and (xiii) maintenance capital expenditures. We define Adjusted EBITDA as net income (loss) adjusted for (i) depreciation, amortization, accretion, and other non-cash expense; (ii) interest expense; (iii) amortization of deferred financing costs; (iv) loss on redemption of debt; (v) losses (gains) on the disposal of PP&E and unconsolidated affiliates; (vi) non-cash derivative activity; (vii) non-cash compensation expense; (viii) provision for income taxes; (ix) adjustments for cash flow from unconsolidated affiliates; (x) adjustment related to non-guarantor, consolidated subsidiaries; and (xi) losses (gains) relating to other miscellaneous non-cash amounts affecting net income for the period. We define Net Operating Margin as revenue, excluding any derivative activity and adjusted for the non-cash impact of revenue deferrals related to certain agreements, less purchased product costs, excluding any derivative activity. Distributable Cash Flow is a financial performance measure used by management as a key component in the determination of cash distributions paid to unitholders. We believe distributable cash flow is an important financial measure for unitholders as an indicator of cash return on investment and to evaluate whether the Partnership is generating sufficient cash flow to support quarterly distributions. In addition, distributable cash flow is commonly used by the investment community because the market value of publicly traded partnerships is based, in part, on distributable cash flow and cash distributions paid to unitholders. Adjusted EBITDA is a financial performance measure used by management, industry analysts, investors, lenders, and rating agencies to assess the financial performance and operating results of the Partnership’s ongoing business operations. Additionally, we believe Adjusted EBITDA provides useful information to investors for trending, analyzing, and benchmarking our operating results from period to period as compared to other companies that may have different financing and capital structures. Net Operating Margin is a financial performance measure used by management and investors to evaluate the underlying baseline operating performance of our contractual arrangements. Management also uses Net Operating Margin to evaluate the Partnership’s financial performance for purposes of planning and forecasting. Please see the Appendix for reconciliations of Distributable Cash Flow, Adjusted EBITDA, and Net Operating Margin to the most directly comparable GAAP measure. 3 |
|
|
Key Investment Considerations High-Quality, Diversified Assets Proven Track Record of Growth and Customer Satisfaction Substantial Growth Opportunities Strong Financial Profile Leading presence in six core natural gas producing regions of the U.S. Key long-term contracts with high-quality producers to develop the Marcellus Shale, Utica Shale, Huron/Berea Shale, Woodford Shale, Haynesville Shale, and Granite Wash formation No incentive distribution rights, which drives a lower cost of capital Distributions have increased by 220% (12% CAGR) since IPO More than $5.0 billion of organic growth and acquisitions since IPO, including the December 2011 Liberty transaction Ranked #1 in EnergyPoint’s 2011 midstream customer satisfaction survey 2012 growth capital forecast of $1.1 billion to $1.5 billion Growth projects are well diversified across the asset base and increase the percentage of fee-based net operating margin Long-term organic growth opportunities focused on resource plays Committed to maintaining strong financial profile Debt to book capitalization of 46% Debt to Adjusted EBITDA of 3.3x Adjusted EBITDA to Interest Expense of 5.6x Established relationships with joint venture partners, which provides capital flexibility 4 |
|
|
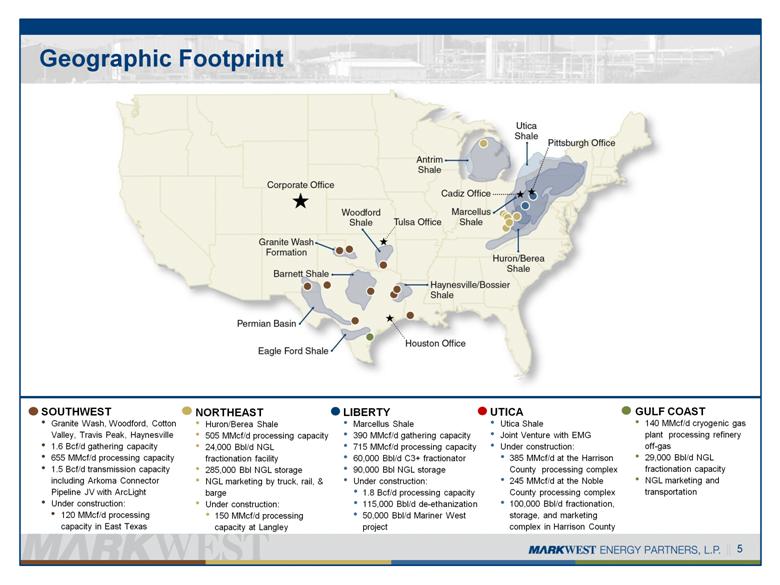
Geographic Footprint UTICA Utica Shale Joint Venture with EMG Under construction: 385 MMcf/d at the Harrison County processing complex 245 MMcf/d at the Noble County processing complex 100,000 Bbl/d fractionation, storage, and marketing complex in Harrison County SOUTHWEST Granite Wash, Woodford, Cotton Valley, Travis Peak, Haynesville 1.6 Bcf/d gathering capacity 655 MMcf/d processing capacity 1.5 Bcf/d transmission capacity including Arkoma Connector Pipeline JV with ArcLight Under construction: 120 MMcf/d processing capacity in East Texas NORTHEAST Huron/Berea Shale 505 MMcf/d processing capacity 24,000 Bbl/d NGL fractionation facility 285,000 Bbl NGL storage NGL marketing by truck, rail, & barge Under construction: 150 MMcf/d processing capacity at Langley LIBERTY Marcellus Shale 390 MMcf/d gathering capacity 715 MMcf/d processing capacity 60,000 Bbl/d C3+ fractionator 90,000 Bbl NGL storage Under construction: 1.8 Bcf/d processing capacity 115,000 Bbl/d de-ethanization 50,000 Bbl/d Mariner West project GULF COAST 140 MMcf/d cryogenic gas plant processing refinery off-gas 29,000 Bbl/d NGL fractionation capacity NGL marketing and transportation 5 |
|
|
Growth Driven by Customer Satisfaction 6 Ranked #1 in Midstream Customer Satisfaction Survey for 2011 Since 2006, we have been ranked #1 or #2 by EnergyPoint Research |
|
|
US Shale Plays are Driving Natural Gas Supply 7 Source: EIA and En*Vantage MarkWest is focused on midstream development in resource plays (Woodford, Granite Wash, Haynesville, Marcellus, Utica) and has benefited tremendously from the advantages of being a first mover. Resource plays will continue to drive midstream investment for decades to come and we will continue to focus our investments in these areas. US Lower 48 Gas Production vs Demand (Trillion Cubic Feet) 0 5 10 15 20 25 30 2000 2002 2004 2006 2008 2010 2012 2014 2016 2018 2020 0 5 10 15 20 25 30 Non-associated onshore Non-associated offshore Associated w/ oil Tight Gas Coal Bed Methane Shale Gas Net Imports Domestic Gas Demand 21% 9% 10% 9% 26% 23% 39% 25% 7% 9% 7% 13% Source EIA AEO 2012 |
|
|
Resource Play Economics 8 Source: Company data and Credit Suisse estimates – commodity pricing as of 7/16/12 |
|
|
9 Commitment to Resource Plays Capital investments and acquisitions in resource plays since 2006... ...are driving strong, long-term volume growth. |
|
|
Contributions to Operating Income by Segment 10 2011 Segment Operating Income 2012 Forecasted Segment Operating Income |
|
|
Southwest Segment Competitive advantages Rated 1st for midstream services in East Texas, Midcontinent and Texas Intrastate by large customers Recently constructed gathering systems provide low-pressure and fuel-efficient service Ready access to markets with interconnects to CEGT, NGPL, TGT, ANR, PEPL, CFS and Enogex Largest gathering system in the Woodford Shale East Texas system overlays the rich Haynesville core The recently expanded Arapaho plant in Western Oklahoma is operating near capacity Under Construction 120 MMcf/d cryogenic processing capacity in E. Texas Areas of Operation Oklahoma, Texas, New Mexico, Louisiana Resource Plays Woodford Shale, Granite Wash, Haynesville Shale, Anadarko Basin, Cotton Valley, Travis Peak, Petitt, Permian Basin Gathering 1.6 Bcf/d capacity Processing 655 MMcf/d capacity Transportation 1.5 Bcf/d transmission capacity, including Arkoma Connector Pipeline JV with ArcLight Capital Partners 2012 Forecasted Segment Operating Income 45% 11 |
|
|
Gulf Coast Segment Competitive advantages Rated 1st in onshore Gulf Coast midstream services by large customers Provide high-quality processing and fractionation services to six major refining complexes Nearly 75% of our inlet volume is under long-term contracts Provide high-purity hydrogen to refiners for production of ultra-low sulfur diesel fuel Our plant reduces overall refinery emissions by converting refinery off-gas to valuable products Area of Operations Corpus Christi, Texas Processing 140 MMcf/d capacity Fractionation 29,000 Bbl/d capacity NGL Marketing & Transportation Ethane, ethylene, propane, propylene, isobutane, normal butane, butylenes, and pentanes Other High-purity hydrogen production Under Construction 4th inlet compressor to increase plant reliability 2012 Segment Forecasted Operating Income 7% 12 |
|
|
Northeast Segment Competitive advantages Rated 1st for midstream services in the Appalachian Basin by all customers We are the largest gas processor and fractionator in the Appalachian Basin We have operated vertically integrated gas processing, fractionation, storage, and marketing in the Northeast for nearly 25 years In Appalachia, approximately 60% of the volume we process and fractionate is under contract for at least 10 years Areas of Operation Kentucky, West Virginia, Michigan Resource Plays Appalachian Basin, Huron/Berea Shale, the Niagaran Reef Processing 505 MMcf/d capacity Fractionation 24,000 Bbl/d capacity NGL Marketing & Storage NGL marketing by truck, rail and barge 285,000 Bbl NGL capacity with access to 1.2 MBbls of propane storage Transportation 250 mile crude oil transmission pipeline Under Construction 150 MMcf/d cryogenic processing capacity at Langley 20% 2012 Forecasted Segment Operating Income 13 |
|
|
Liberty Segment Competitive advantages Rated 1st for midstream services in the Marcellus Shale We are the largest processor of natural gas in the Marcellus Shale with liquids-rich acreage dedications in excess of 400,000 acres Operate fully integrated gathering, processing, fractionation, storage and marketing operations Ready access to markets with interconnects to Columbia Gas, National Fuel, TETCO, and TEPPCO Products Pipeline Acquisition of Keystone Midstream Services, LLC: Supports extension of NGL gathering into Northwest PA Added two new significant customers Areas of Operation Southwest and Northwest Pennsylvania and northern West Virginia Resource Plays Marcellus Shale Gathering 390 MMcf/d capacity Processing 715 MMcf/d cryogenic capacity Fractionation 60,000 Bbl/d C3+ capacity NGL Marketing & Storage NGL Marketing by truck and 200 railcar facility 90,000 Bbl NGL capacity with access to 1.2 MBbls of propane storage Under Construction Processing: 1.8 Bcf/d cryogenic capacity Fractionation: 115,000 Bbl/d de-ethanization capacity NGL Transportation: Extensive NGL gathering system, 50,000 Bbl/d Mariner West purity ethane pipeline 14 2012 Forecasted Segment Operating Income 29% |
|
|
Liberty TEPPCO PRODUCTS PIPELINE SUNOCO PIPELINE EPD ATEX EXPRESS PIPELINE 15 Processing capacity of 2.5 Bcf/d and Fractionation capacity of 234,000 Bbl/d by the end of 2014 Mariner West De-ethanization I Houston I, II, III De-ethanization I, II Majorsville I, II, III, IV, V, VI Sarsen & Bluestone I, II, III Sherwood I, II Mobley I, II Harrison Fractionation & marketing facilities Proposed Shell ethane cracker Houston Processing and Fractionation Complex Houston I - III 355 MMcf/d C3+ Fractionation 60,000 Bbl/d Interconnect to TEPPCO pipeline Rail Loading 200 Rail cars Under Construction De-ethanization (mid-2013) 38,000 Bbl/d Mariner West ethane pipeline (3Q13) 50,000 Bbl/d Majorsville Processing and Fractionation Complex Majorsville I & II 270 MMcf/d NGL Pipeline to Houston 43,400 Bbl/d Under Construction Majorsville III - V (2013) 600 MMcf/d Majorsville VI (2014) 200 MMcf/d De-ethanization (mid-2013) 38,000 Bbl/d De-ethanization (2014) 38,000 Bbl/d Purity Ethane Pipeline to Houston (3Q13) Mobley Processing Complex Under Construction Mobley I (4Q12) 200 MMcf/d Mobley II (1Q13) 120 MMcf/d NGL Pipeline to Majorsville (3Q12) Sherwood Processing Complex Under Construction Sherwood I (3Q12) 200 MMcf/d Sherwood II (4Q13) 200 MMcf/d NGL Pipeline to Mobley (3Q12) Keystone Sarsen 40 MMcf/d Bluestone I 50 MMcf/d Under Construction Bluestone II (4Q13) 120 MMcf/d Bluestone III (TBD) 200 MMcf/d NGL Pipeline into Northwest PA (4Q13) |
|
|
Utica Joint Venture 16 Fractionation capacity of 100,000 Bbl/d and processing capacity of 430 MMcf/d by the end of 2014 Mobley Sherwood Houston Majorsville Noble I Harrison de-ethanization Proposed Shell ethane cracker TEPPCO PRODUCTS PIPELINE EPD ATEX EXPRESS PIPELINE Sarsen & Bluestone INTERCONNECT TO 3RD PARTY PIPELINE Harrison I SUNOCO PIPELINE Joint venture with The Energy & Minerals Group (EMG) to develop significant midstream infrastructure to serve producers’ drilling programs in the liquids-rich Utica shale in eastern Ohio EMG will fund the first $500 million of capital expenditures Recent Developments MarkWest has completed definitive agreements with Gulfport Energy Corporation to provide gathering, processing, fractionation and marketing for liquids-rich Utica production Letter agreement with Rex Energy to discuss similar midstream services Harrison Processing and Fractionation Complex Under Construction Harrison Interim (3Q12) 60 MMcf/d Harrison I (1Q13) 125 MMcf/d Harrison II (TBD) 200 MMcf/d C3+ Fractionation (4Q13) 60,000 Bbl/d Interconnect to TEPPCO pipeline (4Q13) Interconnect to ATEX pipeline (1Q14) De-ethanization (1Q14) 40,000 Bbl/d Truck Loading (mid-2013) 8 Bays Rail Loading (mid-2013) 200 Rail cars Noble Processing Complex Planned Construction Interim Noble Refridgeration (4Q12) 45 MMcf/d Noble I (2013) 200 MMcf/d NGL Pipelines Under Construction NGL Pipeline from Harrison to Majorsville (4Q13) NGL Pipeline from Harrison to Noble (4Q13) |
|
|
Growth in Core Areas 17 The Midstream Leader in Northeast Shales Customers include Range, EQT, Chesapeake, Antero, Statoil, Rex, Sumitomo, and others We are the largest processor in the Marcellus and Huron Shales We are the largest fractionator in Appalachia with nearly 25 years experience in NGL marketing Utica joint venture with EMG to develop integrated midstream services in the Utica Shale Keystone acquisition is a great complement in the heart of the liquids-rich Marcellus Shale Utica Shale Marcellus Shale Huron Shale Keystone |
|
|
18 NGL Markets – Total Production Forecast Source: En*Vantage Forecast of US NGL Extraction from Gas Processing (1,000 BPD) 0 500 1,000 1,500 2,000 2,500 3,000 3,500 2001 2003 2005 2007 2009 2011 2013 2015 2017 2019 0 500 1,000 1,500 2,000 2,500 3,000 3,500 Forecast Total NGLs Propane, Butanes, Natural Gasoline Ethane |
|
|
Innovative Midstream Solutions Ethane demand is projected to increase by more than 40% over the next six years We are constructing four large de-ethanizers at the Houston, Majorsville, and Harrison complexes EPD’s ATEX line will be needed to support the conversions and expansions of existing ethylene plants The Mariner projects will provide additional needed ethane takeaway to support the increased demand for ethane 19 Ethane pipeline projects in Marcellus will maximize producer economics Image Source: BENTEK |
|
|
Emerging Resource Plays Base Production (Conventional / Tight Sand) US Propane Supply Forecast 20 Source: En*Vantage Strictly Private and Confidential Forecast of US Propane Supplies (1000 BPD) 0 200 400 600 800 1000 1200 1400 2011 2012 2013 2014 2015 2016 2017 2018 Refining Propane Gas Processing Propane Imports |
|
|
Northeast Propane Supply and Distribution We have invested significant capital to develop a world-class processing, NGL fractionation, storage, and marketing complex with pipeline, rail, and truck facilities Waterborne and pipeline imports into the Northeast will decrease as local propane production increases Northeast markets can support significant propane sales from the Marcellus and Utica Shales In June, we began exporting Northeast propane from Sunoco’s Marcus Hook facility located outside Philadelphia, Pennsylvania to international markets 21 |
|
|
FINANCIAL OVERVIEW |
|
|
2012 DCF and Capital Guidance Liberty Northeast Southwest Utica * * The first $500 million of capex for the Utica JV will be funded by EMG, after which MarkWest will fund 100% of the capital requirements until it achieves 70% ownership. Gulf Coast 4th Inlet compressor Liquids-rich gas gathering system Majorsville III, IV, V, & VI processing plants Mobley I & II processing plants Sherwood I & II processing plants 115 Bbl/d de-ethanization capacity 50,000 Bbl/d Mariner West ethane project Multiple NGL and ethane pipelines 120 MMcf/d Carthage East cryogenic processing capacity 140 MMcf/d Haynesville gathering lines Compressor / pipeline additions New well connects / trunklines Other expansion 185 MMcf/d processing complex in Harrison County, Ohio 245 MMcf/d processing complex in Noble County, Ohio 100,000 Bbl/d fractionation, storage, and marketing complex in Harrison County, Ohio 150 MMcf/d Langley III processing plant 23 2012 DCF Forecast of $400 million to $440 million 2012 Capital Expenditures Forecast of $1.1 billion to $1.5 billion |
|
|
Source: CapIQ as of August 10, 2012 Cost of Equity Capital 24 0% 2% 4% 6% 8% 10% 12% 14% ETP NKA KMP WPZ CMLP EROC XTEX NS GLP EEP BWP RGP NGLS EPB PNG TLP BPL CPNO DPM PAA APL TCP SEP HEP OKS ACMP MWE SXL GEL WES EPD MMP Cost of Equity Capital Common Unit Yield IDR Load |
|
|
25 Strong Distribution Growth and Unit Performance 220% Distribution Growth since IPO in May 2002 (12% CAGR) Unit price as of 8/16/12 |
|
|
Six months ended June 30, 2012 Net Operating Margin by Contract Type 2012 – 2014 Combined Hedge Percentage Risk Management Program NOTE: Net Operating Margin is calculated as segment revenue less purchased product costs. Fully Hedged 26 Six months ended June 30, 2012 Net Operating Margin Including Hedges |

|
|
Increasing Fee-Based Net Operating Margin 27 Note: Forecast Assumes Crude Oil ($/bbl) range of $95.38 to $91.07 and Natural Gas ($/mmbtu) range of $2.74 to $3.98 By 2014, total net operating margin is forecasted to be greater than 60% fee-based |
|
|
Keys to Success Maintain stronghold in key resource plays with high-quality assets Execute growth projects that are well diversified across the asset base Provide best-in-class midstream services for our producer customers Preserve strong financial profile Deliver superior and sustainable total returns 28 EXECUTE, EXECUTE, EXECUTE!!! |
|
|
APPENDIX |

|
|
Reconciliation of DCF and Distribution Coverage ($ in millions) Year ended December 31, 2011 Six months ended June 30, 2012 Net income $ 106.2 $ 203.4 Depreciation, amortization, impairment, and other non-cash operating expenses 203.9 110.2 Loss on redemption of debt, net of tax benefit 72.1 - Non-cash loss from unconsolidated affiliates 1.1 (.5) (Contributions to) distributions from unconsolidated affiliates (0.3) 1.7 Non-cash derivative activity (0.3) (145.5) Non-cash compensation expense 3.4 5.3 Provision for income tax – deferred (3.9) 28.9 Cash adjustment for non-controlling interest of consolidated subsidiaries (64.5) (2.0) Revenue deferral adjustment 15.4 3.9 Other 14.3 2.8 Maintenance capital expenditures, net of joint venture partner contributions (14.6) (7.9) Distributable cash flow (DCF) $ 332.8 $ 200.3 Total distributions declared for the period $ 240.7 $ 169.7 Distribution coverage ratio (DCF / Total distributions declared) 1.38x 1.18x 30 |
|
|
Reconciliation of Adjusted EBITDA ($ in millions) Year ended December 31, 2011 Six months ended June 30, 2012 Net income (loss) $ 106.3 $ 203.4 Non-cash compensation expense 3.4 5.3 Non-cash derivative activity (0.3) (145.5) Interest expense (1) 109.9 54.4 Depreciation, amortization, impairments, and other non-cash operating expenses 203.9 110.2 Loss on redemption of debt 79.0 - Provision for income tax 13.7 49.0 Adjustment for cash flow from unconsolidated affiliate 1.3 1.2 Adjustment related to non-guarantor, consolidated subsidiaries (2) (63.9) (13.5) Other (1.9) (1.0) Adjusted EBITDA $ 451.4 $ 263.5 Includes derivative activity related to interest expense, amortization of deferred financing costs and discount, and excludes interest expense related to the Steam Methane Reformer. The non-guarantor subsidiaries, in accordance with Credit Facility covenants, are MarkWest Liberty Midstream & Resources, L.L.C. (Liberty), MarkWest Utica EMG L.L.C., MarkWest Pioneer, L.L.C., MarkWest Ohio Fractionation Company, L.L.C., Mule Tracts, L.L.C., MarkWest Mariner Pipeline, L.L.C., Wirth Gathering Partnership, and Bright Star Partnership. As of August 1, 2012, Liberty is a wholly owned subsidiary but remains a non-guarantor in accordance with the Credit Facility. 31 |
|
|
($ in millions) Year ended December 31, 2011 Six months ended June 30, 2012 Income from operations $ 318.2 $ 310.3 Facility expense 173.6 97.4 Derivative activity 75.5 (123.0) Revenue deferral adjustment 15.4 4.0 Selling, general and administrative expenses 81.2 47.1 Depreciation 150.0 84.1 Amortization of intangible assets 43.6 23.3 Loss on disposal of property, plant, and equipment 8.8 2.3 Accretion of asset retirement obligations 1.1 0.4 Net operating margin $ 867.4 $ 445.9 32 Reconciliation of Net Operating Margin |
|
|
1515 ARAPAHOE STREET TOWER 1, SUITE 1600 DENVER, COLORADO 80202 PHONE: 303-925-9200 INVESTOR RELATIONS: 866-858-0482 EMAIL: INVESTORRELATIONS@MARKWEST.COM WEBSITE: WWW.MARKWEST.COM |